


Abstract
We analyze the impact of the introduction of credit default swaps (CDSs) on real decision-making within the firm. Our structural model predicts that CDS introduction increases debt capacity more when uncertainty about the credit events that trigger CDS payment is lower. Using a sample of more than 56,000 firms across 51 countries, we find that CDSs increase leverage more in legal and market environments where uncertainty about CDS obligations is reduced and when property rights are weaker. Our results highlight the importance of legal uncertainty in the interpretation of the underlying trigger events of global credit derivatives.
A growing literature examines the influence of a country’s legal system on financial outcomes. In an early paper, La Porta et al. (2000) suggest that differences in countries’ legal systems and the enforcement of laws can be linked to cross-country variation in the size of capital markets, firms’ access to those markets, and ownership concentration in firms. Klapper and Love (2004) present evidence that firm-level corporate governance matters more in countries that have relatively weak legal environments. Beltratti and Stulz (2012) argue that differences in the law and regulation of the banking sector, as well as differences in corporate governance, can explain a significant proportion of cross-country differences in banks’ performance in the 2007–2008 credit crisis. Christensen, Hail, and Leuz (2016) examine changes in EU market regulation across European countries and find significant differences in the effect of these directives, with liquidity benefits stronger in countries that have stricter implementation and enforcement of rules, as well as higher-quality regulatory procedures. Overall, these papers and other research that followed provide strong evidence that the legal environment is an important determinant of the characteristics of capital markets, whether and how firms access these markets, and the structure and effects of corporate governance inside firms.
In this paper, we contribute to this literature on law and finance by empirically analyzing the impact of the introduction of credit default swaps (CDSs) on a cross-country sample of firms. This setting offers significant advantages when analyzing the effect of the legal environment on the firm. Existing research argues that the introduction of CDSs can significantly affect decisions made by the firm; given the mechanisms described in these papers, this impact crucially depends on the legal and market environment that the firm faces.1 In particular, the extent to which CDS contracts, which are typically governed by English or U.S. law, affect creditor rights depends on the benchmark rights that creditors have in the absence of CDSs. These benchmark rights differ across countries and depend on a country’s existing bankruptcy codes, contract enforcement, and corporate governance mechanisms. In addition, although models suggest that the impact of CDS introduction may differ substantially across countries, existing empirical work has examined these effects primarily in North American firms. In sharp contrast, we examine whether cross-country differences in institutional structures, particularly with regard to the legal codes governing the firm, influence the impact of the introduction of CDS trading on the underlying corporate financial policies. Our results provide insight into the importance of specific aspects of the legal environment for key economic quantities, such as the capital structure of firms. Indeed, the results of existing work suggest that, at the country level, creditor rights and the quality of the legal system are important determinants of the depth of credit markets. For example, Djankov, McLiesh, and Shleifer (2007) report that, in a sample of 129 countries, an increase in a (combined) creditor rights index of one unit is associated with an increase in the ratio of private credit to gross domestic product (GDP) of almost 6|$\%$|. In contrast, a decrease in the quality of the legal system, measured by the number of days that contract enforcement requires, is associated with a significant decrease in the ratio of private credit to GDP.
To motivate our tests, we begin with the Bolton and Oehmke (2011) model of the ‘empty creditor’ problem, where CDSs can substantially change the relation between the firm and its creditors in distress by attenuating or severing the link between cash flow rights and control rights. In the limit, an individual who holds both CDS and the underlying debt may have little or no interest in the (efficient) continuation of the firm (see, e.g., Bartram 2019; Hu and Black 2008a,b; Bolton and Oehmke 2011). We extend this structural framework to allow for uncertainty regarding whether an action taken by a firm triggers a credit event for CDSs held on the firm’s debt. This uncertainty captures differences in the way that local bankruptcy codes interact with the standardized definitions of CDS contract terms established by the International Swaps and Derivatives Association (ISDA). If there is less uncertainty that a particular action will trigger payments related to CDSs, the environment is considered more creditor friendly. For plausible parameter values, we demonstrate that the introduction of CDSs increases debt capacity more in regimes with less uncertainty regarding credit events. The intuition is similar to that of Bolton and Oehmke (2011): well-functioning credit derivative contracts, such as CDSs, can allow firms to overcome limited-commitment problems that arise due to weak institutional heritages. However, these benefits are larger when there is less uncertainty about the enforcement of obligations due under the swap contracts. Overall, the results from our extended model highlight that the real effects of CDSs on reference entities depend on features of the home country’s legal environment.2
We conduct our empirical analysis using a sample of more than 56,000 firms from 51 countries during the period 2001–2015. The use of an international sample provides us with cross-sectional variation in the legal environment, particularly creditor rights, which may influence the effect of the introduction of CDSs. In addition, our international sample also has cross-country variation in other dimensions, such as the degree of contract enforceability and the degree of shareholders’ ownership concentration. Existing theory implies that these features of the legal and market environment can be important determinants of the effects of CDS introduction, and a global sample may allow for better inferences about whether these variables play a significant role in those effects. To our knowledge, this research is the first to empirically analyze the consequences of CDS trading for nonfinancial firms in a global context Therefore, it also provides the first detailed, large-scale, out-of-sample evidence for the effect of CDSs on corporate financial policies beyond prior U.S. studies.3
An analysis of the effects of CDS introduction must, by necessity, consider endogeneity biases, since CDS introduction is not random. These potential biases may be related to characteristics of firms, as well as to key attributes of firms’ home countries. We address these concerns using a relatively new econometric technique that has not previously been used in the finance literature. We first estimate the market’s propensity to introduce CDSs to firms, using an extensive array of firm and country characteristics, and then use the resultant propensity scores as a weighting mechanism for the sample in our analysis. This novel “overlap weighting” approach, developed by Li, Morgan, and Zaslavsky (2018), generates similar distributions of all firm- and country-level covariates across CDS firms and non-CDS firms and allows us to make causal inferences on the effects of CDS introduction on corporate financial and investment policies. Although we use a wide array of covariates, we also conduct a sensitivity analysis to examine whether our results are affected by omitted variable bias.
Our results indicate that after CDS introductions the underlying firms increase leverage in countries that have stronger creditor rights along specific dimensions. The first dimension is the requirement for creditor consent in order to enter reorganization, which can act as a trigger for CDS obligations. This result is consistent with the predictions of our theoretical framework: creditors with CDS protection and control over shareholders’ entry into reorganization have substantially higher bargaining power, allowing the firms to overcome the limited-commitment problem related to the ex ante issuance of debt. Indeed, the private renegotiation setting is also the one in which Bolton and Oehmke (2011, 2631) argue that the “main effect of CDS protection” occurs, since it is in this instance that the swaps improve the lender’s bargaining position.
The second dimension that influences the impact of CDS introduction is the requirement that secured creditors be paid first out of liquidation proceeds. This indicates that leverage increases are greater when liquidation costs are low, particularly when ex post excessive liquidation pressure may come from empty creditors with CDS protection.
We also find that underlying firms increase leverage more in countries with weaker contract enforceability, and if their equity ownership is more concentrated, as shareholders would have greater bargaining power. These results indicate that the introduction of CDSs can act as a substitute for weak property rights, especially in situations in which poor enforceability of property rights is a constraint on the supply of credit in the domestic capital market. This is consistent with the finding of Bae and Goyal (2009) that, along with creditor rights, property rights are an important determinant of the credit available to firms. In addition, newly introduced CDS contracts effectively enhance the debt capacity of underlying reference entities when creditors initially have an inferior bargaining position with respect to majority shareholders (Davydenko and Strebulaev 2007), who would have more bargaining power during private debt renegotiation in the absence of CDSs.
We perform a number of robustness checks on our results. In addition to the sensitivity analysis of omitted variables mentioned above, these tests include the use of additional control variables; a test of the conditional independence of our treatment assignment using alternative ordinary least squares (OLS) estimations; the use of CDS existence rather than CDS introduction as the variable of interest; an analysis of a subsample that excludes U.S. firms (as well as other country filters); an analysis that excludes potential “national champions” from the sample; and longer-horizon effects of CDS introductions. The results from these tests remain qualitatively and quantitatively similar.
Although our primary focus is on financing effects, we also briefly explore the effects of CDS introduction on investment, to better understand whether observed effects on leverage have implications for firms’ assets. These results show that the interaction between CDS contracts and local bankruptcy codes also influences the investment policies of firms. Specifically, in cases with creditor restrictions on firms’ entry into bankruptcy, the presence of CDSs increases the level of capital investment of firms.
1. Review of the Related Literature
While financial derivatives have been around for more than three decades, CDS are a much more recent phenomenon. Given the role of CDSs in the recent financial crisis (Stulz 2010), the existing literature has focused primarily on their role with regard to financial institutions. Similarly, the European sovereign debt crisis has triggered interest in using CDS to study sovereign risk (see, e.g., Acharya, Drechsler, and Schnabl 2014; Lee, Naranjo, and Sirmans 2016). In contrast, while an extensive literature has investigated the use of derivatives on currencies, interest rates, and commodity prices by nonfinancial firms and the underlying frictions that justify their existence (see, e.g., Bartram 2019; Bartram, Brown, and Conrad 2011; Bartram, Brown, and Fehle 2009), much less attention has been paid to the effect of CDSs on these firms.4 Like equity derivatives, CDS are typically not held by the reference entity; that is, nonfinancial firms are generally not CDS users. Rather, some of their claimholders (e.g., bondholders) may use CDS contracts for hedging or speculative purposes. Nevertheless, a developing, relatively recent literature suggests that CDS may still affect various corporate policies of the underlying firms.5
Although CDS are, in theory, redundant derivative assets, existing research indicates that market frictions related to these contracts are nontrivial, and hence that the introduction of CDSs can have significant effects on security prices, economic incentives, and investor and firm behavior. These effects drive a wedge between the payoffs on the underlying asset (the firm’s assets) and the payoff on the derivative instrument (the CDS contract).6 No consensus has been reached in the literature about the net impact of CDSs on the underlying firms. CDSs can clearly provide better hedging opportunities for lenders, but these opportunities may be associated with inefficiencies, such as excessive liquidation, reduced monitoring by lenders, and increased losses to creditors in default. However, by improving creditor rights, CDSs also may be associated with higher leverage, greater levels of investment, and less-frequent strategic default. Importantly, all of these effects are related to the creditor rights, property rights, and market framework in which the underlying entity operates. As noted above, this framework includes bankruptcy codes, contract enforcement, and corporate governance mechanisms.
The existing empirical work provides evidence that U.S. firms with CDSs have higher leverage ratios and longer debt maturity (Saretto and Tookes 2013), though only limited evidence suggests that the greater use of credit derivatives is associated with the greater supply of bank credit (Hirtle 2009). The existence of CDS does not affect the cost of debt on average, but riskier firms experience an increase in spreads, while safer firms, as well as those firms with a priori high strategic default incentives, experience a decline in spreads (see Ashcraft and Santos 2009; Kim 2016).
Evidence on the effect of CDSs on firms’ risk is mixed. Several papers present evidence that the credit risk of firms increases when CDS are introduced. For example, Peristiani and Savino (2011) and Subrahmanyam, Tang, and Wang (2014) report that U.S. firms’ credit ratings tend to decline and bankruptcy risk increases following CDS introduction, and Colonnello, Efing, and Zucchi (2019) show that CDS increase the bankruptcy risk and lower the value of firms with powerful shareholders. Narayanan and Uzmanoglu (2018) show that firm value declines as a result of increased costs of capital and lower credit quality when CDS are initiated. In contrast, Caglio, Darst, and Parolin (2019) employ transaction-level data to build a new aggregate measure of CDS use and find that CDS positions of the largest U.S. banks do not adversely affect borrower credit risk, even for lenders that overinsure against credit losses. Bedendo, Cathcart, El-Jahel (2016) do not find an association between CDS and credit deterioration, and Chakraborty, Chava, and Ganduri (2015) show that CDS firms do not go bankrupt at a higher rate.
A smaller set of papers examine the effect of CDSs on investment. Chakraborty, Chava, and Ganduri (2015) find that firms with CDSs decrease investment after covenant violations. Narayanan and Uzmanoglu (2018) present evidence that investment declines with CDS initiation. Danis and Gamba (2018) develop a model that shows that firms increase leverage and invest more after the introduction of CDSs.
While the evidence to date indicates that CDS contracts have significant effects on the financial decisions of firms, the reference entities in almost all of these papers are headquartered in North America and, as a result, are subject to similar legal environments. The results of our theoretical framework indicate that the effects of CDS introduction on leverage should be larger in countries with creditor-friendly bankruptcy codes, weaker contract enforceability, and higher concentration of shareholder ownership. Consequently, in our empirical tests, we allow the impact of CDS introduction to differ with variation in the governance and legal environments in which the underlying reference entities operate.
2. CDS and the Local Legal Environment
A single-name CDS contract specifies the underlying reference entity; the maturity of the contract; the ongoing payments that are required to be made by the protection buyer to the protection seller; the definition of the credit events that would trigger an obligation due from the protection seller to the protection buyer; the manner in which the payments from seller to buyer will be determined; and the manner in which the contractual securities may be delivered (physically or otherwise) will be set. There are six CDS trigger events: bankruptcy, obligation acceleration, obligation default, failure to pay, repudiation/moratorium, and restructuring. Three of these—bankruptcy, failure to pay, and restructuring—are principal credit events for corporate CDSs. When a trigger event occurs, CDS are settled through credit-default auctions, in which final recovery rates are determined through dealer bids, and the contract counterparties are settled accordingly either in cash or with the physical delivery of the underlying debt obligations.
CDS contracts are typically governed by rules established by the ISDA and make use of a standard set of clauses set out in the ISDA Master Agreement. Despite standard language, in the early days of CDS contracts there were significant disagreements and subsequent litigation over contract terms, including whether credit events had actually occurred, and thus whether obligations had been triggered. Over the last 15 years, the ISDA has instituted changes in its Master Agreement in order to minimize ambiguity, create a more homogeneous CDS product, reduce counterparty risk, and streamline the processes through which settlement payments are determined. The most significant changes were included in the Big Bang Protocol in 2009. This protocol sets up regional Determination Committees (DCs) to consider whether a credit event has occurred, and to manage the auction process through which final CDS payments are settled. It also created common “look-back” provisions for credit events to reduce basis risk for CDS traders. In addition, restructuring was excluded as a credit event for North American reference entities (although this was retained as a potential credit event in the rest of the world).
While these changes have created a more standardized CDS contract, the legal environment in which a reference entity operates is still important. Historically, Chapter 11 proceedings in the United States are the most common CDS credit event trigger in the world, but reference entities that operate outside the United States are subject to bankruptcy provisions that differ in the strength of their creditor protections, including the grants of automatic stays, prohibitions on debt payments, preservation of legal rights, and the length and timing of the resolution process. For CDS contracts, these differences influence decisions regarding whether a credit event has occurred and could also influence the timing of settlement auctions in cases in which a credit event is deemed to have occurred.
For example, ISDA’s EMEA (Europe) DC reached a surprising split decision on whether CDS were triggered upon the bankruptcy filing by Abengoa, a Spanish reference entity. In this case, local Spanish insolvency law and the global ISDA credit event definition provided conflicting interpretations of the nature of the underlying credit event.7 In Appendix A, we provide more details on the Abengoa case, as well as an example of another recent case in which the consideration of specific elements of a country’s bankruptcy code played an important role in the enforcement of CDS.
As these examples demonstrate, there can be significant legal issues to consider in the determination of contingent payoffs associated with CDS contracts. These issues motivate our analysis of the ways in which local bankruptcy provisions affect the enforcement of single-name CDS contracts and, as a result, the payoffs of the firms’ creditors. In our formal model, we take into account this uncertainty about whether actions taken by the firm trigger payments due under the CDS contract.
3. Data
Our sample consists of all firms that have market data available on Datastream and accounting data available on WorldScope. We exclude financial firms, specifically, banks, insurance companies, real estate and other investment trusts, etc. with SIC codes 60–69. We also exclude all firm-year observations that have zero or negative values for total assets. Further, we exclude nonprimary issues, U.S. OTC Bulletin Board and “Pink Sheet” stocks, and firms that have missing country or firm identifiers. Our final sample consists of an unbalanced panel of more than 56,000 firms across 51 countries over the period 2001–2015. For these firms, we obtain monthly stock returns in U.S. dollars (USD), and market capitalization (in both USD and local currency) for individual stocks, as well as returns on the value-weighted local and global Datastream stock market indexes. Accounting variables are in millions of units of local currency and include determinants of CDS availability as well as general firm characteristics (such as total assets, sales, profitability, leverage, and cash and short-term investments). All firm-level variables are winsorized at the top and bottom five percentiles, with logical limits applied to mitigate the effect of data errors.
Industry fixed effects are based on the Fama-French 48-industry classification. Various legal, institutional, and financial market characteristics across countries are obtained from the data available from other existing studies (La Porta et al. 1998; Djankov, McLiesh, and Shleifer 2007; Djankov, Hart, et al. 2008; and others), as well as from several major cross-country databases, including those of the World Bank and the Bank for International Settlements (BIS), and from PRS Group’s International Country Risk Guide (ICRG). Finally, all CDS data are obtained from Markit.
Firms are identified as reference entities if they have CDS of any maturity during the observation year. Because our CDS data start in 2001, we can only identify CDS introductions beginning in 2002. When we refer to CDS firms and non-CDS firms, this pertains specifically to firm-year observations with and without CDS introductions, respectively. Thus, prior to CDS introduction, firm-year observations of eventual CDS firms are treated as non-CDS firms. To focus our identification on the introduction of CDSs, we do not include in our main results any firm-year observations of CDS firms after the introduction of CDSs. Table D.1 in Appendix D provides variable definitions, and panel A of Table E.1 in Appendix E provides summary statistics for all the variables used in this paper.
4. Insights and Empirical Predictions from a Structural CDS Model
4.1 Setup
We consider a setting that is an extension of a model proposed by Bolton and Oehmke (2011).8 In this setting, we develop key insights and testable implications for our international sample. Suppose a firm raises an amount, |$B$|, of debt today (time 0) by promising a fixed payment, |$F$|, at time 1. At time 1, the firm generates a cash flow, |$C_{1}$|, which may be either |$C_1^H$| with probability |$\theta $| or |$C_1^L$| with probability |$(1 - \theta )$|, where |$C_1^L < C_1^H $| (|$H=$| “high,” |$L=$| “low”). |$C_1^L $| is normalized to zero without loss of generality. Soon after time 1, the firm’s continuation value, |$C_{2}$| (either |$C_2^H $| with probability |$\phi$| or |$C_2^L$| with probability (|$1 - \phi$|), where |$C_2^L < C_2^H )$|, is known with certainty to the firm’s shareholders. However, there is limited verifiability of the cash flow to creditors; that is, they can verify only |$C_1^L $|, but not the magnitude of |$C_1^H$|, at time 1. The continuation value of the firm, |$C_{2}$|, also cannot be verified by the firm’s creditors without incurring costs. If verification costs are paid by shareholders, the exact state of the world at time 2 is observable for both the firm’s insiders (i.e., its shareholders) and its outside claimants (i.e., creditors). We set the risk-free discount rate to zero to keep the notation simple, without loss of generality.
At time 1, if the firm fails to pay |$F$|, the firm and its creditors start private debt renegotiation. During this out-of-court debt negotiation, either creditors can liquidate the firm (e.g., via outright liquidation as in Chapter 7 of the U.S. bankruptcy law), yielding the liquidation value |$S$|, or they can get a renegotiation surplus of |$q\lambda C_{2}$|. In this surplus, the term |$\lambda C_{2}$| takes into account that only a fraction of the continuation value is available, due to the costs of private renegotiation; |$\lambda <1$|. |$\lambda C_{2}$| is therefore the maximum renegotiation surplus that accrues to both the firm and the creditors, taken together; |$q$| denotes the creditors’ bargaining power relative to that of the firm (i.e., its shareholders), which reduces the value available to the latter. Based on the insight provided by Hart and Moore (1994), liquidation is typically costlier than renegotiation (|$S < \lambda C_2^L )$| due to the destruction of the firm’s going-concern value in the event of liquidation, and hence shareholders and creditors are motivated to avoid it.
When creditors owning CDS protection reject a renegotiation offer from the firm’s shareholders, they submit a request to the DC to verify whether a credit event was, in fact, triggered.9 As discussed in Appendix A, there is significant variation in legal risk across country jurisdictions due to differences in legal frameworks and to the resultant conflicting interpretations of the definition of the underlying credit event (see also Simmons & Simmons LLP 2016). Based on this variation, we assume that there is a probability |$\varepsilon $| that a credit event is not triggered. As a specific example of this, consider a case in which the firm could credibly claim that an in-court restructuring filing is voluntary, rather than related to a credit event; this possibility would reduce the bargaining power of creditors.10
Under these circumstances, creditors with CDS credit protection with a notional value of |$N$| maximize their expected payoff during the private debt renegotiation with the firm. Their payoff is |${\it max}[q\lambda C_2^H, \gamma N]$| if |$i=H$| at time 2, where |$\gamma N = (1 - \varepsilon )N + \varepsilon M$| with |$M < N$|; and |${\it max}[q\lambda C_2^L,N]$| if |$i=L$|. In each state, the first term in the square brackets denotes the payoff to CDS creditors if they agree with the firm on debt restructuring, whereas the second term in the square brackets denotes their payoff if they reject the offer from the shareholders and take their case to the DC (or, prior to the Big Bang, the local legal authority). The new parameter |$\gamma $| captures the legal uncertainty experienced by creditors about their payoff. Note that it reduces their payoff only in the |$H$| state at time 2, in which the continuation value of the firm turns out to be high (i.e., sufficient to pay off creditors), and there is some probability |$\varepsilon $| that creditors cannot trigger CDS payments. Consequently, they receive a smaller payout, |$M$| than the contracted notional of the CDS, |$N$|.11 In contrast, when the realization at time 2 is in the |$L$| state, there is no such ambiguity regarding the nature of the trigger event, and the payoff is |$N$|12
4.2 Parameters
The key parameters in the above setting, and in the hypothesis, are |$\lambda, q, \gamma $|, and |$S$|. We provide below a description of the economic intuition behind these parameters and the variables in our data set that best capture these effects. We then derive comparative statics for the sensitivity of the change in debt capacity (due to the introduction of a CDS contract) to changes in these parameters. The parameters are as follows:
Cash flow verifiability (|$\lambda $|)
Debt renegotiation is costly when property rights are poorly enforced (see, e.g., Bae and Goyal 2009; Djankov, Hart, et al. 2008). Poor contract enforcement lowers the recovery rate and also increases the time spent in repossessing collateral during the restructuring process. These costs are captured by 1-|$\lambda $|, which is proportionately deducted from the continuation value, |$C_{2}$|. As a consequence, |$\lambda $|, or contract enforceability, should be related to the strength of property rights in the firm’s local environment. As a proxy for this parameter, we follow the literature (Bae and Goyal 2009) and use the property rights variables Law & Order, Corruption, and Political Risk from the ICRG database.
Creditors’ bargaining power during private debt renegotiation (|$q$|)
The bargaining power of creditors during the private renegotiation process—which is negatively correlated with the fraction of equity owned by a firm’s principal shareholders, such as the CEO and institutional investors (see, e.g., Davydenko and Strebulaev 2007; Dahlquist et al. 2003)—determines the share of the continuation value, |$C_{2}$|, available to creditors, with the balance going to shareholders. We use Closely Held Shares, the fraction of equity ownership held by controlling shareholders, obtained from Worldscope, as our proxy for concentration of shareholder ownership.
Trigger event uncertainty (|$\gamma $|)
A creditor-friendly local bankruptcy code implies less uncertainty in the recognition of the CDS trigger event, and therefore, a greater expected CDS payout (i.e., a higher |$\gamma $|). For instance, when the local bankruptcy codes allow creditors to limit a firm’s ability to file for an in-court restructuring that it claims is voluntary, creditors clearly have stronger bargaining power and, in particular, the uncertainty related to triggering events in CDS contracts is reduced. This aspect of creditor rights is captured by one of the components of the creditor rights index first introduced into the finance literature by La Porta et al. (1998) (LLSV). Specifically, we source the LLSV variable “Restrictions on the shareholders to enter reorganization without creditors’ consent” from Djankov et al. (2007) and assume that when creditors can restrict entry into reorganization, legal uncertainty is reduced.
Liquidation value (|$S$|)
The higher the liquidation value of the firm, or (equivalently) the lower the liquidation cost, the lower are the costs associated with the empty creditor problem. We use Secured Creditors First from Djankov et al. (2007), another subindex of the overall creditor rights index of LLSV (1998), as a proxy for liquidation values. This creditor right establishes the priority of claimants (specifically, creditors) in payments resulting from liquidation of the firm. This is also consistent with the evidence in Djankov et al. (2008), which indicates that deviations from absolute priority rules are associated with substantially lower recovery rates.
4.3 Debt pricing
Our framework, which is based on the model of Bolton and Oehmke (2011), is essentially an extended binomial model that includes ex post trigger event uncertainty regarding the bankruptcy court’s actions. In our model, along the path where the first-period cash flow is |$C_1^H $| and the continuation value turns out to be |$C_2^L $| (the up-down path), there is by construction the possibility of strategic default by shareholders in the first period. Specifically, shareholders can minimize the payment to creditors at time 1, |${\it min}\left[ {F,(1 - \lambda )C_2^L + q\lambda C_2^L} \right]$|, by threatening liquidation without truthfully revealing the actual cash flow at time 1. The first term in the square brackets denotes the cost to shareholders if the firm truthfully reveals its time 1 cash flow (|$C_1^H $|) and pays |$F$|. The second term indicates the consequences of strategic default; in that case, the shareholders’ outlay is the sum of the verification cost of continuation value during private debt renegotiation (|$(1 - \lambda )C_2^L $|) and the portion of the renegotiation surplus that shareholders give up to the benefit of creditors (|$q\lambda C_2^L $|). (Note that this formulation assumes that the verification costs are paid entirely out of the firm’s resources.) If honoring the original contract is not costly (|$F \le (1 - \lambda )C_2^L + q\lambda C_2^L $|), the firm does not attempt strategic default; otherwise, it does.
Proposition 1 presents the comparative statics of the model. Note that the first relation is novel to our framework, while the remaining three are related to parameters in Bolton and Oehmke (2011) and hence are implied by that model.
The introduction of CDS contracts on a firm’s debt increases its debt capacity
(a) the less the trigger event uncertainty in the bankruptcy codes of the country in which the firm operates |$\left({\frac{\partial \Delta B}{\partial \gamma } \ge 0} \right)$|,
(b) the higher the liquidation value of the firm’s assets |$\left({\frac{\partial \Delta B}{\partial S } > 0} \right)$|,
(c) the weaker the contract enforceability in the jurisdiction in which the debt is issued |$\left( {\frac{\partial \Delta B}{\partial \lambda} < 0} \right)$|, and
(d) the more closely held the shares in the firm |$\left( {\frac{\partial \Delta B}{\partial q} < 0} \right)$|.
See Appendix C. ■
When the enforcement of debt contracts faces significant limited-commitment problems due to a weak institutional environment (low |$\lambda $|, low |$q$|), well-functioning credit derivatives contracts, such as CDSs, can help firms overcome such institutional barriers. However, when the contingent payoff of the derivatives is affected by local legal regimes (low |$\gamma $|), the effects of the CDS contract may be significantly limited. Moreover, when creditors overinsure their debt positions through CDS contracts, liquidation becomes more likely than successful private renegotiation. Under such circumstances, a higher liquidation value helps reduce the cost of debt capital that the firm must raise for its positive net present value investments.
4.4 Empirical predictions
Based on the insights from the extended Bolton and Oehmke (2011) model presented above, we derive the following formal hypothesis:16
The introduction of CDSs will increase debt capacity more for firms in countries with less legal uncertainty around triggering events; low liquidation cost; weak contract enforceability; and more concentrated shareholder ownership.
5. Methodology
The decision of whether to introduce CDSs to an individual firm headquartered in a particular country is endogenous and may be affected by characteristics of both the firm and the country. For instance, it may well be that CDS contracts are introduced on levered firms that are already distressed and are likely to face a higher probability of default. In addition, the introduction of such contracts may be affected by the stage of development of equity, debt, and derivatives markets; property rights; or bankruptcy codes in that country. If such endogeneity is not taken into account, estimates of the effect of CDS introduction could be biased, since the firms that have CDS introduced on them (i.e., the treated firms) or the countries in which CDS are introduced may differ on relevant dimensions from firms or countries that do not have CDS introductions. That is, measured differences in the outcomes of CDS introduction may be due to differences in firms’ or countries’ characteristics, or covariates, rather than to the introduction of the CDS themselves.
Other studies have addressed this concern through the use of firm-specific instruments for CDS introduction. However, in an international sample, the standard instrumental variable regression approaches widely used in U.S. samples in the literature are unlikely to satisfy the exclusion restriction due to additional confounding factors at the country level. For example, instruments, such as banks’ use of foreign exchange derivatives, used in Saretto and Tookes (2013) may be correlated with the emergence of CDS markets in different countries and may therefore be related to features of the countries’ debt markets. Similarly, lenders’ capital ratios and portfolio concentration measures, which also have been used in the literature (see, e.g., Saretto and Tookes 2013; Subrahmanyam, Tang, and Wang 2014; Shan, Tang, and Yan 2016) can be confounded with banking regulations that may also affect the availability of CDSs to borrowers from the same country as the lenders. However, imposing restrictions on these lenders and borrowers by requiring that they reside in different countries results in a very significant (|$>$| 90|$\%$|) reduction in sample size and a loss of power in our statistical tests. Such restrictions also introduce the possibility of selection biases associated with factors related to firms’ foreign financing opportunities.17 In addition to selection bias, imposing additional data availability restrictions will necessarily reduce variability in the legal, financial, and political environments that we consider, and as a consequence may reduce the precision of our estimates.
We take endogeneity into account through our choice of empirical method. This method, propensity weighting, is relatively new and, to our knowledge, has not been used previously in the finance literature. This weighting was developed by Li, Morgan, and Zaslavsky (2018), who term these weights “overlap weights,” since the method creates a sample with the most overlap in covariates between the treated and nontreated groups. The intuition behind the method is fairly straightforward. We begin by estimating the probability that individual firms will experience a CDS introduction. This step is similar to the method used for propensity-score matching. However, matching may reduce sample size, particularly in settings with multiple sets of characteristics to take into account (e.g., firm and country characteristics). Propensity weighting, in contrast, uses every observation in the sample with a positive probability of being included in both the treated and control groups.
Instead of matching, we use the estimated propensities to reweight observations in the sample in order to reduce differences in the characteristics of treated and nontreated firms. In effect, this method creates a synthetic sample for which the distribution of pretreatment variables, or covariates, is balanced across treated and nontreated firms. In this synthetic sample, there is no correlation between the treatment and the observed covariates. In addition, the size of the synthetic sample is typically much larger than that in the matching analysis, which is a particular advantage in our case as the number of firms that have CDS introduced on them is small in comparison to the total number of firms in the sample.
Specifically, consider a sample of |$n$| firms. Each firm can belong to one of two groups, where |$Z_{it}$| is the (binary) variable that indicates group membership in year |$t$|; in our case, |$Z_{it} = 1$| represents the treatment, or the case in which a CDS is introduced on the firm. For each firm, we observe an outcome |$Y_{it}$| and a |$k$|-dimensional set of covariates |$X_{ikt}$| in each year |$t$|. The propensity score is the probability that we observe a CDS introduction, given the covariates: |$p_{it}(x_{t}) =$| Pr (|$Z_{it} = 1| X_{ikt}=x_{t})$|.
Note that this method weights each individual firm (treated or nontreated) by the probability that it will be assigned to the opposing group (nontreated or treated, respectively). Consider an individual firm that has a high estimated propensity for treatment and does, in fact, receive the treatment; this type of firm is relatively common, as it has covariate values that are comparable to those of other treated firms. Such a firm will be down-weighted to account for the commonness of its observation. In contrast, a treated firm with a low predicted probability of being treated will receive a higher weight. As a result, individual firms with a low (high) predicted probability of treatment that actually receive the treatment will be up- (down-)weighted; the up-weighting allows the low-propensity treated firm to represent a larger group of similar firms that did not receive the treatment. Similarly, for nontreated firms, those with a high (low) probability of treatment will be up- (down-)weighted. This weighting of observations yields a synthetic sample of treated and nontreated firms with balanced covariates by construction.18
The method proposed by Li, Morgan, and Zaslavsky (2018) is related to inverse probability weighting, as described by Hirano and Imbens (2001). As the name suggests, inverse probability weighting uses the reciprocal of the estimated propensity for treatment to weight observations in the sample. However, inverse probability weighting has the drawback that when estimated probabilities are very small, weights can become extremely large and the resultant estimates become unstable. Rescaling of weights or arbitrary truncation/winsorization of extreme weights is typically used to address this problem. In contrast, the overlap weights proposed by Li, Morgan, and Zaslavsky (2018), which we use in this paper, are bounded between 0 and 1, do not require truncation, result in exact balance of the covariates, and, for plausible distributions of propensity weights, are associated with smaller standard errors in the estimates of treatment effects. Intuitively, the overlap weighting method results in a synthetic sample that can be interpreted as the set of firms that have a substantial probability both of having CDS introduced and of not having CDS contracts available. We estimate the effects of CDS introduction on this propensity-weighted sample.
In Section 6.5, we analyze the robustness of our results along a number of additional dimensions. These tests include a simulation-based analysis of the sensitivity of our main results to potential omitted variable biases (Ichino, Mealli, and Nannicini 2008), and the use of additional controls in the propensity-weighting method. We also confirm the key conditional independence of our treatment assignment using alternative OLS estimations. In addition, we reestimate the effects of CDSs using CDS existence as the variable of interest, rather than CDS introduction; we also examine the robustness of the results when we exclude the set of firms that may be considered “national champions,” since these firms may be perceived as having meaningfully different probabilities of default.19 Finally, we examine the sensitivity of our inferences to the exclusion of U.S. firms from the sample and analyze the longer-horizon effects of CDS introduction.
6. Results
6.1 CDS availability and introductions
Table 1 reports the summary statistics of the sample by country and by industry. In panel A, we report the number of firms with available CDS by country and by year. Each year, on average, 1,225 firms have available CDSs. CDS availability is more common in developed countries: CDS on firms in the United States and Japan make up more than 62|$\%$| of the sample. Other developed countries, such as the United Kingdom, France, Germany, and Canada, also have a relatively high proportion of CDS firms. Note, however, that developed countries differ significantly with regards to the country characteristics we consider. For example, the G7 countries span the entire spectrum of creditor rights, as defined in Djankov et al. (2007), from France (with the minimum creditor rights score of 0), to Japan (with a creditor rights score of 2) and the United Kingdom (with the maximum creditor rights score of 4). In addition to this variation in country characteristics among large, developed countries, in recent years the number of firms with available CDS has increased in smaller and/or less developed countries, such as India, Hong Kong, Taiwan, and Singapore.20 The number of CDS introductions by country and year are reported in panel B. CDS introductions were relatively numerous prior to the financial crisis, with the number of introductions declining sharply after 2007. Importantly, note that the majority of CDS firms and introductions in our sample are in countries other than the United States, which has been the focus of prior CDS studies.
International CDS introductions and availability
| A. CDS availability by country and year | |||||||||||||||||
|---|---|---|---|---|---|---|---|---|---|---|---|---|---|---|---|---|---|
| 2001 | 2002 | 2003 | 2004 | 2005 | 2006 | 2007 | 2008 | 2009 | 2010 | 2011 | 2012 | 2013 | 2014 | 2015 | Average | Creditor Rights | |
| Hong Kong | 4 | 5 | 7 | 10 | 14 | 21 | 30 | 37 | 38 | 37 | 39 | 44 | 45 | 45 | 7 | 26 | 4 |
| New Zealand | 1 | 1 | 1 | 1 | 2 | 2 | 2 | 2 | 2 | 2 | 2 | 3 | 3 | 3 | 3 | 2 | 4 |
| United Kingdom | 31 | 48 | 62 | 65 | 66 | 69 | 64 | 59 | 58 | 58 | 60 | 60 | 55 | 58 | 32 | 56 | 4 |
| Australia | 9 | 17 | 20 | 23 | 23 | 23 | 22 | 22 | 22 | 22 | 22 | 22 | 23 | 23 | 17 | 21 | 3 |
| Austria | 1 | 1 | 2 | 4 | 5 | 5 | 5 | 5 | 6 | 6 | 6 | 6 | 2 | 4 | 3 | ||
| Czech Republic | 1 | 1 | 1 | 2 | 2 | 2 | 1 | 1 | 1 | 1 | 1 | 1 | 1 | 1 | 3 | ||
| Denmark | 1 | 1 | 1 | 3 | 3 | 3 | 3 | 3 | 3 | 3 | 4 | 4 | 4 | 4 | 3 | 3 | |
| Germany | 17 | 20 | 29 | 36 | 37 | 40 | 41 | 43 | 45 | 45 | 44 | 44 | 45 | 45 | 10 | 36 | 3 |
| Israel | 1 | 1 | 1 | 1 | 1 | 1 | 1 | 1 | 1 | 2 | 3 | 3 | 3 | 2 | 3 | ||
| Korea, Republic Of | 4 | 9 | 10 | 11 | 16 | 17 | 18 | 20 | 21 | 23 | 25 | 27 | 27 | 27 | 18 | 3 | |
| Malaysia | 2 | 2 | 2 | 3 | 6 | 6 | 6 | 7 | 7 | 7 | 7 | 7 | 7 | 7 | 4 | 5 | 3 |
| Netherlands | 8 | 9 | 13 | 15 | 15 | 16 | 12 | 12 | 12 | 12 | 12 | 12 | 12 | 13 | 1 | 12 | 3 |
| Saudi Arabia | 1 | 1 | 2 | 2 | 2 | 2 | 2 | 2 | 1 | 2 | 3 | ||||||
| Singapore | 1 | 2 | 3 | 3 | 5 | 5 | 7 | 7 | 7 | 7 | 9 | 10 | 10 | 10 | 1 | 6 | 3 |
| South Africa | 1 | 2 | 2 | 2 | 4 | 5 | 5 | 6 | 6 | 6 | 6 | 4 | 4 | 3 | |||
| Belgium | 1 | 1 | 4 | 4 | 4 | 3 | 4 | 4 | 4 | 4 | 4 | 4 | 5 | 4 | 2 | ||
| Chile | 1 | 2 | 3 | 3 | 5 | 5 | 7 | 7 | 7 | 7 | 7 | 7 | 5 | 2 | |||
| Egypt | 1 | 1 | 1 | 1 | 1 | 1 | 1 | 1 | 1 | 2 | |||||||
| India | 1 | 1 | 1 | 6 | 15 | 32 | 49 | 50 | 52 | 53 | 52 | 51 | 52 | 43 | 33 | 2 | |
| Indonesia | 2 | 5 | 5 | 5 | 7 | 7 | 8 | 9 | 9 | 9 | 7 | 2 | |||||
| Italy | 7 | 9 | 10 | 14 | 15 | 17 | 18 | 19 | 20 | 20 | 18 | 19 | 22 | 23 | 17 | 2 | |
| Japan | 27 | 61 | 121 | 202 | 247 | 267 | 285 | 289 | 288 | 286 | 282 | 278 | 280 | 276 | 255 | 230 | 2 |
| Kazakhstan | 1 | 1 | 1 | 1 | 1 | 1 | 1 | 1 | 1 | 2 | |||||||
| Norway | 2 | 2 | 2 | 3 | 5 | 5 | 5 | 7 | 7 | 6 | 6 | 6 | 6 | 6 | 5 | 2 | |
| Romania | 1 | 1 | 1 | 1 | 1 | 1 | 1 | 1 | 1 | 1 | 2 | ||||||
| Russian Federation | 2 | 3 | 5 | 5 | 5 | 5 | 5 | 5 | 4 | 4 | 4 | 2 | |||||
| Spain | 5 | 7 | 8 | 11 | 11 | 11 | 13 | 13 | 12 | 10 | 10 | 12 | 12 | 12 | 11 | 2 | |
| Sri Lanka | 1 | 1 | 1 | 1 | 1 | 1 | 1 | 1 | 2 | ||||||||
| Taiwan | 6 | 16 | 20 | 24 | 26 | 27 | 27 | 26 | 26 | 28 | 27 | 27 | 23 | 2 | |||
| Thailand | 2 | 2 | 2 | 6 | 7 | 10 | 9 | 9 | 10 | 8 | 8 | 8 | 8 | 7 | 2 | ||
| Turkey | 2 | 2 | 2 | 2 | 2 | 1 | 1 | 1 | 1 | 2 | 2 | ||||||
| Argentina | 1 | 1 | 1 | 1 | 2 | 3 | 3 | 3 | 3 | 2 | 1 | ||||||
| Brazil | 2 | 6 | 7 | 9 | 12 | 16 | 16 | 14 | 14 | 13 | 12 | 11 | 1 | ||||
| Canada | 9 | 18 | 25 | 37 | 42 | 42 | 39 | 39 | 37 | 37 | 34 | 34 | 32 | 34 | 3 | 31 | 1 |
| Finland | 5 | 7 | 6 | 7 | 7 | 7 | 7 | 8 | 8 | 8 | 8 | 8 | 7 | 7 | 7 | 1 | |
| Greece | 1 | 2 | 2 | 2 | 2 | 3 | 3 | 3 | 3 | 2 | 2 | 2 | 2 | 2 | 2 | 1 | |
| Hungary | 1 | 1 | 1 | 1 | 1 | 1 | 1 | 1 | 1 | 1 | |||||||
| Ireland | 1 | 1 | 1 | 2 | 1 | 1 | 1 | 1 | 1 | ||||||||
| Philippines | 1 | 2 | 3 | 5 | 6 | 6 | 6 | 6 | 6 | 7 | 7 | 7 | 1 | 5 | 1 | ||
| Poland | 1 | 1 | 1 | 1 | 1 | 1 | 1 | 1 | 1 | 1 | 1 | 1 | 1 | 1 | 1 | 1 | |
| Portugal | 2 | 3 | 3 | 4 | 4 | 4 | 4 | 4 | 4 | 4 | 4 | 4 | 4 | 5 | 4 | 1 | |
| Sweden | 7 | 10 | 10 | 12 | 12 | 14 | 14 | 14 | 14 | 14 | 13 | 13 | 12 | 13 | 1 | 12 | 1 |
| Switzerland | 4 | 7 | 7 | 9 | 11 | 11 | 12 | 14 | 13 | 13 | 12 | 13 | 13 | 13 | 11 | 1 | |
| United States | 251 | 347 | 447 | 566 | 615 | 641 | 670 | 661 | 655 | 634 | 626 | 623 | 609 | 599 | 130 | 538 | 1 |
| Colombia | 1 | 1 | 1 | 1 | 1 | 1 | 0 | ||||||||||
| France | 28 | 36 | 42 | 44 | 45 | 45 | 44 | 45 | 43 | 42 | 43 | 45 | 47 | 48 | 4 | 40 | 0 |
| Mexico | 1 | 1 | 3 | 4 | 7 | 9 | 10 | 10 | 12 | 11 | 11 | 11 | 8 | 0 | |||
| Bahrain | 1 | 1 | 1 | 1 | 1 | 1 | |||||||||||
| Luxembourg | 2 | 1 | 2 | ||||||||||||||
| Qatar | 1 | 1 | 1 | 1 | 1 | 1 | 1 | 1 | |||||||||
| United Arab Emirates | 1 | 1 | 1 | 1 | 1 | 1 | 1 | 1 | 1 | 1 | |||||||
| Total | 427 | 631 | 849 | 1,117 | 1,271 | 1,365 | 1,449 | 1,483 | 1,485 | 1,462 | 1,455 | 1,467 | 1,450 | 1,445 | 519 | 1,225 | |
| B. CDS introductions by country and year | ||||||||||||||||
|---|---|---|---|---|---|---|---|---|---|---|---|---|---|---|---|---|
| 2002 | 2003 | 2004 | 2005 | 2006 | 2007 | 2008 | 2009 | 2010 | 2011 | 2012 | 2013 | 2014 | 2015 | Total | CreditorRights | |
| Hong Kong | 1 | 2 | 3 | 4 | 7 | 9 | 7 | 1 | 2 | 5 | 1 | 42 | 4 | |||
| New Zealand | 1 | 1 | 2 | 4 | ||||||||||||
| United Kingdom | 18 | 14 | 5 | 2 | 7 | 4 | 4 | 1 | 2 | 2 | 2 | 61 | 4 | |||
| Australia | 8 | 3 | 3 | 2 | 3 | 1 | 1 | 21 | 3 | |||||||
| Austria | 1 | 1 | 2 | 1 | 1 | 6 | 3 | |||||||||
| Czech Republic | 1 | 1 | 2 | 3 | ||||||||||||
| Denmark | 2 | 1 | 3 | 3 | ||||||||||||
| Germany | 4 | 9 | 7 | 3 | 3 | 2 | 2 | 2 | 2 | 34 | 3 | |||||
| Israel | 1 | 1 | 1 | 3 | 3 | |||||||||||
| Korea, Republic Of | 5 | 1 | 1 | 5 | 1 | 1 | 2 | 1 | 2 | 2 | 2 | 23 | 3 | |||
| Malaysia | 1 | 3 | 1 | 5 | 3 | |||||||||||
| Netherlands | 2 | 3 | 2 | 1 | 1 | 1 | 10 | 3 | ||||||||
| Saudi Arabia | 1 | 1 | 2 | 3 | ||||||||||||
| Singapore | 1 | 1 | 2 | 2 | 1 | 2 | 1 | 10 | 3 | |||||||
| South Africa | 1 | 1 | 2 | 1 | 1 | 6 | 3 | |||||||||
| Belgium | 1 | 3 | 1 | 1 | 6 | 2 | ||||||||||
| Chile | 1 | 1 | 1 | 1 | 1 | 2 | 7 | 2 | ||||||||
| Egypt | 1 | 1 | 2 | |||||||||||||
| India | 1 | 5 | 9 | 17 | 17 | 3 | 2 | 3 | 57 | 2 | ||||||
| Indonesia | 2 | 3 | 2 | 2 | 9 | 2 | ||||||||||
| Italy | 2 | 1 | 5 | 1 | 2 | 1 | 1 | 1 | 1 | 2 | 1 | 18 | 2 | |||
| Japan | 34 | 62 | 81 | 46 | 24 | 20 | 10 | 6 | 1 | 2 | 2 | 288 | 2 | |||
| Kazakhstan | 1 | 1 | 2 | |||||||||||||
| Norway | 1 | 2 | 2 | 5 | 2 | |||||||||||
| Romania | 1 | 1 | 2 | |||||||||||||
| Russian Federation | 2 | 1 | 2 | 5 | 2 | |||||||||||
| Spain | 2 | 1 | 3 | 2 | 1 | 1 | 10 | 2 | ||||||||
| Sri Lanka | 1 | 1 | 2 | |||||||||||||
| Taiwan | 6 | 10 | 4 | 4 | 2 | 1 | 2 | 29 | 2 | |||||||
| Thailand | 2 | 4 | 1 | 4 | 1 | 12 | 2 | |||||||||
| Turkey | 2 | 2 | 2 | |||||||||||||
| Argentina | 1 | 1 | 1 | 3 | 1 | |||||||||||
| Brazil | 2 | 4 | 1 | 2 | 3 | 5 | 17 | 1 | ||||||||
| Canada | 9 | 7 | 12 | 6 | 3 | 1 | 1 | 1 | 1 | 1 | 42 | 1 | ||||
| Finland | 2 | 1 | 1 | 4 | 1 | |||||||||||
| Greece | 1 | 1 | 2 | 1 | ||||||||||||
| Hungary | 1 | 1 | 1 | |||||||||||||
| Ireland | 1 | 1 | 2 | 1 | ||||||||||||
| Philippines | 1 | 1 | 1 | 2 | 1 | 1 | 7 | 1 | ||||||||
| Poland | 0 | 1 | ||||||||||||||
| Portugal | 1 | 1 | 1 | 3 | 1 | |||||||||||
| Sweden | 3 | 2 | 2 | 7 | 1 | |||||||||||
| Switzerland | 3 | 2 | 2 | 2 | 2 | 11 | 1 | |||||||||
| United States | 105 | 116 | 113 | 74 | 46 | 67 | 15 | 9 | 6 | 11 | 19 | 6 | 5 | 1 | 593 | 1 |
| Colombia | 1 | 1 | 2 | 0 | ||||||||||||
| France | 10 | 6 | 4 | 1 | 1 | 1 | 2 | 2 | 1 | 28 | 0 | |||||
| Mexico | 1 | 2 | 1 | 3 | 2 | 1 | 2 | 12 | 0 | |||||||
| Bahrain | 1 | 1 | ||||||||||||||
| Luxembourg | 2 | 2 | ||||||||||||||
| Qatar | 1 | 1 | ||||||||||||||
| United Arab Emirates | 1 | 1 | ||||||||||||||
| Total | 218 | 237 | 266 | 187 | 128 | 147 | 80 | 38 | 19 | 31 | 41 | 17 | 11 | 1 | 1,421 | |
| C. CDS availability by industry and year | ||||||||||||||||
|---|---|---|---|---|---|---|---|---|---|---|---|---|---|---|---|---|
| 2001 | 2002 | 2003 | 2004 | 2005 | 2006 | 2007 | 2008 | 2009 | 2010 | 2011 | 2012 | 2013 | 2014 | 2015 | Average | |
| Agriculture | 1 | 1 | 2 | 2 | 4 | 5 | 6 | 5 | 7 | 6 | 7 | 7 | 6 | 6 | 3 | 5 |
| Food Products | 11 | 14 | 20 | 24 | 31 | 33 | 36 | 36 | 36 | 35 | 36 | 38 | 38 | 37 | 18 | 30 |
| Candy & Soda | 4 | 4 | 5 | 9 | 10 | 11 | 12 | 11 | 11 | 8 | 9 | 9 | 9 | 9 | 1 | 8 |
| Beer & Liquor | 6 | 9 | 13 | 16 | 16 | 18 | 18 | 17 | 17 | 17 | 17 | 17 | 15 | 15 | 6 | 14 |
| Tobacco Products | 9 | 9 | 8 | 9 | 9 | 10 | 10 | 8 | 8 | 8 | 8 | 8 | 8 | 8 | 1 | 8 |
| Recreation | 4 | 7 | 8 | 12 | 13 | 12 | 12 | 12 | 12 | 11 | 11 | 11 | 12 | 12 | 8 | 10 |
| Entertainment | 5 | 6 | 8 | 12 | 14 | 16 | 19 | 17 | 18 | 18 | 16 | 17 | 16 | 17 | 7 | 14 |
| Printing and Publishing | 9 | 10 | 13 | 18 | 21 | 24 | 20 | 18 | 18 | 18 | 18 | 18 | 17 | 17 | 6 | 16 |
| Consumer Goods | 15 | 17 | 22 | 24 | 25 | 25 | 25 | 27 | 26 | 26 | 26 | 27 | 27 | 26 | 9 | 23 |
| Apparel | 5 | 6 | 8 | 12 | 12 | 11 | 9 | 10 | 10 | 11 | 11 | 9 | 10 | 9 | 1 | 9 |
| Healthcare | 3 | 4 | 10 | 13 | 13 | 14 | 14 | 16 | 17 | 17 | 17 | 16 | 16 | 15 | 2 | 12 |
| Medical Equipment | 4 | 7 | 10 | 11 | 12 | 12 | 15 | 15 | 15 | 14 | 15 | 16 | 17 | 17 | 7 | 12 |
| Pharmaceutical Products | 10 | 20 | 26 | 38 | 41 | 45 | 51 | 49 | 43 | 42 | 41 | 40 | 39 | 41 | 12 | 36 |
| Chemicals | 19 | 30 | 40 | 54 | 65 | 64 | 64 | 68 | 69 | 70 | 67 | 67 | 68 | 68 | 25 | 56 |
| Rubber and Plastic Products | 1 | 1 | 3 | 3 | 3 | 4 | 5 | 5 | 5 | 5 | 4 | 4 | 4 | 3 | 4 | |
| Textiles | 1 | 2 | 4 | 4 | 4 | 5 | 6 | 6 | 6 | 6 | 6 | 6 | 5 | 4 | 5 | |
| Construction Materials | 7 | 15 | 19 | 27 | 31 | 30 | 34 | 37 | 37 | 37 | 36 | 36 | 35 | 35 | 13 | 29 |
| Construction | 3 | 11 | 17 | 27 | 33 | 42 | 56 | 62 | 64 | 64 | 64 | 68 | 66 | 67 | 31 | 45 |
| Steel Works Etc | 10 | 13 | 18 | 29 | 35 | 35 | 38 | 44 | 43 | 44 | 45 | 46 | 46 | 46 | 25 | 34 |
| Fabricated Products | 1 | 1 | 1 | 1 | 1 | 1 | 1 | 1 | 1 | |||||||
| Machinery | 10 | 25 | 35 | 45 | 50 | 55 | 56 | 56 | 56 | 55 | 56 | 56 | 56 | 57 | 33 | 47 |
| Electrical Equipment | 3 | 6 | 10 | 12 | 17 | 18 | 21 | 22 | 22 | 21 | 21 | 18 | 18 | 18 | 10 | 16 |
| Automobiles and Trucks | 25 | 34 | 39 | 47 | 56 | 60 | 63 | 64 | 63 | 60 | 61 | 63 | 63 | 60 | 22 | 52 |
| Aircraft | 6 | 8 | 10 | 11 | 11 | 11 | 10 | 10 | 11 | 11 | 11 | 11 | 11 | 11 | 1 | 10 |
| Shipbuilding, Railroad Equipment | 2 | 2 | 2 | 3 | 4 | 4 | 3 | 4 | 2 | 3 | ||||||
| Defense | 1 | 1 | 1 | 2 | 2 | 2 | 2 | 2 | 2 | 2 | 2 | 2 | 2 | 2 | 1 | 2 |
| Precious Metals | 1 | 1 | 1 | 3 | 3 | 2 | 3 | 3 | 3 | 3 | 3 | 3 | 3 | 3 | 3 | |
| Non-Metallic and Industrial Metal Mining | 3 | 8 | 13 | 15 | 16 | 15 | 17 | 18 | 18 | 18 | 19 | 19 | 18 | 19 | 6 | 15 |
| Coal | 1 | 4 | 5 | 5 | 6 | 6 | 6 | 6 | 6 | 7 | 6 | 6 | 5 | |||
| Petroleum and Natural Gas | 27 | 45 | 55 | 63 | 66 | 76 | 81 | 81 | 81 | 80 | 77 | 82 | 80 | 83 | 9 | 66 |
| Utilities | 43 | 71 | 87 | 117 | 137 | 148 | 150 | 153 | 150 | 146 | 147 | 141 | 143 | 139 | 32 | 120 |
| Communication | 46 | 55 | 74 | 79 | 92 | 97 | 101 | 104 | 107 | 103 | 102 | 106 | 105 | 102 | 24 | 86 |
| Personal Services | 1 | 3 | 3 | 4 | 6 | 6 | 7 | 7 | 7 | 8 | 8 | 9 | 7 | 8 | 1 | 6 |
| Business Services | 13 | 21 | 35 | 52 | 63 | 68 | 73 | 73 | 72 | 75 | 75 | 80 | 77 | 78 | 27 | 59 |
| Computers | 9 | 9 | 14 | 19 | 23 | 27 | 28 | 27 | 28 | 27 | 26 | 27 | 27 | 27 | 11 | 22 |
| Electronic Equipment | 15 | 22 | 38 | 57 | 65 | 71 | 69 | 71 | 71 | 68 | 67 | 62 | 61 | 60 | 22 | 55 |
| Measuring and Control Equipment | 4 | 8 | 10 | 12 | 13 | 13 | 14 | 14 | 14 | 14 | 13 | 13 | 13 | 13 | 8 | 12 |
| Business Supplies | 11 | 12 | 14 | 21 | 24 | 26 | 32 | 32 | 34 | 34 | 31 | 33 | 33 | 33 | 11 | 25 |
| Shipping Containers | 4 | 5 | 10 | 12 | 12 | 12 | 13 | 13 | 13 | 14 | 14 | 14 | 14 | 13 | 2 | 11 |
| Transportation | 21 | 35 | 52 | 75 | 79 | 85 | 87 | 87 | 89 | 86 | 88 | 91 | 94 | 93 | 44 | 74 |
| Wholesale | 8 | 14 | 19 | 22 | 33 | 36 | 37 | 40 | 40 | 38 | 39 | 38 | 36 | 36 | 21 | 30 |
| Retail | 37 | 44 | 53 | 69 | 74 | 81 | 92 | 94 | 91 | 90 | 90 | 87 | 85 | 85 | 34 | 74 |
| Restaurants, Hotels, Motels | 10 | 15 | 20 | 26 | 26 | 30 | 29 | 31 | 33 | 33 | 32 | 33 | 33 | 33 | 13 | 26 |
| Other Industries | 3 | 4 | 6 | 6 | 6 | 7 | 8 | 9 | 9 | 9 | 7 | 7 | 6 | 7 | 2 | 6 |
| Total | 427 | 631 | 849 | 1,117 | 1,271 | 1,365 | 1,449 | 1,483 | 1,485 | 1,462 | 1,455 | 1,467 | 1,450 | 1,445 | 519 | 1,195 |
The table shows the number of CDS reference entities by year across countries (panel A) and industries (panel C) and the number of CDS introductions by year across countries (panel B). Countries in panels A and B are sorted by the creditor rights index as reported in the last column of panel A. The sample consists of an unbalanced panel of more than 56,000 nonfinancial firms across 51 countries over the period 2001–2015. Market data are from Datastream; accounting data are from WorldScope; and CDS data are from Markit.
Table 1, panel C, reports the number of firms in each industry that have CDS available by year, using the Fama-French 48-industry groupings. We see significant variation in the patterns of CDS availability across industries. Broadly speaking, industries associated with relatively high levels of property, plant, and equipment (PP&E) (utilities, communication, transportation, oil and gas, and chemicals) appear more likely to have CDS based on their debt, while industries associated with services (fabricated products, personal services), commodities (agriculture, coal, and precious metals), and government (private defense companies) tend to have lower levels of CDS availability.21
6.2 Firm characteristics, country characteristics, and CDS introduction
The variation in CDS availability across sectors, observed in panel C of Table 1, suggests that there are systematic differences between firms on which CDS have been introduced. In addition, the evidence reported in panels A and B of Table 1 suggests that differences in country characteristics may also influence CDS introduction. We therefore estimate the propensity of CDS introduction allowing for both firm- and country-specific characteristics. The specific metrics of firm characteristics that we consider include measures related to size (total assets measured in USD), profitability (Tobin’s q, market-to-book equity ratio, return on assets, gross profit margin), cash flow (dividend, cash flow to sales, free cash flow to total assets), investment (cash and short-term investments, ratios of capital expenditure and R&D to assets, and net PP&E to size), and capital structure (market leverage at the firm and industry levels, ratio of convertible debt to size, debt maturity). We also include a firm’s age and the estimate of its tax rate. To measure the concentration of equity ownership, we use the percentage of closely held shares ( Closely Held Shares), defined as the percentage of shares held by insiders.
Country characteristics include four categories of the local legal and financial environment: creditor rights, property rights, the availability of private credit, and financial market sophistication. To measure the strength of creditor rights, we use variables constructed by Djankov et al. (2007) following La Porta et al. (1998), whose Creditor Rights index is the sum of four individual variables. Each of the creditor rights characteristics ( Restrictions on Entry, No Automatic Stay, Management Does Not Stay, and Secured Creditors First) is measured as an indicator variable, with a value of one indicating stronger creditor rights.22
As mentioned above, for measures of property rights, we use three variables from the ICRG developed by the PRS Group: Law & Order, Corruption, and Political Risk. For each of these indexes, higher scores indicate better ratings (i.e., a better legal environment, less corruption, lower political risk) and thus better property rights.
The strength of the private credit market is measured by domestic credit extended by financial corporations to the private sector scaled by GDP ( Domestic Credit to Private Sector), and by total credit to the private nonfinancial sector scaled by GDP ( Private Credit), obtained from the World Development Indicators database of the World Bank and BIS’s Total Credit Statistics, respectively. The sophistication of the local securities market is measured by the ratios of the market capitalization of CDS firms to that of all firms in a country ( CDS Market); the stock market capitalization to GDP ( Stock Market); and the market capitalization of the private bond market to GDP ( Private Bond Market).
We estimate logit regressions in which the dependent variable is equal to one if CDS are introduced on an individual firm in a particular year, and zero otherwise.23 In all our regressions, we use year and industry fixed effects, with industries defined using the Fama-French 48-industry classifications. Standard errors are clustered at the firm level. All explanatory variables are lagged by one year to allow for errors in the measurement of the date of introduction of CDS trading. We standardize ownership concentration and country variables for comparability.
Table 2 reports results from the logit regressions; for expositional purposes, we report coefficients from regressions with single regressors. Coefficients on the aggregate Creditor Rights index, as well as three of the four components of Creditor Rights, are negative and statistically significant. Specifically, we see coefficients of |$-$|0.129 (|$t$|-statistic |$= -3.1$|) on the Creditor Rights index, and coefficients of |$-$|0.129 (|$t$|-statistic |$= -2.7$|), |$-$|0.310 (|$t-$|statistic |$= -6.1$|) and |$-$|0.129 (|$t$|-statistic |$= -2.6$|) on Restrictions on Entry, No Automatic Stay, and Management Does Not Stay, respectively. These results indicate that CDS are less (more) likely to be introduced on firms that operate in countries with strong (weak) creditor rights. The exception to this is the case in which secured creditors receive priority in payments from the proceeds of liquidation ( Secured Creditor First). For that variable, the coefficient is statistically significant and positive, indicating that CDS introductions are more likely in environments that feature priority protection for creditors in the event of liquidation.
Propensity for CDS introduction
| (1) | (2) | (3) | (4) | (5) | (6) | (7) | (8) | (9) | (10) | (11) | (12) | (13) | (14) | |
|---|---|---|---|---|---|---|---|---|---|---|---|---|---|---|
| Creditor Rights | Property Rights | Private Credit Availability | Financial Market Sophistication | |||||||||||
| Creditor Rights | Restriction on Entry | No Automatic Stay | Management Does Not Stay | Secured Creditors First | Law & Order | Corruption | Political Risk | Domestic Credit to Private Sector | Private Credit | CDS Market | Stock Market | Private Bond Market | Closely Held Shares | |
| Country/Firm Variable | –0.129*** | –0.129*** | –0.310*** | –0.129*** | 0.241*** | 0.049 | –0.009 | –0.018 | 0.329*** | –0.068 | 0.450*** | 0.118*** | 0.276*** | –0.259*** |
| (0.042) | (0.048) | (0.051) | (0.049) | (0.048) | (0.041) | (0.049) | (0.056) | (0.062) | (0.054) | (0.145) | (0.045) | (0.049) | (0.041) | |
| Firm Controls | Yes | Yes | Yes | Yes | Yes | Yes | Yes | Yes | Yes | Yes | Yes | Yes | Yes | Yes |
| Year Fixed Effects | Yes | Yes | Yes | Yes | Yes | Yes | Yes | Yes | Yes | Yes | Yes | Yes | Yes | Yes |
| Industry Fixed Effects | Yes | Yes | Yes | Yes | Yes | Yes | Yes | Yes | Yes | Yes | Yes | Yes | Yes | Yes |
| Clustered Standard | ||||||||||||||
| Errors | Firm | Firm | Firm | Firm | Firm | Firm | Firm | Firm | Firm | Firm | Firm | Firm | Firm | Firm |
| Observations | 80,822 | 80,822 | 80,822 | 80,822 | 80,822 | 80,822 | 80,822 | 80,822 | 80,822 | 80,822 | 80,822 | 80,822 | 80,822 | 80,822 |
| Pseudo |$R$|-Squared | 0.397 | 0.396 | 0.400 | 0.397 | 0.399 | 0.396 | 0.396 | 0.396 | 0.400 | 0.396 | 0.401 | 0.396 | 0.400 | 0.400 |
The table shows the results of logit regressions in which the CDS introduction dummy (i.e., only the first year of CDS trading for each firm) is the dependent variable. Firm characteristics and country characteristics serve as explanatory variables, and all are lagged by one year. (Standardized) country variables are grouped into four categories: (1) creditor rights, (2) property rights, (3) private credit availability, and (4) financial market sophistication. The last column uses the (standardized) firm-level variable Closely Held Shares instead of a country variable. For creditor rights, we use an aggregate index (Creditor Rights) as well as its four subindexes, namely, restrictions on a firm entering reorganization without creditors’ consent (Restrictions on Entry); no automatic stay or asset freeze (No Automatic Stay); restriction on management’s administration of a firm’s assets pending resolution of the reorganization (Management Does Not Stay); and payment of secured creditors first out of any liquidation proceeds (Secured Creditors First). For property rights, we consider the following three measures: Law & Order, Corruption, and Political Risk, where higher index values indicate stronger protection for private properties. Private credit availability is measured by domestic credit by financial corporations to the private sector scaled by GDP (Domestic Credit to Private Sector) and by total credit to the private nonfinancial sector scaled by GDP (Private Credit). Financial market sophistication is measured by the ratio of market capitalization of CDS firms to that of all firms in a country (CDS Market); stock market capitalization scaled by GDP (Stock Market); and market capitalization of the private bond market scaled by GDP (Private Bond Market). For equity ownership concentration, we use the percentage of closely held shares (Closely Held Shares). All regressions include the following firm characteristics as controls: the natural logarithm of total assets (in USD), Tobin’s |$q$|, the market-to-book equity ratio, return on assets (3-year average), gross profit margin (3-year average), a dividend dummy, cash flow to sales, free cash flow to total assets, the natural logarithm of cash and short-term investments, capital expenditures to total assets, R&D to assets, net PP&E to size, market leverage, industry median market leverage, convertible debt to size, debt maturity, return volatility in local currency and in USD, volatility of return on assets, net foreign exchange exposure, firm age, and tax rate. Regressions also include year and Fama-French 48-industry fixed effects. Standard errors are clustered at the firm level and are reported in parentheses. The sample consists of an unbalanced panel of more than 56,000 nonfinancial firms across 51 countries over the period 2001–2015. Appendix D defines all variables. *|$p <.1$|; **|$p <.05$|; ***|$p <.01$|.
Property rights variables have no significant effect on the propensity to introduce CDSs. In contrast, if the domestic credit market scaled by GDP is robust, CDS are more likely to be introduced (coefficient on Domestic Credit to Private Sector |$= 0.329$|, |$t$|-statistic |$= 5.3$|). This is consistent with CDS providing hedging benefits to domestic creditors, where that credit is a significant source of financing for firms. CDS are also more likely to be introduced in countries with a developed CDS market, stock market, and private bond market (coefficients of 0.450, 0.118, and 0.276, respectively). Finally, CDS are less (more) likely to be introduced in firms where ownership concentration is high (low); the coefficient on Closely Held Shares is negative and statistically significant (coefficient |$= -0.259$|, |$t$|-statistic |$= -6.3$|). This may indicate a stronger interest in CDS protection in circumstances in which a more dispersed ownership base might be expected to engage in relatively little monitoring.
More generally, these results indicate substantial differences in the characteristics of firms that experience CDS introduction compared to those that do not. Table 3 reports descriptive statistics for the subsamples of firms that do, and do not, experience CDS introduction during our sample period. In addition to reporting the sample means and standard errors, we report statistical tests for differences between these two subsamples, including |$t$|-tests for differences in the means and Kolmogorov-Smirnov tests for differences in the distributions of the characteristics. We also report a measure of bias between the two subsamples, calculated as in Rosenbaum and Rubin (1985).
Firm- and country-level characteristics without imposition of overlap weights
| Treated (|$N = 784$|) | Control (|$N =$| 80,038) | |$t$|-test | Kolmogorov-Smirnov test | ||||||
|---|---|---|---|---|---|---|---|---|---|
| Mean | Std. Err. | Mean | Std. Err. | |$\%$| Bias | |$t$| | |$p$|-value | |$D$| | |$p$|-value | |
| Firm Characteristics | |||||||||
| Cash Flow/Sales | 0.149 | 0.004 | 0.112 | 0.001 | 28|$\%$| | 6.7 | 0.000 | 0.1399 | 0.000 |
| Convertible Debt/Size | 0.011 | 0.001 | 0.002 | 0.000 | 53|$\%$| | 22.2 | 0.000 | 0.2061 | 0.000 |
| Debt Maturity | 0.756 | 0.008 | 0.528 | 0.001 | 79|$\%$| | 18.8 | 0.000 | 0.3084 | 0.000 |
| Dividend | 0.835 | 0.013 | 0.758 | 0.002 | 19|$\%$| | 5.0 | 0.000 | 0.0771 | 0.000 |
| Free Cash Flow/Total Assets | 0.025 | 0.002 | 0.026 | 0.000 | –2|$\%$| | –0.4 | 0.687 | 0.0647 | 0.003 |
| Gross Profit Margin (3y) | 0.306 | 0.006 | 0.271 | 0.001 | 20|$\%$| | 5.4 | 0.000 | 0.1027 | 0.000 |
| Leverage Market Value | 0.242 | 0.005 | 0.190 | 0.001 | 33|$\%$| | 9.0 | 0.000 | 0.2047 | 0.000 |
| Leverage Market Value (Industry Median) | 0.167 | 0.003 | 0.152 | 0.000 | 20|$\%$| | 5.7 | 0.000 | 0.1056 | 0.000 |
| Age (log) | 2.791 | 0.027 | 2.552 | 0.003 | 32|$\%$| | 9.0 | 0.000 | 0.2779 | 0.000 |
| ROA Volatility (log) | –3.900 | 0.031 | –3.541 | 0.004 | –38|$\%$| | –10.1 | 0.000 | 0.1498 | 0.000 |
| Total Assets in USD (log) | 21.773 | 0.023 | 19.526 | 0.006 | 189|$\%$| | 40.3 | 0.000 | 0.6955 | 0.000 |
| Market/Book | 2.479 | 0.069 | 1.943 | 0.007 | 28|$\%$| | 8.0 | 0.000 | 0.2350 | 0.000 |
| Net FX-Exposure | 0.119 | 0.008 | 0.117 | 0.001 | 1|$\%$| | 0.2 | 0.809 | 0.0751 | 0.000 |
| PPE (Net)/Size | 0.395 | 0.010 | 0.391 | 0.001 | 2|$\%$| | 0.4 | 0.691 | 0.0615 | 0.006 |
| Return On Assets (3y) | 0.062 | 0.002 | 0.061 | 0.000 | 3|$\%$| | 0.7 | 0.506 | 0.0520 | 0.030 |
| Tax Rate | 0.344 | 0.005 | 0.304 | 0.001 | 27|$\%$| | 7.0 | 0.000 | 0.1795 | 0.000 |
| Tobin’s Q | 1.321 | 0.034 | 1.181 | 0.004 | 14|$\%$| | 3.8 | 0.000 | 0.2125 | 0.000 |
| Return Volatility in LC (log) | –1.146 | 0.013 | –0.969 | 0.002 | –43|$\%$| | –10.6 | 0.000 | 0.1812 | 0.000 |
| Return Volatility in USD (log) | –1.108 | 0.013 | –0.915 | 0.002 | –46|$\%$| | –11.6 | 0.000 | 0.1989 | 0.000 |
| Capital Expenditures/Total Assets | 0.060 | 0.002 | 0.051 | 0.000 | 18|$\%$| | 4.8 | 0.000 | 0.1565 | 0.000 |
| R&D/Total Assets | 0.014 | 0.001 | 0.010 | 0.000 | 15|$\%$| | 4.5 | 0.000 | 0.1173 | 0.000 |
| Cash and Short-term Investments/Total Assets (log) | –2.721 | 0.046 | –2.383 | 0.005 | –26|$\%$| | –7.1 | 0.000 | 0.1169 | 0.000 |
| Closely Held Shares | –0.628 | 0.035 | 0.040 | 0.004 | –67|$\%$| | –18.0 | 0.000 | 0.3007 | 0.000 |
| Country Characteristics | |||||||||
| Restrictions on Entry | –0.209 | 0.030 | 0.091 | 0.004 | –23|$\%$| | –8.0 | 0.000 | 0.1304 | 0.000 |
| No Automatic Stay | –0.300 | 0.029 | 0.093 | 0.004 | 1|$\%$| | –10.6 | 0.000 | 0.1831 | 0.000 |
| Management Does Not Stay | –0.141 | 0.036 | 0.065 | 0.004 | 18|$\%$| | –5.8 | 0.000 | 0.1027 | 0.000 |
| Secured Creditors First | 0.105 | 0.030 | 0.006 | 0.004 | 10|$\%$| | 2.8 | 0.005 | 0.0304 | 0.468 |
| Law & Order | 0.240 | 0.034 | –0.054 | 0.004 | 49|$\%$| | 8.1 | 0.000 | 0.1330 | 0.000 |
| Corruption | 0.090 | 0.028 | –0.002 | 0.003 | 37|$\%$| | 2.6 | 0.009 | 0.1551 | 0.000 |
| Political Risk | 0.386 | 0.028 | 0.017 | 0.003 | 1|$\%$| | 10.7 | 0.000 | 0.2339 | 0.000 |
| Domestic Credit to Private Sector | 0.344 | 0.032 | 0.044 | 0.003 | 20|$\%$| | 8.6 | 0.000 | 0.2517 | 0.000 |
| Private Credit | 0.022 | 0.029 | –0.026 | 0.004 | 6|$\%$| | 1.4 | 0.174 | 0.1378 | 0.000 |
| CDS Market | 0.225 | 0.030 | 0.062 | 0.003 | 29|$\%$| | 5.2 | 0.000 | 0.2541 | 0.000 |
| Stock Market | 0.030 | 0.033 | 0.088 | 0.004 | –10|$\%$| | –1.4 | 0.175 | 0.1169 | 0.000 |
| Private Bond Market | 0.339 | 0.037 | –0.088 | 0.003 | 13|$\%$| | 12.4 | 0.000 | 0.2479 | 0.000 |
The table compares firm- and country-level characteristics between firm-years with CDS introductions (treated) and without CDS introductions (control) in the prior year. It reports the mean and standard errors for treated and control firms; the percentage bias according to Rosenbaum and Rubin (1985); and test statistics and |$p$|-values of |$t$|-tests and Kolmogorov-Smirnov tests. The sample consists of an unbalanced panel of more than 56,000 nonfinancial firms across 51 countries over the period 2001–2015. Market data are from Datastream; accounting data are from WorldScope; and CDS data are from Markit. The sample is limited to firm-year observations for which all reported firm- and country-level variables are jointly available. Given the differences in characteristics between treated and control firms, we use overlap weights (Li, Morgan, and Zaslavsky 2018) for our main analysis that balance the covariates between these samples (see Table E.2 in Appendix E). Appendix D defines all variables.
The results clearly indicate systematic differences in both firm and country characteristics for the sample of firms with CDS introductions. The differences in average characteristics are generally highly statistically significant. The Kolmogorov-Smirnov tests for differences in the two distributions are also highly significant in all but one country characteristic (the distribution of Secured Creditor First). Moreover, the majority of the bias measures indicate that the differences between firm and country characteristics across the two subsamples are also economically significant.
Combined, the results in Tables 2 and 3 reinforce the case that firms with CDS are different along many dimensions from those without them. In fact, it is virtually impossible to find firms with and firms without CDS that are closely matched across all dimensions. As a consequence, in estimating the effects of CDS introduction, we must control for these differences in covariates. In the next section, we discuss how we use logit regressions similar to those in Table 2 for the construction of the overlap weights that we use to balance covariates across the subsamples and thus correct for these differences in estimating the effects of CDS introduction.
6.3 Overlap weight calculation
To calculate overlap weights as described in Section 5, we estimate logit regressions, using an indicator variable for CDS introduction as the dependent variable. That is, we estimate the propensity that a firm |$i$| experiences a CDS introduction in year |$t$|. As explanatory variables, we employ all firm and country characteristics in Table 2 (discussed in the previous section) jointly, as well as industry and year fixed effects. Wooldridge (2002), Li, Morgan, and Zaslavsky (2018), and Curtis, Hammill, and Eisenstein (2007) point out that in estimating the propensity model, parsimony is not a consideration, since the model is not used to draw inferences but only to balance the covariates in the two subsamples.
We use the selection model to estimate the probability of CDS introduction, |$p_{it}(x)$|, and then weight each observation by |$w_{it}$|. This overlap weighting method balances the covariates in the two subsamples. Figure 1 illustrates the effect for selected covariates. In each panel, we present (in the left charts) the distribution of the covariate in the treated and control samples prior to overlap weighting and (in the right charts) the distribution of the covariate in the treated and control samples following the application of overlap weights. It is clear that the weighting method balances the covariates between the subsamples of firms with and firms without CDS introductions. In Table E.2 in Appendix E, we present additional descriptive statistics of the two subsamples after overlap weighting. By construction, the overlap weights produce an exact balance in the means of the treated and control groups, although there are some differences in the (reweighted) densities of the samples of treated and control firms (i.e., the overlap weighting methodology does not match the densities of the treated and control subsamples at every point). However, as Figure 1 shows, while the overlap weighting procedure does not consider moments beyond the mean, the empirical density functions match relatively well even for covariates with the largest deviations in density—and markedly better than in the unweighted sample.
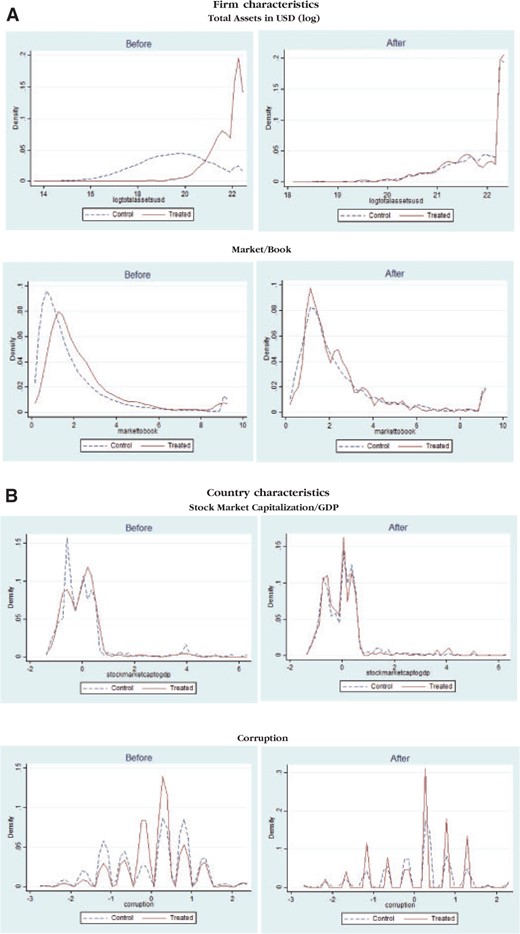
Covariate balancing of sample firms
This figure shows the covariate balancing of sample firms a year prior to CDS introduction by plotting the distributions for treated firms (i.e., firms in the year of CDS introduction) and control firms (i.e., firms without CDS introductions in that year) before and after imposing overlap weights. Panel A shows results for selected firm characteristics; panel B shows results for selected country characteristics. Variables are selected based on the largest EADD in Table E.2 in Appendix E. The sample consists of an unbalanced panel of more than 56,000 nonfinancial firms across 51 countries over the period 2001–2015. Market data are from Datastream; accounting data are from WorldScope; and CDS data are from Markit. Appendix D defines all variables.
Using the overlap weighting method, we create a synthetic sample and then use this propensity-weighted sample to estimate how CDS introduction affects firms. The outcomes that we examine include the firms’ capital structure and investment choices.
6.4 CDS and corporate capital structure
An important aspect of our analysis is that we examine both the effect of CDS introduction on real decisions and whether the local legal and economic environment moderates that effect. In panel B of Table E.1 in Appendix E, we report correlations between the local country variables used in our analysis. Not surprisingly, many of these correlations are quite strong. For example, the correlations between property rights variables ( Political Risk, Corruption, and Law & Order) are all strongly positive. These correlations are not a concern when estimating propensity weights; however, in measuring treatment effects, collinearity in these variables makes inferences more difficult. As a consequence, in estimating treatment effects, we estimate the effects of individual conditioning variables related to creditor rights, property rights, and equity ownership concentration, and the interaction effects of these variables with CDS introduction in separate regressions.
In Table 4, we analyze the effects of CDS introduction on firms’ leverage from panel estimations. In the baseline regression specification reported in column 1, CDS introduction is associated with a positive and significant increase in leverage. The magnitude of the coefficient (0.0123, |$t$|-statistic |$= 2.20$|) is economically significant. Since the average firm leverage observed in our sample is 0.18, this coefficient indicates an approximate 6.8|$\%$| increase in leverage associated with CDS introduction. Moreover, the coefficient on CDS introduction is positive and significant in every specification that we consider in Table 4.24
Effects of CDSs on leverage
| (1) | (2) | (3) | (4) | (5) | (6) | (7) | (8) | (9) | (10) | |
|---|---|---|---|---|---|---|---|---|---|---|
| Creditor Rights | Property Rights | |||||||||
| Baseline | Creditor Rights | Restriction on Entry | No Automatic Stay | Management Does Not Stay | Secured Creditors First | Law & Order | Corruption | Political Risk | Closely Held Shares | |
| CDS Introduction |$\times$| | ||||||||||
| Conditioning Variable | 0.0028 | 0.0128** | –0.0063 | –0.0069 | 0.0149** | –0.0190*** | –0.0080 | –0.0304*** | 0.0134** | |
| (0.0055) | (0.0065) | (0.0063) | (0.0056) | (0.0060) | (0.0057) | (0.0072) | (0.0074) | (0.0057) | ||
| Conditioning Variable | 0.0003 | –0.0120*** | 0.0018 | 0.0125*** | –0.0095*** | –0.0002 | –0.0112*** | 0.0065 | 0.0126*** | |
| (0.0033) | (0.0040) | (0.0038) | (0.0040) | (0.0032) | (0.0036) | (0.0041) | (0.0047) | (0.0035) | ||
| CDS Introduction | 0.0123** | 0.0129** | 0.0144** | 0.0106* | 0.0115** | 0.0111** | 0.0156*** | 0.0128** | 0.0225*** | 0.0198*** |
| (0.0056) | (0.0057) | (0.0057) | (0.0057) | (0.0056) | (0.0056) | (0.0057) | (0.0056) | (0.0063) | (0.0069) | |
| Year Fixed Effects | Yes | Yes | Yes | Yes | Yes | Yes | Yes | Yes | Yes | Yes |
| Industry Fixed Effects | Yes | Yes | Yes | Yes | Yes | Yes | Yes | Yes | Yes | Yes |
| Clustered Standard Errors | Firm | Firm | Firm | Firm | Firm | Firm | Firm | Firm | Firm | Firm |
| Observations | 80,501 | 80,501 | 80,501 | 80,501 | 80,501 | 80,501 | 80,501 | 80,501 | 80,501 | 80,501 |
| Adj. |$R$|-Squared | 0.187 | 0.187 | 0.189 | 0.188 | 0.191 | 0.189 | 0.193 | 0.193 | 0.195 | 0.202 |
The table shows the average treatment effect of CDS introductions on the market leverage (defined as the sum of total debt and preferred stock divided by market value of total assets) of the treated firms (ATET) using overlap weights (Li, Morgan, and Zaslavsky 2018). The treatment is the introduction of CDSs (i.e., only the first year of CDS trading for each firm). The regressions further include CDS interaction effects with lagged (standardized) conditioning variables, as well as the lagged conditioning variables themselves. The use of overlap weights ensures that covariates are perfectly balanced between treated firms and control firms in the year before treatment (see table E.2 in Appendix E). Conditioning variables are grouped into three categories: (1) creditor rights, (2) property rights, and (3) equity ownership concentration. For creditor rights, we use an aggregate index (Creditor Rights) as well as its four subindexes, namely, restrictions on a firm entering reorganization without creditors’ consent (Restrictions on Entry); no automatic stay or asset freeze (No Automatic Stay); restriction on management’s administration of a firm’s assets pending resolution of the reorganization (Management Does Not Stay); and payment of secured creditors first out of any liquidation proceeds (Secured Creditors First). For property rights, we consider the following three measures: Law & Order, Corruption, and Political Risk, where higher index values indicate stronger protection for private properties. For equity ownership concentration, we use the percentage of closely held shares (Closely Held Shares). All regressions include year and Fama-French 48-industry fixed effects. Standard errors are clustered at the firm level and are reported in parentheses. The sample consists of an unbalanced panel of more than 56,000 nonfinancial firms across 51 countries over the period 2001–2015. Market data are from Datastream; accounting data are from WorldScope; and CDS data are from Markit. Appendix D defines all variables. *|$p <.1$|; **|$p <.05$|; ***|$p <.01$|.
Note that in some circumstances, increases in the amount of debt may not map into increases in the leverage ratio if the value of equity changes sufficiently. As a consequence, to better interpret the impact of CDS on leverage, in untabulated analysis we examine the relation between CDS introductions and the value of total assets in our sample. We find a positive but statistically insignificant change in the market value of a firm’s assets after CDS introduction; specifically, the coefficient estimate of CDS introduction on (log) market value is 0.0077, with a standard error of 0.03. This evidence is consistent with that reported in Danis and Gamba (2018), and suggests that our results are driven by the numerator effect, that is, increases in debt rather than changes in total asset value.
Our study is the first to explore the unconditional relation between CDS introductions and leverage internationally. While our sample includes U.S. firms, which have been the focus of prior work, these account for only 20|$\%$| of firms and 40|$\%$| of CDS introductions in our international sample. Our international results are broadly consistent with the findings of Saretto and Tookes (2013) and Subrahmanyam, Tang, and Wang (2014) in the North American context: Saretto and Tookes (2013) show that U.S. firms with traded CDS contracts on their debt are able to maintain higher leverage ratios and have higher credit risk.
In Table 4, we also see evidence consistent with Proposition 1 that, following CDS introduction, firms in countries with stronger creditor rights along two dimensions have significantly higher increases in leverage. Specifically, coefficients on the interactions of CDS introduction and both Restrictions on Entry and Secured Creditors First are positive and statistically significant. We consider each of these in turn. The significant effect of restrictions on entry into reorganization is consistent with the implications of the model. Note that the firms’ entry into reorganization can serve as a credit event and consequently trigger payments due under CDS obligations. In the context of the model, creditors who have access to CDS protection in legal environments that give them control over entry into reorganization have substantially higher bargaining power. This bargaining power allows the firm to overcome a limited-commitment problem in the issuance of debt, and consequently the firm is able to sustain more leverage. This result is particularly interesting in light of differences in events that trigger CDS in North America versus other regions in the world. That is, since the Big Bang Protocol in 2009, in North America reorganizations are not included in the list of credit events that trigger CDS payments, while they can trigger such payments in regions other than North America.25
The second dimension of creditor rights that is associated with a significant positive coefficient on leverage following CDS introduction is Secured Creditor First. This result is consistent with the model’s implication regarding liquidation cost. Specifically, the results of the model predict that the impact of CDSs on debt will be larger where liquidation costs are lower (or liquidation values are higher), particularly when empty creditors could force the reference entities into liquidation rather than restructuring. In cases in which the bankruptcy code specifies the priority of payout, the bargaining position of creditors should be stronger and the loss of value related to liquidation should be smaller (see, e.g., Davydenko and Franks 2008).
In contrast to the significant coefficients on Restrictions on Entry and Secured Creditors First, we find no significant effects on leverage for the interaction of CDS introduction and either No Automatic Stay or Management Does Not Stay. That is, while the availability of CDSs appears to influence capital structure through effects on entry into and exit from the reorganization process, CDSs do not appear to affect leverage through differences in creditors’ rights that bind during the reorganization process. Put simply, in terms of the effects of CDS introduction on leverage, not all creditor rights are alike.
We find evidence that the availability of CDSs increases leverage in countries with weaker property rights: the coefficients on Law & Order and Political Risk are negative and highly significant. This evidence is consistent with the model’s prediction that leverage increases more strongly in countries with weak contract enforceability. In other words, CDS provide a substitute for weak property rights. Intuitively, these contracts may act as a firm-specific liberalization mechanism, facilitating an increase in credit in countries where poor enforceability of property rights acts as a constraint on the supply of credit. This interpretation is also consistent with the arguments in Bae and Goyal (2009) that, along with creditor rights, property rights are an important determinant of the credit that is available to firms. Indeed, across regressions, Political Risk is the conditioning variable that is economically most important in influencing the relation between leverage and CDS introductions.26
Finally, we observe a positive and significant coefficient on Closely Held Shares. This result is consistent with the implications of the model: it suggests that the increase in leverage is larger for firms that have newly introduced CDS in cases in which equity ownership is concentrated and where creditors’ bargaining power is weaker.
Overall, our results provide additional evidence that the legal environment faced by the firm is an important determinant of capital structure, which is consistent with our theoretical framework. Specifically, our results indicate that while the introduction of CDS contracts is associated with higher leverage, this effect is significantly larger when the legal environment provides creditors with greater certainty about their ability to use their (stronger) creditor rights (high |$\gamma $|, proxied by creditors’ ability to restrict entry into reorganization); with weaker ability to enforce contracts (low |$\lambda $|, proxied by weak property rights); with higher priority in the event of liquidation (high |$S$|, proxied by the payment of liquidation proceeds to secured creditors first); and with weaker initial bargaining power relative to shareholders (low |$q$|, proxied by the extent to which the firm is closely held). Our results indicate that while CDS may allow firms to mitigate a weak institutional heritage, residual uncertainty about the local legal environment—legal risk, as opposed to credit risk—can influence their effect.
Given that the results in Table 4 suggest that the availability of CDSs affects firms’ financing choices, a natural question is whether changes in capital structure are also associated with changes in investment and whether any effects on investment vary with the local legal environment. For example, if CDS contracts allow for better risk sharing, as well as strengthen creditors’ bargaining power, then their effect on investment should be larger in countries where shareholders have strong bargaining power and in countries with weaker enforceability of law. In contrast to the work on the effects of CDSs on financing, the literature on the effects of CDSs on other real activity inside the firm is relatively modest. In a recent paper, Narayanan and Uzmanoglu (2018) find that for firms in the United States, the initiation of CDS trading, but not CDS notional amounts outstanding or liquidity, has a significant negative effect on investments (defined as the sum of R&D expenditure, capital expenditure, and acquisition expenditure less the sale of PP&E).
We briefly explore the association between CDS introduction and capital investment; these results are reported in Table E.3 in Appendix E. In the baseline regression, which looks at the average treatment effect across all countries, we find no evidence that the introduction of CDSs has a significant effect. However, some evidence indicates that the effect of CDSs on capital investment is positive in countries with stronger creditor rights. This evidence appears to be driven by a positive effect in countries with restrictions on entry to reorganization. In particular, the coefficient on Restrictions on entry is positive and significant. Recall that this is also the case in which leverage effects are observed to be positive and significant. This suggests that the increase in leverage is financing at least some incremental capital investment.
6.5 Robustness tests
We carry out several further tests to document the robustness of our results. These include a test for sensitivity to omitted variables; the use of additional controls in the propensity-weighting method; the reestimation of our results using OLS; the reestimation of a sample that excludes U.S. firms; the reestimation of subsamples without firms that may be considered “national champions”; the reestimation of the results using CDS existence rather than CDS introduction as the variable of interest; and an analysis of longer-horizon effects of CDS introduction. Finally, we briefly examine the effects of the “Bang protocols” on our results.
6.5.1 Omitted variable test
Similar to other techniques that use propensity scores to match or weight observations, overlap weighting is based on a set of observed covariates and thus, in principle, is subject to possible omitted variable biases. Therefore, we analyze whether our results are sensitive to the possibility of unobserved confounding variables, adapting a methodology proposed by Ichino, Mealli, and Nannicini (2008). The approach includes simulated unobserved covariates in the logit model that estimates the propensity of CDS introduction. Subsequently, the resultant confounded weights are incorporated into the outcome regressions using the same regression specifications as in our main analyses. This analysis allows us to assess the sensitivity of the estimates of interest to simulated unobserved confounders that affect both the treatment selection and the outcome variable, since such a confounder would bias the estimated treatment effect.27
Specifically, following Ichino, Mealli, and Nannicini (2008), we use two alternative methods to simulate confounders. In the first method, we estimate the effect of “calibrated confounders,” which are specified to have an empirical distribution similar to the existing, observable covariates in the logit regression. Since calibrated confounders are constrained to be binary variables, we use binary transformations of continuous covariates (indicating whether an observation is above or below the median of that variable). Because the results using calibrated confounders might be driven by the particular behavior of the chosen covariates, in the second method we test whether “killer confounders” exist that could drive the estimated treatment effect to zero (Ichino, Mealli, and Nannicini 2008). The relation of killer confounders to treatment selection and outcome variables is not constrained to be similar to the relations of existing covariates to these variables. As a consequence, the influence of killer confounders on estimates is more extreme, and inferences regarding their effect are more conservative. These techniques allow us to use different assumptions about the distribution of confounding factors to assess the robustness of the average treatment effect and test whether there exists a plausible set of confounders that eliminates the estimated treatment effect. Further details on the methodology are provided in Appendix B.
Table 5 reports the results from sensitivity analyses conducted to assess the effect of potential omitted variable bias on the results in Table 4. For each regression specification, we simulate 100 iterations of calibrated and killer confounders, and for each iteration we reestimate the effect of CDS introductions and their interactions with conditioning variables using regression specifications identical to those in Table 4 but using the confounded balancing weights. We report the minimum and maximum coefficient for the interaction variables across simulations of alternative calibrated and killer confounders. The reported minimum/maximum values are the most extreme confounding effects across all simulations and thus represent the most conservative inferences; all other simulations yield values within these bounds.
Sensitivity analysis for omitted variables
| (2) | (3) | (4) | (5) | (6) | (7) | (8) | (9) | (10) | ||
|---|---|---|---|---|---|---|---|---|---|---|
| Creditor Rights | Property Rights | |||||||||
| Creditor Rights | Restriction on Entry | No Automatic Stay | Management Does Not Stay | Secured Creditors First | Law & Order | Corruption | Political Risk | Closely Held Shares | ||
| Calibrated Confounders | Minimum | 0.0025 | 0.0124* | –0.0071 | –0.0071 | 0.0147** | –0.0191*** | –0.0086 | –0.0304*** | 0.0132** |
| Maximum | 0.0031 | 0.0131** | –0.0057 | –0.0066 | 0.0152*** | –0.0182*** | –0.0071 | –0.0294*** | 0.0141** | |
| Killer Confounders | Minimum | 0.0017 | 0.0100 | –0.0085 | –0.0087 | 0.0118* | –0.0211*** | –0.0084 | –0.0342*** | 0.0130** |
| Maximum | 0.0042 | 0.0155** | –0.0004 | –0.0053 | 0.01512** | –0.0158*** | –0.0056 | –0.0255*** | 0.0161** | |
The table reports tests of the sensitivity of the regression results in table 4 to the effect of unobserved omitted variables in the estimation of the balancing weights, using a simulation approach proposed by Ichino, Mealli, and Nannicini (2008). The regression specifications (2) to (10) are the same as in table 4. The key treatment indicator is the CDS introduction dummy. Its interaction effects with (standardized) conditioning characteristics are also jointly estimated. Conditioning variables are grouped into three categories: (1) creditor rights, (2) property rights, and (3) equity ownership concentration. For creditor rights, we use an aggregate index (Creditor Rights) as well as its four subindexes, namely, restrictions on a firm entering reorganization without creditors’ consent (Restrictions on Entry); no automatic stay or asset freeze (No Automatic Stay); restriction on management’s administration of a firm’s assets pending resolution of the reorganization (Management Does Not Stay); and payment of secured creditors first out of any liquidation proceeds (Secured Creditors First). For property rights, we consider the following three measures: Law & Order, Corruption, and Political Risk, where higher index values indicate stronger protection for private properties. For equity ownership concentration, we use the percentage of closely held shares (Closely Held Shares). The sensitivity analysis simulates alternatively calibrated confounders or killer confounders in the estimation of the balancing weights that are subsequently used to assess the average treatment effect on the treated (ATET) using overlap weights (Li, Morgan, and Zaslavsky 2018). Calibrated confounders are specified to have an empirical distribution similar to the existing observable covariates in the logit regression that yields the inputs to the balancing weights. We use binary transformations of continuous covariates, that is, indicator variables of whether an observation is above or below the median of that variable. Separately, we also use killer confounders to assess whether more extreme unobserved omitted covariates exist that eliminate the treatment effect. We simulate 100 iterations of calibrated and killer confounders and reestimate the effect of CDS introductions and their interactions with conditioning variables for each iteration. Further details on the methodology are provided in Appendix B. For each outcome regression specification, the table reports the minimum and maximum coefficients for the interaction variables across calibrated and killer confounders. Standard errors are clustered at the firm level. The sample consists of an unbalanced panel of more than 56,000 nonfinancial firms across 51 countries over the period 2001–2015. All variables are defined in Appendix D. *|$p <.1$|; **|$p <.05$|; ***|$p <.01$|.
The results indicate that our primary results are relatively insensitive to unobserved confounders. Comparison of the regression coefficients on the interaction of CDS introduction and alternative conditioning variables in Table 4 with the results for calibrated confounders shows that the minimum and maximum coefficients in Table 5 always have the same sign and significance levels as the corresponding estimated coefficients in the observed data, except for the minimum coefficient on Restrictions on Entry, which is slightly smaller than the estimated coefficient in Table 4 and is only weakly significant. This evidence indicates that for calibrated confounders, even when the outcome and the selection effect of an unobserved confounder is strong, inferences regarding the treatment effect are not overturned.
Killer confounders tend to result in a wider range of regression coefficients, but even here we observe that the direction and strength of the relations are similar to those in Table 4, indicating that the outcome and selection effects need to be very strong in order to “kill” the treatment effect. For example, the largest effect of potential unobservables is that for the estimated coefficient on Restrictions on Entry. The minimum coefficient across 100 iterations is approximately 20|$\%$| smaller than that of the coefficient estimated in Table 4 (0.0100 vs. 0.0128), and while the estimate in Table 4 is significant at the 5|$\%$| level, the minimum estimate when killer confounders are added to the propensity model is not statistically significant. For Secured Creditors First, the smallest coefficient with killer confounders is significant at the 10|$\%$| level, while it is significant at the 5|$\%$| level in the main results. The inferences on the other variables remain largely unchanged. Note that even in those cases in which the bounds of the sensitivity analysis indicate that an omitted variable has the potential to overturn inferences, these results do not provide evidence that such an omitted variable exists; rather, they represent an estimate of how our primary results might change if extreme values of such confounders were to exist. Overall, the results of the sensitivity test in Table 5 indicate that our primary results regarding the effect of CDS introduction on leverage are relatively insensitive to unobserved confounders.
6.5.2 Additional controls
In Table E.4 in Appendix E, we estimate the regressions in Table 4 including lagged firm characteristics as additional controls. These firm characteristics are Debt Maturity, Market/Book, PPE/Size, Cash Flow/Sales, Cash and Short-term Investments/Total Assets (log), Total Assets in USD (log), ROA Volatility (log), Tax Rate, and Leverage Market Value (Industry Median). The inclusion of the additional controls has no effect on the sample size. Overall, the economic magnitudes and statistical significance of the effects of CDS introduction are preserved, although the interaction term of CDS Introduction with Secured Creditors First loses significance. While many of these firm characteristics are inputs into the overlap weights, we do not observe that the inclusion of these characteristics makes the estimation of differences in outcome variables more efficient.
6.5.3 OLS estimation
Bun and Harrison (2014) show that the ordinary least squares (OLS) estimator of the coefficient of the interaction term between an endogenous regressor and an exogenous covariate is consistent, and asymptotically normally distributed, under typical conditions.28 In our setting, the main variable of interest is the interaction between endogenous (CDS introduction) and exogenous (legal and institutional characteristics) regressors.29 In Table E.5 in Appendix E, we present results analogous to those in Table 4 using OLS, that is, without applying the overlap weights. The sample for the OLS estimation is substantially larger than that in the main tables, since we do not require the joint availability of all lagged firm and country characteristics needed to estimate the overlap weights. Nevertheless, the point estimates of our main interaction terms are similar in terms of signs and significance levels to those in the main tables. The main changes are that the interaction effect with the Corruption variable becomes significant, while Secured Creditors First is now negative and weakly significant.
6.5.4 Exclusion of U.S. firms
The evidence in Table 1 indicates that approximately 40|$\%$| of the CDS introductions in our sample are for U.S. reference entities, for which restructuring has been excluded as a trigger event since the 2009 Big Bang Protocol.30 To highlight the truly global aspects of our main results, as well as to confirm that no-restructuring (XR) CDS contracts are not driving our main findings, we reestimate our tests excluding U.S. firms from the sample.31 Although removing U.S. firms reduces the overall sample size, we are still left with more than 800 CDS introductions and a substantial amount of cross-sectional variation in the sample. We find that the results in the ex-U.S. sample are qualitatively similar to those reported in Table 4, with the sign and significance of the variables of interest comparable to those reported in our main tests. Table E.6 in Appendix E reports these results.
6.5.5 Countries with few CDS introductions
Firms with CDS introductions in countries with very few CDS firms could be large natural monopolies (e.g., electric grids, pipelines, rail systems) and/or large firms that are fully controlled either by the government or with large government ownership stakes. Such CDS firms may be more likely to be bailed out because they are in strategically important industries, bring substantial revenues to the budget from exports and resource exploration concessions, or generally employ large numbers of people. To assess whether such large “national champions” have an important effect on our results, we estimate our panel regressions excluding countries with relatively few CDS introductions, considering alternative thresholds of 1, 2, 3, 4, 8, 12, 16, 20, 24, and 32 CDS firms in a country. Note that as the threshold for the number of CDS introductions increases, we remove from the sample entire countries in which only a few CDS firms exist. Despite the resultant decreases in sample size and cross-section, we find in untabulated results that the effects of CDS introductions are robust to smaller samples that exclude large national champions.
6.5.6 CDS introduction versus CDS existence
As part of the identification strategy, our tests are focused on the introduction of CDSs rather than CDS existence. That is, we distinguish between firm-years in which sample firms had no CDS traded on them and those firm-years in which CDS were first traded on sample firms. This method is similar to the difference-in-differences approach in Saretto and Tookes (2013) that focuses on the years before/after CDS introduction. In contrast, other studies often refer to CDS introduction but actually study CDS existence by simply measuring whether or not a firm has CDS traded on it in a particular year. We investigate whether our (untabulated) results are sensitive to defining our CDS variable as CDS existence as opposed to CDS introduction, and we find that our main results are robust to this alternative approach.
6.5.7 Long-horizon effects
We also consider whether the effect of CDS introductions occurs over a longer horizon, so that a change in leverage would only be observed in later periods. To this end, we estimate the outcome regressions using separate variables for CDS availability in years 1, 2, 3, 4, and 5 or more years, as well as the interaction effects of these variables with the conditioning variables. Our untabulated results show a large, economically and statistically significant effect of CDS availability on leverage in year 1. The size of the coefficient monotonically declines for later periods, with coefficients in years 2 and 3 still statistically significant. Significance for the interaction effects of conditioning variables and CDS availability tends to be concentrated in the immediate next period (i.e., year 1). However, some interaction effects, such as with Restrictions on Entry, are significant also in later periods. Interactions with the property rights variables Law & Order and Political Risk are highly significant for all periods.
6.5.8 Regulatory changes
One of the purposes of the Big Bang and subsequent Small Bang protocols was to reduce legal uncertainty in the CDS market regarding whether a firm’s action could be considered a credit event.32 If the protocols achieved this purpose, then the importance of our proxy for |$\gamma $|, or Restrictions on Entry, should decrease after the Bang protocols are introduced. In addition, this effect should be most cleanly identified in firms outside of North America, since the protocols exclude restructuring as a credit event for North American firms, but still include it as a credit event for firms in other regions.33 Therefore, any reduction in legal uncertainty associated with the Bangs would be more cleanly observed for firms outside North America. To estimate this effect, we create a post-Bang dummy with a value equal to 1 for years after 2008 (and zero otherwise). If the protocols are successful in reducing legal uncertainty, then we would expect the coefficient on the interaction effect of CDS introduction and restrictions on entry to be reduced (or, equivalently, we would expect the triple interaction coefficient to be negative). Furthermore, this effect should be stronger when North American firms are excluded.
The results of our reestimated regression, reported in Table E.7 in Appendix E, are consistent with our conjecture: we find that the coefficient on the triple interaction of CDS Introduction |$\times$| Restrictions on Entry |$\times$| Post-Bang Dummy in this sample is significantly negative, consistent with the views that (1) the Bang protocols reduced legal uncertainty, and (2) Restrictions on Entry is a proxy for legal uncertainty. At the same time, the unconditional CDS introduction effect becomes more significant in the post-Bang period.
7. Conclusion
We analyze the impact of CDS introduction on real decision-making within the firm, taking into consideration features of the local economic and legal environments of firms. We extend the model of Bolton and Oehmke (2011) to incorporate uncertainty regarding whether actions taken by the reference entity will trigger CDS obligations. Our model provides structure to our analysis and generates empirical predictions that we test in a sample of more than 56,000 firms across 51 countries over the period 2001–2015.
Using a novel overlap-weighting method to control for endogenous differences in the samples of firms with and without CDS introductions, we find that after CDS introduction, the affected firms increase leverage in countries with stronger creditor rights along specific dimensions. The first dimension is the case in which creditor consent is required to enter reorganization. This is consistent with the predictions of the model: creditors with CDS protection and control over entry into reorganization have substantially higher bargaining power. Indeed, as noted in Bolton and Oehmke (2011), it is precisely in the setting of private renegotiation where CDS protection increases the bargaining power of creditors. The greater bargaining power of creditors mitigates the limited-commitment problem faced by the firm and allows for higher levels of leverage. The second dimension is the case in which the bankruptcy code requires that secured creditors be paid first out of liquidation proceeds. This is consistent with the model’s prediction that leverage increases more strongly with the introduction of CDSs (and the concomitant enhancement of creditor rights) if liquidation costs are low. Finally, we find that CDS introduction increases leverage more strongly in countries with weaker contract enforceability and in firms where equity ownership is more concentrated.
In robustness checks, we find that the effects of CDSs on leverage, and the influence of the local legal and market environments on those effects, continue to hold in the sample when U.S. firms are excluded, when firms that might be “national champions” are excluded, when additional controls are included in the analysis, when longer-horizon effects on the outcome variable are allowed, when CDS existence (rather than CDS introduction) is considered, and when simulated omitted variables are considered. We also examine whether the Big and Small Bang protocols, introduced in 2009 as a means of reducing legal uncertainty, are associated with a decline in the influence of our proxy for legal uncertainty; we find that they are.
In complementary tests, we find some evidence that the interaction between CDS introduction and local bankruptcy codes influences the investment policies of the firm. Specifically, in cases with creditor restrictions on firms entering reorganization—the circumstance in which leverage increases—the presence of CDS increases the level of capital investment by the firm.
Overall, we find substantial evidence that the introduction of CDSs affects real decisions of nonfinancial firms, including choices regarding leverage and investment. These results are consistent with the inferences drawn in Djankov, McLiesh, and Shleifer (2007) that changes in creditor rights have an economically meaningful effect on aggregate corporate financing. Importantly, we also find that the legal and market environments in which the reference entity operates influence the impact of CDSs. The effect of CDS is larger in countries in which uncertainty about firms’ CDS obligations is reduced and in which CDS mitigate weak property rights. These results highlight the incomplete nature of CDS contracts in global capital markets, a feature the burgeoning academic literature on credit derivatives has largely overlooked. Given the IDSA’s recent wave of credit event definition changes aimed at alleviating legal uncertainty in CDS contracts, the measurement of the extent to which such contractual remedies can effectively restore the hedging efficacy of the global credit derivatives market is an important research subject. We hope to return to this question in subsequent research.
Appendix A. CDS Contracts and the Local Legal Environment
The ISDA Master Agreement and its annexures for CDS contracts standardize definitions and language in order to create a more homogeneous and liquid product and to reduce basis risk and transactions costs. Nevertheless, the specific local legal environment in which a reference entity is headquartered is important for the CDS contract. In effect, the laws to which the reference entity is subject must be mapped to the language used in the CDS contract. Below we describe two recent cases in which an analysis of local law was required in order to determine whether a credit event had occurred.
A.1 Abengoa
Abengoa, a Spanish conglomerate, filed for insolvency relief under a provision of Spanish law in November 2015. The regional Determination Committee (DC), in considering whether a credit event had occurred, sought an analysis of whether the specific provision that Abengoa had triggered (Article 5bis) was relief that was similar to “a judgment of insolvency or bankruptcy,” as the 2014 ISDA Definitions of Credit Events required. In its analysis, the DC noted that Article 5bis provided relief only for certain Abengoa assets, was quite time limited, and suspended enforcement of claims but did not suspend payment obligations. On the basis of this analysis of a specific provision of Spanish insolvency law, the DC determined that no credit event had occurred.34
A.2 Portugal Telecom
In late 2013, Portugal Telecom and a Brazilian telecommunications company, Oi, announced a merger that was subsequently completed in 2014. Portugal Telecom had a financing subsidiary, PTIF, which was a CDS reference entity in Europe. In June 2015, Oi sold Portugal Telecom but retained PTIF. In June 2016, Oi and its subsidiaries filed for reorganization under Brazilian law. The DC considered elements of reorganization law in Brazil in order to assess whether this filing constituted a credit event. They concluded that specific elements of the law, including an automatic stay (allowing the firm relief from its creditors), payment relief during reorganization (combined with the fact that reorganization would take a considerable period of time), and elements of the debt restructuring that were allowed under the reorganization, were similar to a judgment of insolvency or bankruptcy. As a consequence, the DC ruled that a credit event had occurred.
Appendix B. Methodology of the Sensitivity Analysis
This appendix provides a nontechnical description of the methodology used for the sensitivity analysis in the paper.
We adapt and apply the methodology of Ichino, Mealli, and Nannicini (2008) to the setting of overlap weights by Li, Morgan, and Zaslavsky (2018) employed in our paper. As described in Section 5, to use the overlap weight methodology we begin by estimating the propensity of CDS introduction for firm |$i$| in year |$t$| as |$p_{it}(x_{t})=$| Pr (|$Z_{it} = 1| X_{ikt} = x_{t})$|, where |$X_{ikt}$| is a set of |$k$| observed covariates, and |$Z_{it} = 1$| indicates CDS introduction. The observed covariates are firm and country characteristics (e.g., total assets, market-to-book, the creditor rights index, and political risk, etc.). Subsequently, we use the estimated propensities |$p_{it}(x_{t})$| to obtain the overlap weights |$w_{it}$| (defined as |$w_{it}=p_{it}(x_{t})$| for |$Z_{it} = 0$|, and |$w_{it} = 1 - p_{it}(x_{t})$| for |$Z_{it} = 1$|). We then weight the observations in our panel regressions and, in the weighted sample, estimate the treatment effect of CDS introductions.
Propensity-score matching techniques, as well as weighting based on estimated propensities, rely on the assumption of conditional independence or “unconfoundedness” of potential outcomes and treatment assignment, given observable covariates (Rosenbaum (1987); Rosenbaum and Rubin (1985)). The objective of the sensitivity analysis by Ichino, Mealli, and Nannicini (2008) is to assess whether and to what extent the estimated average treatment effects are robust to possible deviations from the conditional independence assumption. To this end, it introduces unobserved confounders |$U_{t}$| into the logit regression (i.e., |$p_{it}(x_{t }, U_{t})=$| Pr |$(Z_{it} = 1| X_{ikt}=x_{t}, U_{t}))$|, and then employs the resultant estimated probabilities for propensity-score matching in order to assess the average treatment effect on the treated. Our overlap weighting approach, in contrast, uses the resultant propensities as balancing weights. However, we can adapt the Ichino, Mealli, and Nannicini (2008) method to overlap weights and assess the influence of deviations from the conditional independence assumption on those results.
The general approach is based on the conjecture that adding one additional covariate, |$U_{t}$|, to a set of observables is needed to satisfy unconfoundedness. While the confounding variable is not observed, it can be simulated. Comparing regression results using overlap weights from propensity estimations with and without the simulated confounder provides evidence on the robustness (or sensitivity) of the set of observables to deviations from the conditional independence assumption. Simulation of the additional variable |$U_{t}$| can be based on alternative distributional assumptions, which depend on the presumed nature of the confounding effects. Generally, the confounding factor is assumed to be binary and independent of the set of observables. Ichino, Mealli, and Nannicini (2008) consider alternatively calibrated and killer confounders.
Calibrated confounders are specified to have an empirical distribution similar to existing observable regressors in the logit regression that generates the input for the balancing weights—that is, calibrated confounders mimic the behavior of important covariates (i.e., total assets, political risk, etc.). Given that the logit regressions to estimate the propensity of CDS introduction have a number of firm-level and country-level covariates, we consider the distribution of each of them in turn to specify the empirical distribution of the simulated confounding variable. Since the unobserved confounder is assumed to be binary, we follow Nannicini (2007) and use binary transformations of continuous covariates, specifically, indicator variables of whether an observation is above or below the median of that variable. Simulations with calibrated confounders assess to what extent the panel regression results are robust to violations of the conditional independence assumption that originate from unobserved confounding factors similar to the ones used to calibrate the confounding variable.
Sensitivity analysis using calibrated confounders is limited by the fact that the distributional properties of the confounding variables are determined by the particular behavior of the set of observed covariates. Therefore, we also generate “killer confounders” to assess whether more extreme unobserved omitted covariates exist that eliminate the treatment effect. This approach specifies a grid of possible parameters that determine the empirical distribution of the confounder in order to capture the characteristics of potential confounders that could drive the estimated treatment effect to zero. As a consequence, killer confounders are designed to capture extreme scenarios that are based purely on statistical possibilities; any parameter sets that kill the treatment effect need to be checked subsequently for plausibility. Sensitivity analysis with killer confounders may confirm the robustness of the baseline results if only very unlikely parameter configurations wipe out the treatment effect.
For each panel regression specification, we simulate 100 iterations of calibrated and killer confounders. For each iteration, we reestimate the propensity of CDS introduction using the set of observed covariates and the simulated unobserved confounder, use the resultant balancing weights to estimate the effect of CDS introductions and their interactions with conditioning variables on the outcome variable, and report the minimum and maximum coefficients for the interaction variables across calibrated and killer confounders.
Appendix C. Derivation of Proposition 1
For |$\gamma N \ge q\lambda C_2^H$| and/or |$N \ge q\lambda C_2^L $|, where |$\tilde {F}_C^i \ge F_C^i $| for |$\forall i=L,H$|, we define the firm’s net improvement in its debt value due to CDS as |$\Delta B \equiv B_{CDS} - B$|. As CDS are written on the existing debt obligations, we consider only the case in which debt financing is feasible in the absence of CDS (|$B > 0$|). Hence, we focus on the case |$F \le F_C^H \equiv \bar {F}$|.
It follows that |$\left( {\frac{\partial \Delta B}{\partial \gamma } \ge 0} \right)$|, |$\left( {\frac{\partial \Delta B}{\partial S} > 0} \right)$|, |$\left( {\frac{\partial \Delta B}{\partial \lambda } < 0} \right)$|, and |$\left( {\frac{\partial \Delta B}{\partial q} < 0} \right)$|.|$\blacksquare$|
Appendix D
Variable definitions
| Variable Name | Definition |
|---|---|
| Firm Characteristics | |
| Cash Flow/Sales | Cash Flow/Sales |
| Convertible Debt/Size | Convertible Debt / SizeMarketValue |
| Debt Maturity | [LongTermDebt (due more than 1 year) |$+$| PreferredStock] / TotalDebtAndPreferredStock |
| Dividend | Dummy variable with value 1 if a dividend was paid; 0 otherwise |
| Free Cash Flow/Total Assets | (FundsFromOperations - CapitalExpenditures - CashDividendsPaidTotal) / TotalAssets |
| Gross Profit Margin (3y) | Average of up to 3 years of GrossProfitMargin |
| Leverage Market Value | TotalDebtAndPreferredStock / TotalAssetsMarketValue |
| Leverage Market Value | |
| (Industry Median) | TotalDebtAndPreferredStock / TotalAssetsMarketValue, Industry median |
| Age (log) | Natural logarithm of Age |
| ROA Volatility (log) | Natural logarithm of ROAVolatility |
| Total Assets in USD (log) | Natural logarithm of TotalAssetsUSD |
| Market/Book | MarketValue/(CommonEquity |$+$| DeferredTaxes) |
| Net FX-Exposure | Foreign Sales - Foreign Assets (missing values set to zero) |
| PPE (Net)/Size | PPENet / SizeMarketValue |
| Return On Assets (3y) | Average of up to 3 years of ReturnOnAssets |
| Tax Rate | Tax Rate |
| Tobin’s Q | SizeMarketValue / TotalAssets |
| Return Volatility in LC (log) | Natural logarithm of volatility of weekly stock returns in local currency |
| Return Volatility in USD (log) | Natural logarithm of volatility of weekly stock returns in USD |
| Capital Expenditures/Total Assets | CapitalExpenditures / TotalAssets (missing values set to zero) |
| R&D/Total Assets | ResearchDevelopment / TotalAssets (missing values set to zero) |
| Cash and Short-term Investments/ | |
| Total Assets (log) | Natural logarithm of Cash and Short-term Investments to Total Assets |
| R&D Share | R&D/(R&D |$+$| Capital Expenditures), with R&D Share set to zero if R&D and Capital Expenditures are both zero. |
| Idiosyncratic Risk in LC (log) | Natural logarithm of the annualized volatility of the residual from a regression of weekly stock returns in local currency on local and global market index returns |
| Closely Held Shares | Percentage of shares held by insiders. |
| Country Characteristics | |
| Creditor Rights | Creditor rights aggregate score (from Djankov et al., 2007) |
| Restrictions on Entry | Restrictions on the borrower entering reorganization without the creditors’ consent (from Djankov et al., 2007) |
| No Automatic Stay on Assets | No automatic stay or asset freeze to protect the firm from creditors (from Djankov et al., 2007) |
| Management Does Not Stay | Restrictions on current management administering the assets while in reorganization (from Djankov et al., 2007) |
| Secured Creditors First | Priority of secured creditors in payments resulting from liquidation (from Djankov et al., 2007) |
| Law & Order | A measure of the strength and impartiality of the legal system as well as popular observance of the law source: PRS Group |
| Corruption | A measure of corruption within the political system that can threaten foreign investment source: PRS Group |
| Political Risk | Degree of political stability within the country, using a variety of measures source: PRS Group |
| Domestic Credit to Private Sector | Ratio of private credit from banks to GDP source: World Bank |
| Private Credit | Ratio of total credit in the nonfinancial sector to GDP source: Bank for International Settlements |
| CDS Market | Ratio of total stock market capitalization of CDS firms to GDP |
| Stock Market | Ratio of stock market capitalization to GDP source: World Bank |
| Private Bond Market | Ratio of private bond market capitalization to GDP source: World Bank |
The table shows the definitions of the main firm and country characteristics used in the study.
Appendix E. Additional Tests
Summary statistics of variables
| A. Summary statistics | ||||||||
|---|---|---|---|---|---|---|---|---|
| (1) | (2) | (3) | (4) | (5) | (6) | (7) | (8) | |
| Percentiles | ||||||||
| Observations | Mean | Std. Dev. | Minimum | p25 | p50 | p75 | Maximum | |
| Firm Characteristics | ||||||||
| Cash Flow/Sales | 380,555 | –0.14 | 0.78 | –3.11 | 0.01 | 0.07 | 0.14 | 0.38 |
| Convertible Debt/Size | 260,840 | 0.00 | 0.01 | 0.00 | 0.00 | 0.00 | 0.00 | 0.05 |
| Debt Maturity | 342,920 | 0.50 | 0.36 | 0.00 | 0.14 | 0.53 | 0.84 | 1.00 |
| Dividend | 416,784 | 0.48 | 0.50 | 0.00 | 0.00 | 0.00 | 1.00 | 1.00 |
| Free Cash Flow/Total Assets | 409,355 | –0.07 | 0.23 | –0.84 | –0.09 | 0.00 | 0.05 | 0.15 |
| Gross Profit Margin (3y) | 386,086 | 0.20 | 0.33 | –0.87 | 0.11 | 0.22 | 0.38 | 0.69 |
| Leverage Market Value | 344,268 | 0.18 | 0.18 | 0.00 | 0.01 | 0.13 | 0.30 | 0.56 |
| Leverage Market Value (Industry Median) | 416,784 | 0.13 | 0.08 | 0.00 | 0.05 | 0.13 | 0.19 | 0.28 |
| Age (log) | 416,752 | 2.03 | 1.08 | 0.00 | 1.39 | 2.30 | 2.83 | 3.95 |
| ROA Volatility (log) | 293,866 | –3.00 | 1.27 | –5.07 | –3.95 | –3.13 | –2.15 | –0.41 |
| Total Assets in USD (log) | 416,760 | 18.27 | 2.24 | 13.76 | 16.83 | 18.32 | 19.83 | 22.31 |
| Market/Book | 343,708 | 2.17 | 2.26 | 0.27 | 0.72 | 1.33 | 2.60 | 9.14 |
| Net FX-Exposure | 416,784 | 0.08 | 0.22 | –0.74 | 0.00 | 0.00 | 0.01 | 0.98 |
| PPE (Net)/Size | 368,729 | 0.37 | 0.37 | 0.00 | 0.06 | 0.25 | 0.58 | 1.27 |
| Return On Assets (3y) | 375,617 | –0.06 | 0.27 | –0.94 | –0.05 | 0.03 | 0.08 | 0.19 |
| Tax Rate | 242,250 | 0.29 | 0.17 | 0.00 | 0.18 | 0.29 | 0.39 | 0.66 |
| Tobin’s Q | 371,913 | 1.59 | 1.74 | 0.31 | 0.61 | 0.93 | 1.67 | 7.40 |
| Return Volatility in LC (log) | 364,728 | –0.71 | 0.60 | –1.71 | –1.16 | –0.75 | –0.30 | 0.47 |
| Return Volatility in USD (log) | 361,711 | –0.665 | 0.59 | –1.65 | –1.11 | –0.71 | –0.26 | 0.50 |
| Capital Expenditures/Total Assets | 416,784 | 0.05 | 0.06 | 0.00 | 0.01 | 0.03 | 0.07 | 0.21 |
| R&D/Total Assets | 416,784 | 0.02 | 0.04 | 0.00 | 0.00 | 0.00 | 0.01 | 0.15 |
| Cash and Short-term Investments/Total Assets (log) | 413,586 | –2.25 | 1.54 | –5.56 | –3.23 | –2.10 | –1.09 | 0.00 |
| R&D Share | 416,784 | 0.15 | 0.28 | 0.00 | 0.00 | 0.00 | 0.13 | 1.00 |
| Idiosyncratic Risk in LC (log) | 360,292 | –0.82 | 0.63 | –1.89 | –1.30 | –0.87 | –0.39 | 0.42 |
| Closely Held Shares | 416,338 | 0.44 | 0.23 | 0.02 | 0.27 | 0.44 | 0.60 | 0.88 |
| Country Characteristics | ||||||||
| Creditor Rights | 415,811 | 2.00 | 1.02 | 0.00 | 1.00 | 2.00 | 3.00 | 4.00 |
| Restrictions on Entry | 415,811 | 0.25 | 0.44 | 0.00 | 0.00 | 0.00 | 1.00 | 1.00 |
| No Automatic Stay | 415,811 | 0.32 | 0.47 | 0.00 | 0.00 | 0.00 | 1.00 | 1.00 |
| Management Does Not Stay | 415,811 | 0.53 | 0.50 | 0.00 | 0.00 | 1.00 | 1.00 | 1.00 |
| Secured Creditors First | 415,811 | 0.90 | 0.31 | 0.00 | 1.00 | 1.00 | 1.00 | 1.00 |
| Law & Order | 415,905 | 4.85 | 0.88 | 1.00 | 5.00 | 5.00 | 5.00 | 6.00 |
| Corruption | 415,905 | 3.69 | 1.01 | 1.00 | 3.00 | 4.00 | 4.50 | 6.00 |
| Political Risk | 415,905 | 78.48 | 8.64 | 44.00 | 76.50 | 80.50 | 84.00 | 97.00 |
| Domestic Credit to Private Sector | 393,829 | 133.80 | 53.88 | 8.77 | 96.44 | 137.10 | 182.40 | 233.70 |
| Private Credit | 378,638 | 146.30 | 48.16 | 16.80 | 130.30 | 157.30 | 175.00 | 462.10 |
| CDS Market | 416,784 | 24.82 | 4.64 | 0.00 | 24.19 | 25.22 | 27.33 | 28.27 |
| Stock Market | 393,829 | 108.50 | 73.62 | 7.27 | 68.58 | 103.40 | 126.70 | 569.50 |
| Private Bond Market | 375,411 | 47.82 | 35.90 | 0.01 | 17.28 | 38.36 | 65.15 | 193.40 |
| B. Correlations | |||||||||||||
|---|---|---|---|---|---|---|---|---|---|---|---|---|---|
| Creditor Rights | Restrictions on Entry | No Automatic Stay on Assets | Management Does Not Stay | Secured Creditors First | Law & Order | Corruption | Political Risk | Domestic Credit to Private Sector | Private Credit | CDS Market | Stock Market | Private Bond Market | |
| Restrictions on Entry | 0.504 | ||||||||||||
| No Automatic Stay | 0.791 | 0.272 | |||||||||||
| Management Does Not Stay | 0.689 | 0.017 | 0.391 | ||||||||||
| Secured Creditors First | 0.281 | –0.185 | 0.084 | 0.042 | |||||||||
| Law & Order | 0.023 | –0.278 | 0.087 | –0.012 | 0.356 | ||||||||
| Corruption | –0.040 | –0.305 | 0.113 | –0.116 | 0.317 | 0.724 | |||||||
| Political Risk | –0.024 | –0.425 | 0.085 | 0.041 | 0.328 | 0.790 | 0.767 | ||||||
| Domestic Credit to Private Sector | –0.045 | –0.336 | –0.134 | 0.031 | 0.478 | 0.477 | 0.445 | 0.575 | |||||
| Private Credit | 0.128 | –0.319 | 0.151 | 0.181 | 0.373 | 0.667 | 0.623 | 0.710 | 0.727 | ||||
| CDS Market | –0.113 | –0.189 | –0.129 | –0.107 | 0.264 | 0.393 | 0.319 | 0.368 | 0.550 | 0.388 | |||
| Stock Market | 0.340 | 0.245 | 0.284 | 0.057 | 0.270 | 0.182 | 0.260 | 0.226 | 0.346 | 0.372 | 0.161 | ||
| Private Bond Market | –0.407 | –0.476 | –0.227 | –0.353 | 0.205 | 0.328 | 0.269 | 0.358 | 0.608 | 0.343 | 0.431 | 0.003 | |
| Closely Held Shares | 0.150 | 0.236 | 0.139 | 0.120 | –0.244 | –0.301 | –0.268 | –0.325 | –0.346 | –0.280 | –0.189 | –0.024 | –0.281 |
The table reports summary statistics of the main variables used in the study (panel A) and their correlations (panel B). The sample consists of an unbalanced panel of more than 56,000 nonfinancial firms across 51 countries over the period 2001–2015. Market data are from Datastream; accounting data are from WorldScope; and CDS data are from Markit. All variables are defined in Appendix D.
Firm- and country-level characteristics with imposition of overlap weights
| Treated | Control | Expected Absolute | ||||
|---|---|---|---|---|---|---|
| (|$N = 784$|) | (|$N=$| 80,038) | Density Deviation | ||||
| Mean | Std. Err. | Mean | Std. Err. | |$\%$| Bias | (EADD) | |
| Firm Characteristics | ||||||
| Cash Flow/Sales | 0.149 | 0.004 | 0.149 | 0.002 | 0|$\%$| | 0.024 |
| Convertible Debt/Size | 0.010 | 0.001 | 0.010 | 0.000 | 0|$\%$| | 0.001 |
| Debt Maturity | 0.751 | 0.009 | 0.751 | 0.003 | 0|$\%$| | 0.101 |
| Dividend | 0.836 | 0.013 | 0.836 | 0.005 | 0|$\%$| | 0.002 |
| Free Cash Flow/Total Assets | 0.024 | 0.002 | 0.024 | 0.001 | 0|$\%$| | –0.002 |
| Gross Profit Margin (3y) | 0.305 | 0.006 | 0.305 | 0.003 | 0|$\%$| | 0.046 |
| Leverage Market Value | 0.239 | 0.005 | 0.239 | 0.003 | 0|$\%$| | 0.043 |
| Leverage Market Value | ||||||
| (Industry Median) | 0.165 | 0.003 | 0.165 | 0.001 | 0|$\%$| | 0.017 |
| Age (log) | 2.761 | 0.029 | 2.761 | 0.011 | 0|$\%$| | 0.365 |
| ROA Volatility (log) | –3.881 | 0.032 | –3.881 | 0.014 | 0|$\%$| | –0.428 |
| Total Assets in USD (log) | 21.716 | 0.025 | 21.716 | 0.007 | 0|$\%$| | 3.102 |
| Market/Book | 2.440 | 0.069 | 2.440 | 0.032 | 0|$\%$| | 0.507 |
| Net FX-Exposure | 0.122 | 0.009 | 0.122 | 0.003 | 0|$\%$| | 0.031 |
| PPE (Net)/Size | 0.395 | 0.011 | 0.395 | 0.004 | 0|$\%$| | 0.051 |
| Return On Assets (3y) | 0.063 | 0.002 | 0.063 | 0.001 | 0|$\%$| | 0.006 |
| Tax Rate | 0.339 | 0.005 | 0.339 | 0.002 | 0|$\%$| | 0.049 |
| Tobin’s Q | 1.301 | 0.032 | 1.301 | 0.014 | 0|$\%$| | 0.344 |
| Return Volatility in LC (log) | –1.141 | 0.013 | –1.141 | 0.006 | 0|$\%$| | –0.104 |
| Return Volatility in USD (log) | –1.101 | 0.014 | –1.101 | 0.006 | 0|$\%$| | –0.123 |
| Capital Expenditures/Total Assets | 0.060 | 0.002 | 0.060 | 0.001 | 0|$\%$| | 0.013 |
| R&D/Total Assets | 0.013 | 0.001 | 0.013 | 0.000 | 0|$\%$| | 0.005 |
| Cash and Short-term Investments/ | ||||||
| Total Assets (log) | –2.683 | 0.047 | –2.683 | 0.019 | 0|$\%$| | –0.327 |
| Closely Held Shares | –0.564 | 0.036 | –0.564 | 0.015 | 0|$\%$| | –0.025 |
| Country Characteristics | ||||||
| Restrictions on Entry | –0.168 | 0.033 | –0.168 | 0.012 | 0|$\%$| | 0.002 |
| No Automatic Stay | –0.259 | 0.032 | –0.259 | 0.011 | 0|$\%$| | 0.003 |
| Management Does Not Stay | –0.118 | 0.036 | –0.118 | 0.015 | 0|$\%$| | 0.001 |
| Secured Creditors First | 0.079 | 0.033 | 0.079 | 0.011 | 0|$\%$| | –0.003 |
| Law & Order | 0.174 | 0.036 | 0.174 | 0.016 | 0|$\%$| | 0.119 |
| Corruption | 0.063 | 0.030 | 0.063 | 0.013 | 0|$\%$| | 0.123 |
| Political Risk | 0.337 | 0.031 | 0.337 | 0.012 | 0|$\%$| | –0.042 |
| Domestic Credit to Private Sector | 0.293 | 0.036 | 0.293 | 0.012 | 0|$\%$| | –0.046 |
| Private Credit | –0.005 | 0.032 | –0.005 | 0.011 | 0|$\%$| | –0.053 |
| CDS Market | 0.194 | 0.034 | 0.194 | 0.010 | 0|$\%$| | –0.027 |
| Stock Market | 0.038 | 0.037 | 0.038 | 0.011 | 0|$\%$| | 0.140 |
| Private Bond Market | 0.278 | 0.038 | 0.278 | 0.015 | 0|$\%$| | 0.010 |
The table compares firm- and country-level characteristics between firm-years with CDS introductions (Treated) and without CDS introductions (Control) in the prior year. It shows the mean and standard errors for treated and control firms, the percentage bias according to Rosenbaum and Rubin (1985), and the expected absolute density deviation (EADD), defined as |$\int x | f_{treated} \left( x \right) - f_{control} \left( x \right)| dx$| for all control variables. The sample consists of an unbalanced panel of more than 56,000 nonfinancial firms across 51 countries over the period 2001–2015. Market data are from Datastream; accounting data are from WorldScope; and CDS data are from Markit. The sample is limited to firm-year observations for which all reported firm- and country-level variables are jointly available. Observations are weighted using overlap weights (Li, Morgan, and Zaslavsky 2018). All variables are defined in Appendix D.
Effects of CDS on capital investment
| (1) | (2) | (3) | (4) | (5) | (6) | (7) | (8) | (9) | (10) | |
|---|---|---|---|---|---|---|---|---|---|---|
| Creditor Rights | Property Rights | |||||||||
| Baseline | Creditor Rights | Restriction on Entry | No Automatic Stay | Management Does Not Stay | Secured Creditors First | Law & Order | Corruption | Risk | Political Closely Held Shares | |
| CDS Introduction |$\times$| Conditioning Variable | 0.0031* | 0.0053*** | 0.0031 | –0.0006 | 0.0017 | –0.0008 | –0.0003 | –0.0046 | 0.0023 | |
| (0.0016) | (0.0020) | (0.0019) | (0.0016) | (0.0019) | (0.0019) | (0.0024) | (0.0028) | (0.0018) | ||
| Conditioning Variable | –0.0007 | –0.0010 | –0.0015 | –0.0000 | 0.0007 | –0.0031*** | –0.0016 | –0.0041** | 0.0017 | |
| (0.0010) | (0.0012) | (0.0011) | (0.0011) | (0.0009) | (0.0011) | (0.0013) | (0.0017) | (0.0011) | ||
| CDS Introduction | 0.0012 | 0.0019 | 0.0021 | 0.0020 | 0.0011 | 0.0011 | 0.0013 | 0.0012 | 0.0028 | 0.0025 |
| (0.0017) | (0.0017) | (0.0017) | (0.0017) | (0.0016) | (0.0017) | (0.0018) | (0.0017) | (0.0021) | (0.0021) | |
| Year Fixed Effects | Yes | Yes | Yes | Yes | Yes | Yes | Yes | Yes | Yes | Yes |
| Industry Fixed Effects | Yes | Yes | Yes | Yes | Yes | Yes | Yes | Yes | Yes | Yes |
| Clustered Standard Errors | Firm | Firm | Firm | Firm | Firm | Firm | Firm | Firm | Firm | Firm |
| Observations | 80,822 | 80,822 | 80,822 | 80,822 | 80,822 | 80,822 | 80,822 | 80,822 | 80,822 | 80,822 |
| Adj. |$R$|-Squared | 0.263 | 0.265 | 0.266 | 0.264 | 0.264 | 0.265 | 0.268 | 0.264 | 0.274 | 0.267 |
The table shows the average treatment effect of CDS introductions on the capital investment (defined as capital expenditures divided by total assets) of the treated firms (ATET) using overlap weights (Li, Morgan, and Zaslavsky 2018). The treatment is the introduction of CDS (i.e., only the first year of CDS trading for each firm). The regressions further include CDS interaction effects with lagged (standardized) conditioning variables, as well as the lagged conditioning variables themselves. The use of overlap weights ensures that covariates are perfectly balanced between treated firms and control firms in the year before treatment (see Table E.2 in Appendix E). Conditioning variables are grouped into three categories: (1) creditor rights, (2) property rights, and (3) equity ownership concentration. For creditor rights, we use an aggregate index (Creditor Rights) as well as its four subindexes, namely, restrictions on a firm entering reorganization without creditors’ consent (Restrictions on Entry); no automatic stay or asset freeze (No Automatic Stay); restriction on management’s administration of a firm’s assets pending resolution of the reorganization (Management Does Not Stay); and payment of secured creditors first out of any liquidation proceeds (Secured Creditors First). For property rights, we consider the following three measures: Law & Order, Corruption, and Political Risk, where higher index values indicate stronger protection for private properties. For equity ownership concentration, we use the percentage of closely held shares (Closely Held Shares). All regressions include year and Fama-French 48-industry fixed effects. Standard errors are clustered at the firm level and are reported in parentheses. The sample consists of an unbalanced panel of more than 56,000 nonfinancial firms across 51 countries over the period 2001–2015. Market data are from Datastream; accounting data are from WorldScope; and CDS data are from Markit. All variables are defined in Appendix D. *|$p <.1$|; **|$p <.05$|; ***|$p <.01$|.
Robustness tests
| (1) | (2) | (3) | (4) | (5) | (6) | (7) | (8) | (9) | (10) | |
|---|---|---|---|---|---|---|---|---|---|---|
| Creditor Rights | Property Rights | |||||||||
| Baseline | Creditor Rights | Restriction on Entry | No Automatic Stay | Management Does Not Stay | Secured Creditors First | Law & Order | Corruption | Political Risk | Closely Held Shares | |
| CDS Introduction |$\times$| Conditioning Variable | 0.0048 | 0.0146** | –0.0003 | –0.0056 | 0.0105 | –0.0138** | –0.0065 | –0.0280*** | 0.0132** | |
| (0.0048) | (0.0059) | (0.0059) | (0.0051) | (0.0064) | (0.0055) | (0.0067) | (0.0068) | (0.0053) | ||
| Conditioning Variable | –0.0026 | –0.0042 | –0.0036 | 0.0075** | –0.0127*** | –0.0022 | –0.0132*** | 0.0016 | 0.0112*** | |
| (0.0029) | (0.0035) | (0.0034) | (0.0038) | (0.0033) | (0.0030) | (0.0036) | (0.0040) | (0.0030) | ||
| CDS Introduction | 0.0127** | 0.0137*** | 0.0151*** | 0.0126** | 0.0120** | 0.0118** | 0.0150*** | 0.0131** | 0.0221*** | 0.0201*** |
| (0.0050) | (0.0051) | (0.0051) | (0.0052) | (0.0051) | (0.0051) | (0.0052) | (0.0051) | (0.0056) | (0.0063) | |
| Firm Controls | Yes | Yes | Yes | Yes | Yes | Yes | Yes | Yes | Yes | Yes |
| Year Fixed Effects | Yes | Yes | Yes | Yes | Yes | Yes | Yes | Yes | Yes | Yes |
| Industry Fixed Effects | Yes | Yes | Yes | Yes | Yes | Yes | Yes | Yes | Yes | Yes |
| Clustered Standard Errors | Firm | Firm | Firm | Firm | Firm | Firm | Firm | Firm | Firm | Firm |
| Observations | 80,501 | 80,501 | 80,501 | 80,501 | 80,501 | 80,501 | 80,501 | 80,501 | 80,501 | 80,501 |
| Adj. |$R$|-Squared | 0.341 | 0.341 | 0.343 | 0.341 | 0.342 | 0.344 | 0.345 | 0.348 | 0.349 | 0.354 |
The table shows the average treatment effect of CDS introductions on the market leverage of the treated firms (ATET) using overlap weights (Li, Morgan, and Zaslavsky 2018). Market leverage is defined as the sum of total debt and preferred stock divided by market value of total assets. The treatment is the introduction of CDS (i.e., only the first year of CDS trading for each firm). The regressions further include CDS interaction effects with lagged (standardized) conditioning variables, as well as the lagged conditioning variables themselves and lagged firm characteristics. The use of overlap weights ensures that covariates are perfectly balanced between treated firms and control firms in the year before treatment (see Table E.2 in Appendix E). Conditioning variables are grouped into three categories: (1) creditor rights, (2) property rights, and (3) equity ownership concentration. For creditor rights, we use an aggregate index (Creditor Rights) as well as its four subindexes, namely, restrictions on a firm entering reorganization without creditors’ consent (Restrictions on Entry); no automatic stay or asset freeze (No Automatic Stay); restriction on management’s administration of a firm’s assets pending resolution of the reorganization (Management Does Not Stay); and payment of secured creditors first out of any liquidation proceeds (Secured Creditors First). For property rights, we consider the following three measures: Law & Order, Corruption, and Political Risk, where higher index values indicate stronger protection for private properties. For equity ownership concentration, we use the percentage of closely held shares (Closely Held Shares). Lagged firm characteristics are Debt Maturity, Market/Book, PPE/Size, Cash Flow/Sales, Cash and Short-term Investments/Total Assets (log), Total Assets in USD (log), ROA Volatility (log), Tax Rate, and Leverage Market Value (Industry Median). All regressions also include year and Fama-French 48-industry fixed effects. Standard errors are clustered at the firm level and are reported in parentheses. The sample consists of an unbalanced panel of more than 56,000 nonfinancial firms across 51 countries over the period 2001–2015. Market data are from Datastream; accounting data are from WorldScope; and CDS data are from Markit. All variables are defined in Appendix D. *|$p <.1$|; **|$p <.05$|; ***|$p <.01$|.
OLS regressions of CDS effects
| (1) | (2) | (3) | (4) | (5) | (6) | (7) | (8) | (9) | (10) | |
|---|---|---|---|---|---|---|---|---|---|---|
| Creditor Rights | Property Rights | |||||||||
| Baseline | Creditor Rights | Restriction on Entry | No Automatic Stay | Management Does Not Stay | Secured Creditors First | Law & Order | Corruption | Political Risk | Closely Held Shares | |
| CDS Introduction |$\times$| | ||||||||||
| Conditioning Variable | 0.0048 | 0.0122** | –0.0006 | 0.0057 | –0.0096* | –0.0160*** | –0.0182*** | –0.0186*** | 0.0227*** | |
| (0.0046) | (0.0055) | (0.0053) | (0.0046) | (0.0058) | (0.0047) | (0.0058) | (0.0059) | (0.0047) | ||
| Conditioning Variable | 0.0057*** | 0.0038*** | 0.0026*** | 0.0059*** | 0.0002 | –0.0067*** | –0.0123*** | –0.0077*** | 0.0080*** | |
| (0.0009) | (0.0010) | (0.0010) | (0.0011) | (0.0009) | (0.0010) | (0.0010) | (0.0010) | (0.0009) | ||
| CDS Introduction | 0.0358*** | 0.0376*** | 0.0385*** | 0.0361*** | 0.0371*** | 0.0368*** | 0.0391*** | 0.0365*** | 0.0421*** | 0.0514*** |
| (0.0048) | (0.0049) | (0.0049) | (0.0050) | (0.0048) | (0.0049) | (0.0049) | (0.0048) | (0.0053) | (0.0059) | |
| Firm Controls | Yes | Yes | Yes | Yes | Yes | Yes | Yes | Yes | Yes | Yes |
| Year Fixed Effects | Yes | Yes | Yes | Yes | Yes | Yes | Yes | Yes | Yes | Yes |
| Industry Fixed Effects | Yes | Yes | Yes | Yes | Yes | Yes | Yes | Yes | Yes | Yes |
| Clustered Standard Errors | Firm | Firm | Firm | Firm | Firm | Firm | Firm | Firm | Firm | Firm |
| Observations | 108,844 | 108,844 | 108,844 | 108,844 | 108,844 | 108,844 | 108,844 | 108,844 | 108,844 | 108,844 |
| Adj. |$R$|-Squared | 0.225 | 0.226 | 0.225 | 0.225 | 0.226 | 0.225 | 0.226 | 0.229 | 0.226 | 0.227 |
The table shows the results from OLS regressions of market leverage on CDS introductions (i.e., only the first year of CDS trading for each firm) and their interaction effects with lagged (standardized) conditioning variables, as well as the lagged conditioning variables themselves and lagged firm characteristics. Market leverage is defined as the sum of total debt and preferred stock divided by the market value of total assets. Conditioning variables are grouped into three categories: (1) creditor rights, (2) property rights, and (3) equity ownership concentration. For creditor rights, we use an aggregate index (Creditor Rights) as well as its four subindexes, namely, restrictions on a firm entering reorganization without creditors’ consent (Restrictions on Entry); no automatic stay or asset freeze (No Automatic Stay); restriction on management’s administration of a firm’s assets pending resolution of the reorganization (Management Does Not Stay); and payment of secured creditors first out of any liquidation proceeds (Secured Creditors First). For property rights, we consider the following three measures: Law & Order, Corruption, and Political Risk, where higher index values indicate stronger protection for private properties. For equity ownership concentration, we use the percentage of closely held shares (Closely Held Shares). The lagged firm characteristics are Debt Maturity, Market/Book, PPE/Size, Cash Flow/Sales, Cash and Short-term Investments/Total Assets (log), Total Assets in USD (log), ROA Volatility (log), Tax Rate, and Leverage Market Value (Industry Median). All regressions also include year and Fama-French 48-industry fixed effects. Standard errors are clustered at the firm level and are reported in parentheses. The sample consists of an unbalanced panel of more than 56,000 nonfinancial firms across 51 countries over the period 2001–2015. Market data are from Datastream; accounting data are from WorldScope; and CDS data are from Markit. All variables are defined in Appendix D. *|$p <.1$|; **|$p <.05$|; ***|$p <.01$|.
Results excluding U.S. firms
| (1) | (2) | (3) | (4) | (5) | (6) | (7) | (8) | (9) | (10) | |
|---|---|---|---|---|---|---|---|---|---|---|
| Creditor Rights | Property Rights | |||||||||
| Baseline | Creditor Rights | Restriction on Entry | No Automatic Stay | Management Does Not Stay | Secured Creditors First | Law & Order | Corruption | Political Risk | Closely Held Shares | |
| CDS Introduction |$\times$| | ||||||||||
| Conditioning Variable | 0.0095 | 0.0190*** | –0.0021 | –0.0083 | 0.0149** | –0.0185*** | –0.0080 | –0.0286*** | 0.0218*** | |
| (0.0069) | (0.0070) | (0.0070) | (0.0086) | (0.0065) | (0.0064) | (0.0080) | (0.0077) | (0.0075) | ||
| Conditioning Variable | –0.0146*** | –0.0206*** | –0.0064 | 0.0007 | –0.0083** | 0.0030 | –0.0094** | 0.0037 | –0.0000 | |
| (0.0039) | (0.0043) | (0.0044) | (0.0051) | (0.0034) | (0.0038) | (0.0041) | (0.0049) | (0.0041) | ||
| CDS Introduction | 0.0115 | 0.0099 | 0.0104 | 0.0115 | 0.0150* | 0.0125* | 0.0103 | 0.0104 | 0.0196*** | 0.0172** |
| (0.0070) | (0.0073) | (0.0070) | (0.0070) | (0.0082) | (0.0070) | (0.0070) | (0.0070) | (0.0075) | (0.0075) | |
| Year Fixed Effects | Yes | Yes | Yes | Yes | Yes | Yes | Yes | Yes | Yes | Yes |
| Industry Fixed Effects | Yes | Yes | Yes | Yes | Yes | Yes | Yes | Yes | Yes | Yes |
| Clustered Standard Errors | Firm | Firm | Firm | Firm | Firm | Firm | Firm | Firm | Firm | Firm |
| Observations | 65,947 | 65,947 | 65,947 | 65,947 | 65,947 | 65,947 | 65,947 | 65,947 | 65,947 | 65,947 |
| Adj. |$R$|-Squared | 0.207 | 0.212 | 0.216 | 0.209 | 0.208 | 0.210 | 0.212 | 0.213 | 0.217 | 0.214 |
The table shows the average treatment effect of CDS introductions for non-US firms on the market leverage (defined as the sum of total debt and preferred stock divided by the market value of total assets) of the treated firms (ATET) using overlap weights (Li, Morgan, and Zaslavsky 2018). The treatment is the introduction of CDS (i.e., only the first year of CDS trading for each firm). The regressions further include CDS interaction effects with lagged (standardized) conditioning variables, as well as the lagged conditioning variables themselves. The use of overlap weights ensures that covariates are perfectly balanced between treated firms and control firms in the year before treatment (see Table E.2 in Appendix E). Conditioning variables are grouped into three categories: (1) creditor rights, (2) property rights, and (3) equity ownership concentration. For creditor rights, we use an aggregate index (Creditor Rights) as well as its four subindexes, namely, restrictions on a firm entering reorganization without creditors’ consent (Restrictions on Entry); no automatic stay or asset freeze (No Automatic Stay); restriction on management’s administration of a firm’s assets pending resolution of the reorganization (Management Does Not Stay); and payment of secured creditors first out of any liquidation proceeds (Secured Creditors First). For property rights, we consider the following three measures: Law & Order, Corruption, and Political Risk, where higher index values indicate stronger protection for private properties. For equity ownership concentration, we use the percentage of closely held shares (Closely Held Shares). All regressions include year and Fama-French 48-industry fixed effects. Standard errors are clustered at the firm level and are reported in parentheses. The sample consists of an unbalanced panel of nonfinancial firms across 50 countries over the period 2001–2015. Market data are from Datastream; accounting data are from WorldScope; and CDS data are from Markit. All variables are defined in Appendix D. *|$p <.1$|; **|$p <.05$|; ***|$p <.01$|.
Role of the bang protocols on the effect on leverage of a CDS introduction
| A. Full sample | ||||||
|---|---|---|---|---|---|---|
| (1) | (2) | (3) | (4) | (5) | (6) | |
| Creditor Rights | ||||||
| Baseline | Creditor Rights | Restriction on Entry | No Automatic Stay | Management Does Not Stay | Secured Creditors First | |
| CDS Introduction |$\times$| Conditioning Variable |$\times$| | ||||||
| Post-Bang Dummy | 0.0148 | –0.0272 | 0.0233 | 0.0387* | 0.0136 | |
| (0.0173) | (0.0224) | (0.0212) | (0.0221) | (0.0141) | ||
| CDS Introduction |$\times$| Conditioning Variable | 0.0024 | 0.0196*** | –0.0059 | –0.0100* | 0.0096 | |
| (0.0059) | (0.0071) | (0.0068) | (0.0059) | (0.0065) | ||
| CDS Introduction |$\times$| Post-Bang Dummy | 0.0149 | 0.0155 | 0.0115 | 0.0146 | 0.0197 | 0.0152 |
| (0.0222) | (0.0222) | (0.0221) | (0.0217) | (0.0223) | (0.0221) | |
| Post-Bang Dummy |$\times$| Conditioning Variable | 0.0033 | 0.0144** | 0.0098* | –0.0117** | 0.0024 | |
| (0.0051) | (0.0061) | (0.0053) | (0.0059) | (0.0047) | ||
| Conditioning Variable | –0.0007 | –0.0144*** | 0.0005 | 0.0126*** | –0.0084** | |
| (0.0034) | (0.0041) | (0.0040) | (0.0041) | (0.0033) | ||
| Post-Bang Dummy | –0.0081 | –0.0074 | –0.0057 | –0.0057 | –0.0092 | –0.0081 |
| (0.0060) | (0.0060) | (0.0059) | (0.0056) | (0.0060) | (0.0058) | |
| CDS Introduction | 0.0113* | 0.0118* | 0.0148** | 0.0096 | 0.0102* | 0.0105* |
| (0.0059) | (0.0061) | (0.0061) | (0.0061) | (0.0059) | (0.0059) | |
| Year Fixed-Effects | No | No | No | No | No | No |
| Industry Fixed-Effects | Yes | Yes | Yes | Yes | Yes | Yes |
| Clustered Standard Errors | Firm | Firm | Firm | Firm | Firm | Firm |
| Observations | 80,501 | 80,501 | 80,501 | 80,501 | 80,501 | 80,501 |
| Adj. R-Squared | 0.156 | 0.157 | 0.159 | 0.158 | 0.160 | 0.158 |
| B. Sample excluding North American firms | ||||||
|---|---|---|---|---|---|---|
| (1) | (2) | (3) | (4) | (5) | (6) | |
| Creditor Rights | ||||||
| Baseline | Creditor Rights | Restriction on Entry | No Automatic Stay | Management Does Not Stay | Secured Creditors First | |
| CDS Introduction |$\times$| Conditioning Variable |$\times$| | ||||||
| Post-Bang Dummy | 0.0043 | –0.0545** | 0.0149 | 0.0440 | 0.0189 | |
| (0.0191) | (0.0228) | (0.0245) | (0.0274) | (0.0152) | ||
| CDS Introduction |$\times$| Conditioning Variable | 0.0056 | 0.0242*** | –0.0026 | –0.0200** | 0.0091 | |
| (0.0078) | (0.0076) | (0.0076) | (0.0098) | (0.0070) | ||
| CDS Introduction |$\times$| Post-Bang Dummy | 0.0394 | 0.0378 | 0.0518** | 0.0338 | 0.0211 | 0.0441 |
| (0.0267) | (0.0264) | (0.0259) | (0.0284) | (0.0271) | (0.0276) | |
| Post-Bang Dummy |$\times$| Conditioning Variable | 0.0086 | 0.0187*** | 0.0123** | –0.0186** | 0.0027 | |
| (0.0056) | (0.0063) | (0.0061) | (0.0073) | (0.0049) | ||
| Conditioning Variable | –0.0144*** | –0.0234*** | –0.0068 | 0.0073 | –0.0077** | |
| (0.0042) | (0.0046) | (0.0047) | (0.0057) | (0.0036) | ||
| Post-Bang Dummy | –0.0083 | –0.0105 | –0.0095 | –0.0090 | –0.0002 | –0.0076 |
| (0.0070) | (0.0072) | (0.0070) | (0.0070) | (0.0072) | (0.0070) | |
| CDS Introduction | 0.0120 | 0.0101 | 0.0098 | 0.0115 | 0.0213** | 0.0128* |
| (0.0077) | (0.0080) | (0.0076) | (0.0077) | (0.0094) | (0.0077) | |
| Year Fixed-Effects | No | No | No | No | No | No |
| Industry Fixed-Effects | Yes | Yes | Yes | Yes | Yes | Yes |
| Clustered Standard Errors | Firm | Firm | Firm | Firm | Firm | Firm |
| Observations | 64,146 | 64,146 | 64,146 | 64,146 | 64,146 | 64,146 |
| Adj. R-Squared | 0.166 | 0.170 | 0.178 | 0.169 | 0.169 | 0.168 |
The table shows the average treatment effect of CDS introductions on the market leverage (defined as the sum of total debt and preferred stock divided by market value of total assets) of the treated (ATET) using overlap weights (Li, Morgan, and Zaslavsky 2018) for the full sample (panel A) and for sample firms excluding firms from North America (panel B), respectively. The treatment is the introduction of CDSs (i.e., only the first year of CDS trading for each firm). The post-Bang dummy has a value equal to 1 for years after 2008 (and zero otherwise). The regressions further include interactions between CDS Introduction, Post-Bang Dummy, and lagged (standardized) conditioning variables, as well as the lagged conditioning variables themselves. The use of overlap weights ensures that covariates are perfectly balanced between treated firms and control firms in the year before treatment (see Table E.2 in Appendix E). Conditioning variables are an aggregate index (Creditor Rights) as well as its four subindexes, namely, restrictions on a firm entering reorganization without creditors’ consent (Restrictions on Entry); no automatic stay or asset freeze (No Automatic Stay); restriction on management’s administration of a firm’s assets pending resolution of the reorganization (Management Does Not Stay); and payment of secured creditors first out of any liquidation proceeds (Secured Creditors First). All regressions include Fama-French 48-industry fixed effects. Standard errors are clustered at the firm level and are reported in parentheses. The sample consists of an unbalanced panel of nonfinancial firms across 51 countries over the period 2001–2015. Market data are from DataStream; accounting data are from WorldScope; and CDS data are from Markit. All variables are defined in Appendix D. *|$p <.1$|; **|$p <.05$|; ***|$p <.01$|.
Acknowledgement
The authors greatly appreciate helpful comments from Francesca Cornelli (the editor) and three anonymous referees, as well as discussions with Heitor Almeida (EFA discussant), Yakov Amihud, Sascha Becker, Ekkehart Boehmer (ABFER discussant), Matias Cattaneo, Dmitry Chebotarev, Mark Flannery, David Guilkey, Yalin Gündüz (CREDIT discussant), Andrea Ichino, Stephen Karolyi (NFA discussant), Luke Keele, Baeho Kim (KSA discussant), Fan Li, Ping McLemore, Fabrizia Mealli, Mark New (ISDA), Martin Oehmke (AFA discussant), Michael Tröge (Labex ReFi discussant), Dong Yan (CICF 2019 discussant), and Alan Zaslavsky. We are particularly grateful to Ed Altman, who graciously provided us with data from the Salomon Center Report (2020). We thank seminar and conference participants at Baruch College, Copenhagen Business School, UVA Darden, Federal Reserve Bank of Richmond, Federal Reserve Board, HEC Montreal, INSEAD, KAIST, Korea University, NYU Stern, the NYU Corporate Governance Lunch, Oxford University, SKK GSB, University Paris-Dauphine, Yonsei University, ABFER 2019 (Singapore), AFA 2018 (Philadelphia), CICF (Guangzhou) 2019, EFA 2019 (Carcavelos), NFA 2018 (Charlevoix), Korea Securities Association (KSA) Symposium (Seoul), CREDIT 2018 (Venice), Warsaw Conference in Finance 2018, IRMC 2017 (Florence), the Labex ReFi International Advisory Board Conference, and ESCP Paris for their insightful comments and suggestions. Bartram gratefully acknowledges the warm hospitality of the NYU Stern School of Business and EUI during visits to these institutions. as well as the Klaus Liebscher Award of the Oesterreichische Nationalbank and the Humboldt Research Award of the Alexander von Humboldt Foundation. Lee gratefully acknowledges financial support from the Institute of Finance and Banking, and the Institute of Management Research at Seoul National University. Subrahmanyam acknowledges generous financial support from the NYU Center for Global Economy and Business, the Volkswagen Foundation, and the Anneliese Maier Research Award of the Alexander von Humboldt Foundation.
Footnotes
1 For example, Saretto and Tookes (2013), Subrahmanyam, Tang, and Wang (2014), and Bolton and Oehmke (2015) suggest that the introduction of CDSs to underlying firms can significantly affect creditors’ ability to enforce their claim or affect their priority in bankruptcy. These effects depend on the bankruptcy code to which the firms are subject and may result in changes in firms’ bankruptcy risk.
2 Section 2 will provide more details about this discussion.
3 In their survey of the CDS literature, Augustin et al. (2014, p. 19) state that “a broader use of CDS data in international finance settings seems significantly lacking.”
4 See Aretz and Bartram (2010) for a comprehensive review of the literature and evidence.
5 See Augustin et al. (2014,2016) for exhaustive surveys of the literature.
6 Beyond the empty creditor problem in Bolton and Oehmke (2011), the existence of CDSs may affect the financing structure of firms by influencing the monitoring intensity of lenders (Morrison 2005) and by affecting investors’ incentives to hold synthetic debt rather than primary debt, particularly during economic expansions (Oehmke and Zawadowski 2016; Campello and Matta 2013). Other authors have modeled the impact of CDSs on liquidity policies and real investment through their effects on monitoring by creditors and risk sharing (see, e.g., Parlour and Winton 2013; Subrahmanyam, Tang, and Wang 2017).
7 See Bartholomew and Kentz (2015).
8 Our theoretical framework is intended to provide a simple and intuitive comparative statics result that summarizes our key idea about the effects of legal uncertainty in the recognition of the underlying trigger event of CDS. We do not develop an equilibrium model that derives the socially optimal level of the CDS notional amount, nor do we assume that the CDS notional amount that we observe in the data is socially optimal. Given the highly idiosyncratic nature of corporate bankruptcy, we simply contend that it is ex ante infeasible to perfectly hedge against ex post legal risk in the recognition of the CDS trigger event.
9 Prior to the Big Bang in 2009, which required the formation of regional Determination Committees, legal uncertainties related to the triggering of CDSs were much more severe, since every legal dispute had to be resolved bilaterally between the protection sellers and buyers or tried in local courts (Gelpern and Gulati 2012).
10 See, for example, Tu (2017): “Noble’s Chairman Paul Brough said on Tuesday it expects to find a buyer for its oil business by the end of September and get an extension on its covenant waivers....Getting those things done would give the company room to settle a repayment plan with its banks and avoid default, Brough said.” See also Harrison and Whittall (2011), about the case of Seat Pagine, an Italian company: “If the [company] bonds don’t pay the coupon,... it would be a more clear-cut credit event and CDS should trigger, said David Benton, head of the derivatives practice at Allen & Overy.”
11 The value of |$M$| could vary depending on the assumed bargaining power of creditors following their failure to trigger CDS payments. For example, |$M = q\lambda C_2^H $| if creditors are assumed to maintain the same bargaining power as they had in their initial round of debt negotiation with shareholders. Our results are robust as long as the bargaining power of creditors does not increase after their failure to trigger CDS payments, which seems a plausible assumption. We are grateful to Dmitry Chebotarev for raising this issue.
12 Given the setup of the information asymmetry between the firm and its creditors, the creditors cannot distinguish the up-down path from the down-down path. All they can verify in the |$L$| state at time 2 is that the firm’s continuation value turns out to be low, and only after costly cash flow verification. This implies that for the given state-contingent legal risk parameter, |$\gamma $|, a simple ex ante rescaling of the CDS notional amount in accordance with the anticipated degree of legal uncertainty in the recognition of the underlying trigger event cannot solve our problem. As noted earlier, corporate default is also highly idiosyncratic: its context varies significantly, case by case, and therefore it is not a straightforward exercise to extrapolate the nature of CDS legal uncertainty from other existing bankruptcy cases.
13 To ensure that debt is not risk-free, we implicitly impose a lower bound for |$F$|, that is, |$\phi q\lambda C_2^H + (1 - \phi )q\lambda C_2^L $|, which would render the problem moot. If |$F > F_C^H $|, strategic default would always arise even in the up-up state in our binomial path, and the maximum pledgeable cash flow degenerates to |$\phi q\lambda C_2^H + (1 - \phi )q\lambda C_2^L $|, which is less than the funding the firm would have achieved at |$F = F_C^H $| in Equation (1). In our main analysis, we exclude this degenerate case and focus on the case |$F \le F_C^H \equiv \bar {F}$| to avoid technical drawbacks arising from our binomial representation of the states of the nature.
14 The condition |$N \le \lambda C_2^H $| is implicitly imposed. Without this upper bound of |$N$|, renegotiation between the firm and creditors could always fail and the debt price degenerates to |$S$|, the liquidation value. We exclude this degenerate case from our analysis.
15 Note that in this model the empty creditor problem is the result of individual creditors who have overinsured, that is, creditors who have purchased an “excessive” amount of CDSs so that they are better off if the firm defaults. Unfortunately, we do not have access to the data that reveal the identity of particular bondholders or CDS counterparties, so we cannot directly test this feature of the model.
16 Throughout the paper, we assume that firms’ actual leverage corresponds to their debt capacity |$B$| in the model, which is true if firms behave optimally.
17 Other instruments, such as the geographical distance to New York (see, e.g., Shan, Tang, and Yan 2016), are not suitable in an international setting.
18 There are other methods of achieving balance in treated and nontreated samples prior to estimating treatment effects; these methods include the use of covariate balancing propensity scores (CBPS) (Imai and Ratkovic 2014) and the use of entropy balancing (see, e.g., Hainmueller 2012). The use of CBPS involves fitting the propensity-score model subject to the constraint of matching (potentially multiple) moments of the covariate distribution. This method can improve asymptotic efficiency at the expense of finite sample balance. In contrast, entropy balancing bypasses the estimation of the propensity score entirely and solves directly for the set of weights that create better balance in the moments of covariates by minimizing the distance between the synthetic sample and the original sample. Although each of these methods has the same goal, the overlap weighting method has the advantages that it yields the minimum variance of the treatment estimate among all balancing methods and gives more attention to the “overlap” population, that is, the group of “marginal” firms that have an approximately equal probability of experiencing and not experiencing CDS introduction. In our view, firms in this group are more exposed to a shift in policy regarding CDS availability, and it is these firms for which the effects of CDS introduction are most salient.
19 We are grateful to an anonymous referee for this suggestion.
20 Note the absence of mainland Chinese firms from the sample. The raw data from Markit include 23 Chinese firms. Of these, 13 are classified as financial institutions, and 7 are government affiliates, which we exclude because of their potential for being bailed out. The remaining three nonfinancial, nongovernmental firms include two whose primary listing is in Hong Kong, which is a Special Administrative Region (SAR) of China. While these two firms meet the requirement that the primary trading location and operations be in the same country, we choose to exclude them from our sample. Because of Hong Kong’s SAR status, they are subject to different legal codes than are firms from nonautonomous regions of China. Finally, the remaining firm (China Petroleum & Chemical Corporation) is excluded because of a data error in the Thomson Reuters database.
21 The number of firms with available CDSs is small relative to the full sample. As a consequence, matching techniques would have the disadvantage that significant portions of the overall sample would be excluded from the analysis.
22 Claessens and Klapper (2005) study the relation between these creditor rights and corporate bankruptcy.
24 Based on the point estimate of the effect of CDS introduction on the leverage ratio of 1.23|$\%$|, one can perform a “back-of-the-envelope” calculation to judge the implied effect of CDS introduction on aggregate corporate financing in our sample. The average ratio of market value of assets to GDP in our sample, where the market value of assets is the sum of stock market capitalization and all private credit, is 255|$\%$| (see table E-1 in appendix E). Multiplying this by 1.23|$\%$| implies an impact of CDS introduction on the corporate-debt-to-GDP ratio in our sample of 3.14|$\%$|. This is an economically significant effect, and a significant portion of the estimated effect of an increase in the creditor rights index on the debt-to-GDP ratio of approximately 6|$\%$| in Djankov et al. (2007). If we use a more restrictive measure of corporate debt that excludes trade credit, the implied impact of CDS introduction on the corporate-debt-to-GDP ratio is smaller, at 1.95|$\%$|, but still economically large. Both of these estimates are consistent with CDSs playing a significant role in the capital structure of firms.
25 The inclusion of CDS introductions where restructuring is excluded as a credit event should bias our results against finding significance for Restrictions on Entry.
26 We use data on property rights from the ICRG rather than debt enforcement measures from Djankov, Hart, et al. (2008), as the ICRG measures vary through time. However, in robustness checks, we examine whether a subset of the cross-sectional measures taken from Djankov, Hart, et al. (2008), when incorporated into our tests, yield similar inferences. Specifically, we use their measures of Time (duration to resolution of insolvency), Time to Payment (duration to secured creditor payout), Cost (cost of debt enforcement proceeding), and Efficiency (present value of the terminal value of the firm after bankruptcy costs) as conditioning variables in our regressions. The prediction from our model is that higher values of Time, Time to Payment, and Cost and lower values of Efficiency, representing higher costs of debt enforcement, are associated with larger increases in debt following CDS introduction. The coefficients for the interaction terms of CDS introduction with Time, Time to Payment, and Cost are all positive, and for two of these variables ( Time and Time to Payment), the coefficients are statistically significant at the 1|$\%$| level. The coefficient for the interaction term of CDS introduction with Efficiency is negative and significant at the 10|$\%$| level. Overall, these results are consistent with the prediction that in environments with poor enforcement of property rights or low verifiability of cash flows, the increase in debt associated with CDS is larger.
27 Other techniques, such as those of Rosenbaum (1987), assess the sensitivity of significance levels and confidence intervals, rather than the sensitivity of point estimates (see Bartram, Brown, and Conrad 2011).
28 These conditions are generally satisfied for higher-order dependence between endogenous and exogenous regressors, that is, the conditional joint independence between the regression outcome and the endogenous covariates, given the exogenous variable.
29 For similar implications of the econometrics, see also Annan and Schlenker (2015), among many others. It is also worth noting that the creditor rights variables of our sample countries do not change over time and take values that are predetermined prior to the beginning of our sample period.
30 As a result, no-restructuring (“XR”) CDS contracts form the majority of the U.S. single-name corporate CDS contracts in the post-Big-Bang period.
31 Canadian single-name corporate CDS are also XR CDS contracts in the post-Big-Bang time period. The exclusion of Canadian firms from our robustness test does not change our conclusions. These results are available on request.
32 The Big Bang Protocol was implemented on April 8, 2009. The subsequent Small Bang Protocols were implemented in stages later that year, with changes in conventions (such as fixed coupons) occurring in June of 2009 and changes in contract (such as restructuring clause changes) occurring in July. The Small Bang extended some of the Big Bang protocols to European CDS; in particular, the Small Bang addressed restructuring as a credit event. See, for example, Gündüz et al. (2020). Note that since we use annual data in our analysis, the changes associated with both Big and Small Bangs are treated as a single event.
33 Note that “restructuring” in North American firms in this context does not refer to Chapter 11 filings; these are automatically considered a credit event.
34 Shortly after this episode (in December 2015), a failure-to-pay event for Abengoa did occur, and CDS were triggered.
References
Simmons & Simmons.
