


Abstract
We investigate the connections between bank capital regulation and the prevalence of lightly regulated nonbanks (shadow banks) in the U.S. corporate loan market. For identification, we exploit a supervisory credit register of syndicated loans, loan-time fixed effects, and shocks to capital requirements arising from surprise features of the U.S. implementation of Basel III. We find that less-capitalized banks reduce loan retention, particularly among loans with higher capital requirements and at times when capital is scarce, and nonbanks step in. This reallocation is associated with important adverse effects during the 2008 crisis: loans funded by nonbanks with fragile liabilities are less likely to be rolled over and experience greater price volatility.
The recent financial crisis has triggered a broad push toward increased regulation of the financial sector, and a vigorous debate about how best to implement this overhaul. At the heart of the debate is the issue of capital requirements. In particular, Admati et al. (2013) argue that banks should be subject to alternative or significantly higher capital requirements in order to mitigate risk-shifting incentives and increase financial stability (see also Flannery 2014; Thakor 2014). On the other hand, increased regulation of banks may push intermediation into unregulated financial institutions, including the “shadow banking” system.1 While shadow banks may bring fresh funding or other efficiencies (e.g., new loan pricing technologies), unlike traditional banks they cannot issue insured liabilities nor access central bank liquidity during times of marketwide stress. Theoretical work emphasizes that these distinct sources of fragility at shadow banks might amplify risks in the financial system and reduce overall welfare (Plantin 2014; Fahri and Tirole 2017; Martinez-Miera and Repullo 2018; Chretien and Lyonnet 2018), a concern echoed by the press, practitioners, and policy makers alike.2 Despite its importance for the design of prudential regulation (Hanson, Kashyap, and Stein 2011; Freixas, Laeven, and Peydró 2015), there is limited empirical evidence on the relation between bank capital and shadow banking, as well as how a greater presence of shadow banks might potentially exacerbate or propagate risks in the financial system.3
In this paper, we provide new evidence on these issues in the context of the U.S. market for syndicated corporate loans. Narrative evidence suggests an important link from strengthening bank capital regulation to the transfer of corporate credit risk out of the regulated sector, beginning in the early 2000s.4 To shine a light on this potential credit reallocation, we analyze an administrative credit register of U.S. syndicated loan shares that contains unique data on the dynamics of loan share ownership among banks and nonbanks from 1993 until 2014. Our empirical tests confirm a tight connection between banks’ regulatory capital and loan sales and trading activity in the secondary loan market. We show how undercapitalized banks remove loans from the balance sheet, especially loans with higher capital requirements and at times when bank capital is scarce, and a significant portion of this credit is reallocated to nonbanks. Further, we provide evidence that this credit reallocation is associated with two adverse effects during the 2008 crisis: loans funded by nonbanks experience both a sizable reduction in credit availability (which also matters for firms’ total borrowing) and greater price volatility in the secondary market. Moreover, consistent with the theory, these negative effects are closely aligned with the fragility of the liabilities of these nonbanks.
We base our empirical tests on data from the Shared National Credit Program, which is a supervisory credit register administered by the Board of Governors of the Federal Reserve System, the Federal Deposit Insurance Corporation, and the Office of the Comptroller of the Currency. This data set has a unique advantage as compared with credit registers from other countries: it has comprehensive information on shadow bank investments (loan share ownership), in addition to the holdings of traditional banks. Crucially, these loan shares are tracked in the years following origination, which allows us to construct a complete picture of credit reallocation within loans, in response to bank balance sheet shocks. Accounting for these dynamics is vital, as much of the reallocation from banks to nonbanks in the modern syndicated loan market occurs via secondary market trading.
We merge the loan funding data to bank balance sheets to estimate the effects of bank regulatory capital for credit reallocation to nonbanks. In the spirit of Khwaja and Mian (2008) and Irani and Meisenzahl (2017), we use a loan-year fixed effects approach that exploits the fact that loan syndicates in our sample always feature multiple banks, in conjunction with our panel on loan share holdings. This empirical approach boils down to comparing secondary market loan sale decisions across banks as a function of their regulatory capital positions within loan syndicates at a given point in time. It is attractive from an identification standpoint, as it accounts for changes in loan quality that could correlate with bank balance sheet shocks and risk management responses.
Our main results are as follows. We establish the importance of regulatory capital for loan retention. We find that banks experiencing a weakening of their regulatory capital position are more likely to reduce loan retention. Our tests show how this is achieved through secondary market trading activity—that is, by selling loan shares in the years following origination. To buttress this key result, we show the negative relation between capital and loan sales is stronger during times of marketwide uncertainty, when banks face limited access to external capital and profitability is low. We also examine the cross-section of loans and find that low-capital banks are most likely to sell nonperforming loans, which have higher risk weights for capital requirements.
We then provide the connection between bank capital and nonbank entry. We first present novel graphical evidence documenting aggregate trends in nonbank entry into the syndicated term loan market, which accelerated in the early 2000s—in terms of both loan retention and trading activity—particularly among collateralized loan obligations (CLOs) and investment funds. We then aggregate our loan share-lender-year panel to the loan-year level and regress the fraction of loan funding from nonbanks on average syndicate member bank characteristics, including regulatory capital. Our regression evidence confirms that an important component of nonbank entry at the loan level reflects bank capital constraints. Specifically, our estimates indicate that a one-standard-deviation decrease in bank capital translates into a 3.25 percentage point increase in nonbank share (14.1% of the mean).
While our loan-year fixed effects model sweeps out all borrower- and loan-specific factors, potential time-varying omitted bank-level variables could compromise the internal validity of our estimates.5 To tighten identification, we use plausibly exogenous variation in bank capital arising from the Basel III capital reforms. While the timing and content of the internationally agreed version of the regulation were well understood, there were quirks in the precise implementation of the U.S. rule (Berrospide and Edge 2016). This created unexpected shortfalls in regulatory capital for some banks, unrelated to banks’ commercial lending activity including risk within the syndicated loan portfolio. Using two complementary shocks related to this rule, we continue to find that relatively low-capital banks use loan sales to reduce risk-weighted assets and enhance regulatory capital ratios in the wake of this reform. As before, we show that nonbanks fill the funding gaps created by these loan sales.
In the final section of the paper, we provide evidence consistent with two important adverse consequences of this shadow bank entry for the resilience of credit markets. Since shadow banks lack insured liabilities and may have limited access to central bank liquidity, funding fragility may force shadow banks to retrench from credit markets to meet their liquidity needs during times of marketwide stress (e.g., Chretien and Lyonnet 2018).6 This may occur by cutting off existing credit lines or refusing to issue new credit. These entities might also be forced to liquidate assets even when transactions must occur below fundamental values, thus depressing secondary market prices (Shleifer and Vishny 2011).
We provide evidence consistent with both of these channels. First, we examine credit availability during the 2008 crisis based on ex ante nonbank share. We identify the set of outstanding loans immediately prior to the crisis and, for each loan, fully characterize syndicate composition—including nonbank funding—using the unique information from our credit register. Our key finding is that nonbank share is associated with a sizable negative effect on credit availability during the crisis along both the intensive and extensive margins.7 These effects hold at both the loan level (controlling for differences between contracts) and also at the firm level, where the latter result suggests that firms do not substitute to other syndicated loans. Importantly, we show that these adverse effects are pronounced among loans funded by nonbanks with relatively liquid liabilities such as broker-dealers and hedge funds.
Second, we examine secondary market loan price volatility. We collect secondary market pricing data for traded loans from the Loan Syndication and Trading Association. This time we observe that syndicated loans with greater funding by nonbanks are associated with greater downwards pressure on secondary market prices during the crisis. We estimate that a one-standard-deviation higher precrisis nonbank share accounts for 19.2% of the mean fall in loan prices through 2008. Again, we find more pronounced effects among loans funded by fragile nonbanks. We also examine secondary loan share purchases, and our evidence suggests that well-capitalized banks and nonbanks with relatively stable funding were able to act as liquidity providers during the 2008 crisis but did not smooth out the shock. Overall, these findings are consistent with negative effects on credit markets arising from the fragile funding of nonbanks investing in these relatively illiquid loans.
The results in this paper provide insights that fit into two different strands of the banking literature. First, we provide a partial explanation for the prevalence of shadow banks in loan markets. On the positive side, technological advances, liquidity transformation, and superior knowledge could motivate nonbank entry into this market (Buchak et al. 2018; Ordoñez 2018; Moreira and Savov 2017), which may lead to an ex ante better allocation of risk, greater cost efficiency, and lower borrowing costs for households (Fuster et al. 2019) and corporations (Ivashina and Sun 2011; Shivdasani and Wang 2011; Nadauld and Weisbach 2012).8
Another view, as emphasized by Kashyap, Stein, and Hanson (2010), is that regulatory burdens, in the form of rising capital requirements and greater scrutiny, may reduce traditional banks’ balance sheet capacity and thus result in a migration of banking activities toward unregulated shadow banks that can escape these costs.9Acharya and Richardson (2009) argue that shadow banks avoid capital requirements—and thus possess a cost advantage in good times—but benefit from government bailouts when extreme losses arrive, possibly due to affiliations with traditional banks either directly or indirectly via guarantees (Acharya, Schnabl, and Suarez 2013). In line with this reasoning, we document the importance of capital regulation for the rise of shadow banks in the U.S. corporate loan market.10 In contrast to Acharya and Richardson (2009) and Acharya, Schnabl, and Suarez (2013), we do so in the context of “true sales” of corporate loan shares to shadow banks that are unaffiliated with the traditional banking sector and do not have access to insured liabilities nor central bank liquidity.
Relatedly, Buchak et al. (2018) examine the rise of shadow banks (notably, online “fintech” lenders) in the U.S. residential mortgage market. They find that the market share of origination activity among shadow banks doubled between 2007 and 2015, and attribute this expansion primarily to regulatory constraints among traditional banks after the crisis. Likewise, de Roure, Pelizzon, and Thakor (2019) show how stricter capital requirements led to a credit reallocation from banks to peer-to-peer (P2P) lending in the German consumer credit market post 2010. We instead document how shadow banks replace capital-constrained banks in the funding of loans to corporations—rather than households—over three credit cycles spanning 20 years. We use data from a supervisory credit register of syndicated loans that contains comprehensive information on shadow bank holdings (alongside traditional banks) at the level of the loan. Importantly, the shadow banks in our setting provide loan funding and do not simply originate-and-distribute or match borrowers and lenders (as in P2P). Therefore, as a result of differences in the fragility of shadow banks’ liabilities (e.g., Fahri and Tirole 2017), our evidence suggests that shadow bank entry may have important real effects in terms of credit access and secondary market prices during times of heightened aggregate uncertainty.
Second, we contribute to the nascent empirical literature on the consequences of securities trading by banks. Abbassi et al. (2016) provide security-level evidence on the secondary market trading activities of commercial banks based in Germany. They show that, after the fall of Lehman Brothers, well-capitalized banks reallocate capital toward profitable trading activities at the expense of lending opportunities that support the real economy. In addition, Irani and Meisenzahl (2017) analyze loan trading by U.S. commercial banks during the recent financial crisis, and find that liquidity-strained banks with heavy exposures to wholesale funding markets sold loans at depressed prices in the secondary market. Our focus is instead on the trading activities of both traditional banks and nonbanks. We connect entry by nonbanks to capital constraints at regulated commercial banks, and then find evidence suggesting that nonbanks with fragile funding can have negative effects to credit markets during a severe downturn.
1. Data and Summary Statistics
1.1 Sample selection and variable construction
Our primary data source is the Shared National Credit Program (SNC). The SNC is a credit register of syndicated loans maintained by the Board of Governors of the Federal Reserve System, the Federal Deposit Insurance Corporation (FDIC), the Office of the Comptroller of the Currency, and, before 2011, the now-defunct Office of Thrift Supervision. Through surveys of administrative agent banks, the program collects confidential information on all loan commitments larger than |${\$}$|20 million and shared by three or more unaffiliated federally supervised institutions, or a portion of which is sold to two or more such institutions. This includes loan packages containing two or more facilities (e.g., a term loan and a line of credit) issued by a borrower on the same date where the sum exceeds |${\$}$|20 million. Loans meeting these criteria—both new and outstanding—are surveyed on December 31 each year. The SNC has comprehensive coverage of syndicated lending from 1977 to the present.11 We restrict our sample to post 1993, at which point the data are of the highest quality.
The SNC provides loan-level information on the borrower’s identity, the date of origination and maturity, loan type (i.e., credit line or term loan), and a pass/fail regulatory classification of loan quality.12 Most importantly, the data break out loan syndicate membership on an ongoing (annual) basis. Thus, over the tenure of each loan, the data identify the names of the agent bank and participant lenders—these include banks and an array of nonbanks—and also their respective investments.13 This allows us to identify each observation in the SNC data as a loan share-lender-year.
The SNC data tracks loan share ownership over time and allows us to measure loan sales in the secondary market. To this end, for each loan we compare syndicate membership from one year to the next, and code a loan share sale whenever a lender |$j$| reduces its exposure in year |$t+1$| from year |$t$|. In these cases, we record a sale of loan |$i$| by lender |$j$| in year |$t+1$|. Naturally, the loan must not mature in |$t+1$| or else it will appear that all lenders are selling. This loan sales measure includes both loan shares sold in their entirety and instances where a bank retains the loan share but reduces its exposure. Sales are coded at the bank holding company level, so that we examine “true sales” of loan shares as opposed to within-organization reallocations.14
In some tests, we examine loan-years involving no changes to the loan contract (i.e., the loan is not refinanced or amended in any way). In particular, we exclude loan-years for which the credit identifier does not change, but we do observe some change in the maturity date, origination date, or total loan amount at origination, since such changes are associated with refinancing or amendment of an existing loan. This “No Amend” sample allows us to address the identification concern that borrowers may remove underperforming banks from the syndicate, assuming it is easier to do so when the contract is up for renegotiation. The data also allow us to control for divestment activity around bank mergers and acquisitions. In particular, if a lender adjusts its loan exposure at the same time as its parent’s regulatory identifier—the Replication Server System Database (RSSD) ID—changes, then we code this as a merger instead of a sale.
In addition to the SNC, we use data from two other sources. First, we collect quarterly bank balance sheet data for U.S. banks from the Federal Financial Institutions Examination Council Consolidated Financial Statements Call Reports of Condition and Income (Form FFIEC 031). These data are used to construct a number of bank control variables in our regressions, including measures of bank size, liquidity, and loan portfolio composition. We also use these data to construct several bank-level measures of regulatory capital, including the Tier 1 capital to risk-weighted assets ratio. Our analysis therefore uses cross-sectional variation in their regulatory capital ratios to estimate the impact of bank capital on loan sales and nonbank entry.
Second, we collect secondary market bid and ask quotes for traded syndicated loans from the Loan Syndication and Trading Association (LSTA) Mark-to-Market Pricing data. The unit of observation in these data is a loan facility-quotation date pair. We hand-match loan facilities in the SNC data with the LSTA using information on issuer names and loan origination dates, and other loan characteristics where necessary. We use the LSTA data to construct proxies for secondary market loan prices. These loan price proxies allow us to estimate the association between nonbank participation in loan syndicates and price declines during the 2008 aggregate shock.
1.2 Summary statistics
We start our sample description with graphical evidence based on aggregated data from the SNC. We focus on the term loan primary and secondary markets, since they are liquid and feature all financial institutions.15
Figure 1 plots the composition of nonbank funding of syndicated term loans from 1993 to 2014. The SNC classifies lenders into four categories: domestic banks, domestic nonbanks, foreign banks, and foreign nonbanks. We disaggregate the SNC classification of nonbanks, assigning nonbank lender names into the following categories: hedge fund or private equity, mutual fund, insurance company, pension fund, broker-dealer, finance company, and CLO.16 Holdings are shown as a fraction of outstanding credit. The complement of the nonbank holdings is bank holdings. For example, in 1993, about 20% of credit was funded by nonbanks and 80% by (foreign and domestic) banks. Two important patterns emerge. First, there is an upward trend in nonbank funding, from about 20% in 1993 to 70% in 2014. Notably, nonbank participation accelerated between 2002 and 2006. Second, there is an increase in the diversity of creditors. CLOs—a form of corporate loan securitization—emerged in the late 1990s and by 2002 became the largest nonbank investor class. Since 2008, hedge funds, private equity, and loan mutual funds have played an increasingly important role, and they had a similar market share to CLOs by 2014.
U.S. syndicated term loan funding market share by entity type (1993–2014)
The categories in the figure refer to groups of financial firms and, to ensure confidentiality, data for no individual firm are disclosed. “DEO,” “FEO,” and “Other” denote nonbank entities with a domestic, foreign, and unknown origin, respectively. These nonbank lenders could not be classified (into any of the other categories) based on our lender lists.
Figures 2 and 3 plot term loan share sales and purchases in the secondary market over the same time period for all financial institutions. Trades are represented in terms of both dollar values (top panel) and market shares (bottom panel). Nonbanks clearly played a prominent role in the dramatic increase in trading activity in the post-2007 period. However, these institutions actually began to dominate the secondary market much sooner, as early as 2002. Focusing first on sales, we find that while banks’ loan funding shrank from 1993 to 2002, they held the largest market share of loan sales until 2003. Beyond this tipping point, nonbanks swamp the market. In terms of loan purchases, since 2002, CLOs and other asset management firms have steadily replaced banks and finance companies. Once the crisis arrived, all institutions increased trading activity, with nonbanks clearly dominant in terms of magnitudes. Comparing the financial crises of 1998 and 2008, we see dramatic differences in the extent of trading activity. This may, at least to some extent, be driven by the composition of investors in the loan market.
Secondary market sells of U.S. syndicated term loan shares (1993–2014)
Loan share sales in levels (|${\$}$| billions, top panel) and by market share (bottom panel). A loan share is a fraction of a syndicated loan commitment. A loan share sale occurs when a lender reduces its ownership stake in a loan share relative to the previous year. The categories in the figure refer to groups of financial firms and, to ensure confidentiality, data for no individual firm are disclosed. “DEO,” “FEO,” and “Other” denote nonbank entities with a domestic, foreign, and unknown origin, respectively. These nonbank lenders could not be classified (into any of the other categories) based on our lender lists.
Secondary market buys of U.S. syndicated term loan shares (1993–2014)
Loan share buys in levels (|${\$}$| billions, top panel) and by market share (bottom panel). A loan share is a fraction of a syndicated loan commitment. A loan share buy occurs when a lender increases its ownership stake in a loan share relative to the previous year. The categories in the figure refer to groups of financial firms and, to ensure confidentiality, data for no individual firm are disclosed. “DEO,” “FEO,” and “Other” denote nonbank entities with a domestic, foreign, and unknown origin, respectively. These nonbank lenders could not be classified (into any of the other categories) based on our lender lists.
We repeat this description for the nonperforming term loans, which are those that are “criticized” by the regulator—that is, rated “special mention,” “substandard,” “doubtful,” or “loss”—as part of the SNC review that year.17 Banks offload nonperforming loans more often and particularly in a countercyclical manner. While banks do purchase these loans in the secondary market, investment management firms play a more prominent role. These patterns are natural, given that these loans carry higher regulatory capital charges among banks, and the loan secondary market offers a mechanism for banks to adjust exposure.
We next explore the loan-share-level nature of the data to characterize the “traffic flow” by lender (which entity types buy when banks or nonbanks sell?) interacted by loan types (how are entity buys distributed across loan types?). We measure traffic flow by approximating secondary market loan transactions in the data: all instances where, for a particular loan-year pair, exactly one bank sells and another distinct entity (i.e., another bank or nonbank) buys. By this, we mean that the bank exits the loan syndicate via a sale and is replaced by another entity that holds the exact same-sized loan share over the same year. We are interested primarily in 13,061 such “transactions” over the sample period from 2002 until 2014, of which there are 5,522 term loan transactions.
Panel A of Table 1 shows the distribution of loan share buyers in response to sales by commercial banks, partitioning the transactions by the following loan characteristics: loan size (columns [1] and [2]), loan syndicate size ([3] and [4]), loan maturity ([5] and [6]), loan facility type ([7] and [8]), loan regulatory rating ([9] and [10]), and issuer location ([11] and [12]). Looking down the rows, we distinguish among the various entity types entering the loan syndicate following the sale, which includes domestic banks, foreign banks, and the full spectrum of nonbank entities (CLO, insurance company, pension fund, mutual fund, and so on). Panel B instead shows traffic by lender types. In particular, we partition traffic according to whether the selling bank is a lead arranger or participant, how well-capitalized the selling bank is, and also the identity of the selling lender (domestic bank versus foreign bank versus nonbank). In the case of selling nonbanks, we identify 29,365 instances where a nonbank exits the syndicate via a matched sale.
Description of “traffic” among loan shares
| Panel A: Traffic by loan types | |||||||||||||||||
|---|---|---|---|---|---|---|---|---|---|---|---|---|---|---|---|---|---|
| Loan type: | Loan size | Syndicate size | Loan maturity | Facility type | Regulatory rating | Issuer location | |||||||||||
| Small | Large | Small | Large | Short | Long | Term loan | Credit line | Pass | Fail | Domestic | Foreign | ||||||
| [1] | [2] | [3] | [4] | [5] | [6] | [7] | [8] | [9] | [10] | [11] | [12] | ||||||
| U.S. bank | 35.9 | 15.6 | 41.7 | 8.7 | 40.7 | 14.1 | 25.8 | 87.3 | 30.6 | 15.9 | 25.9 | 25.1 | |||||
| Foreign bank | 10.9 | 3.3 | 12.0 | 1.1 | 11.7 | 2.9 | 6.8 | 4.8 | 8.5 | 3.1 | 5.2 | 17.6 | |||||
| CLO | 28.7 | 46.0 | 23.5 | 52.1 | 26.0 | 46.0 | 37.4 | 1.7 | 34.6 | 42.9 | 38.1 | 31.8 | |||||
| Finance company | 2.2 | 1.5 | 1.9 | 1.8 | 1.8 | 1.9 | 1.8 | 1.8 | 1.7 | 2.1 | 2.0 | 0.7 | |||||
| Broker-dealer | 0.5 | 0.5 | 0.3 | 0.7 | 0.5 | 0.5 | 0.4 | 0.3 | 0.5 | 0.5 | 0.5 | 0.1 | |||||
| Insurance company | 2.0 | 2.5 | 1.6 | 2.9 | 2.0 | 2.4 | 2.2 | 0.1 | 2.4 | 1.9 | 2.3 | 1.8 | |||||
| Hedge/PE fund | 3.6 | 4.2 | 3.6 | 4.2 | 3.1 | 4.5 | 3.9 | 0.4 | 3.2 | 5.2 | 4.1 | 2.7 | |||||
| Pension fund | 1.2 | 2.6 | 1.1 | 2.7 | 0.9 | 2.7 | 1.9 | 0.4 | 1.9 | 2.0 | 1.8 | 2.3 | |||||
| Mutual fund | 7.3 | 14.8 | 6.9 | 15.5 | 6.6 | 14.5 | 11.0 | 0.4 | 9.9 | 13.4 | 11.1 | 10.3 | |||||
| Other | 7.7 | 9.0 | 7.4 | 10.3 | 6.7 | 10.5 | 8.8 | 2.8 | 6.7 | 13.0 | 9.0 | 7.6 | |||||
| Transactions | 2,767 | 2,755 | 2,858 | 2,664 | 2,417 | 3,105 | 5,522 | 7,539 | 3,712 | 1,810 | 4,824 | 698 | |||||
| Panel B: Traffic by lender types | |||||||||
|---|---|---|---|---|---|---|---|---|---|
| Lender type: | Role in syndicate | Bank Tier 1 capital | Identity of selling intermediary | ||||||
| Lead | Participant | Below med. | Above med. | Domestic bank | Foreign bank | Nonbank | |||
| [1] | [2] | [3] | [4] | [5] | [6] | [7] | |||
| U.S. bank | 76.1 | 25.6 | 24.8 | 18.3 | 25.8 | 35.6 | 6.3 | ||
| Foreign bank | 3.8 | 6.8 | 2.3 | 1.4 | 6.8 | 17.2 | 1.1 | ||
| CLO | 4.6 | 38.1 | 39.0 | 49.8 | 37.4 | 24.8 | 51.6 | ||
| Finance company | 3.1 | 1.8 | 3.1 | 1.5 | 1.8 | 1.3 | 1.8 | ||
| Broker-dealer | 0.0 | 0.5 | 0.7 | 0.1 | 0.4 | 0.0 | 0.3 | ||
| Insurance company | 0.8 | 2.3 | 2.0 | 2.5 | 2.2 | 0.8 | 3.0 | ||
| Hedge/PE fund | 0.8 | 4.0 | 4.5 | 3.8 | 3.9 | 2.7 | 5.7 | ||
| Pension fund | 0.0 | 1.9 | 0.9 | 2.8 | 1.9 | 1.3 | 3.4 | ||
| Mutual fund | 3.8 | 11.2 | 11.7 | 12.6 | 11.0 | 7.8 | 16.3 | ||
| Other | 7.0 | 7.8 | 11.0 | 7.2 | 8.8 | 8.5 | 10.5 | ||
| Transactions | 130 | 5,392 | 2,866 | 2,656 | 5,522 | 960 | 29,365 | ||
This table shows traffic flow across loan and lender types by approximating “transactions” in the loan secondary market. Transactions are identified as all instances in the data where, for a given loan-year pair, exactly one lender sells its loan share and another distinct entity buys. The numbers populating the cells show the frequency of loan share buys by entity type. In panel A, the partition loan sales by domestic banks to other institutions according to various loan-level characteristics. Small loans and syndicates are below median in size. Short maturity loans have fewer than three years remaining until maturity. Panel B sorts transactions by lender characteristics. Columns [1] to [5] consider sales by domestic banks only. All columns except [8] of panel A consider term loan share transactions. The sample period is from 2002 to 2014. All variables are defined in Table A1.
Several interesting findings stand out from the table. As shown in panel A, information appears to play an important role in these transactions. Small firms borrowing in the syndicated loan market are more informationally opaque and more likely to suffer from adverse selection (e.g., Sufi 2007). Loans with larger syndicates may be of sufficient quality and transparency (e.g., an external credit rating) and include contractual features that make them easier to distribute, such as tight covenants (Drucker and Puri 2009). Consistent with these arguments, the traffic within loans indicates that banks purchase the lion’s share of small size, small syndicate loans. Conversely, larger loans with larger syndicates are more likely to be purchased by nonbank entities, especially CLOs and mutual funds. Rather strikingly, the traffic flow among credit line shares is nearly always from banks selling to other banks buying (about 92% of transactions). Almost no nonbank entities acquire credit lines, which is the opposite of term loans where about 70% of the traffic flows are in the direction of nonbanks. This provides a clear motivation for our choice to focus on term loans for the bulk of our regression analysis. Finally, traffic looks quite different among the loans of domestic versus foreign issuers: the loan buyers of foreign issuers are much more likely to be foreign banks, whereas nonbanks buy more from local rather than foreign issuers.
Turning to the traffic flow by lender types (panel B), we see that lead arrangers almost never sell out of loan syndicates, but—when they do—the loan flows toward other banks. This is consistent with strong relationship effects as well as the need for continued bank monitoring in the event of a sale. In contrast, when the sale is by participants, nonbanks are the main buyers. In addition, we consider traffic flows originating from foreign banks (column [6]) and from nonbanks (column [7]). We find that traffic flows look very different depending on the identity of the selling institution: while domestic banks sell mainly to nonbanks (column [5]), traffic from foreign banks mainly tends to flow to banks (domestic banks and other foreign banks), whereas when transactions are initiated by nonbanks, the traffic flow is mostly in the direction of other nonbanks.
Moving on, the sample used in our regression analysis consists of data from 1993 to 2014. As described in Section 1, the sample is restricted to loan shares funded by U.S. banks and includes 20,685 unique syndicated loans, 161,794 loan share-lender-year triples, held by 1,897 banks. Loan-level variables are measured at the time of the SNC review, and bank-level variables at the end of the calendar year. Definitions of these variables are found in Table A1. Bank variables are winsorized at the 1st and 99th percentiles to mitigate the effect of outliers.
Table 2 presents the summary statistics. Panel A shows the loan-level variables, which are averaged across loan share-years. In a given year, loan shares exposures are reduced 37% of the time. In 6.5% of the observations, shares are sold in their entirety, which means a participant bank exits the loan syndicate altogether. In terms of loan size, the average loan commitment is about |${\$}$|275 million. Of the shares, 18.1% have the bank in question acting as an agent. Collapsing the data to the loan-year level, we find that 23.1% of funding for a given syndicate comes from nonbanks. As described above, the nonbank share increases dramatically in the second half of the sample.
Summary statistics for banks and loan sales tests
| |$N$| | Mean | Std. | p25 | Med. | p75 | |$N$| | Mean | Std. | p25 | Med. | p75 | ||
|---|---|---|---|---|---|---|---|---|---|---|---|---|---|
| [1] | [2] | [3] | [4] | [5] | [6] | [7] | [8] | [9] | [10] | [11] | [12] | ||
| Loan-level variables | |||||||||||||
| Loan Sale | 161,794 | 0.370 | 0.483 | 0 | 0 | 1 | |||||||
| Loan Share/Assets | 161,794 | 0.007 | 0.002 | 0.000 | 0.000 | 0.000 | |||||||
| Loan Size | 161,794 | 274.0 | 619.0 | 34.5 | 95.0 | 256.0 | |||||||
| Lead Arranger | 161,794 | 0.181 | 0.385 | 0 | 0 | 0 | |||||||
| Non-Bank Share | 39,058 | 0.231 | 0.320 | 0 | 0 | 0.403 | |||||||
| Bank-level variables | |||||||||||||
| Below-median capital | Above-median capital | ||||||||||||
| Tier 1 Capital/RWA | 2,017 | 0.100 | 0.014 | 0.092 | 0.101 | 0.112 | 2,018 | 0.175 | 0.060 | 0.135 | 0.153 | 0.191 | |
| Tier 1 Gap | 2,017 | -0.009 | 0.020 | -0.022 | -0.011 | 0.003 | 2,018 | 0.006 | 0.040 | -0.018 | 0.000 | 0.023 | |
| Total Capital/RWA | 2,017 | 0.115 | 0.012 | 0.107 | 0.115 | 0.124 | 2,018 | 0.187 | 0.061 | 0.147 | 0.166 | 0.203 | |
| Tier 1 Leverage | 2,017 | 0.078 | 0.014 | 0.069 | 0.078 | 0.086 | 2,018 | 0.109 | 0.035 | 0.087 | 0.100 | 0.119 | |
| Bank Size | 2,017 | 20.91 | 1.964 | 19.52 | 20.81 | 22.12 | 2,018 | 19.68 | 1.747 | 18.45 | 19.45 | 20.76 | |
| Wholesale Funding | 2,017 | 0.300 | 0.146 | 0.192 | 0.285 | 0.389 | 2,018 | 0.231 | 0.147 | 0.126 | 0.202 | 0.297 | |
| Real Estate Loan Share | 2,017 | 0.607 | 0.194 | 0.496 | 0.637 | 0.753 | 2,018 | 0.631 | 0.217 | 0.513 | 0.685 | 0.795 | |
| C&I Loan Share | 2,017 | 0.116 | 0.101 | 0.011 | 0.110 | 0.170 | 2,018 | 0.062 | 0.086 | 0 | 0.015 | 0.101 | |
| Non-Interest Income | 2,017 | 0.154 | 0.099 | 0.088 | 0.136 | 0.195 | 2,018 | 0.153 | 0.123 | 0.075 | 0.121 | 0.192 | |
The sample is restricted to loans held by at least two U.S. banks with valid covariates at the beginning of the year. Loan-level variables are averaged (unweighted) across loan share-years. Bank-level variables are averaged across bank-years. Bank-level summary statistics split by above- and below-median beginning-of-year Tier 1 Capital/RWA. The sample period is from 1993 to 2014. All variables are defined in Table A1.
Panel B gives a sense of the differences across banks sorting on capitalization. The table splits the sample according to whether the bank falls above or below median Tier 1 capital to risk-weighted assets each year and averages the data across bank-years. Banks with below-median capital have average total assets of about |${\$}$|1 billion, with 60% and 10% of assets allocated to real estate and commercial lending, respectively. These banks have average Tier 1 capital ratios of 10.0%. The major differences between these groups are that banks with above-median capital are smaller in terms of book assets, have less wholesale funding dependence, and fund fewer commercial loans. These differences are both large in magnitude and significant at the 1% level, using standard difference in means tests.
2. Bank Capital, Loan Sales, and Nonbank Entry
2.1 Empirical methodology
Our empirical approach is based on the idea that regulatory capital constraints lead banks to shed credit risk in the term loan secondary market. That is, banks with low capital have incentives to enhance regulatory capital ratios by lowering risk-weighted assets through term loan sales, much more so than banks with high capital ratios.
Estimating this empirical relationship poses an identification challenge: changes in borrower fundamentals that feed into loan-specific default risk could cause trading activity irrespective of lender-side factors, including capital constraints. For example, suppose low-capital banks grant loans to weak firms that perform poorly in recessions. And if tightening capital constraints signal an oncoming recession, then these banks may sell loan shares to diversify their loan portfolios.18
We solve this selection problem by controlling for all borrower and loan characteristics through the inclusion of loan-year fixed effects. Khwaja and Mian (2008) pioneered this approach, and it has recently been adapted to the syndicated loan market (e.g., Irani and Meisenzahl, 2017). Given that firms borrowing in the syndicated market in our sample always receive funding from more than one bank, we compare selling activity between banks within a given syndicate at a point in time. This approach removes confounding risk factors at the loan level—in addition to firm level—which is nontrivial given that firms typically have multiple loans outstanding, some of which might be unsecured and/or junior in debtors’ capital structures.
The coefficient |$\beta$| measures the effects of regulatory capital on term loan sales, controlling for any observable or unobservable differences between loans or within loans over time. If banks sell loans to reduce risk-weighted assets and bolster regulatory capital ratios, the coefficient |$\beta$| will be strictly negative. The null hypothesis is that regulatory capital is unimportant for loan sales (e.g., because banks can raise capital ratios through other means), which corresponds to |$\beta$| equal to zero.
For |$\beta$| to be unbiased, we require two identifying assumptions. Our first assumption is necessary to pin down a supply-side effect. Given that |$\beta$| is identified off within-loan variation, to identify a supply-side effect we require that borrowers be equally willing to remove or keep each lender in the syndicate. In principle, borrowers may prefer to retain the best banks, and these banks might have higher capital ratios (as in Mehran and Thakor 2011). Conversely, borrowers may prefer to separate from deteriorating banks, say because they have weaker monitoring incentives. That being said, we require that after a loan has been originated and begins trading in the secondary market, borrowers cannot block a preferred lender from exiting the syndicate when that lender wishes to do so.
Institutional features of the market and empirical tests together reassure us that this first assumption is likely to hold in our setting. First, a design feature of the syndicated loan market is that borrowers cannot influence secondary market trading activity and associated ownership changes.19 Second, term loan shares are identical in the sense that all lenders receive the same contract terms. Moreover, in contrast to credit line shares, funds are disbursed at origination and banks will not have to perform other functions in the future (e.g., provide liquidity under a credit line commitment). Thus, since holdings of a given term loan are identical, it seems unlikely that borrowers will prefer one bank over another in the years following origination, say because the regulatory capital ratio of one bank deteriorates. While we do not believe that borrowers can or will separate from low-capital syndicate members ex post for reasons driven by loan quality, we can find evidence consistent with this assumption. In particular, it is plausible that borrowers have less influence over syndicate structure when the contract is not up for renegotiation or being refinanced. Since we can identify such loan amendments in the data, if we can show that |$\beta$| is similar when we estimate our model on this subsample, then we can alleviate this concern.
The remaining challenge is less innocuous and arises from potential correlations among supply-side characteristics. This could complicate identification even if we exclude borrower selection effects. For example, suppose low-capital banks have weaker risk management or are larger and better diversified. Then our estimate of |$\beta$| could be biased, as Tier 1 Capital/RWA|$_{j,t-1}$| could proxy for these other bank-level factors.
To address this potential issue, we take three steps. First, we always relate loan sales to banks’ Tier 1 capital ratios conditional on other bank and loan characteristics. Bank control variables include size, funding structure, performance, and loan portfolio composition. These factors can differ significantly by bank regulatory capital (see Table 2). To account for persistent characteristics, like bank ownership or the level of originate-and-distribute activity in the syndicated loan market, we control for bank fixed effects. We also include controls at the loan-lender-year level to capture banks’ importance within the syndicate. If relationship banks cross-sell other products, then they might prefer to retain ownership irrespective of capital levels (Bharath et al. 2007). We therefore control for the fraction of the loan held by the lender and a Lead Arranger indicator variable.
Second, we test how the link between banks’ regulatory constraints and loan sales varies in the time series according to how difficult it is to raise capital (in terms of both retained earnings and access to external funding) and in the cross-section of loans by regulatory risk assessment. Since regulatory risk assessments map into capital charges, the latter test provides a clear and direct loan-level examination of the regulatory capital management channel of loan sales.
Third, we use plausibly exogenous shocks to bank capital arising from the post-crisis Basel III regulation to further alleviate concerns regarding time-varying omitted bank-level variables. As described in detail later, while the timing and content of the internationally agreed version of the reform was well understood, the precise implementation of the rule in the United States differed along several dimensions and surprised banks (Berrospide and Edge 2016). Notably, in 2012:Q2, U.S. banking agencies proposed adjustments to both the types of capital counted toward Tier 1 capital and the risk-weights on numerous real estate exposures. The discrepancies found in the U.S. rule were largely unanticipated and created “winners” and “losers,” whereby the losers faced unexpected shortfalls in regulatory capital following the announcement. This holds even among banks with similar risk profiles ex ante, for example, regulatory capital ratios under Basel I. While this setting is restricted to a narrow window, it provides variation in bank capital that is orthogonal to characteristics related to commercial lending activity—including risk within the syndicated loan portfolio—that might otherwise drive loan retention.
2.2 Regulatory capital constraints and bank loan sales
We begin our analysis by examining the statistical relationship between term loan sales activity and banks’ Tier 1 capital ratio. The Tier 1 capital ratio, a crucial measure of banks’ loss-bearing capacity, is calculated based on risk-weighted assets (RWA). Banks with low Tier 1 ratios are closer to regulatory constraints and may have incentives to lower RWA to enhance this ratio. To test this hypothesis in the context of syndicated loans, we estimate Equation (1). If capital constraints cause bank loan sales, then we expect the coefficient on Tier 1 capital (|$\beta$|) to risk-weighted assets to be negative.
Table 3 presents the first results. In column [1], we estimate the model for the sample of term loan shares funded by U.S. banks. We estimate the model on the period from 2002 to 2014, during which time the loan secondary market was active. The model includes bank and loan-year fixed effects, as well as time-varying bank and loan controls. The point estimate for Tier 1 Capital/RWA is negative (–0.158) and statistically significant at the 1% confidence level. The direction of this estimate is consistent with our prior finding that banks with relatively low levels of regulatory capital have a higher probability of selling loan shares to reduce risk-weighted assets.
Bank regulatory capital and syndicated loan sales
| Dependent variable: |$Loan Sale_{ijt}$| | Regulatory rating | |||
|---|---|---|---|---|
| Baseline | Dynamic | Pass | Fail | |
| [1] | [2] | [3] | [4] | |
| Tier 1 Capital/RWA|$_{t-1}$| | -0.158*** | -0.189*** | -0.108* | -0.499** |
| (0.057) | (0.050) | (0.060) | (0.196) | |
| Tier 1 Capital/RWA|$_{t-1} \ \times$|TED|$_t$| | -0.292*** | |||
| (0.070) | ||||
| Size|$_{t-1}$| | -0.004 | 0.005 | -0.002 | -0.012 |
| (0.004) | (0.003) | (0.004) | (0.012) | |
| Wholesale Funding|$_{t-1}$| | 0.110*** | 0.100*** | 0.111*** | 0.121** |
| (0.017) | (0.014) | (0.018) | (0.057) | |
| Real Estate Loan Share|$_{t-1}$| | 0.020 | 0.043*** | 0.027 | -0.036 |
| (0.019) | (0.017) | (0.020) | (0.062) | |
| C&I Loan Share|$_{t-1}$| | -0.119*** | -0.052** | -0.076** | -0.303*** |
| (0.030) | (0.026) | (0.031) | (0.004) | |
| Non-Interest Income|$_{t-1}$| | 0.009 | -0.003*** | -0.001*** | -0.003*** |
| (0.018) | (0.000) | (0.000) | (0.001) | |
| Loan Share/Assets|$_{t-1}$| | 0.006*** | 0.005*** | 0.006*** | 0.008 |
| (0.001) | (0.001) | (0.002) | (0.005) | |
| Lead Arranger|$_{t-1}$| | -0.028*** | -0.027*** | -0.026*** | -0.033*** |
| (0.003) | (0.003) | (0.003) | (0.009) | |
| Bank controls |$\times$|TED|$_t$| | N | Y | N | N |
| Bank fixed effects | Y | Y | Y | Y |
| Loan-year fixed effects | Y | Y | Y | Y |
| Observations | 97,238 | 97,238 | 83,759 | 13,479 |
| (R2) | 0.878 | 0.873 | 0.881 | 0.870 |
This table shows the effects of bank regulatory capital for loan sales. The unit of observation in each regression is a loan share-bank-year triple. The dependent variable is an indicator variable equal to one if a lender reduces its ownership stake in a loan that it funded in the previous year. Column [1] includes the sample of loan sales from 2002 to 2014. Column [2] interacts capital with the TED spread (|$TED_t$|), defined as the yearly average of the daily difference between the three-month London Interbank Offered Rate (LIBOR) and the three-month U.S. Treasury rate. Note that |$TED_t$| is demeaned. Columns [3] and [4] classify a loan as “Pass” by the examining agency if it has not been criticized in any way and “Fail” otherwise (i.e., the loan is rated special mention, substandard, doubtful, or loss). All columns include controls for bank and loan-year fixed effects, and an indicator variable for whether the bank has undergone a merger in the past year. All variables are defined in Table A1. Standard errors (in parentheses) are clustered at the loan level. ***, **, and * denote 1%, 5%, and 10% statistical significance, respectively.
The remaining columns of the table provide more stringent tests of a bank capital channel. First, note that during times of marketwide uncertainty, banks face limited access to external equity capital. Under such circumstances, undercapitalized banks will have heightened incentives to shed risk-weighted assets. To test this idea, we interact regulatory capital with a measure of the tightness of banks’ funding conditions. We use the TED spread (|$TED_t$|), which we measure as the average difference between the three-month London Interbank Offered Rate (LIBOR) and the three-month Treasury rate. This average is calculated at the annual frequency and demeaned, for ease of comparison with column [1]. The spread peaked in 2008, but also shows considerable time variation, with a higher |$TED$| indicating worse access to funds (Cornett et al. 2011). Consistent with this idea, column [2] shows that the estimated effect of Tier 1 capital is larger in magnitude when the TED spread is elevated.
Second, we analyze how bank capital interacts with loan-level credit ratings. To more effectively reduce total risk-weighted assets, banks might sell loans with higher risk-weights. The expected losses associated with nonperforming loans are higher, and therefore such loans have higher risk-weights and require more regulatory capital.20 Thus, low-capital banks might have greater incentives to sell nonperforming loans as compared with banks that have more capital.
We test this hypothesis using supervisory credit ratings. As part of the annual SNC review, bank examiners classify loans as “pass” or “fail” depending on whether they are nonperforming or not. Loans are classified as fail if they are in default (about to be charged off or nonaccrual) or if the examiner uncovers serious deficiencies, in which case the loan is labeled “doubtful,” “substandard,” or “special mention.” We reestimate Equation (1) separately for loan-year observations that are classified as pass or fail. In columns [3] and [4], we find negative and statistically significant estimates of |$\beta$| for the pass and fail subsamples. However, the relation between Tier 1 capital and loan sales is much larger in magnitude for nonperforming loans (and significant at the 1% level). Hence, credit ratings matter in a way that is consistent with banks with lower regulatory capital having stronger incentives to reduce risk-weighted assets.
2.2.1 Further analysis of bank loan sales
This baseline result survives several robustness tests reported in Table 4. In panel A, we first restrict the sample to loans outside of the finance, insurance, and real estate and construction (FIRE) industries. We exclude these industry sectors for two reasons. First, we wish to understand whether capital constraints lead purely to a reshuffling of interbank loans. Second, we know that real estate firms were under considerable stress during the 2007 to 2009 period. In either case, the results would not be uninteresting per se, but it might narrow the interpretation somewhat. Column [1] indicates that loans to these industries make up about 15% of the sample, which is nontrivial. It also shows that dropping these industries has a negligible effect on the coefficient of interest.
Bank capital and loan sales: Further tests
| Panel A: Specification checks | |||||
|---|---|---|---|---|---|
| Dependent variable: |$Loan \ Sale_{ijt}$| | |||||
| Exclude | No | Credit | Alternate | Exclude | |
| FIRE | Amend | lines | timing | fixed effects | |
| [1] | [2] | [3] | [4] | [5] | |
| Tier 1 Capital/RWA|$_{t-1}$| | -0.179*** | -0.151** | 0.051 | -0.044 | -0.198*** |
| (0.061) | (0.060) | (0.037) | (0.027) | (0.054) | |
| Bank fixed effects | Y | Y | Y | Y | N |
| Loan-year fixed effects | Y | Y | Y | Y | N |
| Observations | 83,707 | 87,510 | 343,241 | 161,794 | 97,238 |
| (R2) | 0.878 | 0.878 | 0.712 | 0.860 | 0.100 |
| Panel B: Alternative measurement of loan sales | ||||||
|---|---|---|---|---|---|---|
| Dependent variable: | |$Loan \ Share_{ijt} / Assets_{i,t-1}$| | |$Loan \ Sale \ Amount_{ijt} / Assets_{i,t-1}$| | ||||
| Size-based classification: | None | None | Below med. | Above med. | Top dec. | |
| [1] | [2] | [3] | [4] | [5] | ||
| Tier 1 Capital/RWA|$_{t-1}$| | 4.030*** | 2.153*** | -0.094** | -0.095* | 0.035 | |
| (0.347) | (0.281) | (0.045) | (0.053) | (0.054) | ||
| Bank fixed effects | N | Y | Y | Y | Y | |
| Loan-year fixed effects | Y | Y | Y | Y | Y | |
| Observations | 161,794 | 161,794 | 74,321 | 74,213 | 60,320 | |
| (R2) | 0.635 | 0.860 | 0.882 | 0.850 | 0.768 | |
| Panel C: Alternative measurement of regulatory capital | |||||||||
|---|---|---|---|---|---|---|---|---|---|
| Dependent variable: |$Loan \ Sale_{ijt}$| | |||||||||
| Regulatory capital measure: | Tier 1 Gap|$_{t-1}$| | Total Capital/RWA|$_{t-1}$| | |||||||
| Regulatory rating | Regulatory rating | ||||||||
| Baseline | Dynamic | Pass | Fail | Baseline | Dynamic | Pass | Fail | ||
| [1] | [2] | [3] | [4] | [5] | [6] | [7] | [8] | ||
| Capital|$_{t-1}$| | -0.469*** | -0.314*** | -0.479*** | -0.470* | -0.171*** | -0.185*** | -0.127*** | -0.484*** | |
| (0.077) | (0.079) | (0.082) | (0.256) | (0.047) | (0.047) | (0.049) | (0.148) | ||
| Capital|$_{t-1} \ \times$|TED|$_t$| | -0.698*** | -0.300*** | |||||||
| (0.118) | (0.073) | ||||||||
| Bank controls | Y | Y | Y | Y | Y | Y | Y | Y | |
| Bank controls |$\times$|TED|$_t$| | N | Y | N | N | N | Y | N | N | |
| Bank fixed effects | Y | Y | Y | Y | Y | Y | Y | Y | |
| Loan-year fixed effects | Y | Y | Y | Y | Y | Y | Y | Y | |
| Observations | 97,238 | 97,238 | 83,759 | 13,479 | 97,238 | 97,238 | 83,759 | 13,479 | |
| (R2) | 0.872 | 0.873 | 0.876 | 0.854 | 0.872 | 0.873 | 0.876 | 0.854 | |
This table shows robustness checks for the effects of bank regulatory capital for loan sales. The unit of observation in each regression is a loan share-bank-year triple. The dependent variable is an indicator variable equal to one if a lender reduces its ownership stake in a loan that it funded in the previous year. In panel A, Column [1] excludes loans made to finance, insurance, and real estate sectors. Column [2] restricts the sample to loan years in which no contract amendment or refinancing took place during the year. Column [3] includes credit line loan shares in the sample. Column [4] examines the extended time period, including from 1993 to 2001, where the loan secondary market was less active. Column [5] drops the bank and loan-year fixed effects. Panel B examines alternative measures of loan sales. In columns [1] and [2], the dependent variable is the loan size in dollars scaled by bank assets at the end of the previous year. In columns [3] to [5], the numerator is instead the dollar value of the loan share sold scaled by bank assets. Here, we separately consider sales that are small (below median loan sale size), large (above median), and the largest (top decile). Panel C examines alternative measures of bank regulatory capital as independent variables and repeats the tests described in Table 3. All columns include the bank controls shown in Table 3, controls for bank and loan-year fixed effects, and an indicator variable for whether the bank has undergone a merger in the past year. All variables are defined in Table A1. Standard errors (in parentheses) are clustered at the loan level. ***, **, and * denote 1%, 5%, and 10% statistical significance, respectively.
Column [2] restricts the sample to observations in which there were no changes to the underlying contract (we drop approximately 10,000 loan-years). As described in Section 2.1, borrower-side factors should play a less prominent role in loan sales for these observations. As indicated in the column, the estimate is largely unchanged in terms of both size and statistical significance for this “No Amend” sample. This gives us confidence that the loan sale decision reflects banks’ incentives, including regulatory capital constraints.
The next two columns conduct tests that falsify our main result. Column [3] estimates our baseline specification for credit lines. As argued in Section 1.2, the credit line secondary market has limited depth, and it is therefore less likely that low-capital banks would undertake credit line sales to relax capital constraints. Consistent with this expectation, the column shows a statistically insignificant relation between bank capital and credit line sales. In column [4], we incorporate data from the 1993 to 2001 period, during which time there was very limited activity in the secondary market for syndicated loans.21 For this alternative timing, we find that the coefficient on Tier 1 capital continues to be negative, but is smaller than our baseline effect and marginally statistically insignificant (|$p = 10.03$|).
We next investigate the importance of omitted variables in our baseline framework. Column [5] repeats the baseline estimation excluding time-varying bank control variables, bank fixed effects, and loan-year fixed effects following Altonji, Elder, and Taber (2005). The coefficient on Tier 1 Capital/RWA is unchanged in terms of magnitude and statistical significance, but the |$R^2$| declines by 77.8 percentage points (from 87.8 to 10.0). This finding strongly supports the exogeneity of Tier 1 Capital/RWA and indicates a limited role for selling based on unobservable factors.22 In Section 2.4, we isolate plausibly random variation in capital to further mitigate concerns regarding selection on unobservables.
Panel B examines alternative measures of loan sales. We first estimate Equation (1) replacing the loan sale indicator as the independent variable with a continuous measure of loan share retention. In particular, we use the dollar value of loan share |$i$| held by bank |$j$| scaled by lagged total assets (Loan Share|$_{ijt}$|/Assets|$_{ij,t-1}$|), which captures a bank’s net exposure to a given loan with its portfolio. This approach allows us to rule out the possibility that low-capital banks simply trade more often on both the buy and sell sides. Column [1] estimates this model with loan and year fixed effects, as well as the full set of time-varying bank controls. The coefficient on Tier 1 Capital/RWA is positive (4.030) and statistically significant at the 1% level. In column [2], similar results emerge when we include bank fixed effects to control for time-invariant differences between banks. Thus, banks with higher Tier 1 capital retain a greater exposure to a given loan on their balance sheet.
We next examine the size of the loan share sale as a function of bank capital. We measure the dollar value of the loan share sale and scale by (lagged) bank assets, Loan Sale Amount/Assets. Using this measurement, we construct indicators for small sales (below median), big sales (above median), and the largest sales (top decile). As shown in columns [3] to [5], we find similar effects for small and big sales, although the largest loan sales do not appear to respond to bank capital. One potential explanation of this finding is that very large loan share sales might send a negative signal into the market regarding either the borrower’s condition or the selling bank’s condition.23
In panel C, we consider two alternative definitions of bank regulatory capital. First, following Plosser and Santos (2018), we estimate a bank’s distance from its “target” Tier 1 capital ratio, as opposed to the level of regulatory capital considered thus far. The target is determined by bank characteristics and macro conditions. Tier 1 Gap is calculated as the residual from a regression of Tier 1 capital to risk-weighted assets on bank size, return-on-assets, leverage, and year fixed effects. We estimate this residual on an annual basis for each bank from 1992 to 2013, since we use lagged bank variables. Second, we use the level of total capital (Tier 1 plus Tier 2) to risk-weighted assets, which is a related but broader measure of regulatory capital. For both of these alternative measures, the results are nearly always in line with our benchmark estimates in both magnitudes and statistical significance. These additional findings underscore the importance of regulatory capital for loan trading activity, especially among the riskier loan types that carry high capital charges.24
We conduct five additional tests, the results of which are reported in the Internet Appendix. First, for the subset of publicly traded firms, we find that undercapitalized banks are more likely to sell the loans of borrowers that have recently violated financial covenants or experienced a downgrade of their long-term public credit rating (see Appendix IA.VI). Second, we do not find evidence that banks systematically use credit default swaps (CDS) to hedge the risks in syndicated loans (see Appendix IA.VII).25 Third, we do not find that our findings are driven by capital constraints among the subset of small banks (fewer than |${\$}$|1 billion in assets, following Berger and Bouwman 2013).26 Likewise, we find similar effects for both publicly traded and privately held banks, suggesting that access to public equity does not ameliorate the effect of capital constraints on loan sales (see Appendix IA.VIII).
Finally, we find strong empirical support for the idea that undercapitalized banks are more willing to offload nonrelationship loans (e.g., Mehran and Thakor, 2011). Notably, in Table 3, we estimate a large and negative (always significant at the 1% level) effect of being a lead arranger on the probability of a loan sale. We dig deeper using prior lending outcomes for borrowers in the SNC data to measure the presence and strength of relationships three ways following Bharath et al. (2007): (i) whether the lender provided any prior loan; (ii) the number of prior loans (scaled by number of prior loans extended); and (iii) the dollar value of prior loans (scaled by the dollar value of prior loans extended), all based on a five-year look-back period for each borrower. For all three measures, the coefficient of interest is negative and statistically significant only among the loan shares that have weak bank-borrower relationships (see Appendix IA.IX).
Overall, we find strong evidence of an increase in loan sales among banks with lower Tier 1 capital. Our findings suggest that banks facing regulatory constraints may cut risk-weighted assets and enhance capital ratios by selling loan shares in the secondary market.
2.3 Reallocation of credit to nonbanks
Our graphical evidence shows the systematic entry of nonbanks into the syndicated term loan market since the early 2000s, especially CLOs and investment funds (see Figure 1). Our regression evidence so far suggests that at least part of this entry reflects the decision by banks to circumvent the capital requirements associated with corporate loans. In this section, we pin down the relation between bank capitalization and nonbank share at the loan level. Given the evidence, it seems almost tautological that nonbanks will fill the gap when capital-constrained banks reduce exposure. However, it may be the case that credit is exclusively reallocated to other commercial banks.27 This would limit the ability of bank capital constraints to explain nonbank entry into the syndicated loan market.
Table 5 analyzes the relation between bank capital and nonbank entry. We collapse the data to the loan-year level and estimate our baseline regression model with bank- and loan-level controls. Nonbank entry (Nonbank Share|$_{it}$|) for loan |$i$| in year |$t$| is measured as the fraction of the loan held by nonbanks. The (lagged) Tier 1 capital ratio is now measured at the syndicate level by aggregating across banks within each loan-year using an equally weighted average, and similarly for the bank control variables.
Nonbank entry
| Dependent variable: Nonbank Share|$_{it}$| | |||||
|---|---|---|---|---|---|
| Syndicate aggregation: Mean (EW) | |||||
| Regulatory rating: | All | All | All | Fail | Fail |
| [1] | [2] | [3] | [4] | [5] | |
| Tier 1 Capital/RWA|$_{t-1}$| | -1.547*** | -1.582** | -1.460*** | -1.406*** | -1.025*** |
| (0.470) | (0.640) | (0.183) | (0.304) | (0.316) | |
| Tier 1 Capital/RWA|$_{t-1} \ \times$|TED|$_t$| | -2.954*** | -4.655*** | |||
| (0.601) | (0.980) | ||||
| Bank controls | Y | Y | Y | Y | Y |
| Loan controls | N | Y | Y | Y | Y |
| Year fixed effects | Y | Y | Y | Y | Y |
| Observations | 39,058 | 29,121 | 29,121 | 5,380 | 5,380 |
| (R2) | 0.102 | 0.203 | 0.210 | 0.266 | 0.270 |
This table shows the effects of bank regulatory capital for loan acquisition by nonbanks. The unit of observation in each regression is a loan-year. The dependent variable is the fraction of the loan held by nonbanks. Columns [3] and [5] interact bank capital with the TED spread (|$TED_t$|), which is defined as the yearly average of the daily difference between the three-month London Interbank Offered Rate (LIBOR) and the three-month U.S. Treasury rate. Note that |$TED_t$| is demeaned. Columns [4] and [5] consider loans that have been classified as “Fail” by the examining agency. These are loans rated special mention, substandard, doubtful, or loss. Where indicated, independent variables—bank controls shown in Table 3—are coded at the loan syndicate level by taking the simple (equally weighted) average across syndicate member banks. The sample period is from 1993 to 2014. Where indicated, the columns include controls for bank, loan, and year fixed effects, and loan controls (a regulatory pass/fail dummy and the natural logarithm of loan maturity). All variables are defined in Table A1. Standard errors (in parentheses) are clustered at the year level. ***, **, and * denote 1%, 5%, and 10% statistical significance, respectively.
In column [1], we take the simple average of bank characteristics across syndicate member banks and uncover a negative relation between Tier 1 capital and the nonbank share (significant at the 1% level). In terms of economic magnitudes, this point estimate indicates that a one-standard-deviation decrease in bank capital (2.1%) results in a 3.25 percentage point increase in nonbank share, which is 14.1% of the mean nonbank share (23.1%). Column [2] finds similar effects once we additionally control for loan characteristics. Column [3] interacts Tier 1 capital with the TED spread and shows larger effects when banks’ costs of funding are elevated. Finally, we analyze nonbank entry among the subsample of regulatory “fail” loans (5,380 loans) and uncover two important findings. First, column [4] indicates that, on average, the relation between nonbank entry and bank capital among nonperforming loans is similar to the relation for performing loans. Second, we find the effect of capital on nonbank share intensifies for nonperforming loans when the TED spread is high (column [5]). Thus, syndicates featuring undercapitalized banks attract nonbanks, and this effect is stronger among nonperforming loans, but only when funding conditions tighten.
Table 6 confirms the robustness of these findings. We first explore alternative ways of aggregating bank characteristics (including Tier 1 Capital/RWA) to the syndicate level. We consider loan share value-weighting (column [1]), taking the median value (which mitigates the influence of outliers, see column [2]), taking the simple average among the “dominant” banks holding the three largest loan stakes (column [3]), and using the characteristics of the lead arranger bank only (column [4]). Aside from finding a robust negative relation across all measures, two interesting findings emerge. First, when we focus on the banks with the greatest stakes—by value-weighting or looking at the dominant banks—the negative relation becomes stronger and more precisely estimated. Second, the negative relation between bank capital and nonbank entry becomes far weaker in magnitude when we consider the lead arranger’s condition.
Nonbank entry: Further tests
| Dependent variable: Nonbank Share|$_{it}$| | |||||||
|---|---|---|---|---|---|---|---|
| Robustness test: | Syndicate aggregation | Capital measurement | |||||
| Syndicate aggregation: | VW | Median | Dominant | Lead | EW | EW | |
| [1] | [2] | [3] | [4] | [5] | [6] | ||
| Tier 1 Capital/RWA|$_{t-1}$| | -4.323*** | -0.962*** | -2.083*** | -0.563*** | |||
| (0.548) | (0.438) | (0.410) | (0.169) | ||||
| Tier 1 Gap|$_{t-1}$| | -1.830*** | ||||||
| (0.452) | |||||||
| Total Capital/RWA|$_{t-1}$| | -1.349*** | ||||||
| (0.304) | |||||||
| Bank controls | Y | Y | Y | Y | Y | Y | |
| Loan controls | Y | Y | Y | Y | Y | Y | |
| Year fixed effects | Y | Y | Y | Y | Y | Y | |
| Observations | 29,121 | 29,121 | 29,121 | 29,121 | 29,121 | 29,121 | |
| (R2) | 0.542 | 0.545 | 0.549 | 0.540 | 0.419 | 0.419 | |
This table shows robustness checks for the effects of bank regulatory capital for loan acquisition by nonbanks. The unit of observation in each regression is a loan-year. The dependent variable is the fraction of the loan held by nonbanks. Columns [1] to [4] use alternative methods to aggregate independent variables—bank controls shown in Table 3—up to the loan syndicate level. In particular, we consider the loan share value-weighted average, the median value, the simple average among the three (“dominant”) banks with the largest loan shares, and the lead arranger’s bank characteristics. Columns [5] and [6] examine alternative measures of bank regulatory capital as independent variables. The sample period is from 1993 to 2014. Where indicated, the columns include controls for bank, loan, and year fixed effects, and loan controls (a regulatory pass/fail dummy and the natural logarithm of loan maturity). All variables are defined in Table A1. Standard errors (in parentheses) are clustered at the year level. ***, **, and * denote 1%, 5%, and 10% statistical significance, respectively.
Finally, we move beyond the Tier 1 capital ratio as a determinant of nonbank entry and examine the other two regulatory capital measures: the Tier 1 gap (column [5]) and total-risk-based capital ratio (column [6]). In both cases, we continue to find a robust negative and statistically significant relation between bank regulatory capital and nonbank entry.28
2.4 Plausibly exogenous variation from U.S. implementation of Basel III
Having established a robust negative association between bank capital and loan sales and nonbank entry, we next address a residual identification concern. While the loan-year specification takes care of loan-related factors, as discussed earlier, there remains a potential concern about omitted variables on the supply side. If these omitted variables jointly influence bank capital and loan sales activity, then the correlations reported so far could be spurious. While our examination of regulatory loan ratings and the inclusion of bank fixed effects helps—by alleviating concerns about persistent bank characteristics—it does not control for potential time-varying bank-level unobservables. To address this concern, we use a difference-in-differences approach based on plausibly exogenous variation in regulatory capital among U.S. banks that are active in the syndicated loan market. Specifically, we use “shocks” to bank capital arising from surprises in the U.S. implementation of the internationally agreed upon Basel III framework, which we now describe in detail.
The Basel Committee on Banking Supervision (BCBS) announced a new set of regulatory reforms in late 2010, including higher minimum capital standards for all banks.29 Generally speaking, the BCBS-endorsed Basel III capital reforms increased capital requirements for all banks relative to Basel I (i.e., for a given level of bank capital and risk-weighted assets). However, the local implementations of the capital reforms that were adopted varied from country to country, often including meaningful changes. The U.S. version of the reform (proposed by federal banking agencies in 2012:Q2) increased capital requirements even further and featured at least two major adjustments (Berrospide and Edge 2016).30 First, the U.S. version of the rule proposed adjustments to the list of items that counted toward Tier 1 capital. For example, it included in Tier 1 capital unrealized gains and losses in available-for-sale securities but removed some preferred stock and trust preferred securities. The discrepancy in the treatment of mortgage servicing rights was an especially punitive surprise.31 Second, it also adjusted how risk is accounted for among many exposures. Notably, the U.S. proposal included more refined risk measurement for residential mortgages, as well as greater risk-weights for high-volatility commercial real estate.
What is important for our purposes is that these surprise features of the U.S. rule created unexpected “winners” and “losers” in the cross-section of banks. That is, depending on their ex ante exposure to these U.S. adjustments, some banks will experience larger “shocks” in terms of “missing” regulatory capital under Basel III after the announcement of the U.S. rule. Crucially, this will be the case even among banks with similar risk-taking profiles ex ante, for example, regulatory capital buffers under Basel I. Naturally, our expectation is that, under the new regime, banks with larger regulatory capital shortfalls will need to recapitalize more and that this will induce greater loan sales and credit reallocation toward nonbanks.
The internal validity of this approach hinges on two assumptions. First, at least some of the specific features of the U.S. implementation constitute a shock in the sense that they were not anticipated by banks. This assumption is benign in the sense that if banks fully anticipate the negative implications of the U.S. rule for their capital positions, then they might decide to reduce risk-weighted assets by selling corporate loans prior to the announcement. This would lead us to underestimate the effects of the rule change. Second, we require that banks’ capital shortfalls under the proposed rule do not systematically differ along dimensions that would otherwise induce loan sales. While we can never exclude this possibility, we know that the prominent discrepancies in the U.S. rule concerned real estate exposures. In addition, later we examine several forward-looking measures of bank risk—especially risk in the syndicated loan portfolio—and show that the variation in bank capital induced by the announcement is largely orthogonal.
To implement this test, we use data from the Expanded Shared National Credit Program, which, in 2009, began to collect information on syndicated loans meeting the standard SNC at the quarterly frequency. Aside from the higher frequency of the data, the data structure is otherwise the same as the annual SNC described thus far. Table 7 summarizes the data. All variables are measured as of 2012:Q2, except for the loan sales variable, which is measured as a flow from 2012:Q2 to 2012:Q3. Compared with the annual sample from 1993 to 2014, loans in 2012:Q2 are larger in size and more widely distributed (lower Loan Share/Assets). The main dependent variable of interest is the Basel III Tier 1 Shortfall, which is the difference between a given bank’s Tier 1 capital under Basel I and under the announced U.S. implementation of Basel III. This variable is calculated for each bank given their capital and risk-weighted assets as of 2012:Q2.32
Summary stats for Basel III capital shortfall tests
| |$N$| | Mean | Std. | p25 | Med. | p75 | |$N$| | Mean | Std. | p25 | Med. | p75 | Raw diff. | [Norm. diff.] | |||
|---|---|---|---|---|---|---|---|---|---|---|---|---|---|---|---|---|
| [1] | [2] | [3] | [4] | [5] | [6] | [7] | [8] | [9] | [10] | [11] | [12] | [13] | [14] | |||
| Loan-level variables | ||||||||||||||||
| Loan Sale | 34,648 | 0.025 | 0.156 | 0 | 0 | 0 | ||||||||||
| Loan Share/Assets | 34,648 | 0.125 | 0.148 | 0.028 | 0.075 | 0.160 | ||||||||||
| Loan Size | 34,648 | 582.0 | 887.0 | 115.0 | 300.0 | 700.0 | ||||||||||
| Agent Bank | 34,648 | 0.164 | 0.370 | 0 | 0 | 0 | ||||||||||
| Bank-level variables | ||||||||||||||||
| Below-median capital shortfall | Above-median capital shortfall | |||||||||||||||
| Basel III Tier 1 Shortfall | 125 | -0.043 | 0.009 | -0.050 | -0.040 | -0.036 | 126 | -0.020 | 0.007 | -0.025 | -0.021 | -0.016 | -0.023 | [-2.76+] | ||
| Tier 1 Capital/RWA | 125 | 0.149 | 0.031 | 0.125 | 0.145 | 0.172 | 126 | 0.131 | 0.028 | 0.111 | 0.129 | 0.146 | 0.018 | [0.61+] | ||
| Bank Size | 125 | 22.29 | 1.556 | 21.22 | 22.08 | 23.07 | 126 | 22.11 | 1.883 | 20.80 | 21.52 | 22.81 | 0.090 | [0.03] | ||
| Wholesale Funding | 125 | 0.187 | 0.091 | 0.130 | 0.174 | 0.217 | 126 | 0.184 | 0.092 | 0.123 | 0.161 | 0.228 | 0.003 | [0.02] | ||
| Real Estate Loan Share | 125 | 0.685 | 0.192 | 0.617 | 0.743 | 0.845 | 126 | 0.674 | 0.181 | 0.600 | 0.706 | 0.825 | 0.011 | [0.05] | ||
| C&I Loan Share | 125 | 0.206 | 0.120 | 0.113 | 0.169 | 0.261 | 126 | 0.201 | 0.115 | 0.128 | 0.173 | 0.242 | 0.005 | [0.04] | ||
| Non-Interest Income | 125 | 0.264 | 0.169 | 0.160 | 0.235 | 0.318 | 126 | 0.246 | 0.150 | 0.153 | 0.220 | 0.290 | 0.018 | [0.12] | ||
| Return-on-Assets | 125 | 0.004 | 0.004 | 0.003 | 0.004 | 0.006 | 126 | 0.004 | 0.003 | 0.003 | 0.004 | 0.006 | 0.000 | [0.05] | ||
| Loan Loss Provision | 125 | 0.002 | 0.003 | 0.000 | 0.001 | 0.002 | 126 | 0.001 | 0.001 | 0.000 | 0.001 | 0.002 | 0.001 | [0.17] | ||
| Allowance for Loan Losses | 125 | 0.000 | 0.000 | 0.000 | 0.000 | 0.000 | 126 | 0.000 | 0.000 | 0.000 | 0.000 | 0.000 | 0.000 | [0.12] | ||
| Average(Loan PD) | 125 | 0.045 | 0.110 | 0.003 | 0.010 | 0.031 | 126 | 0.070 | 0.195 | 0.002 | 0.008 | 0.035 | 0.030 | [0.20] | ||
The sample is restricted to loans held by at least two U.S. banks with valid covariates as of 2012:Q2. Loan-level variables are averaged (unweighted) across loan share-years. Bank level variables are averaged across bank-years. Bank-level summary statistics split by above- and below-median Basel III Tier 1 Shortfall as of 2012:Q2. The sample includes data from 2012:Q2 and 2012:Q3. Differences in means (raw) are reported in column [13]. Normalized differences are reported in column [14]. We indicate normalized differences in excess of 0.25 with a “+” as per the Imbens and Rubin (2007) rule of thumb. All variables are defined in Table A1.
Since the postcrisis Basel III reform raised capital requirements for all banks, the shortfall is always negative, but we can see there is considerable heterogeneity between banks in terms of the severity of the shock. When we split the sample at the median shortfall, two important patterns emerge. First, while there are considerable differences in the capital shortfalls between the groups, we see that there is an overlap in the distributions of Tier 1 Capital/RWA. We can therefore find banks with similar regulatory capital going into the announcement that were assigned quite different shortfalls in the wake of the announcement. Second, there do not appear to be clear systematic differences in bank characteristics between the two groups, including forward-looking measures of loan performance. Importantly, there is no statistically significant difference in Average(Loan PD), which indicates that the average probabilities of default among the syndicated loans of both groups were similar.
Table 8 documents the influence of the 2012:Q2 capital reform for loan sales. To confirm the relevance of the shock, column [1] shows the “first-stage” effect of the rule change on regulatory capital. This is a bank-level regression of the change in Tier 1 capital (under Basel III) at the one-year horizon from 2012:Q2 to 2013:Q2. Column [1] shows a negative relation between the capital shortfall and changes in the capital ratio going forward. That is, banks that were more undercapitalized had (a more negative shortfall) increased regulatory capital by a greater amount over the subsequent year. The effect of the shortfall for regulatory capital holds after we control for the level of capital under Basel I in 2012:Q2, highlighting the incremental effect of the new regime for bank decision-making.
Basel III capital shortfall and bank loan sales
| Dependent variable: | |$\Delta$|Basel III Tier 1/RWA|$_{j}$| | |$Loan \ Sale_{ij}$| | |$\Delta$|Nonbank Share|$_{i}$| | |||||||
|---|---|---|---|---|---|---|---|---|---|---|
| Exclude | No | Exclude | Alternative | |||||||
| FIRE | amend | fixed effects | measurement | |||||||
| [1] | [2] | [3] | [4] | [5] | [6] | [7] | [8] | [9] | ||
| Basel III Tier 1 Shortfall | -0.152*** | -0.382*** | -0.409*** | -0.463*** | -0.491*** | -0.279** | -0.095** | |||
| (0.041) | (0.135) | (0.147) | (0.150) | (0.133) | (0.138) | (0.044) | ||||
| High MSR Exposure | 0.014*** | 0.012*** | 0.006*** | |||||||
| (0.003) | (0.003) | (0.002) | ||||||||
| Tier 1 Capital/RWA | -0.164*** | -0.295*** | -0.307*** | -0.349*** | -0.248*** | -0.003 | -0.143* | 0.048 | 0.155 | |
| (0.021) | (0.068) | (0.073) | (0.079) | (0.066) | (0.051) | (0.077) | (0.185) | (0.176) | ||
| Loan controls | N/A | N/A | N/A | N/A | N/A | N/A | N/A | Y | Y | |
| Loan fixed effects | N/A | Y | Y | Y | N | Y | Y | N/A | N/A | |
| Observations | 838 | 218,252 | 188,932 | 143,345 | 218,252 | 218,252 | 218,252 | 2,121 | 2,121 | |
| (R2) | 0.167 | 0.136 | 0.134 | 0.122 | 0.046 | 0.136 | 0.136 | 0.994 | 0.994 | |
This table shows the effects of the 2012:Q2 proposed changes in bank capital regulation under Basel III for loan sales. The independent variable of interest, Basel III Tier 1 Shortfall, measures the bank-level difference between the current (under Basel I) and proposed level of Tier 1 regulatory capital under Basel III. In column [1] the unit of observation in each regression is a bank. The dependent variable is the change in the Tier 1 capital ratio under Basel III from 2012:Q2 to 2013:Q2. In columns [2] to [8], the unit of observation in each regression is a loan share-bank double. The dependent variable is an indicator variable equal to one if a lender reduces its ownership stake in a loan in 2012:Q3 that it funded in 2012:Q2. Column [3] excludes loans made to finance, insurance, and real estate. Column [4] restricts the sample to loans for which no contract amendment or refinancing took place during 2012:Q2 or 2012:Q3. Column [5] drops loan fixed effects from the estimation. Columns [6] and [7] use the above-median value of mortgage servicing rights (High MSR Exposure) as an alternative measure of banks’ capital shortfall. Columns [8] and [9] use the loan syndicate-level change in the nonbank share as the dependent variable and aggregate the independent variables to the syndicate level (i.e., maximum capital shortfall and MSR exposure dummy). Where indicated, columns control for loan fixed effects, and indicator variables for whether loans shares are held by nonbanks or foreign banks. All columns include the bank control variables shown in Table 3, as well as Loan Sale Propensity, given by the fraction of loan shares sold per quarter, time-averaged between 2009:Q4 and 2012:Q2. Where indicated, columns include loan controls (loan-level average default probability and log loan maturity). All variables are defined in Table A1. Where “N/A” is shown, this indicates that the controls in question cannot be included. Standard errors (in parentheses) are clustered at the bank, loan, and year levels in columns [1], [2] to [7], and [8] to [9], respectively. ***, **, and * denote 1%, 5%, and 10% statistical significance, respectively.
Columns [2] to [7] show how banks engage in loan sales to meet the unexpected shortfall. Since this is a single cross-section, these regressions are at the loan share–bank level and include loan fixed effects. Thus, we identify the effect of the rule change off within-loan variation, analogously to Equation (1). The negative and statistically significant coefficient in column [2] indicates that banks with a greater capital shortfall were more likely to sell loan shares. Columns [3] and [4] of the table replicate earlier robustness checks, and, notably, show that the rule change does not simply induce a reshuffling of claims among banks.33
Column [5] repeats the test from column [2], excluding loan fixed effects to examine the exogeneity of the capital shortfall variable. Importantly, the point estimates are very similar in terms of size and statistical significance, indicating that the variation in sales behavior across loans is close to the variation in sales within loans. This supports our argument that the trading activity is most likely in response to the shock to regulatory capital, as opposed to correlated demand-side factors (e.g., Altonji, Elder, and Taber 2005).
Columns [6] and [7] consider mortgage servicing rights as an alternative measure of banks’ exposure to the shock. As described above, the treatment of mortgage servicing rights was surprisingly punitive under the U.S. Basel III implementation. Moreover, the size of the mortgage servicing business is plausibly exogenous with respect to risk in the syndicated loan portfolio, as of 2012:Q2. We implement this test using an indicator variable (High MSR Exposure) that is equal to one for banks with above-median mortgage servicing rights and zero otherwise. Confirming with the results for the Basel III capital shortfall, we find that banks with high exposure via mortgage servicing rights are more likely to sell off loans.34
The remaining columns show the implications for nonbank entry. We aggregate our data to the loan syndicate level in the quarters before and after the policy change. We then measure the change in the fraction of nonbanks in each syndicate (|$\Delta$|Nonbank Share) in the period surrounding the policy change and regress this variable on the syndicate-level measures of banks’ exposure to the shock. We adapt our measurement of bank-level exposure to the syndicate level along the lines of Section 2.3 by taking the maximal capital shortfall (column [8]) and holdings of mortgage servicing rights (column [9]) among banks in the syndicate. We include our set of bank controls (averaged among banks in the syndicate), as well as loan controls (loan maturity and loan quality).35 The point estimates indicate that loan syndicates with a higher capital shortfall (greater mortgage servicing rights) have a larger increase in nonbank holdings in the quarter after the U.S. capital rule was announced.36
3. Nonbank Funding and Credit Market Stability
Having connected bank capital constraints to a shift in the composition of credit toward nonbanks, in this section we analyze potential negative effects of this reallocation during the 2007–2008 financial crisis. Since shadow banks lack insured liabilities and may have limited access to central bank liquidity, funding fragility may force shadow banks to retrench from credit markets to meet liquidity needs during times of marketwide stress (e.g., Fahri and Tirole 2017; Chretien and Lyonnet 2018; Plantin 2014). This may occur by cutting off existing credit lines or refusing to issue new credit. Alternatively, these institutions might be forced to liquidate assets even when transactions must occur below fundamental values (Shleifer and Vishny 2011). Since nonbank financial institutions play an important role in funding syndicated loans, when stressed nonbanks pull back, particularly those with fragile funding structures, it may therefore have important real implications in terms of credit availability, as well as price volatility in the secondary market.37 Note that this reasoning relies on an aggregate credit crunch, or else other lenders could provide substitute credit or provide liquidity in secondary markets.38
3.1 Credit availability
We first examine how nonbank participation may have had a negative impact on credit availability. We analyze credit at both the loan and firm levels, although our description begins in terms of the loan-level analysis.
We begin with the full sample of loans in the SNC sample at 2006:Q4. We track these loans over time to construct two loan-level measures of credit availability that are complementary in the sense that they capture adjustments along the intensive and extensive margins. First, we consider the symmetric credit growth rate for loan |$i$|, Credit Growth|$_i$||$= \frac{Credit_{i,2008} - Credit_{i,2006}}{0.5*Credit_{i,2008} + 0.5*Credit_{i,2006}}$|, where |$Credit_{i,t}$| is measured at the end of year |$t$|. This measure accounts for both loan size adjustments, entry, and exit, as well as limiting the effects of extreme values. Second, we define |$Exit_i$| as a dummy variable equal to one if the loan has exited the SNC sample by the end of 2008. These measures are incorporated as dependent variables in our regression framework described later.
Our independent variables are the total loan-level share of loan funding coming from nonbanks, as well as the share from “stable” and “unstable” nonbanks. These variables are measured before the crisis, as of 2006:Q4. To operationalize the concept of nonbanks with fragile funding structures, we group nonbanks according to whether they have stable or unstable liabilities based on the nonbank classification outlined in Section 1.2. Nonbanks with stable liabilities include insurance companies and pension funds. The liabilities of these institutions have long and predictable durations with limited redemption risk (Chodorow-Reich, Ghent, and Haddad 2016). Nonbanks with unstable liabilities include broker-dealers, hedge funds, and other investment funds.39 In contrast, these institutions have liquid liabilities and often face sharp withdrawals during times of marketwide stress.
It is important to recognize that this framework identifies |$\beta$| from variation in outcomes across loans, as opposed to within loans. As a consequence, this estimation is subject to the potential selection problem: |${Nonbank \ Share}_{i,2006:Q4}$| might proxy for loan risk and demand-side factors that may also determine the dynamics of credit availability. This might occur, for example, if nonbanks hold only the riskiest loans as of 2006:Q4 and we cannot account for differences in risk in our regression framework.40
We take the following steps to mitigate this selection concern. First, in |$X_{i,2006:Q4}$|, we control for observable differences in borrower quality and other loan- and lender-level factors. In particular, we include controls for loan size, syndicate size, borrower industry, the (log) remaining maturity of the loan to proxy for effective seniority, and an indicator variable for whether the loan is downgraded by the regulator in either 2007 or 2008. The latter variable allows us to account for changes in credit risk. In addition, we control for the balance sheet characteristics of banks within each syndicate—size, capital, wholesale funding, and so on—since these factors may also influence credit availability (e.g., Cornett et al. 2011). These variables are measured for each bank as of 2006:Q4, and aggregated to the syndicate level using an equally weighted average.
Second, we gauge the relevance of the selection problem by directly examining the differences between borrowers in terms of ex ante characteristics as a function of nonbank funding. To this end, we utilize an SNC-Compustat match and examine differences in borrower characteristics as a function of nonbank loan funding among the subset of publicly traded firms. Appendix IA.XV tests for differences in key observable measures of borrower financial condition as of 2006:Q4, including size, profitability, debt capacity, debt servicing costs, and liquidity (e.g., Nini, Smith, and Sufi 2012). Using both univariate and multivariate tests, we find no clear relation between the (observable) ex ante financial condition of the borrower and nonbank, stable, and unstable participation. We also examine ex post borrower performance. If nonbanks choose to fund borrowers that are unobservably risky, then it is plausible that these borrowers would perform worse in terms of repayment prospects or default during the bad state of the world. Appendix IA.XVI examines ex post borrower performance in 2008 in terms of covenant violations, credit rating downgrades, and operating and stock market performance. In each case, we find no relation between nonbank share and borrower performance. Thus, while impossible to rule out—we do not have random variation in nonbank share (nor in stable and unstable nonbank share) between borrowers—the empirical evidence is also inconsistent with nonbank share proxying for some unobservable risk factor.41
Moving on to the empirical results, Table 10 measures the importance of nonbank funding for credit availability during the crisis. As indicated in column [1] of panel A, there is a negative and statistically significant (at the 1% level) estimated effect of the precrisis share of loan funding coming from nonbanks on the credit growth rate between the beginning of 2007 and the end of 2008. In columns [2] to [4], we show that this slowdown in credit is driven entirely by the share of nonbank loans that comes from unstable nonbanks—that is, those with fragile funding. In stark contrast, the precrisis safe nonbank share is not associated with any decline in credit availability. In panel B, we instead examine the rate at which loans exit the SNC, and a similar pattern emerges: nonbank loan participation is associated with a higher exit rate, and this effect only comes from an unstable nonbank share. The estimates are economically meaningful, too. Focusing on the point estimate in column [4], a ten percentage point increase in the precrisis share of unstable nonbank funding translates into a (0.418|$\times$|0.10 =) 4.18 percentage point increase in the borrower exit rate in 2008.42 Given the average exit rate of 66.13%, this indicates that the unstable nonbank effect can account for roughly (4.18/66.13 =) 6.32% of the average increase in the loan exit rate. Thus, unstable nonbank participation has a sizable negative association with credit availability during the crisis along both the intensive and extensive margins.
While analyzing credit availability at the level of the loan allows us to control for potential differences between loans (e.g., contract characteristics), it does indicate whether the firm as a whole suffers. Moreover, absent an aggregate credit crunch, it is plausible that other lenders could provide substitute credit.
To make progress on this issue, we first modify Equation (2) by instead considering how the change in credit availability for firm |$f$| is associated with the precrisis share of nonbank funding (loan value-weighted), that is, Nonbank Share|$_{f,\text{2006:Q4}}$|. To capture firm-level credit availability, we examine the symmetric credit growth rate, Credit Growth|$_{f,2008}$|, defined as the firm-level difference between credit (i.e., aggregated across all loans) in 2008:Q4 and 2006:Q4 divided by the average of credit in 2008:Q4 and 2006:Q4. We also consider the firm-level exit rate, Exit|$_{f,2008}$|, which is a dummy variable equal to one if the firm exits the SNC by the end of 2008. That is, all of the firm’s existing loans exit and the firm does not receive any new loans. As before, we disaggregate the Nonbank Share into its Unstable and Stable shares of total loan funding to shed light on the importance of nonbank funding for credit availability during the crisis.
As shown in columns [6] and [7] of Table 10, we uncover similar patterns for firm-level credit availability as well as its association with nonbank funding. As shown in panel A, firm-level credit growth has a negative association with the nonbank share (statistically significant at the 1% level), and this effect is driven entirely through unstable nonbank share. Likewise, in panel B, we see that the rate at which firms exit the SNC is positively associated with unstable nonbank share. We therefore find consistent effects at both the loan and firm levels, indicating that firms do not substitute to other syndicated loans.
To further investigate whether this reduction in syndicated credit matters at the firm level, we examine the parallel adjustments in overall debt utilization, employment, and asset growth during the crisis. If firms cannot easily substitute to external finance elsewhere (e.g., by selling bonds to other unconstrained lenders), then the nonbank credit shock may impact overall leverage and lead to cutbacks in real activities. To test this hypothesis, we focus on the firms in the SNC-Compustat matched sample, since these firms have the necessary balance sheet data. To measure the effects of precrisis nonbank funding on leverage and real activities, we use the same firm-level regression framework described earlier. As outcome variables, we consider the symmetric growth rate in firm-level total debt liabilities, employment (number of employees), and total assets between the precrisis and postcrisis periods.
The results shown in Appendix IA.XVII are consistent with a conventional credit supply shock. In column [1], we find that the firm-level growth rate in total debt has a negative association with the ex ante nonbank share, and this effect is statistically significant at the 10% level.43 In terms of real effects, we find a negative effect of ex ante nonbank share on both the firm-level growth rate in employment (column [2]) and total assets (column [3]) through the crisis. Both of these estimates are significant at at least the 10% level. Thus, the totality of evidence suggests that the contraction in credit through syndicated loans does transmit to key firm outcomes.44
Finally, to better understand the mechanism, we show that a withdrawal of nonbanks from the primary market—resulting in fewer new loans and fewer rollovers (or less credit conditional on a loan)—underpins the contraction in syndicated credit. Nonbanks are vulnerable to liquidity shocks because they rely on short-term funding and lack explicit backstops (e.g., central bank liquidity).45 This funding fragility can translate into disruptions in primary market activity: when funding markets are stressed, nonbanks may withdraw from the primary market in their role as syndicate participants. This may put additional strain on traditional banks’ balance sheets—particularly those acting in a lead arranger capacity—to plug funding gaps and continue to meet loan demand by absorbing larger loan shares from their borrowers (e.g., Bruche et al., forthcoming).46
To highlight this mechanism, we document the empirical relation between lead arranger and nonbank participation in the primary market over the credit cycle, including during the crisis years. We examine the time-series dynamics of both the Lead Share and Nonbank Share at the time of origination (year) for the full sample of 5,603 syndicated term loans from the SNC. We conduct regressions at the loan level in which we include dummies for the years 2002 until 2009 (2006 is the omitted year) and the full set of borrower industry and loan controls incorporated in Equation (2). The estimates, shown in Appendix IA.XVIII, indicate that Nonbank Share is lower in size in 2007 and 2008 (relative to 2006), and this effect is statistically significant at conventional levels (see column [1]). In addition, we see that Lead Share is elevated and statistically significant in the same years; however, this increase is not fully offsetting (see column [2]). Moreover, since the share of loans by all nonbanks is higher than the share by lead banks, the estimated coefficients suggest partial substitution. Taken together, these results suggest that nonbanks exit the primary market during the crisis and lead arrangers are able to take up some (but not all) of the slack. These findings are consistent with the drop in credit availability at the firm level, in terms of both syndicated loans (measured using firm-level data from the SNC) as well as total debt (measured using firm-level data from Compustat).
3.2 Loan price volatility
We next investigate the relation between nonbank funding and the discounts at which terms loans are traded during the financial crisis. We gather secondary market price data from the Loan Syndication and Trading Association (LSTA) Mark-to-Market Pricing data. These data provide daily bid and ask quotes for a subset of 116 syndicated term loans in the SNC.47 We estimate the daily loan price as the midpoint of the (average) bid and ask quote.48 Our main dependent variable is the 2007 to 2008 annual change in the secondary market loan price, which is the difference between the average daily price in 2008 and the corresponding value in 2007.
Panel B of Table 9 describes loans in the SNC-LSTA matched sample and the financial institutions funding them. The loans were trading at 97.9 cents in the relatively benign period in 2007. The average loan price was 8.8 percentage points lower in 2008. In terms of the institutions funding the loans, about 45% of the loans (in dollar terms) are funded by nonbanks, and 9.5% and 1.8% are funded by unstable and stable nonbanks, respectively. In terms of their participation in syndicates, these nonbank types appear more frequently: 70.0% (44.0%) of loan syndicates feature at least one unstable (stable) nonbank. Relative to the SNC population as of 2006:Q4 (panel A), these loans are larger in size—the average loan size of the matched sample is |${\$}$|750 million as compared with about |${\$}$|300 million for the full sample—that feature a greater nonbank participation (the average Non-Bank Share is about 14% for the full sample). This reflects the fact that traded loans with prices publicly posted by the LSTA are larger, more widely held, and therefore more likely to be liquid.49
Summary statistics for tests on real effects during the crisis
| Panel A: Full SNC sample | ||||||
|---|---|---|---|---|---|---|
| |$N$| | Mean | Std. | p25 | Med. | p75 | |
| [1] | [2] | [3] | [4] | [5] | [6] | |
| Loan characteristics | ||||||
| Credit Growth|$_{2008}$| | 6,439 | -1.342 | 0.945 | -2 | -2 | -0.091 |
| Exit|$_{2008}$| | 6,439 | 0.661 | 0.473 | 0 | 1 | 1 |
| Remaining Maturity|$_{2006:Q4}$| | 6,439 | 3.809 | 1.787 | 2 | 4 | 5 |
| Syndicate Size|$_{2006:Q4}$| | 6,439 | 16.67 | 35.87 | 4 | 7 | 14 |
| Loan Size|$_{2006:Q4}$| | 6,439 | 311.3 | 676.9 | 50 | 112 | 300 |
| Non-Pass | 6,439 | 0.058 | 0.234 | 0 | 0 | 0 |
| Syndicate member characteristics | ||||||
| Nonbank Share|$_{2006:Q4}$| | 6,439 | 0.140 | 0.245 | 0 | 0 | 0.163 |
| Unstable Nonbank Share|$_{2006:Q4}$| | 6,439 | 0.020 | 0.062 | 0 | 0 | 0 |
| Stable Nonbank Share|$_{2006:Q4}$| | 6,439 | 0.006 | 0.037 | 0 | 0 | 0 |
| Tier 1 Capital/RWA|$_{2006:Q4}$| | 6,439 | 0.088 | 0.038 | 0.080 | 0.081 | 0.086 |
| Bank Size|$_{2006:Q4}$| | 6,439 | 19.63 | 1.601 | 18.30 | 20.74 | 20.80 |
| Wholesale Funding|$_{2006:Q4}$| | 6,439 | 0.420 | 0.074 | 0.380 | 0.430 | 0.433 |
| Real Estate Loan Share|$_{2006:Q4}$| | 6,439 | 0.505 | 0.135 | 0.424 | 0.569 | 0.569 |
| C&I Loan Share|$_{2006:Q4}$| | 6,439 | 0.125 | 0.055 | 0.091 | 0.099 | 0.140 |
| Non-Interest Income|$_{2006:Q4}$| | 6,439 | 0.230 | 0.189 | 0.128 | 0.146 | 0.484 |
| Panel B: SNC-LSTA subsample | ||||||
| |$N$| | Mean | Std. | p25 | Med. | p75 | |
| [1] | [2] | [3] | [4] | [5] | [6] | |
| Loan characteristics | ||||||
| |$\Delta$|Loan Price|$_{2008}$| | 116 | -0.088 | 0.072 | -0.118 | -0.070 | -0.041 |
| Loan Price|$_{2006:Q4}$| | 116 | 0.979 | 0.024 | 0.973 | 0.986 | 0.992 |
| Remaining Maturity|$_{2006:Q4}$| | 116 | 3.664 | 1.157 | 3 | 4 | 4.5 |
| Syndicate Size|$_{2006:Q4}$| | 116 | 6.637 | 5.264 | 3 | 5 | 9 |
| Loan Size|$_{2006:Q4}$| | 116 | 761 | 1,130 | 148 | 346 | 861 |
| Non-Pass | 116 | 0.198 | 0.400 | 0 | 0 | 0 |
| Syndicate member characteristics | ||||||
| Nonbank Share|$_{2006:Q4}$| | 116 | 0.453 | 0.344 | 0.119 | 0.398 | 0.837 |
| Unstable Nonbank Share|$_{2006:Q4}$| | 116 | 0.095 | 0.112 | 0 | 0.057 | 0.147 |
| Stable Nonbank Share|$_{2006:Q4}$| | 116 | 0.018 | 0.032 | 0 | 0 | 0.024 |
| Tier 1 Capital/RWA|$_{2006:Q4}$| | 116 | 0.105 | 0.051 | 0.079 | 0.083 | 0.102 |
| Bank Size|$_{2006:Q4}$| | 116 | 18.83 | 1.169 | 18.18 | 18.89 | 19.39 |
| Wholesale Funding|$_{2006:Q4}$| | 116 | 0.421 | 0.041 | 0.396 | 0.415 | 0.445 |
| Real Estate Loan Share|$_{2006:Q4}$| | 116 | 0.260 | 0.078 | 0.221 | 0.248 | 0.283 |
| C&I Loan Share|$_{2006:Q4}$| | 116 | 0.150 | 0.078 | 0.107 | 0.140 | 0.187 |
| Non-Interest Income|$_{2006:Q4}$| | 116 | 0.154 | 0.031 | 0.136 | 0.153 | 0.174 |
The unit of observation in each panel is a loan. Panel A describes data for the full SNC sample of loans outstanding as of 2006:Q4. Panel B describes data for the subsample of SNC loans matched with the LSTA data. Syndicate member characteristics are measured as of 2006:Q4 and equally weighted across all banks in the syndicate. Loan-level variables are measured as of 2006:Q4, except for Non-Pass, which is measured over 2007 and 2008. All variables are defined in Table A1.
Figure 4 plots daily secondary market loan prices during the period from the beginning of 2007 until the end of 2008. We plot the average price across all loans in our sample, splitting loans according to whether they have an above- or below-median fraction of nonbank funding in 2006. The plot shows that the average price drop from the peak in January 2007 to the trough in December 2008 is about –35 percentage points. The price rebounds thereafter. Most loans traded close to par before the summer of 2007, although loans with greater nonbank funding appear to trade at a slight discount. The plot also suggests that the steepness of this price drop—as much as an 8 percentage point spread—is positively related to the nonbank funding of the syndicate.
Nonbank share and loan prices (2007–2009)
Average price (bid-ask midpoint) among traded syndicated term loans with above (solid) and below (dashed) median nonbank share. Nonbank share is the ratio of nonbank investment to total loan commitment.
Figure 5 further disaggregates these data according to the liability structure of the nonbanks funding each syndicate. Strikingly, the plot shows that the cross-sectional heterogeneity in loan prices is associated with the liability structure of the nonbank syndicate members. In particular, loans with an above-median share of unstable nonbank funding experience sharp declines in prices relative to syndicates with below-median unstable funding. No such price differential exists among loans with stable nonbank funding.
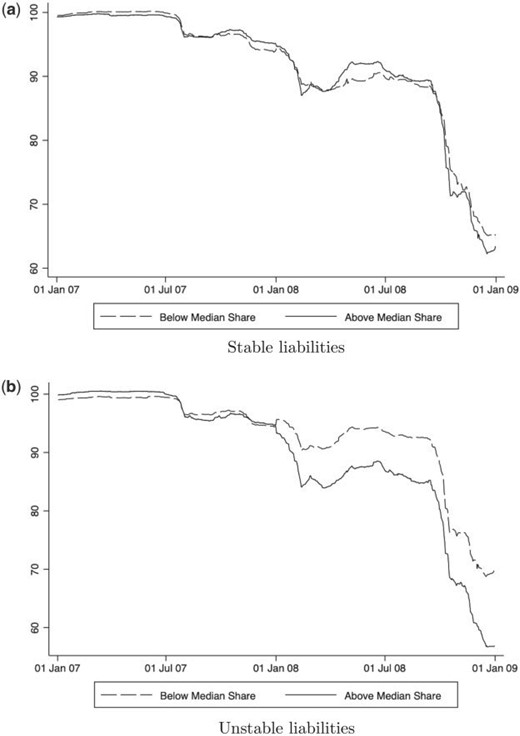
Nonbank liability structure and loan prices (2007–2009)
Average price (bid-ask midpoint) among traded syndicated term loans with above (solid) and below (dashed) median nonbank share in each category. The figure classifies syndicates according to whether nonbank syndicate members have stable (top panel) or unstable (bottom panel) liabilities. Nonbanks with stable liabilities are pension funds and insurance companies. Nonbanks with unstable liabilities are hedge funds, private equity, broker/dealers, and mutual funds. Nonbank share is the ratio of nonbank investment to total loan commitment.
Nonbank loan share and credit availability during the crisis
| Panel A: Credit growth in 2008 | ||||||||
|---|---|---|---|---|---|---|---|---|
| Dependent variable: Credit Growth|$_{2008}$| | Loan-level | Firm-level | ||||||
| [1] | [2] | [3] | [4] | [5] | [6] | [7] | ||
| Nonbank Share|$_{2006:Q4}$| | -0.428*** | -0.596*** | ||||||
| (0.064) | (0.111) | |||||||
| Unstable Nonbank Share|$_{2006:Q4}$| | -0.768*** | -0.791*** | -0.949*** | -0.864** | ||||
| (0.226) | (0.231) | (0.308) | (0.377) | |||||
| Stable Nonbank Share|$_{2006:Q4}$| | 0.406 | 0.499 | -0.340 | 0.189 | ||||
| (0.574) | (0.562) | (0.545) | (0.622) | |||||
| Loan/firm controls | Y | Y | Y | Y | Y | Y | Y | |
| Bank controls (synd. avg.) | N | N | N | N | Y | Y | Y | |
| Observations | 6,439 | 6,439 | 6,439 | 6,439 | 5,204 | 4,649 | 4,504 | |
| (R2) | 0.092 | 0.086 | 0.084 | 0.087 | 0.120 | 0.133 | 0.134 | |
| Panel B: Exit rate in 2008 | ||||||||
| Dependent variable: Exit|$_{2008}$| | Loan-level | Firm-level | ||||||
| [1] | [2] | [3] | [4] | [5] | [6] | [7] | ||
| Nonbank Share|$_{2006:Q4}$| | 0.225*** | 0.263*** | ||||||
| (0.050) | (0.050) | |||||||
| Unstable Nonbank Share|$_{2006:Q4}$| | 0.408*** | 0.418*** | 0.553*** | 0.439*** | ||||
| (0.164) | (0.113) | (0.147) | (0.164) | |||||
| Stable Nonbank Share|$_{2006:Q4}$| | -0.171 | -0.220 | 0.141 | -0.122 | ||||
| (0.295) | (0.287) | (0.302) | (0.297) | |||||
| Loan/firm controls | Y | Y | Y | Y | Y | Y | Y | |
| Bank controls (synd. avg.) | N | N | N | N | Y | Y | Y | |
| Observations | 6,439 | 6,439 | 6,439 | 6,439 | 5,204 | 4,649 | 4,504 | |
| (R2) | 0.034 | 0.086 | 0.084 | 0.086 | 0.118 | 0.133 | 0.133 | |
This table examines the effects of nonbank loan funding for the credit availability during the crisis at the loan and firm levels. In columns [1] to [5] ([6] and [7]), the unit of observation in each regression is a loan (firm). In panel A, the dependent variable is the symmetric credit growth rate defined as the difference between credit in 2008:Q4 and 2006:Q4 divided by the average of credit in 2008:Q4 and 2006:Q4. Credit at the firm level sums across all term loans to a given firm. In panel B, the dependent variable is a loan exit dummy, which is equal to one if the loan (present in 2006:Q4) has exited the SNC sample by 2008:Q4. Exit at the firm level requires that, by the end of 2008, all of the firm’s loans from 2006 have exited and the firm does not receive any new loans. Nonbanks with unstable liabilities include broker-dealers, hedge funds, and other investment funds, and nonbanks with stable liabilities include insurance companies and pension funds. Loan controls include loan size, syndicate size, borrower industry, the (log) remaining maturity, and an indicator variable for whether the loan is downgraded by the regulator in either 2007 or 2008. Loan control variables are measured as of 2006:Q4, except for Non-Pass, which is measured over 2007 and 2008. In columns [6] and [7], we instead include firm-level controls consisting of industry fixed effects and the total volume of credit as of 2006:Q4. Where indicated, columns include the bank controls shown in Table 3 (equal-weighted average across syndicate members and measured as of 2006:Q4). All variables are defined in Table A1. Heteroscedasticity-robust standard errors clustered at the industry-level are reported in parentheses. ***, **, and * denote 1%, 5%, and 10% statistical significance, respectively.
We use multivariate linear regression models to more rigorously investigate the relation between syndicate funding structure and loan prices during the crisis. We estimate cross-sectional regressions of the same form as Equation (2), but replacing |$\Delta Loan \ Price_{i}$|—the average annual change in the price of loan |$i$| from 2007 to 2008—as the dependent variable. As before, we put the share of nonbank funding of the syndicate as of 2006:Q4 (|${Nonbank \ Share}_{i,2006:Q4}$|) as the main independent variable of interest. As an additional reduced form control for loan risk, we include the average loan price level at the beginning of 2007 in |$X_{i,2006:Q4}$|. While the majority of loans trade at par, there is some variation around this value that likely captures loan quality.50 We interpret a negative |$\beta$| to mean that loans with greater nonbank funding are associated with steeper price drops between 2007 and 2008.
Table 11 presents results on price volatility during the crisis. Column [1] indicates that there is a negative and statistically significant estimated effect of the share of nonbanks funding the loan on the secondary market price change during the crisis. Column [2] includes loan and bank control variables, and the coefficient on nonbank share remains negative and statistically significant, although the coefficient reduces in size (from –0.084 to –0.049), indicating that these other factors play an important role.51 In terms of economic magnitudes, the conservative point estimate in column [2] indicates that a one-standard-deviation increase in the nonbank share (0.344) is associated with a –1.69 percentage point price change from 2007 to 2008. This indicates that the nonbank share accounts for 19.2% of the mean fall in loan prices (–8.8 percentage points). To gauge the size of this effect, note that Irani and Meisenzahl (2017) estimate that a one-standard-deviation increase in bank wholesale funding can account for about 26.2% of the average loan price decline during this period.
Nonbank loan share and price drop in the crisis
| Dependent variable: |$\Delta$|Loan Price|$_{2008}$| | ||||||||
|---|---|---|---|---|---|---|---|---|
| [1] | [2] | [3] | [4] | [5] | [6] | [7] | [8] | |
| Nonbank Share|$_{2006:Q4}$| | -0.084*** | -0.049** | ||||||
| (0.023) | (0.019) | |||||||
| Unstable Nonbank Share|$_{2006:Q4}$| | -0.236*** | -0.182** | -0.230*** | -0.182** | ||||
| (0.061) | (0.090) | (0.064) | (0.091) | |||||
| Stable Nonbank Share|$_{2006:Q4}$| | -0.237 | 0.006 | -0.114 | 0.020 | ||||
| (0.243) | (0.302) | (0.251) | (0.288) | |||||
| Non-Pass | 0.012 | 0.003 | -0.011 | 0.001 | -0.012 | 0.005 | -0.011 | |
| (0.019) | (0.017) | (0.020) | (0.018) | (0.019) | (0.016) | (0.018) | ||
| Log(Remaining Maturity)|$_{2006:Q4}$| | 0.006 | 0.010* | 0.015** | 0.004 | 0.011* | 0.009* | 0.015** | |
| (0.005) | (0.005) | (0.006) | (0.005) | (0.006) | (0.005) | (0.006) | ||
| Loan Price|$_{2006:Q4}$| | 1.468*** | 1.344*** | 1.466*** | 1.414*** | 1.600*** | 1.350*** | 1.466*** | |
| (0.329) | (0.334) | (0.382) | (0.352) | (0.365) | (0.326) | (0.387) | ||
| Bank controls (synd. avg.) | Y | Y | Y | Y | Y | Y | Y | Y |
| Observations | 116 | 116 | 116 | 79 | 116 | 79 | 116 | 79 |
| (R2) | 0.238 | 0.458 | 0.511 | 0.569 | 0.443 | 0.532 | 0.512 | 0.569 |
This table examines the effects of nonbank loan funding for the change in the secondary market loan price. The unit of observation in each regression is a loan. The dependent variable is the change in the loan price level between 2007 and 2008. The price level is measured as the average bid-ask midpoint. Nonbanks with unstable liabilities include broker-dealers, hedge funds, and other investment funds, and nonbanks with stable liabilities include insurance companies and pension funds. Columns [4], [6], and [8] require stable and unstable nonbanks to be present in the syndicate for sample inclusion. Bank-level variables are averaged across all bank syndicated members (equally weighted) as of 2006:Q4. Loan-level variables are measured as of 2006:Q4, except for Non-Pass, which is measured over 2007 and 2008. Where indicated, columns include the bank controls shown in Table 3 (equal-weighted average across syndicate members). All variables are defined in Table A1. Heteroscedasticity-robust standard errors clustered at the industry-level are reported in parentheses. ***, **, and * denote 1%, 5%, and 10% statistical significance, respectively.
Columns [3] to [8] repeat the estimation, now disaggregating the nonbank share into its unstable and stable nonbank share components. Two important results emerge that mirror the graphical evidence shown in Figure 5. First, the coefficient on Unstable Nonbank Share is negative and significant, whereas the coefficient on Stable Nonbank Share is statistically insignificant. Second, in terms of magnitudes, the most conservative point estimate for unstable nonbanks (–0.182; see column [8]) is far larger than for all nonbanks (–0.049; see column [2]). These patterns hold for the full sample of loans, as well as the subsample (79) of loans containing both stable and unstable nonbanks. Thus, sales by nonbanks with fragile funding—broker-dealers, hedge funds, and other investment funds—are associated with large and negative price effects during 2008.52
3.2.1 Who buys during the crunch?
To further understand why these price effects in 2008 came about, we examine the relation between the funding structure of financial institutions and loan purchasing activity. To this end, we collect all loan-share buy and sell transactions during 2007 and 2008. Loan buys are identified along the lines of loan sales: an institution |$j$| buys loan |$i$| in year |$t$| if it enters in |$t$| but is not present in year |$t-1$|. Based on these transactions, we analyze whether, first, banks with higher capital and, second, nonbanks with stable funding have greater propensities to purchase rather than sell loans in the secondary market.53
Panel A of Table 12 tests whether banks with greater regulatory capital were more likely to buy or sell loan shares through secondary transactions. For instance, well-capitalized banks may be able to attract short-term funding and increase loan shareholdings (e.g., Pérignon et al., 2018). We test this potential explanation by comparing the average Tier 1 capital ratio of banks selling loan shares with the corresponding value for buying banks. We begin by examining the 2008 (“crisis”) period of marketwide stress, with Tier 1 capital measured at the beginning of the year (2006:Q4), and find consistent evidence that banks buying loan shares had higher capital than banks selling loan shares. Columns [1] to [3] of the panel show, first, that the number of loan share sales during the crisis (1,069) exceeds the corresponding number of loan share sales in the year immediately prior to the crisis (701). Overall sales activity increased by banks during the crisis, and the gap between buys and sells closed relative to the period before the crisis. Second, the average Tier 1 capital ratio of buyers exceeded the sellers’ average by one percentage point. This difference increases to 1.1 percentage points for amendment-free trades and is significant at the 1% confidence level for both samples. In contrast, immediately prior to the crisis we find some evidence that buyers have more equity capital than sellers, although the differences are less economically meaningful.
Further evidence on term loan trading activity
| Panel A: Role of bank capital | |||||||
|---|---|---|---|---|---|---|---|
| Sample: | All trades | No amendments | |||||
| Sellers | Buyers | Raw diff. | Sellers | Buyers | Raw diff. | ||
| [Norm. diff.] | [Norm. diff.] | ||||||
| [1] | [2] | [3] | [4] | [5] | [6] | ||
| Crisis (2008) | |||||||
| Tier 1 Capital/RWA|$_{2007:Q4}$| | 0.087 | 0.097 | -0.010+ | 0.087 | 0.098 | -0.011+ | |
| [0.353] | [0.348] | ||||||
| |$N$| | 1,069 | 1,179 | 541 | 361 | |||
| Precrisis (2007) | |||||||
| Tier 1 Capital/RWA|$_{2006:Q4}$| | 0.090 | 0.091 | -0.001 | 0.091 | 0.091 | 0.000 | |
| [0.054] | [0.031] | ||||||
| |$N$| | 701 | 1,186 | 300 | 308 | |||
| Panel B: Stable and unstable nonbank trading activity | |||||||
| Timing: | Crisis (2008) | Precrisis (2007) | |||||
| Stable | Unstable | Diff. | Stable | Unstable | Diff. | ||
| [1] | [2] | [3] | [4] | [5] | [6] | ||
| Loans sold|$_{t}$|/holdings|$_{t-1}$| (%) | 6.50 | 9.86 | -3.36 | 6.73 | 6.87 | -0.14 | |
| Loans bought|$_{t}$|/holdings|$_{t-1}$| (%) | 13.18 | 9.20 | 3.98 | 6.16 | 7.93 | -1.77 | |
| Number of sells | 316 | 1,355 | 191 | 583 | |||
| Number of buys | 641 | 1,265 | 175 | 673 | |||
The table describes the identity buyers and sellers of term loan shares during the crisis (2008) and immediately prior to the crisis (2007). Panel A considers measures of bank Tier 1 capital for all buy and sell transactions by banks. A transaction is classified as a loan share sale (buy) whenever a bank that was (was not) in the syndicate in the previous year is not (is now) present this year. “No amendments” excludes transactions in years where the loan contract is amended. Each cell shows the average characteristic of the banks engaged in a loan share transaction as either sellers or buyers. A simple average is taken across loan transactions. The number of loan transactions (|$N$|) is indicated. The difference in the mean characteristic for each transaction type is indicated. Raw and normalized differences are reported in columns [3] and [6]. We indicate normalized differences in excess of 0.25 with a “+” as per the Imbens and Rubin (2007) rule of thumb. Panel B describes secondary market trading activity by nonbanks in the aggregate. As before, stable nonbanks include insurance companies and pension funds, and unstable nonbanks include broker-dealers, hedge funds, and other investment funds. Each cell shows the aggregate characteristic of the nonbank group engaged in a loan share transaction as either sellers or buyers.
In panel B of Table 12, we examine statistics on the trading activity for stable and unstable nonbanks in the aggregate, both during the crisis and immediately prior. The evidence shown is consistent with the idea that stable nonbanks provide liquidity during the crisis. Notably, during the crisis, unstable nonbanks sold a larger fraction of their loan holdings (9.86%), as compared with stable nonbanks (6.50%). Furthermore, the selling rate of stable banks decreased relative to the precrisis period, whereas the opposite is true for the unstable nonbank group. When we look at buying activity in the crisis, a similar pattern emerges: stable nonbanks had a higher buying rate (13.18% of lagged holdings) compared with unstable nonbanks (9.20%). And, while both sets of nonbanks increased buying rates relative to the precrisis period, the effect was clearly more dramatic for the stable nonbanks (7.02 percentage points versus 1.27 percentage points for the unstable group).
Overall, the influence of nonbank ownership for loan trading activity and price declines is consistent with selling pressure being exerted on loans by nonbanks with fragile funding. On the buy side, these nonbanks do not increase loan share holdings, whereas nonbanks with stable funding and well-capitalized banks do. Taken together with our previous results, this finding suggests that capital constraints among regulated entities can contribute to greater volatility in asset prices during times of marketwide stress.
4. Conclusion and Policy Discussion
We provide new evidence on the role of bank capital constraints for the emergence of nonbank financial institutions. We analyze the U.S. syndicated loan market using a novel U.S. credit register that tracks loan retention in terms of both stocks and flows, control for variation in loan quality using a loan-year fixed effects approach, and exploit plausibly exogenous shocks to bank capital. Our central result is that a tightening of bank capital regulation increases nonbank presence. In particular, weakly capitalized banks reduce loan exposure—notably, via loan sales—and less-regulated nonbanks take up the slack. We also find evidence consistent with negative effects of this reallocation of credit; in particular, loans funded by nonbanks with more fragile liabilities are associated with lower credit availability and greater price volatility during the 2008 episode.
Our results can be interpreted more broadly in terms of the important policy debate on the consequences of bank capital regulation, including macroprudential regulation that aims to mitigate systemic risk (Freixas, Laeven, and Peydró 2015). Such regulation may improve the resilience of the commercial banking sector and credit markets. For example, nonbanks may have the flexibility to provide substitute credit when bank capital constraints bind, thus allowing borrowers to maintain access to credit.54 In line with this reasoning, there have been recent policy initiatives in Europe that aim to improve and even create secondary markets for banks to offload their riskier loans to other banks or nonbanks ECB (2017). In addition, nonbanks may be more diversified and less systemically important, and hence the shifting of risks toward the nonbank sector could improve overall financial stability.
However, the credit reallocation might be counterproductive if the risks are simply transferred to unregulated entities that also pose risks to the financial system. As the theoretical literature argues, if shadow banks have less stable funding—say, due to a lack of government guarantees—they may exacerbate credit cycles or secondary market price volatility during times of marketwide stress.55 Such negative effects to market prices may have adverse consequences for other market participants (Chernenko and Sunderam 2020; Brunnermeier and Pedersen 2008), thus potentially increasing the vulnerability of the financial system to shocks. Consequently, shifting loans to nonbanks could increase overall risk in ways that could be harder to supervise, especially if these financial intermediaries are outside of the regulatory perimeter.
Our paper highlights at least part of the connection from bank capital regulation to nonbank market penetration, and then from nonbank holdings to credit market stability during bad times. It does not, however, allow us to draw any welfare conclusions, since we do not comprehensively analyze the potential benefits of nonbank entry such as for risk-sharing or borrowing costs.56 To further dissect the benefits and costs of nonbanks in modern credit markets, and how these entities interact with monetary policy and other forms of financial regulation, remains a fruitful area for future research.
Authors have furnished an Internet Appendix, which is available on the Oxford University Press Web site next to the link to the final published paper online.
Acknowledgement
We thank Francesca Cornelli (the editor), three anonymous referees, Piergiorgio Alessandri, Sreedhar Bharath, Matteo Crosignani, Mara Faccio, Mark Flannery, Leonardo Gambacorta, Stephan Luck, David Martinez-Miera, Gregor Matvos, Greg Nini, Daniel Paravisini, Jan-Peter Siedlarek, Skander Van den Heuvel, Amit Seru, Zhenyu Wang, and Franco Zecchetto, and participants at Cornell University (Johnson), Federal Reserve Bank of Philadelphia, Federal Reserve Board, Lancaster University, Stockholm School of Economics, and SUNY Binghamton (SOM), the 2019 American Finance Association Annual Meeting, RFS conference on “The Financial Crisis Ten Years Afterwards,” RFS Conference on “New Frontiers in Banking Research,” Eighth BIS Research Network Meeting, 27th Finance Forum, Federal Reserve System Committee on Financial Institutions, Regulation, and Markets Conference, Banca d’Italia and Bocconi University Conference “Financial Stability and Regulation,” 2018 EuroFIT-UPF Conference on Financial Intermediation and Risk, ECB research workshop on “Monetary Policy, Macroprudential Policy and Financial Stability,” Annual International Journal of Central Banking Research Conference, Second Workshop on Corporate Debt Markets at Cass Business School, CEPR Third Annual Spring Symposium in Financial Economics, 13th NYU Stern-New York Fed Conference on Financial Intermediation, Third Young Scholars Finance Consortium, WFA-CFAR 15th Annual Conference, Wabash River Finance Conference, and 2018 University of Kentucky Finance Conference. This project has received funding from the European Research Council (ERC) under the European Union’s Horizon 2020 research and innovation programme (grant agreement No 648398). Peydró also acknowledges financial support from the ECO2015-68182-P (MINECO/FEDER, UE) grant and the Spanish Ministry of Economy and Competitiveness, through the Severo Ochoa Programme for Centres of Excellence in R&D (SEV-2015-0563). The views expressed here are those of the authors and do not necessarily reflect the views of the Board of Governors or staff of the Federal Reserve. The data used here are confidential and were processed solely within the Federal Reserve. Supplementary data can be found on The Review of Financial Studies web site.
Variable definitions
This appendix presents the definitions for the variables used throughout the paper.
| Variable | Definition | Source | ||
|---|---|---|---|---|
| Panel A: Loan characteristics | ||||
| Loan Sale | Indicator variable equal to one if bank reduces its stake in a loan syndicate that it participated in last year that continues to exist in the current year | SNC | ||
| Loan Share/Assets | Fraction of total loan commitment held by syndicate member | SNC, Y-9C | ||
| Loan Size | Dollar value of loan commitment | SNC | ||
| Lead Arranger | Indicator variable equal to one if lender identified as administrative agent | SNC | ||
| Nonbank | Indicator variable equal to one if lender is nonbank | SNC | ||
| Nonbank Share | Share of loan held by nonbanks | SNC | ||
| Unstable Nonbank Share | Share of loan held by broker-dealers, hedge funds, and other investment funds | SNC | ||
| Stable Nonbank Share | Share of loan commitment held by insurance and pension funds | SNC | ||
| Affiliated Nonbank Share | Share of loan held by nonbanks affiliated with any bank holding company | SNC | ||
| Credit Growth | Symmetric credit growth rate | LSTA | ||
| Exit | Indicator variable equal to one if loan exits sample | LSTA | ||
| Loan Price | Bid-ask quote midpoint | LSTA | ||
| Log(Remaining Maturity) | Natural logarithm of the number of years until loan matures | SNC | ||
| Syndicate Size | Number of lenders in loan syndicate | SNC | ||
| Non-Pass | Indicator variable equal to one if loan is nonperforming | SNC | ||
| Panel B: Bank characteristics | ||||
| Tier 1 Capital/RWA | Ratio of Tier 1 capital to risk-weighted assets | Y-9C | ||
| Tier 1 Gap | Difference between actual and predicted Tier 1 capital ratio, where | Y-9C | ||
| the predicted value comes from a regression of Tier 1 Capital/RWA on bank size, return on assets, Tier 1 leverage, and year fixed effects | ||||
| Total Capital/RWA | Ratio of Tier 1 and Tier 2 capital to risk-weighted assets | Y-9C | ||
| Tier 1 Leverage | Ratio of Tier 1 capital to total assets | Y-9C | ||
| Basel III Tier 1 Shortfall | Difference between current Tier 1 capital under Basel I and proposed Tier 1 capital requirement under Basel III (as of 2012:Q2) | Y-9C | ||
| Wholesale Funding | Sum of large time deposits, foreign deposits, repo sold, other borrowed money, subordinated debt, and federal funds purchased divided by total assets | Y-9C | ||
| Real Estate Loan Share | Real estate loans divided by total loans | Y-9C | ||
| Bank Size | Natural logarithm of total assets | Y-9C | ||
| C&I Loan Share | C&I loans divided by total loans | Y-9C | ||
| Non-Interest Income/Net Income | Non-interest income divided by net income | Y-9C | ||
| Loan Sale Propensity | Average fraction of loan shares sold per quarter (2009:Q4–2012:Q2) | SNC | ||
| Return-on-Assets | Net income divided by total assets | Y-9C | ||
| Loan Loss Provision | Loan loss provision this quarter over assets | Y-9C | ||
| Foreclosures | 1–4 family residential real estate loans in foreclosure over assets | Y-9C | ||
| Allowance for Loan Losses | Sum of past provisions minus sum of past recoveries over assets | Y-9C | ||
| Average(Loan PD) | Average loan-level probability of default | SNC | ||
| CDS Net Buyer | Indicator variable equal to one if the bank is a net buyer of CDS protection | Y-9C | ||
| Panel C: Borrower characteristics | ||||
| Log(Assets) | Natural logarithm of assets | Compustat | ||
| Sales Level | Sales divided by total assets | Compustat | ||
| Tangibility | PPE divided by total assets | Compustat | ||
| Leverage | Total debt divided by total assets | Compustat | ||
| Sales Growth | Sales growth rate | Compustat | ||
| Cash Flow | Operating income divided by total assets | Compustat | ||
| Liquid Assets | Cash divided by total assets | Compustat | ||
| Current Ratio | Current assets divided by current liabilities | Compustat | ||
| Dividend Payer | Indicator equal to one if firm paid out any divided | Compustat | ||
| Market-to-Book | Market value of equity divided by book value | Compustat | ||
| Covenant Violation | Indicator equal to one if firm reports covenant violation in any SEC filing | Sufi, SEC | ||
| Credit Rating Downgrade | Indicator equal to one if long-term credit rating decreases | Compustat | ||
Footnotes
1 We use the terms “shadow bank” and “nonbank” interchangeably when referring to financial institutions that provide credit without issuing insured liabilities. This is consistent with the Federal Reserve’s (or Financial Stability Board’s) definition of shadow banking as nonbank credit intermediation.
2 For example, “Risky borrowing is making a comeback, but banks are on the sideline,” New York Times, June 11, 2019, www.nytimes.com/2019/06/11/business/risky-borrowing-shadow-banking.html, and “Banks and the next recession,” Oliver Wyman, 2019, www.oliverwyman.com/our-expertise/insights/2019/may/banks-and-the-next-recession.html, describe “pro-cyclicality” in lending, whereas “The fire-sales problem and securities financing transactions,” a speech by Jeremy Stein at the Federal Reserve Bank of New York on October 4, 2013, www.federalreserve.gov/newsevents/speech/stein20131004a.htm, points to potential connections from shadow banks to secondary market prices.
3 At the same time, there have been policy initiatives in Europe to enhance and even create new secondary markets that would encourage banks to offload riskier loans (with higher capital requirements) to other intermediaries, including nonbanks (ECB 2017). See also “Development of secondary markets for non-performing loans,” European Commission, March 20, 2018, www.europarl.europa.eu/legislative-train.
4 See “Who’s carrying the can?” The Economist, August 14, 2003, www.economist.com/node/1989430.
5 However, our point estimates are very similar if we exclude bank fixed effects, which indicates that our main result is orthogonal to unobserved lender characteristics (Altonji, Elder, and Taber 2005; Oster 2019). Similarly, our loan-level estimates are identical if we do not control for loan-time fixed effects, and our results on nonbank entry are identical for the sample of all loans versus the sample on riskier loans, suggesting that our main results are also orthogonal to borrower characteristics.
6Goldstein, Jiang, and Ng (2017) document that corporate bond fund outflows are sensitive to poor performance, especially when the fund is invested in relatively illiquid assets and when aggregate uncertainty is high.
7 In Section 3.1, we show that the withdrawal of nonbanks from the primary market during the crisis—in conjunction with a limited capacity of lead banks to absorb loan shares—is a key mechanism that underpins the contraction in syndicated credit.
8 Our empirical evidence does not allow us to draw any welfare conclusions regarding shadow bank entry into the corporate loan market. While we find that shadow banks may increase price volatility and reduce credit availability in the event of a crisis, shadow banks might affect outcomes through other channels (that we do not analyze) and therefore may be positive for the corporate loan market and the real economy overall.
9 Prior research has documented the importance of bank capital requirements for credit supply and borrower performance in a variety of well-identified settings, including Aiyar et al. (2014), Aiyar et al. (2014, 2016), Bridges et al. (2014), De Jonghe, Dewachter, and Ongena (2020), Fraisse, Lé, and Thesmar (2020), Gropp et al. (2018), Jiménez et al. (2017), Mésonnier and Monks (2015), and Wold and Juelsrud (forthcoming). We instead document how shadow banks provide substitute credit when traditional banks reduce supply, and important real effects of this compositional shift in lending.
10 While we focus explicitly on the bank capital channel (e.g., Freixas and Rochet 2008; Admati et al. 2013), other research examines how alternative features of bank regulation may precipitate nonbank entry into loan markets. Neuhann and Saidi (2016) argue that deregulating the scope of traditional bank activities contributed to the growth of nonbank market share in the U.S. syndicated loan market. Kim, Plosser, and Santos (2018) find that supervisory guidance that tightens underwriting standards induces nonbank entry, and these nonbanks may have funded this U.S. syndicated lending by borrowing from traditional banks. Elliehausen and Hannon (2018) show that the Credit Card Accountability and Disclosure (CARD) Act—which restricted the risk management practices of credit card issuers—led individuals to substitute from bank credit cards to consumer finance company loans. Gete and Reher (2017) find that bank liquidity regulations introduced under Basel III stimulated nonbank entry in the Ginnie Mae segment of the U.S. residential mortgage market.
11Bord and Santos (2012) carefully compare average yearly dollar volume of U.S. issuances in the SNC and the Loan Pricing Corporation’s Dealscan data set from 1988 to 2010 to examine potential sample selection due to the SNC inclusion criteria (Dealscan includes credits over |${\$}$|100,000 and has no restriction on lenders). The authors conclude the difference between the sources is small once loan amendments are accounted for: they find the size criterion can explain only about 0.6 percentage points of the difference between the two data sets. Similarly, Ivashina and Scharfstein (2010) report that about 95% of Dealscan loans meet both SNC criteria. Hence, we believe sample selection is unlikely to bias our estimates.
12 Every loan in the SNC is assigned a rating by at least one of the federal agencies on an annual basis. A subset of loans is selected for further scrutiny by bank examiners, e.g., about 40% in terms of 2009 volume. For these loans, additional information such as collateral, covenants, and monitoring activities may be provided by the lead arranger. See Ivanov and Wang (2018) for a detailed description of the SNC ratings process.
13 Each loan is assigned a credit identifier that does not change after the loan is amended or refinanced. The SNC therefore has advantages over data sets of syndicated loans, such as Dealscan, that focus only on the primary market, have incomplete data on loan ownership, and do not track refinanced or amended loans.
14 All lenders assigned to the same holding company are treated as a single entity when we code loan sales. Notably, this includes any nonbanks that are identified by the SNC as directly bank-affiliated. In Section 2.3, we separately examine loan sales to these affiliated nonbank entities, since such risk transfers may be undercapitalized and therefore have important implications for financial stability (e.g., Acharya, Schnabl, and Suarez 2013).
15 Deposit-taking commercial banks have a comparative advantage at managing credit lines’ liquidity risk (Kashyap, Rajan, and Stein 2002), possibly due to government guarantees (Pennacchi 2006). Thus, banks retain most credit lines in the primary market (Gatev and Strahan 2006), and there is little demand in the secondary market for credit lines among nonbanks (Bord and Santos 2012). We therefore only consider credit lines in some “placebo” tests throughout the paper.
16 The National Information Center identifies finance companies and insurance companies. We identify CLOs, hedge funds, private equity, and mutual funds via Standard & Poor’s Capital IQ and Moody’s Structured Finance Database. Remaining lenders are manually classified using keyword and internet searches. The categories “other domestic entity,” “other foreign entity” (DEO and FEO, respectively), and “other” are catchalls for nonbanks of domestic, foreign, and unknown origin that we could not systematically classify.
17 These figures can be found in the Internet Appendix (see Appendices IA.I and IA.II).
18 While plausible, simple univariate comparisons of observable borrower financial condition by (lead) bank capitalization indicate that this concern in not borne out by the data, at least for the subset of publicly traded firms (see Appendix IA.III). To arrive at this conclusion, we utilize a match from the SNC data to Compustat that was kindly provided by Seung Jung Lee (see Cohen et al. 2018). To mitigate mismeasurement concerns, we use only the strictest versions of their match (“Tier 1” plus “Tier 2”).
19 From a legal standpoint, the borrower has limited control over syndicate membership changes resulting from secondary market transactions due to at least two contractual norms (see Chapter 5 of Taylor and Sansone 2007). First, “consent rights” dictate that lenders are free to sell without the borrower’s permission and “will normally stipulate that lenders are free to assign their rights and obligations under the credit agreement without the consent of any other party” (367). Second, “eligible assignees” are the entities that may acquire loans under the credit agreement without the consent of the borrower, which “will normally include banks, financial institutions, and funds” (368).
20 Under the standardized approach of the 1988 Basel I Accord, corporate loans that are externally rated from BBB+ to BB– and below BB– have 100% and 150% risk-weights, respectively. Note that even performing syndicated loans tend to have low ratings: about 50% of syndicated loans are externally rated as junk, i.e., BB+ and below (Sufi 2007).
21 Our choice of 2002 as a cutoff year for our main tests is motivated by evidence that institutional investors entered after the 2001 recession, funding the expansion in the syndicated loan market between 2002 and 2007 (see, e.g., Ivashina and Sun 2011, or Standard and Poor’s, 2010).
22 We further confirm this result using the Oster (2019) bounding method. We estimate that the bounded set for |$\beta$| is [–0.198,–0.151], which excludes zero.
23 Some loan sales to nonbanks may be “prearranged” and take place soon after origination. See, e.g., Ivashina and Sun (2011) for a description of the syndication process. Note that our measurement of loan sales encompasses these potentially prearranged sales and, to the extent that such sales correlate with bank capital, this could affect the interpretation of our results. In Appendix IA.IV we therefore show that our results are robust to excluding first-year sales that could include prearranged transactions.
24Appendix IA.V finds similar effects of the lagged ratio of Tier 1 capital to average total assets ratio (“Tier 1 leverage”) for loan sales, although the statistical significance is weaker.
25Minton, Stulz, and Williamson (2009) and Stulz (2010) find scant evidence that banks use CDS to hedge loans and argue that—while liquid for large corporations—the CDS market is illiquid for the smaller companies that receive a lot of bank loans. Hasan and Wu (2017) find that banks are more likely to sell CDS as a credit enhancement in conjunction with syndicated loan sales.
26 The bulk of loan shares are held by large banks (about 90%), in line with prior evidence that the U.S. syndicated loan primary market is dominated by the large, money center banks (e.g., Ross 2010).
27 In Section 3.2, we provide evidence that some loan shares are purchased by well-capitalized banks.
28 In Appendix IA.X, we estimate the relation between nonbank entry and bank capital across loan types. We find that loans funded by undercapitalized banks tend to feature more nonbanks, but only among longer maturity (greater than three years) term loans. We find no evidence that undercapitalized banks distribute credit lines to nonbanks. These results are consistent with the loan traffic analysis—which mostly show average effects, independent of bank capital—described in Section 1.2. We also show that our results are robust to additionally controlling for (log) loan size and loan purpose (see Appendix IA.XI).
We extend our analysis to examine loan sales to affiliated nonbanks and test whether bank regulatory capital constraints are an important determinant of transfers to these entities. We classify affiliated nonbanks are those nonbank entities identified as belonging to the same bank holding company (BHC) as the lender holding the loan share, wherever this is identified by the SNC. We modify our analysis of (unaffiliated) nonbank entry in Table 5 by substituting Affiliated Nonbank Share as the dependent variable in that regression. The new results shown in Appendix IA.XII provide very weak evidence that loans funded by undercapitalized banks are likely to be transferred to affiliated nonbanks. This nonresult shows up across our various measures of bank regulatory capital. In particular, the statistical evidence is marginal, and the point estimates are about two orders of magnitude lower than the baseline effects. This result serves as a useful “placebo” test, as loans transferred to affiliated entities may still be subject to regulatory scrutiny.
29 The BCBS announced its endorsement of Basel III on September 12, 2010 (www.bis.org/press/p100912.htm), and the contents of the reform were made public in December 2010 (www.bis.org/publ/bcbs189_dec2010.pdf).
30 The Board of Governors of the Federal Reserve System made this announcement on June 7, 2012 (www.federalreserve.gov/newsevents/pressreleases/bcreg20120607a.htm).
31 Under the proposal, among other costly adjustments, the value of mortgage servicing rights could count for only up to 10% of a bank’s common equity, as compared with 50% before. See “Basel requirements could shift mortgage servicing rights,” HousingWire.com, October 18, 2012 (http://www.housingwire.com/articles/basel-requirements-could-shift-mortgage-servicing-rights and http://www.fdic.gov/regulations/laws/federal/2012-ad-95-96-97/2012-ad-95-96-97_c_334.pdf).
32 Thanks to Jose Berrospide for kindly making this variable available (see Berrospide and Edge 2016).
33 In terms of economic magnitudes, our estimates indicate that a one percentage point increase in the capital requirement leads to, on average, an increase in capital of about 0.15 percentage points one year out, an increase in the probability of a loan sale of 0.40 percentage points, and (as discussed next) a 9.5 percentage point increase in the syndicate-level nonbank share along the intensive margin. By way of comparison, Berrospide and Edge (2016) estimate that a one percentage point increase in capital requirements under Basel III reduces bank-level C&I loan growth—which accounts for both sales and origination activity—by 1.4 percentage points at the level of the bank. Note that Berrospide and Edge’s bank-level effects are larger, since they account for both sales and origination activity.
34 In unreported tests, we confirm that each of the robustness checks shown in columns [3] to [6] hold for the mortgage servicing rights variable. For example, the coefficient on High MSR Exposure is virtually identical when we exclude loan fixed effects from the regression, consistent with its exogeneity.
35 The Expanded SNC provides loan-share-level probabilities of default, so we take the average across banks. This allows for more accurate measurement of quality, compared with the regulatory assessment.
36 We further validate these findings in Appendix IA.XIII. In particular, we confirm that the subset of Expanded Reporter banks behave in a very similar manner when we consider the full sample of loan sales. We examine the various aggregation methods described earlier (simple mean, value-weighted mean, median, average among dominant banks, and the lead arranger’s capital shortfall), and find consistent results. We find a consistent effect of regulatory capital for loan sales under a new variable, Basel III Total Capital Shortfall, calculated as the difference between a bank’s total capital under Basel I and under the U.S. version of Basel III. Finally, we implement a “placebo” rule change in 2012:Q1 and show that the capital shortfall does not predict a greater incidence of loan sales from 2012:Q1 to 2012:Q2.
37 The efficiency implications of greater price volatility in secondary markets are unclear. For example, Chretien and Lyonnet (2018) argue that greater price volatility does not necessarily imply inefficiency, whereas other research suggests forced asset sales can generate negative externalities (e.g., Geanakoplos 2009; Stein 2012; Chernenko and Sunderam 2020).
38 While we do not directly establish a decline in credit at the aggregate level during the 2007–2008 crisis, prior evidence supports this assumption (e.g., Cornett et al. 2011).
39 Our classification is imperfect, as we do not have data on the liability structure of these financial institutions. For example, some investment funds might have long lockup periods and therefore little redemption risk, whereas others might be open-ended. Likewise, we do not classify CLOs as either stable or unstable, since we do not know when their liabilities mature.
40 While plausible, this statement does not appear to hold in the data: nonbanks are equally likely to buy observably safe and risky loans during normal times when the Ted spread is not elevated (see Table 5). Moreover, we find similar buying behavior for stable and unstable nonbanks (see Appendix IA.XIV).
41 Furthermore, recall that borrower- and loan-level unobservable risk does not play a role in the relation between bank capital and loan sales (Table 4). It therefore seems unlikely that such factors should matter for loan buying.
These performance results square with Benmelech, Dlugosz, and Ivashina (2012), who find that, controlling for credit rating, nonbank identity does not predict ex post differences in syndicated loan performance, in terms of borrower ROA, credit downgrades, and CDS spreads during the recent recession.
42Chodorow-Reich (2014) estimates that a one-standard-deviation decrease in lead bank health (instrumented for using either the loan growth to other firms, the lead’s exposure to asset-backed securities, or the lead’s balance sheet condition) results in approximately a two percentage point decrease in the likelihood of signing a new loan.
43 Note that this effect is stronger (coefficient increases by more than 50% from –0.121 to –0.198) and more precisely estimated (statistically significant at the 5% level) among firms with a greater ex ante reliance on debt (above-median precrisis leverage).
44 We recognize that many of the firms in the SNC data are privately held and therefore excluded. Thus, we cannot exclude the possibility that private firms seek external finance elsewhere (e.g., via bond issuance), although this seems unlikely given the prior empirical evidence on private firm borrowing during the crisis (e.g., Campello et al. 2011; Campello, Graham, and Harvey 2010). Moreover, given that we find real effects among publicly traded firms, it seems plausible that such effects may exist among (arguably more financially constrained) private firms.
45Kim et al. (2018) provide evidence that nonbank lenders in the mortgage market rely on “warehouse lines of credit” to fund their lending activity. Likewise, nonbanks in the syndicated loan market often rely on similar lines of credit. Access to such lines of credit can be subject to margin calls and covenant violations, and present rollover risk to nonbanks.
46 Another potential complementary mechanism is that secondary market loan sales by nonbanks disrupt lending relationships between lead arrangers and borrowers. While this seems unlikely in the U.S. syndicated loan market—since nonbanks tend not to be lead arrangers and secondary market loan sales by nonbanks tend not to require lead arranger approval (see Section 2.1)—we cannot exclude this possibility.
47 We use a conservative, yet high-quality match that requires exact matching on borrower name and various loan characteristics (loan type, origination date, maturity, amount), as well as a complete characterization of the nonbanks in the syndicate. Note that, in terms of external validity, in the previous section we analyze the population of SNC loans (and for real effects on the subset of listed firms), which helps to minimize the concern that our results on credit market stability only apply for a selected subsample of loans.
48 We recognize that using quotes rather than transaction data is a limitation of this analysis. Since we use quotes, we must interpret our estimates as changes in the willingness-to-pay for the subset of traded loans. In addition, when loans have quotes from multiple dealers, we average quotes across dealers.
49 Since we examine relatively liquid loans, in terms of external validity it is therefore likely that we underestimate the price impact of nonbanks in the crisis.
50 To further alleviate selection concerns, Appendix IA.XIX examines the observable differences in loans from the SNC-LSTA matched sample as a function of nonbank share. We find that high nonbank share loans have about a six months longer maturity and feature about two fewer lenders (statistically significant), as compared with all loans. All other differences are insignificant. There are no observable differences between loans featuring high stable and high unstable nonbank share (panel A). While the precrisis loan price levels decrease with loan default risk (notably, the nonpass dummy), there is no relation between unstable or stable nonbank share and the loan price level conditional on observables (panel B).
51 Of the bank variables, the coefficients on C&I Loan Share (positive effect on prices) and Wholesale Funding (negative effect on prices) show statistically significant effects. Appendix IA.XX indicates that banks with unstable liabilities have similar negative effects for secondary market activity as nonbanks with fragile funding (see, e.g., Song and Thakor 2007).
52 To mitigate the concern that these loans were marked down but not sold, we compare the frequency of transactions during the crisis in the matched LSTA-SNC sample with that of the SNC population. More precisely, we examine loan shares that existed in 2007:Q4 and changes in ownership by 2008:Q4. We find that of the 116 in the LSTA-SNC matched sample, 72% had at least one share traded during the crisis (31% of the all associated loan shares were traded). This is slightly higher than the SNC population: of the loans present in 2006:Q4, 47% had at least one share traded during the crisis (19% of the associated shares were traded). This is perhaps unsurprising given that these LSTA loans have publicly posted prices, are larger in size, and are more widely held.
53 It is important to note that regression analyses based on buyer identity are infeasible, since we observe only the actual buyer and not a well-defined set of potential buyers; i.e., we do not have a clear counterfactual.
54 In Appendix IA.XXI, we examine whether nonbank participation has positive effects for credit availability during the benign period from 2003 until 2006. In our context, we find no evidence that nonbank share improves credit outcomes in terms of either annual credit growth rates or loan rollover rates.
55 Note that we do not have any detailed information on the funding structure (e.g., leverage or debt maturity) of the nonbanks in our sample during the time frame in question. Incorporating such data represents an important avenue for future research.
56 A related issue that warrants further investigation concerns the appropriate counterfactual for measuring the effects of shadow banking for financial stability. For example, is the right counterfactual scenario one in which all corporate loans are backstopped by banks that do not sell them during a crisis? Or, perhaps, one in which the same institutions are invested in another more or less systemically important asset class?
References
Standard and Poor’s.
