


Abstract
Understanding the choice behaviours of farmers around the treatment of their livestock is critical to counteracting the risks of antimicrobial resistance (AMR) emergence. Using varying disease scenarios, we measure the differences in livestock species’ treatment preferences and the effects of context variables (such as grazing patterns, herd size, travel time to agrovet shops, previous disease experience, previous vaccination experience, education level, and income) on the farmers’ treatment choices for infections across three production systems—agro-pastoral, pastoral, and rural smallholder—in northern Tanzania, where reliance on antimicrobial treatment to support the health and productivity of livestock is high. Applying a context-dependent stated choice experiment, we surveyed 1224 respondents. Mixed logit model results show that farmers have higher preferences for professional veterinary services when treating cattle, sheep, and goats, while they prefer to self-treat poultry. Antibiotics sourced from agrovet shops are the medicine of choice, independent of the health condition to treat, whether viral, bacterial, or parasitic. Nearness to agrovet shops, informal education, borrowing and home storage of medicines, and commercial poultry rearing increase the chances of self-treatment. Based on our findings, we propose interventions such as awareness and education campaigns aimed at addressing current practices that pose AMR risks, as well as vaccination and good livestock husbandry practices, capacity building, and provision of diagnostic tools.
1. Introduction
Minimising risks of antimicrobial resistance (AMR) through reducing antimicrobial use (AMU) in livestock (Gozdzielewska et al. 2020) is an important public health goal (Frumence et al. 2021). However, globally, the demand for antimicrobials in the livestock sector is high, with further increases (of up to 67 per cent) predicted by 2030 (Mangesho et al. 2021). This expected upsurge is driven by intensified livestock production systems in low- and middle-income countries (LMICs) to support the growing need for animal protein in an expanding human population (Kimera et al. 2020; Mangesho et al. 2021). In sub-Saharan Africa, demand for antimicrobials is also likely to increase in traditional systems due to the importance of livestock to national and local economies (Ducrot et al. 2021). Here, livestock contributes to the economic and mental well-being of subsistence farmers by providing access to animal protein, cash income, and trading opportunities (Nuvey et al. 2020). In addition, income from livestock enables farmers to meet basic needs such as food and medical care (Husøy et al. 2018).
In this context, infectious diseases of livestock, including those caused by antimicrobial-resistant pathogens, have major impacts (Bernabé et al. 2017; Tebug et al. 2021), threatening the livelihoods and wellbeing of farmers. In Tanzania, for example, bacterial resistance to frequently used antibiotics such as tetracyclines and ampicillin has been reported in different livestock species, including cattle and sheep and goats (Frumence et al. 2021). There are several possible reasons for this. First, animal health professionals are poorly supported in making treatment decisions (Mangesho et al. 2021) due to a lack of veterinary infrastructure and of tailored antimicrobial stewardship programmes. Second, livestock keepers are often forced to self-administer antimicrobials to their livestock without professional advice (Caudell et al. 2017; Caudell et al. 2020) on recommended treatment doses, correct routes of administration, and withdrawal periods (Frumence et al. 2021). Third, there is an assumption that discouraging the misuse and overuse of antimicrobials as understood in AMR interventions in high-income countries applies directly to LMIC settings (Caudell et al. 2022). However, this is inconsistent with empirical research findings (Caudell et al. 2022) and could exacerbate the already high burden of infectious diseases on populations disadvantaged by poverty and limited access to healthcare. Fourth, livestock rearing and veterinary care practices are associated with varying cultural beliefs, sociocultural, and economic factors. These should be considered in the design of antimicrobial stewardship programs (Caudell et al. 2022). Fifth, LMIC governments suffer financial constraints (Rosenkrantz et al. 2019), and prioritisation of resources is necessary while addressing the needs of communities. Finally, more attention has been paid to tackling AMR in humans, whilst very little has been done to counter AMR in livestock.
Due to the challenges we outline above, Tanzania, which is the focus of our study, adopted the agenda of the sixty-eighth World Health Assembly in May 2015 that encouraged member states to develop National Action Plans (NAPs) for AMR. Tanzania launched its own NAP (NAP-AMR 2017–22) in 2017 based on One Health principles and approaches to address the complexities of AMR in systems where human and livestock health and wellbeing are tightly linked. The situational analysis presented in the NAP highlights inadequate regulation of antimicrobials, control, and prevention of infectious diseases (NAP-AMR 2017–22). The Tanzania NAP-AMR outlines several research gaps and policy-related weaknesses. Those relevant to our study include limited information on patterns of and choices around AMU in livestock in agricultural communities, as well as shortcomings in (i) policies on AMU and regulation in livestock, (ii) livestock husbandry practices, (iii) national livestock vaccination programs, (iv) enforcement of regulations around antimicrobial consumption, and (v) awareness and knowledge of AMR amongst stakeholders, particularly in relation to the risks associated with AMU in livestock. To address these research and policy gaps, information is needed to develop tailored evidence upon which stewardship programs can be designed to counter AMR in Tanzania and similar systems. Currently, very little is known about the choice behaviours around antimicrobial treatment in livestock in communities across production systems in Tanzania and East Africa more generally. Our study was designed specifically to fill this gap in support of the Tanzanian NAP-AMR (2017–22). We sought to understand the practices and choices around the use of antimicrobials in the treatment of common infections in livestock, identify the sources of the antimicrobials and whether professional advice to acquire them is available to communities, and investigate the husbandry practices they use.
By generating this evidence, we aimed to acquire critical information to inform behavioural change interventions that consider contextual differences to enable farmers to preserve the health of their livestock through improved treatment practices while minimising AMR risks. A successful intervention needs to be informed by an understanding of farmers’ choice1 patterns, their preferences, and drivers of AMU, and how these vary across and within livestock production systems. However, choice data as well as data on AMR and AMU more broadly are typically lacking (WHO 2014).
Economists often obtain choice data and quantify individual preferences using discrete choice experiments (DCEs). In stated preference applications of DCEs, individuals face hypothetical choice situations containing two or more alternatives from which their preferences are estimated from their choice patterns. Such preference estimates are used to understand people's actual choice behaviour and priorities (Salampessy et al. 2015). In the area of animal health economics, single-context DCEs have been applied to understand and quantify farmers’ preferences for treating Newcastle disease in poultry and tuberculosis and contagious bovine pleuropneumonia (CBPP) vaccine attributes and uptake in cattle (Bennett and Balcombe 2012; Kairu-Wanyoike et al. 2014; Isenge et al. 2020). Such preferences have been used to draw insights aimed at developing more acceptable vaccines that meet farmers’ demand for a specific disease context. However, outcomes from DCEs based on a single context are hard to generalise to other contexts (Molin and Timmermans 2010; Salampessy et al. 2015; Guo et al. 2021). This is because in a single-context DCE, it is assumed that individuals make rational choices that are independent of external circumstances other than those that the analyst can control for (Molin and Timmermans 2010).
By contrast, a ‘contextual’ DCE attempts to account for the variation of contexts within which individuals make decisions (Molin and Timmermans 2010). The decision-making idea behind this thinking is that when a particular decision problem is presented to an individual, they make an assessment and judgement based on their knowledge and expectations about the problem at hand, alongside personal specific attributes (Beresford and Sloper 2008). Many studies have focused on understanding the variation of choices based on individual differences across various health-related contexts (e.g. Salloum et al. 2019; Richardson et al. 2020; Oluoch-Aridi et al. 2020). A growing body of literature demonstrates that choice patterns and preferences are indeed contextual (Guo et al. 2021). For instance, context-dependent choice patterns and preferences have been well researched and quantified in neuroscience (Louie et al. 2012; Spitmaan et al. 2019) and in transport (Molin and Timmermans 2010; Guo et al. 2021). However, contextual variables are under-researched in the animal health literature and more specifically in understanding farmers’ choice patterns and quantifying their AMU preferences in livestock. Contextual settings imply changes in attributes that form the choice set, in the choice scenarios, and in the socio-cultural situations that constitute the environment within which choices are made. When considered, these aid the validation of the outcomes of the DCE (Molin and Timmermans 2010).
Therefore, a context-dependent choice experiment is most suited to study AMU choice behaviour because the problem of AMR is not attributable to farmers’ responses to risks connected to a single disease or animal species. Different diseases, affecting different livestock species, are likely to trigger varying responses. In the context-dependent choice experiment that we report in this study, we, therefore, focus on a range of disease syndromes2 across different livestock species and production systems and individual-specific characteristics to obtain farmers’ choice patterns to quantify AMU preferences in livestock health.
We sampled households from three livestock production systems (smallholder, agro-pastoral, and pastoral) in three districts (Mwanga, Misungwi, and Ngorongoro, respectively) of northern Tanzania. We targeted households owning cattle, poultry, and sheep and goats and presented them with three different treatment options for infectious diseases widespread in these settings: CBPP, foot-and-mouth disease (FMD), peste des petits ruminants (PPR), Newcastle disease, and coccidiosis. The attributes included source of treatment advice, medicine source, medicine type, action after treatment and cost of medicine. The rationale behind our design was that farmers choose treatment options from a set of available actions depending on (i) the clinical signs they observe, (ii) the type of livestock species (here, whether cattle, sheep and goats, or poultry) in which the clinical signs are observed, and (iii) the type of production system under which a farmer operates.
Our study contributes to the small but growing economic literature on AMR linked to livestock diseases. Whilst the specific empirical findings relate solely to the production systems studied in Tanzania, we believe that our approach is suited to a broad range of circumstances where society wishes to intervene in livestock disease management as one means of reducing AMR.
2. Determinants of AMU
In LMIC settings, antimicrobials are not restricted to prescription-only use as is the case in developed countries; instead, they are readily available to farmers (Caudell et al. 2022). As a result, farmers often self-administer them directly to their livestock without consulting a professional animal health specialist (Rosenkrantz et al. 2019; Caudell et al. 2022) and without observing the recommended administration practices (Frumence et al. 2021). Such practices can lead to the development of AMR, particularly in contexts where high infectious disease burdens create high demand for antimicrobials (Rosenkrantz et al. 2019). AMU behaviours may vary depending on livestock husbandry practices. For instance, pastoralism, whereby livestock owners migrate in search of pasture and water for their animals, increases risks of livestock's exposure to pathogens, hence the need for antimicrobials (Caudell et al. 2017). The consequences of AMR include failure of treatments, prolonged and costly treatment, and mortality of animals (Murray et al. 2019). Given the importance of livestock for livelihoods, AMR also threatens food security. It also threatens human health as a result of exposure to resistant bacteria through the environment or consumption of animal products (Caudell et al. 2020). The use of antimicrobials is projected to increase (Caudell et al. 2017) within a weak regulatory framework (Frumence et al. 2021), whilst a limited understanding of AMU persists. For more effective interventions to counter the externalities of AMR in animal health, it is important to establish how sociocultural and economic factors influence the antimicrobial treatment choices of farmers across a range of livestock systems and disease contexts.
Before tackling these specific questions, let us turn to the limited DCE literature on livestock diseases in LMIC settings. Kairu-Wanyoike et al. (2014) quantified farmers’ willingness to pay (WTP) for CBPP vaccination in Kenya and the factors that influence it. The authors found that herd composition, duration since previous CBPP experience, income, and education level influence WTP. Further, Isenge et al. (2020) measured WTP and demand for Newcastle disease vaccine in poultry in DR Congo. The study determined that higher perception of risk and trust in veterinary support increase WTP. Frick et al. (2003) also assessed the WTP for the use of azithromycin to treat trachoma in Tanzania. In this study, female-headed households, marital status, and lower income levels led to lower WTP. Higher WTP was more likely to result from a perceived potential benefit. However, these studies used single-context DCEs. This approach is not suited to contexts where a diversified range of livestock species co-exist and does not consider the internal and external contexts of decision-making. In addition, the studies reviewed above did not examine AMU in livestock.
Understanding the drivers of AMU in resource-poor settings is complex. From an economic perspective, factors that influence AMU can be classified into macro- and micro-level factors. Macro determinants are associated with higher-level (government) factors. These include a lack of up-to-date guidelines on antimicrobial prescription and of information on the negative consequences of their use, unregulated access to antimicrobials, inadequate supply of diagnostic tools, poor availability of quality antimicrobials, and insufficient mechanisms to generate AMR surveillance data (Bernabé et al. 2017; Kimera et al. 2020). Micro determinants relate to the choice behaviour of individuals in terms of factors that are (i) individual-specific, (ii) livestock-specific, (iii) production system-specific, (iv) disease-specific, and (v) treatment-specific.
Individual-specific characteristics are those that relate to the respondents themselves, such as education level, age, and income. Gender has also been reported to play a major role, for example, in influencing the preferences for vaccines against Rift Valley fever and lumpy skin disease among farmers in South Africa (Masemola et al. 2021). Livestock-specific attributes include factors such as the age of the animal considered at risk (Torsson et al. 2017). The third group of factors is production-system-specific. For instance, herd size, livestock rearing practices, and grazing patterns influence antibiotic use (Caudell et al. 2017). Animal health-seeking behaviours also vary. For example, farmers under smallholder production systems have more access to professional advice from animal health workers before using antimicrobials, whilst pastoralists tend to consult traditional healers and agrovet attendants (Caudell et al. 2020). The fourth category includes disease-related characteristics. Three main factors have been found to be relevant in different contexts, namely previous disease experience (Ahmed et al. 2017), perceived risk of infection (Masemola et al. 2021), and previous vaccination experiences. Finally, the characteristics of the treatment sought include factors such as veterinary costs (Fels-Klerx et al. 2011) and perceived side effects (Ancillotti et al. 2020).
3. Case study area: infectious diseases in northern Tanzania
Tanzania is a middle-income country with over 68 per cent of its total population residing in rural areas, and 22 per cent of them deriving their income from livestock and livestock activities (Torsson et al. 2017). It has the third largest population of livestock in Africa after Ethiopia and Sudan, with 17 million cattle and 21 million sheep and goats (Kivaria 2003; Torsson et al. 2017).
Livestock production in northern Tanzania can be broadly classified into three main production systems: smallholder, agro-pastoral, and pastoral (de Glanville et al. 2020). According to de Glanville et al. (2020), these classifications suggest smallholder systems are characterised by mixed farming of small livestock herds and crop growing for subsistence and commercial purposes (de Glanville et al. 2020). Agropastoral systems involve medium to large herd sizes with crop production for own consumption and sale (de Glanville et al. 2020). Finally, the pastoral system is associated with large herd sizes and consistent migration of livestock in search for water and pasture (de Glanville et al. 2020). Using the classifications proposed by de Glanville et al. (2020), we categorise the three livestock production systems investigated in our study as smallholder (Mwanga), agro-pastoral (Misungwi), and pastoral (Ngorongoro).
In this study, we focus on five infectious diseases of major importance in Tanzania: CBPP, FMD, and PPR in ruminants, and coccidiosis and Newcastle disease in poultry. CBPP is a highly infectious bacterial disease of cattle that causes high mortality and economic losses due to a decline in productivity (Kairu-Wanyoike et al. 2014). In Tanzania, CBPP impacts exceed an estimated |${\$}$|11 million per annum due to mortality, vaccination, disease surveillance, antibiotic costs, and reduced meat and milk production (Msami et al. 2001; Swai et al. 2013; Kairu-Wanyoike et al. 2014). FMD is a viral disease that affects cloven-hooved ruminants (cattle, sheep, and goats) and non-ruminants (pigs) (Casey-Bryars et al. 2018; Kerfua et al. 2018). In Tanzania, direct and indirect losses affect households (Casey-Bryars et al. 2018; Ahmed et al. 2019). Further impacts arise from restrictions on livestock movement within and across borders and from the export of livestock products (Kivaria 2003). PPR is a viral disease that affects sheep and goats and has a fatality rate of up to 100 per cent (Torsson et al. 2017). In Tanzania, the economic costs of PPR are around |${\$}$|67.9 million per annum (Torsson et al. 2017). Coccidiosis is a protozoan disease affecting poultry, sheep, and goats (Swai et al. 2013). Finally, Newcastle is a viral disease endemic in poultry (Campbell et al. 2019), whose likelihood of transmission is enhanced by the free-ranging nature of poultry production in Africa (Yongolo et al. 2011).
4. Context-dependent choice experiment
The choice experiment that we include in this study has three levels of design. The first level involves varying hypothetical disease scenarios based on the diseases described above and the livestock species affected. The second level consists of varying treatment options across livestock species, while the third level consists of varying choice sets across different livestock keepers.
4.1 Context-specific variables
The question of what individuals prefer in terms of AMU and what drives the decisions they make can be described by two main components: (i) the treatment and (ii) individual, livestock, production-system, and disease-specific characteristics. From the former, we draw the attributes on which farmers’ preferences are based. The drivers of such preferences are derived from the latter. However, disease-specific and treatment characteristics cannot be studied separately because people make choices of treatment options based on the disease in question. With this in mind, we draw unique contextual variables from livestock and production system characteristics and interact them with treatment attributes and disease contexts to explain behaviours around AMU for the treatment of livestock in northern Tanzania. We select our variables using a similar approach as that used by Molin and Timmermans (2010) and Guo et al. (2021) to identify contextual variables for the choice of different transport modes.
The first contextual variable is grazing type, which varies depending on whether livestock is kept under pastoral, smallholder, or agro-pastoral systems (see de Glanville et al. 2020). The second variable is herd size, which also varies based on the production system (see Caudell et al. 2017; de Glanville et al. 2020). The third variable is the length of time individual farmers require to travel from their homesteads to the agrovet/veterinary shops to purchase drugs. The fourth variable is whether a household keeps antimicrobials at home or not. The fifth and sixth variables are disease context-specific and include previous disease and vaccination experiences, respectively (for summaries of these variables, see supplementary materials—S2 for Tables 4–6).
To further explain how local settings shape individual decision-making, we consider two individual-specific characteristics—education level and household income—to act as proxies for health literacy and poverty levels, respectively. It is also worth noting that, especially in pastoral communities, household income is mainly derived from livestock, with cattle considered particularly valuable (Mugisha et al. 2007). For instance, when a cow succumbs to disease, small ruminants are sold to generate cash to buy antibiotics (see Caudell et al. 2017).
4.2 Experimental design
Before the main data collection, we conducted focus group discussions (FGDs) and in-depth interviews (IDIs) in the period between April and May 2019. We recruited farmers based on gender, age, and education level to create heterogenous groups of eight to ten community members per FGD. Participants were representative of the three livestock production systems described above: smallholder, pastoral, and agro-pastoral in Mwanga, Ngorongoro, and Misungwi districts, respectively. In total, we conducted six FGDS and two IDIs on animal health issues only and four FGDs on both human and animal health issues.
These FGDs sought to first understand local perceptions of good and bad health in animals and people. Then we gathered information on the actions community members take when their livestock show signs of ill-health. We also asked them to list common diseases/disease syndromes in their community, their causes, the names of medicines they use, the source of these medicines, the medicine’s costs, and whether they were recommended by an animal health worker or not.
The resulting information was used to define attributes, attribute levels, and choice scenarios. The attributes and attribute levels were developed for cattle, sheep and goats, and poultry separately (see Table 1). All the levels represent treatment options for clinical signs of diseases that commonly affect different livestock types based on information provided by community members who took part in the FGDs and IDIs. The disease syndromes that formed our hypothetical scenarios were therefore: CBPP and FMD in cattle, FMD and PPR in sheep and goats, and Newcastle disease and coccidiosis in poultry.
Attribute and attribute levels for treatment options in cattle, poultry, and sheep and goats.
| Attribute and attribute levels for treatment options for cattle | Attribute and attribute levels for treatment options for poultry | Attribute and attribute levels for treatment options for sheep and goats | ||
|---|---|---|---|---|
| Attribute | Levels | Levels | Attributes | Levels |
| Action taken | • Call friends, relatives, or neighbours | • Call friends, relatives, or neighbours | Action taken | • Call friends, relatives, or neighbours |
| • Treat by yourself | • Treat by yourself | • Treat by yourself | ||
| • Call livestock officer | • Call livestock officer | • Call livestock officer | ||
| Medicine type | • Medicine type A—painkillers | • Medicine type A—herbal medicine | Medicine type | • Medicine type A—painkillers |
| • Medicine type B—antiparasites | • Medicine type B—antibiotics | • Medicine type B—antiparasites | ||
| • Medicine type C—antibiotics | • Medicine type C—antibiotics | |||
| Medicine sources | • From vendors in open-air market | • From friends/relatives/neighbours | Action after medication | • Slaughter |
| • From friends/relatives/neighbours | • From open air market | • Sell | ||
| • From agrovet/veterinary drug shops | • From agrovets | • Isolate | ||
| Cost of treatment in TSh | • 5,000 (|${\$}$|2.17) | • 6,000 (|${\$}$|2.60) | Cost of treatment in TSh | • 9,000 (|${\$}$|3.90) |
| • 9,000 (|${\$}$|3.90) | • 9,000 (|${\$}$|3.90) | • 12,000 (|${\$}$|5.20) | ||
| • 12,000 (|${\$}$|5.20) | • 12,000 (|${\$}$|5.20) | • 15,000 (|${\$}$|6.50) | ||
| • 15,000 (|${\$}$|6.50) | • 15,000 (|${\$}$|6.50) | • 20,000 (|${\$}$|8.67) | ||
The first attribute we included is action taken, which represents the source of advice or lack thereof sought when a farmer observes clinical signs in cattle, sheep and goats, and poultry. The second attribute relates to the medicine type used to treat the disease syndromes hypothesised, and it varied depending on the livestock species considered. Medicine source attributes included three options, namely open-air market, agrovets/veterinary drug shops, or borrowed from friends/relatives/neighbours. In the sheep and goat design, the third attribute was adjusted to action taken after medicine administration, which comprised options such as selling, isolating, or slaughtering sick animals. The latter was based on information obtained from FGDs, i.e. livestock keepers slaughter or sell their livestock only when they are sick and/or when treatment fails. The fourth attribute is treatment cost in Tanzanian shillings (TSh).
4.3 D-efficient designs
Bayesian D-efficient designs for cattle, sheep and goats, and poultry attributes and attribute levels were generated separately in Ngene Software. In the formulation of utility functions, the attribute levels of medicine type and source were fixed to ensure the resulting choice sets were logical. Generating D-efficient designs requires prior parameter estimates, which we initially obtained based on expert judgment and preference rankings (see Bliemer and Collins 2016). To avoid efficiency losses as we move from the experimental design to data analysis, we used a mixed logit model to generate the designs because it allows the variation of random parameters across respondents and alternatives (Bliemer and Rose 2010). We designed 24 unlabelled choice tasks per livestock species with four alternatives: ‘Option 1’, ‘Option 2’, ‘Option 3’, and ‘None of these’ (status quo). Choosing the status quo meant farmers chose to do nothing with the hope that clinical signs would disappear or gave the sick animal leftover medicine/local herbs harvested from the wild. The cost of the status quo option was assumed to be zero.
The choice cards were incorporated into a draft questionnaire, which was piloted in selected villages in the Kilimanjaro Region in October and November 2019. Ninety respondents were involved in the pilot phase. The choice data obtained were analysed in the R environment for statistical computing using the Apollo Package (see Hess and Palma 2022), and the prior parameter estimates generated were used to update the Bayesian efficient designs used in the final data collection phase. The final version was accompanied by a set of 24 choice cards per livestock species. The resulting choice sets were organised and visualised using images to enhance comprehension among respondents (see Figs 1–3).
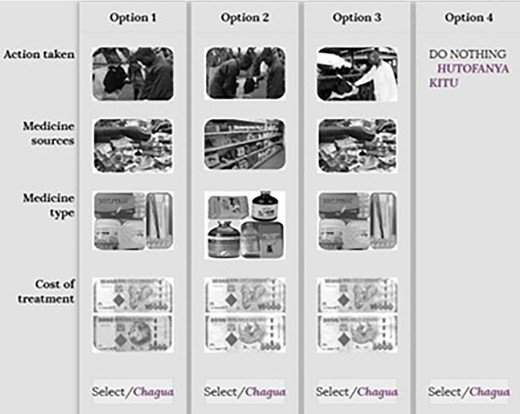
Example of a choice card for cattle scenarios. Source: Action taken (modified from shutterstock.com, 2019); medicine source (google images, 2019); medicine type (Field photos, 2019); cost of treatment (google images, 2019).
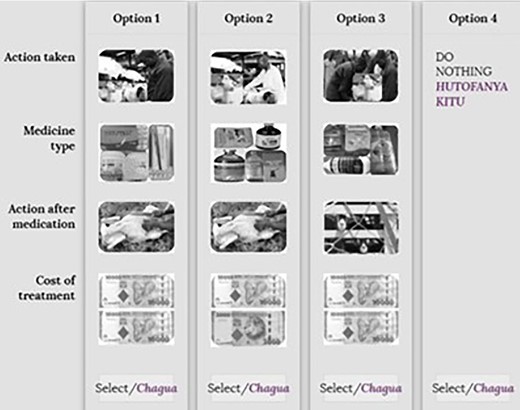
Example of a choice card for sheep and goat scenarios. Source: Action taken (modified from shutterstock.com, 2019 with field photos); medicine type (Field photos, 2019); action after medication (google images, 2019), cost of treatment (google images, 2019).
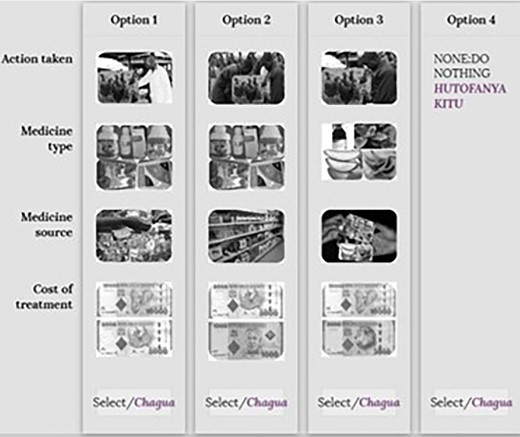
Example of a choice card for poultry scenarios. Source: Action taken (modified from shutterstock.com, 2019); medicine source (google images, 2019); medicine type (Field photos, 2019); cost of treatment (google images, 2019).
4.4 Survey design and administration
The web-based survey was designed using Light House Studio 9.6.1 and was administered during January–August 2021 by a team of six well-trained local research assistants using tablet computers. The survey was made up of two main sections: a human health part and an animal health part, but, in this paper, we concentrate on the section relevant to animal health. The first part of the survey collected data on individual and household-specific details such as gender, education level, and income, among others. The second section tackled information on livestock and production system: grazing patterns, livestock types in the household, and herd/flock size. The third section assessed knowledge and awareness around previous disease experiences and associated treatment in livestock in the past 6 months. Respondents were presented with livestock disease scenarios and asked whether the disease had affected any animals in the household, who diagnosed it, perceived sources/causes, the number of animals affected, the source of advice sought, the name of the medicine used, the source of medicine, the cost, and what the outcome was. The fourth section contained information on the choice experiment, which consisted of two disease scenarios and follow-up questions aimed at assessing the reasons for the choices individuals made. The fifth section covered cattle disease prevention measures, particularly on whether the animal was vaccinated against the diseases hypothesised and, if not, why.
4.5 Sampling strategy
Respondents were selected from a total of six villages, with two villages per district (Figure 4): Msangeni and Lomwe (Mwanga), Soit Sambu and Engaresero (Ngorongoro), and Mbarika and Kijima (Misungwi). A multi-stage random sampling design was applied from district to village, sub-village, and household level.
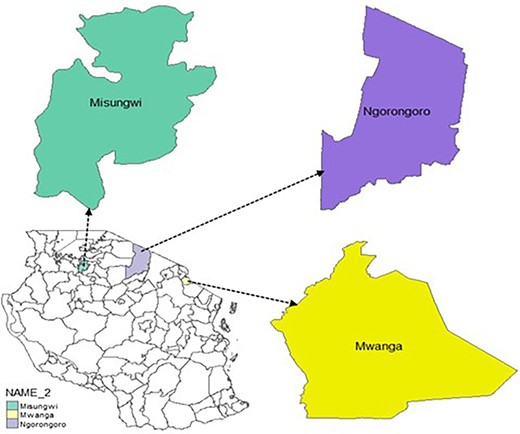
Map of the study area showing Mwanga, Ngorongoro, and Misungwi districts of northern Tanzania. Source: Author, (2022).
Respondents comprised household heads and their spouses to ensure gender parity on experiences around livestock health and AMU. In each household, we presented two separate scenarios of disease syndromes for a single livestock species at a time. For instance, in the first household, the household head and spouse were separately presented with four sets of choice cards, each at a time per scenario, to establish trade-offs between attributes of treatment options for CBPP and FMD in cattle. The same was done in the second household, but the disease scenarios and attributes of choice sets represented treatment options for Newcastle disease and coccidiosis in poultry. In the third household, the pair of respondents were treated the same way as in the cattle and poultry cases but made trade-offs for treatment attributes’ levels for PPR and FMD in sheep and goats.
4.6 Econometric analysis
We dealt with the effects of the no-choice option during analysis by introducing an alternative specific constant (ASC) into the utility function for the opt-out option to capture unobservable effects beyond the attributes present in the utility function (Meyerhoff and Liebe 2009; Campbell and Erdem 2018). More specifically, the choice alternative entered the utility function as a constant, |$\gamma {{\rm{\ }}}_{no\ choice\ i}$| where, |$\gamma {\rm{\ }}$|is the ASC, and |$no\ choic{e}_i$| represents 0 if an individual selects opt_out option (i.e owing to the hybrid coding scheme where status quo is coded as 0), and 1 otherwise.
4.7 Estimation of WTP for random parameters
5. Results
5.1 Characteristics of the sample
We collected data from 1224 respondents (equivalent to a total of 612 households). The data we collected were almost evenly distributed across questions on cattle (33 per cent), poultry (34 per cent) and sheep and goats (33 per cent). There were equal proportions of male (50 per cent) and female (50 per cent) respondents across the three livestock species scenarios, owing to the sampling procedure targeting both household heads and their spouses. In terms of age, respondents keeping cattle (65 per cent) and sheep and goats (73 per cent) were relatively younger, while more elderly respondents (72 per cent) kept poultry. Most of the respondents among the cattle (65 per cent), sheep and goats (73 per cent), and poultry (78 per cent) keepers had received some formal education. Concerning income,3 we classified respondents into two categories: low-income (TSh 1–300,000 equivalent to |${\$}$|0.00043–|${\$}$|129.98 per month) and high-income (TSh > 300,000, equivalent to >|${\$}$|129.98 per month) earners. More low-income earners kept cattle (72 per cent), and sheep and goats (50 per cent), while more high-income earners kept poultry (85 per cent). Most farmers keeping cattle (67 per cent), and sheep and goats (64 per cent) practised communal grazing. A substantial number of bird keepers (66 per cent) reared poultry for commercial reasons. Herd sizes were estimated and expressed using a common measure known as Tropical Livestock Units (TLUs)4 (Nthambi et al. 2021). TLUs per respondent were calculated by multiplying each of the livestock species with a conversion factor and then summed up per respondent.
We found that very few households had experienced the diseases of interest in the previous 6 months in all species of focus: cattle (FMD [13 per cent] and CBPP [17 per cent]), sheep and goats (FMD [2 per cent] and PPR [12 per cent]), and poultry (Newcastle [9 per cent] and coccidiosis disease [1 per cent]). Low rates of previous vaccination were also reported in all species: cattle (FMD [9 per cent], and CBPP [6 per cent]), sheep and goats (FMD [6 per cent] and PPR [8 per cent]), and poultry (Newcastle [21 per cent] and coccidiosis disease [7 per cent]). Few farmers kept medicines at home for livestock treatment of cattle (13 per cent), sheep and goats (15 per cent), and poultry (16 per cent). Table 2 summarises further the characteristics of the respondents sampled in the study area.
Summary characteristics of respondents sampled in the study area.
| Cattle | Sheep and goats | Poultry | ||||
|---|---|---|---|---|---|---|
| Covariate's description | Count | Per cent | Count | Per cent | Count | Per cent |
| Age | ||||||
| Young 20–50 years | 231 | 57 | 211 | 52 | 117 | 28 |
| Elderly/old >= 51 years | 173 | 43 | 194 | 48 | 298 | 72 |
| Gender | ||||||
| Male | 201 | 50 | 202 | 50 | 208 | 50 |
| Female | 203 | 50 | 203 | 50 | 207 | 50 |
| Income level* | ||||||
| Low (TSh 1–300,000 [|${\$}$|0.00043–|${\$}$|129.98]) | 289 | 72 | 297 | 50 | 56 | 15 |
| High (TSh > 300,000 [>|${\$}$|129.98]) | 115 | 28 | 297 | 50 | 312 | 85 |
| Education level | ||||||
| Formal training | 33 | 65 | 296 | 73 | 324 | 78 |
| No formal training | 18 | 35 | 109 | 27 | 91 | 22 |
| Vaccination cattle | ||||||
| Vaccinated against CBPP | 25 | 6 | ||||
| Not vaccinated against CBPP | 379 | 94 | ||||
| Vaccinated against FMD | 36 | 9 | ||||
| Not vaccinated against FMD | 368 | 91 | ||||
| Vaccination sheep and goats | ||||||
| Vaccinated against PPR | 34 | 8 | ||||
| Not vaccine against PPR | 371 | 92 | ||||
| Vaccine against FMD | 22 | 6 | ||||
| Not vaccinated against FMD | 371 | 94 | ||||
| Vaccination poultry | ||||||
| Vaccinated against Newcastle disease | 84 | 21 | ||||
| Not vaccinated against Newcastle disease | 316 | 79 | ||||
| Vaccinated against coccidiosis disease | 30 | 7 | ||||
| Not vaccinated against coccidiosis disease | 374 | 93 | ||||
| Experienced disease in cattle | ||||||
| FMD | 54 | 13 | ||||
| No FMD | 350 | 87 | ||||
| CBPP | 69 | 17 | ||||
| No CBPP | 335 | 83 | ||||
| Experienced disease in sheep and goats | ||||||
| FMD | 9 | 2 | ||||
| No FMD | 396 | 98 | ||||
| PPR | 50 | 12 | ||||
| No PPR | 355 | 88 | ||||
| Experienced disease in poultry | ||||||
| Newcastle disease | 37 | 9 | ||||
| No Newcastle | 378 | 91 | ||||
| Coccidiosis | 6 | 1 | ||||
| No coccidiosis | 409 | 99 | ||||
| Grazing type | ||||||
| Communal grazing | 271 | 67 | 258 | 64 | ||
| Other grazing types | 133 | 33 | 147 | 36 | ||
| Rearing type | ||||||
| Commercial purposes | 275 | 66 | ||||
| Other poultry rearing systems | 140 | 34 | ||||
| Medicines kept at home for livestock treatment | ||||||
| Yes | 52 | 13 | 61 | 15 | 15 | 16 |
| No | 352 | 87 | 344 | 85 | 85 | 84 |
| Proximity to agrovet in minutes (average time) | 58 | 41 | 52 | |||
| Average herd size in TLUs | 25 | 19 | 21 | |||
We interacted the above variables with treatment attributes to account for preference heterogeneity. Using the approach of Hess and Palma (2022), for the Appollo Package in R, we computed interactions of attributes and contextual variables prior to the definition of the actual utility functions by creating new parameters for each treatment attribute carrying the effect of the specific attribute's ASC and its interaction impact with contextual variables. The new parameter entered each utility function once instead of being repeated across all utilities, which could lead to unnecessary calculations (Hess and Palma 2022).
More specifically, if farmers chose to call a veterinary officer, their decision was determined by their education level, previous experience with vaccination against hypothesised diseases, and the grazing type. For self-treatment attributes, education, home storage of medicines, time to agrovet, and grazing type influenced farmers’ decisions. We used grazing patterns as a proxy for the livestock production system, where we assumed that communal grazing was common among pastoralists and agro-pastoralists, while zero-grazing was practiced by small-holder farmers. However, in poultry, in place of grazing pattern, we interacted action taken attribute levels with poultry rearing patterns.
The medicine type that farmers selected was determined by whether they had gained previous knowledge from treating the hypothesised disease in the household in the last 6 months. Medicine source depended on the size of the livestock herd where we hypothesised that farmers with smaller herd sizes were more likely to borrow medicines, while those with large herd sizes were likely to purchase antimicrobials from agrovet shops and open-air markets. Further, for biosecurity measures in sheep and goats, a farmer's decision to isolate or sell ill animals depended on their education level and the size of their herds. Finally, the amount an individual chose to pay for the treatment of a disease depended on the household's income and education level in cattle and poultry, and on income and herd size in sheep and goats. Therefore, we hypothesised that farmers with higher income, education levels, and larger herd sizes would pay more.
5.2 Choice modelling results
We fitted MNL models as a first check on the choice data before estimating a series of mixed logit models for cattle, sheep and goats, and poultry. Estimates from the MNL model show that preferences are the same across individuals, while those from the mixed logit models denote heterogeneity across individuals, hypothetical scenarios, and alternatives (Nthambi et al. 2021). For the cattle mixed logit model results (Table 3), farmers have a positive and significant marginal utility for a call to the veterinary officer and a negative and insignificant marginal utility for self-treatment. The coefficient estimate for antibiotic use is positive and significant, while that for antiparasites use is negative and significant—implying a higher preference for antibiotics over antiparasites. The preferred medicine source for cattle keepers would be an agrovet shop over borrowing from friends/relatives/neighbours or purchasing from open-air markets. We find significant differences in choice behaviour based on herd size, medicine storage at home for livestock, grazing type, proximity to an agrovet, previous FMD illness, and previous FMD and CPBB vaccination experiences. The coefficient estimate for herd size is negative and statistically significant when interacted with time to agrovet shops, suggesting a potential for borrowing medicines from friends/relatives/neighbours among farmers with smaller herd sizes. Further, preference variation is observed based on medicine storage at home and travel time to an agrovet. Farmers who make use of communal grazing would have a higher probability to consult a vet.
Marginal coefficient estimates for the treatment attributes of FMD and CBPP in cattle.
| Attributes and covariates | MNL coefficient (standard error) | Mixed logit model coefficient (standard error) | Mixed logit model SD (standard error) |
|---|---|---|---|
| Action taken | |||
| Call a livestock health officer | 0.580*** (0.044) | 0.726*** (0.136) | 2.732*** (0.134) |
| Treat cattle by yourself | 0.046 (0.043) | 0.124 −0.169 | 2.499 (0.124) |
| Call friends/relatives/neighboursa | −0.626 | −0.85 | |
| Medicine type | |||
| Antibiotics | 0.299*** (0.034) | 0.642*** (0.064) | 1.284*** (0.064) |
| Antiparasites | −0.279** (0.036) | −0.551*** (0.061) | 1.231* (0.061) |
| Pain killersb | −0.02 | −0.091 | |
| Medicine source | |||
| Agrovet shop | 0.456*** (0.037) | 0.982*** (0.080) | 1.601*** (0.080) |
| Friends/relatives/neighbours | −0.006 (0.035) | −0.071 (0.080) | 1.605 (0.080) |
| From vendors in open-air marketc | −0.45 | −0.911 | |
| Cost of treatment | −0.055*** (0.010) | −1.068*** (0.131) | 2.629*** (0.131) |
| No choice | −6.231*** (0.581) | −6.516*** (0.601) | |
| Interaction effects | |||
| Education level * vet *self*cost | 0.019* (0.010) | 0.014 (0.029) | |
| Herd size*agrov*frnds | −0.0005* (0.0002) | −0.001** (0.001) | |
| Medicine kept home for livestock*self | 0.016 (0.069) | −0.481** (0.195) | |
| Grazing type*vet*self | −0.206*** (0.032) | 0.321* (0.164) | |
| Time to agrovet * self | 0.0004 (0.0003) | 0.002*** (0.001) | |
| Previous FMD * antib | −0.184*** (0.072) | −0.335*** (0.132) | |
| Previous CBPP * antip | 0.041 (0.040) | 0.120 (0.083) | |
| Previous FMD vaccination * vet | −0.325 *** (0.084) | −1.066*** (0.321) | |
| Previous CBPP vaccination * vet | −0.477*** (0.106) | −1.482*** (0.442) | |
| Income level * cost | 0.009 (0.013) | 0.017 (0.023) | |
| Log-likelihood | −3,353.126 | −3,204.873 | |
| Akaike information criterion (AIC) | 6,744.25 | 6,461.75 | |
| Bayesian information criteria (BIC) | 6,859.79 | 6,619.85 | |
| Number of individuals | 404 | 404 | |
vet—call to a livestock health officer, self—treat cattle by yourself, antib—antibiotics, antip—antiparasites, agrov—from agrovet shop, frnds—from friends/relatives/neighbours, cost—the cost of the treatment.
*a,b,cThese base levels of the effects-coded attributes are not set to zero in the hybrid coding scheme; rather, we estimate them as the negative sum of the coefficient estimates of the other two levels (Cooper et al. 2012; Nthambi et al. 2021).
*P < 0.1, **P < 0.05, ***P < 0.01.
There is also heterogeneity in choice behaviour regarding the specific medicine type chosen to treat cattle. The ‘previous FMD illness experience’ estimate is negative and significant when interacted with antibiotics as a medicine type, meaning that farmers who have previously treated cattle with FMD are less likely to use antibiotics when they observe similar signs in cattle in the future. We find hesitation to consult a veterinary officer for cattle vaccinated against FMD and CBPP in the previous 6 months.
Findings from the sheep and goat mixed logit model (Table 4) show that the marginal utility coefficient for a call to a veterinary officer is positive and significant, while that of self-treatment is negative and insignificant, meaning farmers prefer to consult a vet over self-treatment. Further, farmers prefer to use antibiotics to treat their sheep and goats instead of antiparasites. The preferred biosecurity measure is isolation, which has a positive and significant coefficient estimate over selling or slaughtering ill sheep and goats. Preference heterogeneity in choice behaviour among sheep and goat's farmers is observed based on education level, home storage of livestock medicine, time to agrovet shop, previous FMD vaccination, and PPR illness experiences.
Marginal coefficient estimates for the treatment attributes of FMD and PPR in sheep and goats.
| Attributes and covariates | MNL coefficient (standard error) | Mixed logit model coefficient (standard error) | Mixed logit model SD (standard error) |
|---|---|---|---|
| Action taken | |||
| Call a livestock health officer | 0.487*** (0.045) | 0.616*** (0.180) | 3.621*** (0.180) |
| Treat sheep and goats by yourself | −0.015** (0.064) | −0.376** (0.172) | 3.461** (0.172) |
| Call friends/relatives/neighboursa | −0.502 | −0.24 | |
| Medicine type | |||
| Antibiotics | −0.066** (0.032) | 0.280*** (0.074) | 1.484*** (0.074) |
| Antiparasites | 0.050 (0.034) | −0.036 (0.073) | 1.469 (0.073) |
| Pain killersb | −0.116 | −0.244 | |
| Action after treatment | |||
| Isolate ill sheep/goats | 0.970*** (0.051) | 3.193*** (0.162) | 3.261*** (0.162) |
| Sell ill sheep/goats | −0.247*** (0.041) | −0.089 (0.114) | 2.291 (0.114) |
| Slaughter sheep/goatsc | −0.723 | −3.104 | |
| Cost of treatment | −0.059*** (0.007) | −0.923*** (0.129) | 2.587*** (0.129) |
| No choice | −6.651*** (0.588) | −8.014*** (0.881) | |
| Interaction effects | |||
| Education level*vet*self*isol*sell | 0.031 (0.021) | −0.252*** (0.080) | |
| Herd size * sell * isol * cost | −0.0002** (0.00007) | −0.0002 (0.0002) | |
| Medicine kept home for livestock * self | 0.414*** (0.076) | 0.839*** (0.216) | |
| Grazing system * vet * self | −0.406*** (0.037) | −0.227 (0.148) | |
| Time to agrovet * self | 0.0009*** (0.0003) | 0.002* (0.001) | |
| Previous FMD vaccination * vet | 0.375*** (0.116) | 0.765* (0.001) | |
| Previous PPR vaccination * vet | −0.216** (0.091) | 0.365 (0.340) | |
| Previous FMD * antib | −0.008 (0.163) | 0.225 (0.421) | |
| Previous PPR * antip * antib | 0.078* (0.044) | 0.161* (0.090) | |
| Income level * cost | −0.00008 (0.0001) | 0.0005 (0.0004) | |
| Log-likelihood | −3,039.512 | −2,920.812 | |
| Akaike information criterion (AIC) | 6,117.02 | 5,893.62 | |
| Bayesian Information Criteria (BIC) | 6,232.61 | 6,051.79 | |
| Number of individuals | 405 | 405 | |
self—treat sheep and goats by yourself, isol—isolate ill sheep/goats, sell—sell ill sheep/goats.
*a, b, cThese base levels of the effects-coded attributes are not set to zero in the hybrid coding scheme; rather, we estimate them as the negative sum of the coefficient estimates of the other two levels (Cooper et al. 2012; Nthambi et al. 2021).
*P < 0.1, **P < 0.05, ***P < 0.01.
Marginal coefficient estimates for the treatment attributes of Newcastle disease and coccidiosis in poultry.
| Attributes and covariates | MNL coefficient (standard error) | Mixed logit model coefficient (standard error) | Mixed logit model SD (standard error) |
|---|---|---|---|
| Action taken | |||
| Call a livestock health officer | 0.372*** (0.059) | 0.274* (0.152) | 3.090* (0.152) |
| Treat poultry by yourself | 0.321*** (0.040) | 0.476*** (0.081) | 1.662*** (0.081) |
| Call friends/relatives/neighboursa | −0.693 | −0.75 | |
| Medicine type | |||
| Antibiotics | −0.095 (0.101) | 2.316*** (0.141) | 2.873*** (0.141) |
| Herbal medicine | 0.086 (0.077) | 2.687*** (0.113) | 2.306*** (0.113) |
| Medicine source | |||
| Agrovet shop | 0.412*** (0.057) | 0.393*** (0.075) | 0.531*** (0.075) |
| From friends/relatives/neighbours | −0.154*** (0.055) | 0.265*** (0.143) | 2.913* (0.143) |
| From vendors in open-air marketb | −0.258 | −0.658 | |
| Cost of treatment | −0.103*** (0.010) | −6.480*** (1.021) | 20.823*** (1.021) |
| No choice alternative | −4.188*** (0.178) | −3.157*** (0.312) | |
| Interaction effects | |||
| Education level * vet * self * cost | 0.049*** (0.010) | 0.035* (0.021) | |
| Herd size * agrov * frnds | 0.0001 (0.0004) | −0.0004 (0.003) | |
| Medicine kept home for livestock * self | 0.253*** (0.062) | 0.176 (0.123) | |
| Rearing system * vet * self | −0.158*** (0.034) | −0.208*** (0.080) | |
| Time to agrovet *self | 0.0001 (0.0003) | 0.0006 (0.0006) | |
| Previous coccidiosis *antib *herb | −0.005 (0.096) | 0.259 (0.276) | |
| Previous Newcastle disease vaccination *vet | 0.150* (0.082) | 0.153 (0.213) | |
| Previous coccidiosis vaccination * vet | −0.154 (0.121) | −0.154 (0.318) | |
| Income level * cost | 0.0006*** (0.0002) | 0.001** (0.0004) | |
| Log-likelihood | −3,527.742 | −3,199.802 | |
| Akaike information criterion (AIC) | 7,091.48 | 6,449.6 | |
| Bayesian information criteria (BIC) | 7,201.42 | 6,602.3 | |
| Number of individuals | 415 | 415 | |
herb—herbal medicine.
*a,b,cThese base levels of the effects-coded attributes are not set to zero in the hybrid coding scheme; rather, we estimate them as the negative sum of the coefficient estimates of the other two levels (Cooper et al. 2012; Nthambi et al. 2021).
*P < 0.1, *P < 0.05, ***P < 0.01.
Farmers who keep poultry have a positive and significant coefficient estimate for both self-treatment and calling a veterinary officer (see Table 6). However, a larger and more significant coefficient estimate for self-treatment shows a higher preference for self-medication in poultry over consulting a vet. Farmers also prefer to treat coccidiosis and Newcastle disease using both antibiotics and herbal medicine, but have a slightly higher preference for herbal medicine. A larger and positive marginal coefficient estimate indicates a higher preference for the use of agrovet shops over sourcing medicines from friends/relatives/neighbours, and open-air markets. In poultry, farmers’ preferences differ based on the type of rearing system, their education, and income levels. For example, farmers with a greater education level have a higher probability of seeking professional veterinary services, whilst we find changes in the price sensitivity of treatment options as income increases.
Mean willingness to pay for the treatment of FMD and CBPP in cattle, FMD and PPR in sheep and goats, and Newcastle and Coccidiosis diseases in poultry.
| Treatment attributes for cattle | Mean willingness to pay in TSh in cattle | Treatment attributes for poultry | Mean willingness to pay in TSh in poultry | Attribute attributes for sheep and goats | Mean willingness to pay in TSh in sheep and goats |
|---|---|---|---|---|---|
| (95% confidence interval) | (95% confidence interval) | (95% confidence interval) | |||
| Action taken | Action taken | Action taken | |||
| Call a livestock health officer | 680 | Call a livestock health officer | 42 | Call a livestock health officer | 668 |
| (310, 1,049) | (−104, 188) | (71, 1,264) | |||
| Treat by yourself | −158 | Treat by yourself | 74 | Treat by yourself | −408 |
| (−455, 139) | (34, 113) | (−864, 49) | |||
| Medicine type | Medicine type | Medicine type | |||
| Antibiotics | 602 | Antibiotics | 357 | Antibiotics | 303 |
| (388, 815) | (107, 606) | (15 592) | |||
| Antiparasites | −516 | Herbal medicine | 415 | Anti−parasites | −39 |
| (−711, −321) | (137, 692) | (−308, 231) | |||
| Medicine source | Medicine source | Action after treatment | |||
| From agrovet shop | 919 | From agrovet shop | 61 | Isolate ill animals | 3,459 |
| (575, 1,264) | (21, 100) | (2,154, 4,764) | |||
| From friends/relatives/neighbours | −66 | From friends/relatives/neighbours | 41 | Sell ill animals | −97 |
| (−233, 100) | (−89, 171) | (−391, 197) | |||
| Opt-out option | Opt-out option | Opt-out option | |||
| No choice | −6,102 | No choice | −487 | No choice | −8,682 |
| (−8,623, −3,581) | (−960, −14) | (−13,312, −4,052) | |||
The cost of treatment coefficients for cattle, sheep and goats, and poultry models are all negative and significant. The coefficient estimates for the ASCs for all our scenarios are negative and statistically significant, which means that farmers prefer alternative treatment options over those proposed in our choice cards. These other options may include the use of leftover medicines, medicines sourced directly from veterinary officers, the use of herbs, or husbandry practices such as the culling of sick animals to separate them from the healthy ones.
5.3 WTP for treatment of livestock diseases
In Table 6, we present WTP for the treatment attributes of FMD and CBPP in cattle, FMD and PPR in sheep and goats, and Newcastle and coccidiosis diseases in poultry. For the cattle WTP estimates, we describe all other attribute levels except for self-treatment and medicine source from farmers/friends/relatives, both of which are statistically insignificant in the preference model. Farmers’ WTP for access to a veterinary officer is TSh 680 (|${\$}$|0.29). On the other hand, the WTP for antibiotics is TSh 602 (|${\$}$|0.26), while that for antiparasites is estimated at TSh (−516) (|${\$}$| −0.22). Farmers’ WTP for an agrovet shop as a source of these medicines is estimated at TSh 919 (|${\$}$|0.40).
For the sheep and goats WTP to pay estimates, we describe all treatment attributes except for one attribute level medicine type—antiparasites—and the action taken after treatment level—sell ill sheep/goats, because their marginal coefficient estimates were insignificant. Farmers’ mean WTP estimate for a veterinary officer when clinical signs of FMD and PPR are observed is TSh 668 (|${\$}$|0.29). The mean WTP for antibiotics is TSh 303 (|${\$}$|0.13), while that for isolation of ill animals is TSh 3,459 (|${\$}$|1.50).
Finally, the mean WTP to consult a veterinary officer is estimated at TSh 42 (|${\$}$|0.018), while that of self-treatment in poultry is TSh 74 (|${\$}$|0.032). Regarding medicine type, the mean WTP for herbal medicine is TSh 415 (|${\$}$|0.18) and is slightly higher than that of antibiotics at TSh 357 (|${\$}$|0.15).
6. Discussion
Our study assessed farmers’ heterogeneity preferences for and contextual effects of different treatment options across livestock production systems—agro-pastoral, pastoral, and smallholder—, and livestock species—cattle, sheep and goats, and poultry—in northern Tanzania, using a context-dependent DCE that incorporates use of antimicrobials for a range of diseases. Overall, we show that choice behaviour for treatment advice, medicines, and their sources differ across individual farmers and livestock species. These results highlight the need to draw on our understanding of the diversified use and demand for antimicrobials in order to develop antimicrobial stewardship programs, since these will likely vary across livestock production systems and disease contexts.
More specifically, we show that farmers would prefer to seek professional veterinary services when they observe clinical signs consistent with FMD and CBPP, and FMD and PPR in cattle and sheep and goats, respectively. Caudell et al. (2017) also observed variations in the use of professional services, but these were mainly associated with the type of livestock production, with rural smallholders being more likely to consult a veterinary officer. High WTP among cattle keepers in our study implied a higher chance to consult veterinary officers to treat cattle, probably because of their high asset value (Caudell et al. 2017). However, poultry farmers prefer to self-treat their birds over consulting a veterinary professional when coccidiosis and Newcastle disease occur on their farms. Nonga et al. (2008) also report self-administration of antimicrobials in poultry in Morogoro, Tanzania.
Farmers prefer to use antibiotics when treating FMD and CBPP in cattle, FMD and PPR in sheep and goats, and coccidiosis and Newcastle disease in poultry. These results are consistent with other studies that have reported antibiotic use for diseases such as CBPP, FMD, PPR, and Newcastle disease (FAO 2007; Balamurugan et al. 2014; Rugumisa et al. 2016; Caudell et al. 2017). This is problematic because in most of these cases, antibiotic treatment does not have therapeutic benefit. For example, farmers in Africa use antibiotic treatment in cattle with CBPP because it reduces disease pressure and mortality rates, although it does not cure the disease (FAO 2007). FMD, PPR, and Newcastle disease are viral infections that cannot be treated with antibiotics. While there may be benefits arising from using antibiotics to prevent secondary infections in animals with FMD or PPR, there is no therapeutic advantage in terms of the diseases. However, there are potentially high repercussions in terms of the development of bacterial resistance (Ekakoro and Okafor 2019) and environmental contamination with antibiotic residues (FAO 2007). For example, antimicrobial residues have been detected in eggs produced for commercial purposes in Tanzania (Nonga et al. 2008). Overall, our findings highlight the need for improved antibiotic stewardship in communities.
However, such programs need to consider the differences in sociocultural and economic settings. Our findings show that AMU behaviour is context-dependent. After we accounted for both choice and context-dependent variables in our model, we identified preference heterogeneity of treatment attributes in cattle, sheep and goats, and poultry. Although farmers across all three livestock production systems and species obtain medicines from agrovet shops as in Mangesho et al. (2021), farmers with smaller herd sizes may borrow medicines from friends/relatives/neighbours. In cattle, the most important context variable is time to the agrovet shop, where shorter durations increase WTP for self-treatment. As such, living close to agrovet shops increases self-treatment likely owing to easy access to antimicrobials (Mangesho et al. 2021). In sheep and goats, informal education and previous FMD experience are likely to lead to a lower WTP to isolate infected animals and consult a vet, while previous PPR experience increases WTP for antiparasites and antibiotics. Therefore, farmers without formal education were more likely to self-treat and sell ill animals compared to those with a higher education levels. In communal grazing systems, farmers were more likely to consult a veterinary officer (see also Caudell et al. 2017), but self-treatment was associated with high WTP in poultry even under commercial poultry rearing systems where potential economic losses could occur (see also Nonga et al. 2008). Our findings on self-treatment conform to those of Davis et al. (2022), who argue that choosing to self-medicate is driven by multiple factors beyond failure to seek professional help, including inadequate health services and a lack of trust between farmers and health care providers (see also Davis et al. 2021).
7. Conclusions and policy recommendations
This paper uses stated preference choice modelling to estimate farmers’ preferences for livestock disease treatment in Tanzania, focussing on factors that need to be considered in the context of AMR. We find that decisions over whether to ‘self-treat’ or consult a professional advisor vary across livestock species, but that preferences for medicine type (i.e. antibiotics) and medicine source (i.e. agrovet shops) remain the same in cattle, sheep and goats, and poultry. Antibiotics are not the only medicines used in the treatment of livestock. For example, we found a high preference for the use of herbal medicine in poultry and lower preferences for antiparasites in cattle and sheep and goats. Although farmers are willing to pay for professional veterinary services, self-treatment choices may be associated with limited access to these services, especially in the most remote areas.
We acknowledge a potential bias in our findings based on the respondents’ prior knowledge that consulting a veterinarian is the correct course of action. Nonetheless, we assumed that respondents gave true answers based on how much value they place on different livestock species. Caudell et al. (2017) argue that farmers place a higher value on cattle and that small stock are more disposable. However, even assuming that respondents provided accurate answers, we still believe that antimicrobial use will overlap across livestock production systems as we observe farmers’ high preferences and WTP to consult a vet across production systems. Farmers’ understanding that the correct choice is seeking professional help may have led to an overestimation of WTP to consult a vet. In addition, if farmers decide to use more expensive drugs to treat cattle disease, they will have less budget available to make similar choices for poultry and sheep and goats. A belief that partly drives AMU in cattle is likely to also drive use in other livestock types.
Overall, our study provides evidence of practices around AMU across communities and livestock species and the underlying factors driving such practices. Our results enable us to provide a number of recommendations in support of the research and policy gaps outlined in the Tanzania NAP-AMR (2017–22). First, we provide evidence that is useful in informing antibiotic stewardship programs tailored to traditional livestock production systems in Tanzania, information that, according to NAP-AMR (2017–22), is lacking. Although our findings show that farmers obtain higher satisfaction from consulting a vet to treat their cattle and sheep and goats, there is still a significant proportion of farmers who favour self-treatment (especially in poultry). Recognizing the limited availability of veterinary infrastructure in these settings, stewardship programs directed to farmers would benefit from encouraging them to consult a professional animal health worker for diagnostic (even if based on a syndromic evaluation) and treatment advice, and to discourage self-treatment. Second, we show that antibiotics are commonly used to treat viral infections in all livestock species. Increasing awareness as to the conditions that require antibiotic treatment and those against which this is ineffective would be a valuable contribution to stewardship programs in these and similar communities. Information to improve practices around antibiotic use should not be restricted to consumers only, but should also be extended to medicine vendors. For example, we show that farmers have a high preference and WTP for sourcing antibiotics from agrovets, which in this area does not typically require consultation with a professional to obtain a prescription. This is particularly common among farmers who live close to drug shops. We also see farmers borrowing antibiotics from each other. Providing medicine vendors with tailored training and information to enable them to serve their communities in a way that enables access to essential treatment but does not perpetuate practices that could lead to AMR risks should be prioritised. Further, we show that low education levels among farmers are associated with a higher tendency to self-treat and poor husbandry practices. Therefore, awareness-raising programs should focus on the risks of antibiotic misuse and encourage farmers to focus on husbandry practices (e.g. isolation and discouraging sale and slaughter of ill livestock) that prevent infection and reduce the need to resort to antibiotic treatment. We also demonstrate low vaccination rates and lower preferences for antibiotics among households who have experienced vaccination against viral infections. These findings would be relevant in designing messages to improve uptake of vaccination as a disease prevention and infection control measure both locally and nationally.
In the long term, a capacity-building fund (through taxation or voluntary donations from livestock keepers) could be established to support the local veterinary workforce. However, durable changes can only occur if Tanzania and other LMICs experiencing the same challenges are supported financially and technically to establish better pharmaceutical, diagnostic, and disease surveillance capacity. Such infrastructural improvements are going to be key to creating an enabling environment for antimicrobial users and providers alike that improves practices and reduces AMR risks amongst antimicrobial users and providers alike.
Our methodological approach and the issues we highlight here can be generalised beyond our study area to other regions in Tanzania and East Africa and across LMICs more broadly. This study also provides a basis for future research. First, we demonstrate that choice behaviour around antimicrobials is context dependent and can vary significantly across livestock species and production systems. Second, we show that farmer treatment choices alone are not sufficient to explain farmers’ treatment preferences and that contextual variables are important to consider to prevent biased conclusions. However, farmers’ attitudes towards and knowledge of antibiotic resistance in livestock could play a major role in explaining whether the treatment choices and husbandry practices we observed were due to poor knowledge, which could be addressed through access to information, or food insecurity, which would require government-level intervention, or both. Third, as an extension to the current study, it would help to compare antimicrobial preferences between humans and livestock in order to identify whether such issues extend also to human treatment. Fourth, there is limited literature that demonstrates the spatial distribution of farmers’ preferences. More information in this area would help identify groups towards which education programs and health improvements should be directed in order to optimise the use of limited resources.
Acknowledgments
We acknowledge all the participants who took part in our survey. We also appreciate the contributions of our field team: Steven Kapolo, Nairisha Olanana, Mohammed Iddy, Matayo Melubo, Joseph Charles Kiwale, Neema Laizer, Sambeke Melubo Kiruswa, and Dominic Ole Lenga for their support in the survey preparation and data collection process, and Happyness Jeremiah Mshana for overall project coordination. We are grateful to the Ministry of Health, Community Development, Gender, Elders, and Children, and the Ministry of Livestock and Fisheries in Tanzania for permission and support in the study areas.
Author contributions
Author contributions to this paper are as follows: Mary Nthambi—conceptualisation, data curation, formal analysis, investigation, methodology, validation, visualisation, software, writing—original draft, writing—review & editing; Tiziana Lembo—conceptualisation, funding acquisition, project administration, supervision, writing—review & editing; Nicholas Hanley—conceptualisation, funding acquisition, methodology, supervision, writing—review & editing; Alicia Davis—conceptualisation, funding acquisition, project administration, writing—review & editing; Fortunata Nasuwa—investigation; Blandina Mmbaga—funding acquisition, project administration, writing—review & editing; and Louise Matthews—funding acquisition, data management, writing—review & editing. All authors have read and approved the final manuscript.
Funding
We acknowledge the financial support of the Antimicrobial Resistance Cross-Council Initiative through a grant from the Medical Research Council, a Council of UK Research and Innovation, and the National Institute for Health Research (MRC/AMR/MR/S004815/1).
Ethics approval and consent to participate
Our study was approved by the Kilimanjaro Christian Medical University College Ethics Review committee with certificate no. 2408 and the Catholic University Health and Allied Sciences committee with certificate no. CREC/318/2018; National Institute for Medical Research (NIMR), Tanzania, with Reference Number NIMR/HQ/R.8a/Vol. IX/3017; Tanzanian Commission for Science and Technology (Nthambi, permit no. 2020–336-NA-2019–205; Lembo, permit no. 2020–333-NA-2019–205; Davis, permit no. 2020–335-NA-2019–205; Matthews, permit no. 2019–482-NA-2019–205); and College of Medical Veterinary & Life Sciences ethics committee at the University of Glasgow (project application number 200180046). The necessary research permission in communities was sought and granted by local and district authorities. Informed consent forms and participant sheets were approved by the ethical committee. During the data collection process, verbal and written consent was obtained from all participants.
Conflicts of interest
The authors confirm that there are no any known personal relationships and or commercial interests that could influence the outcomes of this publication. We further confirm that there is no any financial support or data collection permissions that may directly or indirectly raise questions or concerns of bias around the findings or conclusions or implications or opinions stated in this work. All authors have approved the contents of this manuscript and are satisfied with the criteria used to establish the authorship list.
Data availability
The data used to produce the findings of this study are also attached to our article. Any further information will be made available by the corresponding author upon request.
Footnotes
A choice is the outcome of an evaluation process that consists of assessing and judging alternatives with perceived value to the individual making the choice (Beresford and Sloper 2008).
In the absence of diagnostic tests to confirm agents causing disease, treatment is only restricted to disease syndromes that individuals can recognise (Bernabé et al. 2017).
Our classification followed the World Bank's definition of a low-income earner as someone living with less than |${\$}$|1.90 (TSh 4,385.20) a day (World Bank 2022). Therefore, farmers in our study earning TSh 1–300,000 (|${\$}$|0.00043–|${\$}$|129.98) per month, which, on an average 30-day month, translates to |${\$}$|0.00001–|${\$}$|4.333 a day, were considered low-income earners, while those earning >|${\$}$|4.333 were classified as high-income earners.
Livestock numbers were converted into common TLUs as follows: cattle = 0.7, sheep = 0.1, goats = 0.1, chickens = 0.01 units (Nthambi et al. 2021).
Appendix—some general notes on our analysis
We attach six files containing source codes in R of the multinomial and mixed logit models for the three livestock species (i.e. poultry, sheep and goats, and cattle). We also attach three csv files containing hybrid coded choice data plus data on contextual variables for the three livestock species.
◼ All the models we used were adapted from the Appollo package choice modelling examples published at http://www.apollochoicemodelling.com/
◼ For the hybrid coding of our choice data, some of our contextual variables and ASCs we used information from:
✓ Hensher D. A., Rose J. M. and Greene W. H. (2015)Applied Choice Analysis, 2nd edn. Cambridge: CUP.
✓ Cooper B., Rose J. and Crase L. (2012) ‘Does anybody like water restrictions? Some observations in Australian urban communities’, Australian Journal Agricultural Resource Economics, 56/11: 61–81. https://doi.org/10.1111/j.1467-8489.2011.00573.x.
✓ Nthambi M., Markova-Nenova N. and Wätzold F. (2021) ‘Quantifying loss of benefits from poor governance of climate change adaptation projects: a discrete choice experiment with farmers in Kenya’, Ecological Economics, 179: 106831. https://doi.org/10.1016/j.ecolecon.2020.106831.
General notes on random draws
◻ Halton draws are not suitable for more than five random coefficients because of correlation problems (Bhat 2003).
◻ In most of our studies, we had more than five random coefficients, so we avoided Halton draws in favour of Modified Latin Hypercube Sampling (MLHS), which according to Hess et al. (2006) performs better over standard Halton sequences, scrambled, and shuffled versions.
◻ MLHS are more accurate as the prediction error is smaller and the simulation is also simple, providing a better fit for the simulation of mixed logit models (Hess et al. 2006).
◻ Also most of our data sets fit so well with MLHS over Sobol and Halton sequences.
◻ Further, MLHS draws produce smaller prediction errors and increased accuracy over smaller draws (Hess et al. 2006)—in our case, we used 500 MLHS random draws.
Read more on random draws in
◼ Bhat C. R. (2003) ‘Simulation estimation of mixed discrete choice models using randomized and scrambled Halton sequences’, Transportation Research Part B 37: 837–55.
◼ Hess S., Train K. and Polak J. W. (2006) ‘On the use of a modified latin hypercube sampling (MLHS) method in the estimation of a mixed logit model for vehicle choice’, Transportation Research Part B 40: 147–63.
General notes: Appollo package starting values
◻ In the estimation code, parameters and starting values are defined, even those that will later be fixed (Hess and Palma 2021).
◻ Starting values can be set at zero as well as more than zero, i.e. range between −3 and +3.
◻ If poor starting values are set, then it is likely that the model will generate, NaNs or even a local poor optima (Hess and Palma 2021).
◻ In most of the parameters we define, our starting values are set to 0, except for some of the ASCs, some of which are later fixed to the starting values.
◻ In the estimation of ASCs, what matters is the difference in utilities, only differences in ASC matters and not their absolute levels.
◻ For more details on starting values and the Apollo package in general see:
✓ Hess S. and Palma D. (2021) ‘Apollo: a flexible, powerful and customisable freeware package for choice model estimation and application’, Available: http://www.apollochoicemodelling.com/files/manual/Apollo.pdf.
