


Abstract
Viral infection outcomes vary widely between individuals, ranging from mild symptoms to severe organ failure and death, and it is clear that host genetic factors play a role in this variability. Type I interferon (IFN) is a critical anti-viral cytokine, and we have previously noted differences in type I IFN levels between world populations.
In this study, we investigate the interrelationship between regional European genetic ancestry, type I IFN levels and severe viral infection outcomes.
In cohorts of European ancestry lupus patients living in Europe, we noted higher IFN in the Northwestern populations as compared to Southeastern populations. In an independent cohort of European ancestry lupus patients from the USA with varying proportional regional European genetic admixture, we observed the same Northwest vs. Southeast European ancestry IFN gradient. We developed a model to predict type I IFN level based on regional European ancestry (Area under the curve (AUC) = 0.73, P = 6.1e-6). Examining large databases containing serious viral outcomes data, we found that lower predicted IFN in the corresponding European country was significantly correlated with increased viral infection fatality rate, including Coronavirus Disease 2019 (COVID-19), viral hepatitis and HIV [correlation coefficients: −0.79 (P = 4e-2), −0.94 (P = 6e-3) and −0.96 (P = 8e-2), respectively].
This association between predicted type I IFN level and viral outcome severity suggests a potential causal relationship, as greater intrinsic type I IFN is beneficial in host defense against viruses. Genetic testing could provide insight into individual and population level risk of fatality due to viruses prior to infection, across a wide range of viral pathogens.
Introduction
Despite advances in vaccines and therapeutics, viral infections continue to cause significant morbidity and mortality throughout the world.1 The severity of a viral infection varies significantly between individuals, ranging from mild symptoms to severe organ failure and death. This depends on a variety of factors, including host genetics, comorbidity, socio-economics and access to healthcare. Type I interferon (IFN) is one of the main components in human immune defense against viral infection. When an individual is exposed to a virus, the type I IFN is produced, augmenting anti-viral immunity.2 Importantly, the activation of the IFN pathway differs significantly across individuals,3 which can determine the strength of an individual’s immune response against viral infections.
Inappropriate and chronically high type I IFN levels are an important risk factor for the autoimmune disease systemic lupus erythematosus (SLE). Some genetic risk factors for SLE result in elevation of type I IFN levels.4–8 Recently, we observed an inverse correlation between carriage of some of these high interferon genetic variants and Coronavirus Disease 2019 (COVID-19) mortality rates in the healthy population.9 This result demonstrates the importance of common genetic variations in the IFN pathway in modulating the severity of viral infection in the general population.10
We have shown that type I IFN level varies significantly across self-reported European-, African- and Hispanic-American race categories in lupus patients.11,12 While this may be multifactorial, IFN levels were associated with the proportions of genetic ancestry from continental populations.12 There is also a strong precedent for genetic variations between sub-continental populations,13–18 and the frequencies of immune system polymorphisms change gradually along geographic gradients.19–22
In this study, we investigate the interrelationship between regional European genetic ancestry and admixture, type I IFN levels and risk of severe viral infection outcomes. We hypothesize that type I IFN varies between regional continental populations, and that this variation in type I IFN would correlate with the severity of infection. We develop a genetic model for IFN based on regional European ancestry. We used this model to predict type I IFN level in populations, which was strongly correlated with viral infection severity, such as fatality rates from COVID-19, viral hepatitis and HIV. This supports the idea that genetic factors that influence type I IFN level in populations could assist in the prediction of severe outcome following viral infection, in combination with non-genetic influences on infection severity.
Materials and methods
Subjects
Serum samples were obtained from 605 European ancestry SLE patients (348 European-American from the University of Chicago and Mayo Clinic, 204 from Karolinska Institute in Sweden and 53 from the University of Crete). European ancestry was self-reported in the patient groups from Europe, and in the European-American group, in addition to self-reported ancestry, estimation of ancestry based on genetic similarity to reference populations at ancestry-informative markers was also performed. All patients met the American College of Rheumatology classification criteria for SLE.23 Healthy population genotype data of European ancestries were obtained for 451 subjects from Harvard Medical School (ancestries were self-reported and determined by genetic assessment)15 and 501 subjects from the 1000 Genomes study consortium project with self-reported ancestries.24 The study was approved by the institutional review boards of the respective institutions.
Serum IFNα activity measurement
A sensitive and reproducible bioassay was used to detect serum type I IFN activity, where reporter cells (WISH cells) are used to measure the ability of sera to cause IFN-induced gene transcription.25 The reporter cells are cultured with patient sera for 6 h and then lysed, and three canonical IFN-induced transcripts (IFIT-1, MX-1 and PKR) are measured using rtPCR. Relative expression data from the three transcripts are then normalized using the mean and SD of healthy donor sera run in the same assay, and data are presented as an IFN activity score. A cutoff point for the IFN activity score of two SDs above the mean of healthy donors are used to group IFN activity score into high vs. low levels.
Genotyping
A validated set of European-American ancestry informative markers (AIMs) consisting of 275 single nucleotide polymorphisms (SNPs)15 was used to assess the relative proportions of Northwest vs. Southeast European ancestry in the subjects in this study. For the European-American cohort, subjects were genotyped on the Fluidigm Biomark system. The healthy control data was obtained from the Harvard cohort26 and the 1000 Genomes project.24
Statistical analysis
A principal component analysis (PCA) was performed on the 275 AIMs to infer each subject’s regional European ancestry and admixture. More than 90% of the variance in the data set was accounted for by the first 120 principal components.
A logistic regression model with optimized elastic net regularization trained with cross-validation is used to predict the ancestry admixture proportion (Northern vs. Southern) characteristic of each individual using the top 120 AIMs principal components, and used as a classifier to segregate N-S population with FIN and TSI as the outcome classes representing Northern and Southern ancestries, respectively. The IFN level prediction model is based on a regularized logistic regression model with backward elimination that reduced the initial 120 AIMs principal components to 19 that are significant, is used to predict the probability of each subject to have a high IFN level. T-tests were used to determine whether the difference in the mean probability of high IFN level between select two groups of the population were statistically significant, and correlation analyses were done using Pearson’s R.
Results
IFN level variation across regional European ancestry in SLE
We compared type I IFN levels across European ancestry SLE patients living in discrete regions of Europe and European-American SLE cohorts using a functional reporter assay (Supplementary Figure S1). The Swedish cohort had a higher mean type I IFN level compared to Crete (P = 1.5e-3), and European-American SLE were intermediate, with higher IFN levels than patients from Crete (P = 2.1e-2). The Swedish and Crete cohorts are from Northern and Southern European geographical areas, respectively, and European-American cohort represents a group of subjects with varying degrees of admixture between Northwestern and Southeastern European ancestry.
Regional European ancestry determination
We genotyped 275 AIM SNPs in the 348 European-American SLE patients that are informative for the relative proportions of Northwest vs. Southeast European ancestry.15 We then performed a PCA of the AIM SNP data from the SLE patients along with reference populations from the 1000 Genomes project from the Finnish (FIN) and Tuscans from Italy (TSI) populations.24 The first principal component (PC1) segregates the Northern (FIN) and Southern (TSI) European cohorts with P values of P < 0.00001 and explains 3.2% of variance (Supplementary Figure S2). A regularized logistic regression model was developed to predict the regional European ancestry (Northern vs. Southern) for each subject, with FIN vs. TSI as the outcome variable (Figure 1). The prediction model strongly separates the FIN and TSI cohorts, and demonstrates the varying degree of Northern vs. Southern European admixture present in the European-American subjects (Figure 1).
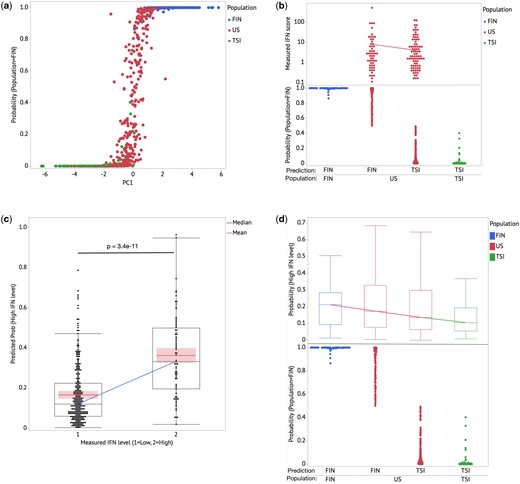
(a) Regularized logistic regression model provides stronger clustering for FIN & TSI cohorts and predicts US-European cohort population to have admixtures of FIN & TSI characteristics. PC1 explains 3.2% of the overall variance in the dataset. (b) Within the US-European cohort, subjects with FIN dominant predicted admixture show higher type I IFN activity average relative to the TSI dominant predicted admixture cohort. The diagonal line shows the mean of measured IFN scores for the US cohort. (c) Predicted probability for a subject to have high type I IFN activity (>2 SD) shows significant difference between high and low measured IFN cohorts. The diagonal line connects the medians of the predicted probability of high IFN for both the high and low IFN groups; the box shows distributions of values that extend from the 25th percentile to the 75th percentile. The lines in each group represent the means and with the associated 95% confidence interval shaded. (d) Combining the FIN–TSI ancestry admixture model and the IFN level prediction model based on the US-European cohort shows a gradient of the medians with the FIN cohort having the highest IFN level. The boxes show distributions of values that extend from the 25th percentile to the 75th percentile. The line connects the median in each population group.
Given the potential for geographic and other factors to confound the relationship between world populations and type I IFN levels, we next compared IFN levels with proportional Northern vs. Southern European genetic admixture in the European-American SLE cohort. This has the benefit of providing some degree of environmental control, as the chromosomes in admixed individuals share the same environment. We observed that subjects with greater proportional Northern European ancestry have a higher average IFN level (mean = 8.18) compared to subjects with more Southern ancestry (mean = 4.10, Figure 1c). This result aligns with the Northern-Southern IFN level gradient measured in the Sweden and Crete cohorts.
IFN level prediction model based on AIMs
Next, we developed a model to predict type I IFN level based on the 275 European ancestry AIM SNPs. A total of 112 principal components that accounted for >90% of variance were used in a backward regression model to predict IFN level (high vs. low, with a threshold of 2SD). The components were reduced to 19 PCs after backward elimination with the AIC validation method. The trained model can be used to predict IFN level with Area under the curve (AUC) = 0.73 and P = 6.1e-6. This linear combination of 19 PCs shows a strong significant difference in predicted IFN level for the measured high vs. low IFN European-American groups (P = 3.4e-11) (Figure 2). Applying this IFN prediction model to the 1000G data sets, we confirm that the model predicts higher IFN level with the Northern (FIN) cohort, followed by the European-American cohort (with the more FIN-like sub-ancestry group having a higher IFN level than the more TSI-like sub-ancestry group), and the Southern (TSI) cohort having the lowest predicted IFN level (Figure 2).
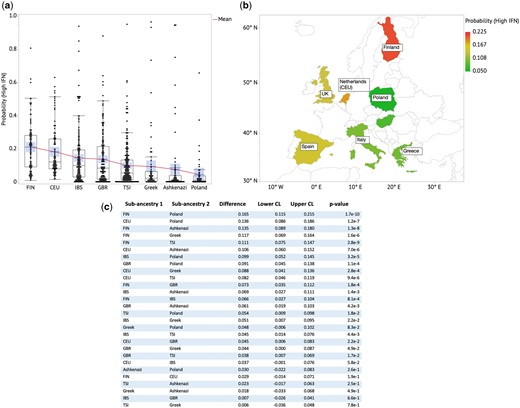
(a) Predicted probability of high IFN level across European sub-ancestral populations shows a gradient with FIN having the highest average high-IFN probability. (b) Predicted probability of high IFN level plotted on a geographical heat map shows angular counter-clockwise gradient with the highest (red), intermediate (yellow) and lowest (green) probability of high IFN level. (c) Table of ratios of Mean(Prob(High IFN)) and t-test P values for each country pair. The boxes show distributions of values that extend from the 25th percentile to the 75th percentile. The diagonal line connects the mean in each population group. The central tendency lines in each group represents the mean and with the associated 95% confidence interval is shaded.
Relationship between European sub-ancestries and IFN levels
We applied the IFN prediction model to other European populations from the 1000 Genomes Project, including Utah residents with Northern and Western European ancestry (CEU), Iberian populations in Spain (IBS), British from England and Scotland (GBR), Greek, Ashkenazi Jewish and Polish. The predicted probability of high IFN level for the individual subjects is shown in Figure 2c. Plotting this on a geographical map, we observe an anti-clockwise gradient of IFN level, with the highest IFN probability observed at FIN (Finnish population) and decreasing across CEU, IBS, GBR, TSI, Greek, Ashkenazi to Polish (Figure 2b). The CEU cohort is represented by Netherlands in the European map in Figure 2b based on a genetic assessment of this population.27
Relationship between predicted IFN level and viral infection outcome severity
Examining country-level viral outcomes data, we observed significant correlations between predicted type I IFN level based on our regional ancestry model and fatality rate related to viral infection (COVID-19, viral hepatitis, HIV). The results are shown in Figure 3. This is consistent with our previous work on COVID-19.9 Figure 3a shows the mean of probability of high IFN level against the fatality rate for COVID-19 cases for each of the seven European countries analyzed (Finland, Greece, Ireland, Italy, Netherlands, Poland, Spain), with the correlation coefficient (r ∼ −0.79) and P values (P = 0.036). The variations in the fatality rate and mean probability of high IFN level between two distant countries (Netherlands and Poland) are 6.3- and 4.5-fold, respectively, as shown in the figure, highlighting the significant potential difference in fatality between these countries that correlated with the predicted IFN level. It should be noted that other factors associated with mortality rate after viral infection cannot be controlled for in this study, such as GDP per capita, age and co-morbidities of the population, healthcare access and quality, and others. Supplementary Figure S3 shows the ratio of fatality rates in 2022 to those in 2021 on the y-axis. This is observed alongside higher population vaccination rates against COVID-19 in 2022 compared with 2021, resulting in increased effectiveness of herd immunity. Here, five countries that have >80% vaccination rates in 2022 are included (Greece, Spain, Italy, Finland and Ireland) and two countries are excluded: Poland (66%) and Netherlands (unknown vaccination rate in 2022) to minimize bias. On the x-axis is the mean probability of high IFN level for each country. Interestingly, we see a positive correlation (r = 0.995, P = 0.0004) between the ratio of the fatality rate in 2022–2021 and the mean probability of high IFN level, which could suggest that vaccination makes the biggest difference where the IFN level is lower on average. This is consistent with the hypothesis that higher IFN level provides stronger natural immunity, and thus the additional protection by the vaccines is not as large as in lower IFN populations.
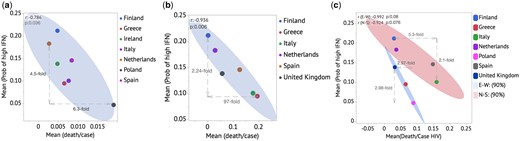
Anti-correlations between Mean(Prob (IFN High)) and fatality rate per country for COVID-19 (a), Viral hepatitis (b) and HIV (c).
Figure 3c shows data for viral hepatitis infections, with r = −0.936 and P = 0.006, for Finland, Greece, Ireland, Italy, Netherlands, Spain. Here, the difference in fatality rate between predicted IFN level at the population level is significantly higher, with a large 97-fold difference between the highest to lowest fatality rates associated with just a 2.2-fold increase in the mean probability of high IFN level. Figure 4d shows a similar plot as in Figure 4a, for HIV infections, where the countries can be modeled in two separate groups that correspond to strong line fits: Finland, Italy, Netherlands, Spain as Group 1, and Greece, Poland and the UK as Group 2. We postulate that there are confounding factors that lead to different sensitivity of fatality to IFN level between these two groups, but do not know what those may be. Each of the two groups show trends toward inverse correlation (r = −0.992, P = 0.08) and (r = −0.924, P = 0.076), respectively.
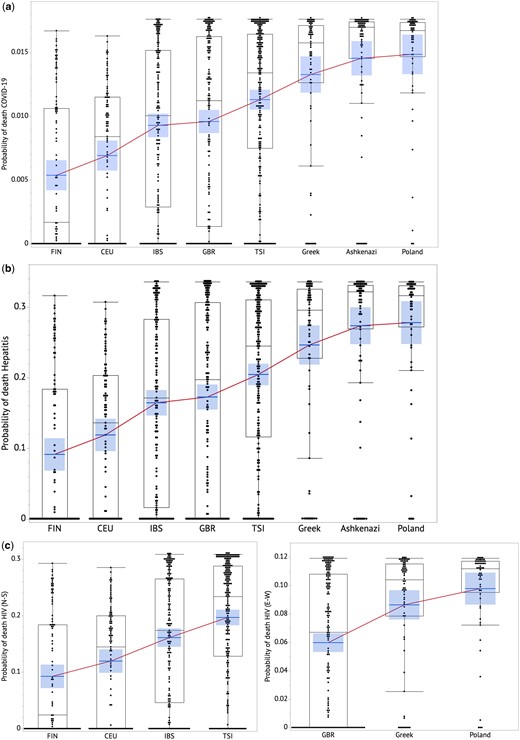
Predicted individual risk of death from viral infection across European sub-ancestral populations for COVID-19 (a), Hepatitis (b) HIV (c). The boxes show distributions of values that extend from the 25th percentile to the 75th percentile. A line connects mean in each population group. The central tendency lines in each group represents the mean and with the associated 95% confidence interval is shaded.
Predicted risk of death from viral infections
Using the model to predict viral infection fatality rate based on IFN level, here we predict the fatality rates of COVID-19, hepatitis and HIV infections for each of 952 subjects based on the genotype data in the 1000G study and Harvard cohorts. The fatality rate represents the probability of an individual to die if infected with the virus. Figure 4 shows the prediction results as box plots with a line connecting the mean value for each sub-ancestry (Supplementary Table S4 shows statistical comparisons). Supplementary Figure S4 shows the strong correlations between the averaged predicted fatality rate based on our model and the actual fatality rates for each country for COVID-19, hepatitis and HIV viral infections, respectively.
Discussion
In this study, we find that regional European ancestry is associated with differences in type I IFN levels in lupus patients. While environmental factors cannot be controlled between the Crete and Sweden cohorts, the American cohort with varying degrees of ancestry along the Northwestern vs. Southeastern European gradient provides some degree of control for environment, as the various chromosomal elements were present in combinations within the same individual. We extrapolate this finding to healthy European populations; we find a correlation between predicted type I IFN level and fatality rate due to a variety of viral infections. In these data we cannot control for environmental or socioeconomic factors which are not available in the population-level data sets, and these factors are also associated with fatality from viral infection. This finding suggests that genetic testing for regional ancestry could provide some information regarding an individual’s risk of severe viral infection outcome. This type of information could help in clinical decision-making regarding whether or when to administer anti-viral treatments, and to risk stratify patients in vaccination programs.
A number of caveats should be considered in this study. First, there are confounding factors such as age, demographics, environment, healthcare access and quality, comorbidity, and other factors that could be co-linear with the predicted IFN metric we derive in this study. Also, there can be multiple regional ancestral backgrounds within each country, which may introduce some bias to the data as the predicted IFN level is based on a single group to represent a particular country. We do not measure directly the IFN level and viral infection outcome severity clinical data at the individual level in this study. We believe that this initial study provides an opportunity for further studies of type I IFN along with other clinical and demographic variables that could be valuable in viral disease prevention protocols, therapeutics and public health considerations.
While this study was limited to regional European ancestry, it will be important in future work to extend this study design to other continental populations, such as African, Asian and Amerindian ancestral backgrounds. We expect that the predicted type I IFN level may be relevant to other infectious pathogens.
At the individual level, those who are at high risk of severe viral infection can take preventive actions such as stricter isolation, priority vaccination or boosters, earlier treatment with medications, or closer monitoring. At the community level, these data could help with policy implementation and outbreak control. For example, the US Centers for Disease Control has developed an evaluation tool called IRAT (Influenza Risk Assessment Tool) that uses 10 risk elements to measure the potential pandemic risk associated with different scenarios.28 One of the risk elements is population immunity, and our results could add a new dimension to population immunity level and risk that may help policy makers in planning for a potential pandemic. Our findings could also help in evaluating disease severity, which is important in the CDC Pandemic Severity Assessment Framework (PSAF).28 Individuals could become more aware of their risk of severe viral infection, informing their medical decision-making. Overall, our results support an impact of ancestral background on susceptibility to fatal outcome from viral infection, supporting prediction and management strategies.
Author contributions
Ilona Nln (Conceptualization [equal], Data curation [equal], Formal analysis [equal], Investigation [equal], Methodology [equal], Visualization [equal], Writing—original draft [equal], Writing—review & editing [equal]), Justine Shum (Formal analysis [equal], Investigation [equal], Visualization [equal], Writing—review & editing [equal]), Yogita Ghodke-Puranik (Formal analysis [equal], Investigation [equal], Visualization [equal], Writing—review & editing [equal]), Regine Tipon (Investigation [equal], Project administration [equal], Writing—review & editing [equal]), Danielle Treise (Data curation [equal], Project administration [equal], Resources [equal], Writing—review & editing [equal]), Shreyasee Amin (Data curation [equal], Project administration [equal], Resources [equal], Writing—review & editing [equal]), Ashima Makol (Data curation [equal], Project administration [equal], Resources [equal], Writing—review & editing [equal]), Thomas Osborn (Data curation [equal], Project administration [equal], Resources [equal], Writing—review & editing [equal]), Vaidehi Chowdhary (Data curation [equal], Project administration [equal], Resources [equal], Writing—review & editing [equal]), Uma Thanarajasingam (Data curation [equal], Project administration [equal], Resources [equal], Writing—review & editing [equal]), Theresa L. Wampler Muskardin (Data curation [equal], Investigation [equal], Project administration [equal], Writing—review & editing [equal]), Vilija Oke (Data curation [equal], Project administration [equal], Resources [equal], Writing—review & editing [equal]), Iva Gunnarsson (Data curation [equal], Project administration [equal], Resources [equal], Writing—review & editing [equal]), Agneta Zickert (Data curation [equal], Project administration [equal], Resources [equal], Writing—review & editing [equal]), Maria I. Zervou (Data curation [equal], Project administration [equal], Resources [equal], Writing—review & editing [equal]), Dimitrios T. Boumpas (Data curation [equal], Project administration [equal], Resources [equal], Writing—review & editing [equal]), Elisabet Svenungsson (Data curation [equal], Project administration [equal], Resources [equal], Writing—review & editing [equal]), George N. Goulielmos (Data curation [equal], Project administration [equal], Resources [equal], Writing—review & editing [equal]) and Timothy B. Niewold (Conceptualization [equal], Formal analysis [equal], Funding acquisition [equal], Investigation [equal], Methodology [equal], Project administration [equal], Resources [equal], Supervision [equal], Visualization [equal], Writing—original draft [equal], Writing—review & editing [equal])
Supplementary material
Supplementary material is available at QJMED online.
Funding
T.B.N. was supported by NIH (AI164968, DK107984, AI167271, AR078416, AR065964), the Lupus Research Foundation and the Lupus Research Alliance. T.L.W.M. was supported by NIH (AI166075) and the Arthritis National Research Foundation. E.S. was supported by Swedish Research Council (2018-02535, 2022-00783), Swedish Society of Medicine and the Ingegerd Johansson Donation (SLS-713911, SLS-936450) and Stockholm Region ALF Funding (20200075).
Conflict of interest
T.B.N. has received research grants from EMD Serono, Inc. and Zenas Biopharma, Inc., and has consulted for Thermo Fisher, Progentec, Roivant Sciences, AstraZeneca, S3 Connected Health, Flagship Pioneering and Inova. E.S. has received research grants from Merck. None of these entities played a role in the concept, design, conduct or funding of this study.
Ethical statement
All subjects provided informed consent, and the study was approved by the institutional review/ethics boards of the respective institutions.
References
Centers for Disease Control and Prevention—National Pandemic Strategy—Homepage. https://www.cdc.gov/flu/pandemic-resources/national-strategy/index.html (25 April 2023, date last accessed).
