


Summary
Hypoxia and hypercapnia due to acute pulmonary failure in patients with coronavirus disease 2019 (COVID-19) can increase the intracranial pressure (ICP). ICP correlated with the optic nerve sheath diameter (ONSD) on ultrasonography and is associated with a poor prognosis.
We investigated the capability of ONSD measured during admission to the intensive care unit (ICU) in patients with critical COVID-19 in predicting in-hospital mortality.
A total of 91 patients enrolled in the study were divided into two groups: survivor (n = 48) and nonsurvivor (n = 43) groups. ONSD was measured by ultrasonography within the first 3 h of ICU admission.
The median ONSD was higher in the nonsurvivor group than in the survivor group (5.95 mm vs. 4.15 mm, P < 0.001). The multivariate Cox proportional hazard regression analysis between ONSD and in-hospital mortality (contains 26 covariates) was significant (adjusted hazard ratio, 4.12; 95% confidence interval, 1.46–11.55; P = 0.007). The ONSD cutoff for predicting mortality during ICU admission was 5 mm (area under the curve, 0.985; sensitivity, 98%; and specificity, 90%). The median survival of patients with ONSD >5 mm (43%; n = 39) was lower than those with ONSD ≤5 mm (57%; n = 52) (11.5 days vs. 13.2 days; log-rank test P = 0.001).
ONSD ultrasonography during ICU admission may be an important, cheap and easy-to-apply method that can be used to predict mortality in the early period in patients with critical COVID-19.
Introduction
The coronavirus disease 2019 (COVID-19) was identified as an infectious disease caused by severe acute respiratory syndrome coronavirus 2 (SARS-CoV-2). It is highly infectious and associated with high mortality, with intensive care unit (ICU) mortality ranging from 40% to 70%.1–6
COVID-19 can cause acute lung injury (ALI) such as pneumonia and, in the most severe cases, acute respiratory distress syndrome (ARDS). In ALI, arterial blood gas analysis shows hypoxemia, which is often initially accompanied by acute respiratory alkalosis. The development of acute hypercapnic respiratory acidosis is an ominous sign and may represent severe ARDS with impending respiratory arrest.
As an extension of the central nervous system, the optic nerve is surrounded by subarachnoid membrane and cerebrospinal fluid (CSF). An enlargement of the optic nerve sheath has been described in patients with increased intracranial pressure (ICP). Moreover, several studies have even reported that ICP monitoring was associated with an increased mortality rate.7,8
Many underlying pathologies are associated with ICP and may be due to inappropriate CSF circulation, intracranial mass lesions or more diffuse intracranial pathological processes. Acute hypoxia and hypercapnia increase ICP, primarily through cerebral vasodilation and increases in CSF in the central nervous system.9,10
An increased optic nerve sheath diameter (ONSD) may reflect an early increase in ICP. Bedside ultrasonographic measurement of the ONSD offers a favorable alternative and is presently a new technique.11,12
To the best of our knowledge, no studies have specifically investigated ONSD measurement in predicting mortality in patients with critical COVID-19 admitted to the ICU. In this study, we aimed to investigate the role of bedside ONSD ultrasonographic measurement in predicting COVID-19-related-in-hospital mortality during ICU admission of patients with critical COVID-19.
Materials and methods
Study design and setting
This 6-month, single-center prospective observational cohort study was conducted from 1 July to 31 December 2021. Recruited patients were admitted to the COVID-19 ICU of Şırnak State Hospital (a designated pandemic hospital in Turkey).
The study protocol was approved by the ethics committee of Dicle University, Faculty of Medicine, Diyarbakır, Turkey (No. 2021/60). Written informed consent was obtained from patients (when possible) or from their authorized representatives.
All patients with COVID-19 enrolled in this study were diagnosed according to World Health Organization (WHO) guidelines, and the standard operating procedure for identifying patients who should be admitted to the ICU had been designed in accordance with WHO guidelines for the management of patients with COVID-19.13 SARS-CoV-2 positivity was based on the results of the real-time reverse-transcriptase polymerase chain reaction test using nasopharyngeal and oropharyngeal swabs.
Participants
Patients aged ≥18 years were included in the study. Patients who had no ONSD measurement within the first 3 h of ICU admission, had previous cerebrovascular disease and history of ocular pathology such as exophthalmia, glaucoma or cataract, and did not provide informed consent were excluded. In total, 91 patients who met the selection criterion were recruited. According to this standard, the patients were divided into two groups: survivor group (n = 48) and nonsurvivor group (n = 43). Supplementary Appendix S1 presents the flow diagram of the study.
Study site
The COVID-19 ICU of Şırnak State Hospital consists of four separate sections. It has a capacity of 50 beds, serving in the third-level area. It operates on an approximately 1:2 nurse-to-patient ratio with critical care consultants and hospital staff in attendance.
ONSD measurement
ONSD was measured at the bedside by the same experienced intensive care specialist/clinician/doctor responsible for the COVID-19 ICU (Hamza Gültekin, with advanced optic nerve measurement certificate). The ONSD was measured within the first 3 h of ICU admission. Because emergency vital interventions (such as endotracheal intubation, mechanical ventilation and central venous catheter insertion) were performed in the first hours of ICU admission, ONSD measurements were performed after the patient’s condition had stabilized. Measurements were made with a high-resolution 6–10 MHz linear-array ultrasonic probe of the ultrasound device (Model no. DC-7T, Mindray Corporation, China) in the B-mode setting. The head of the bed was placed 30° above the horizontal line, and the ONSD was measured at the retrobulbar 3 mm position, with accuracy set to 0.1 mm (Supplementary Appendix S2). Both eyes were measured three times, and the values were averaged as the final ONSD.
Laboratory and data analysis
Study data were recorded by the same intensive care specialist/clinician/doctor responsible for the COVID-19 ICU (Hamza Gültekin).
Blood samples were taken within the first hour of ICU admission. Glucose, urea, creatinine, sodium, potassium, aspartate aminotransferase (AST), alanine aminotransferase (ALT), albumin, C-reactive protein (CRP), D-dimer, arterial blood gas and arterial partial pressure of oxygen (PaO2)/fraction of inspired oxygen (FiO2) [PaO2:FiO2] ratio were recorded. The reference values of the laboratory parameters of our hospital are shown in Supplementary Appendix S3.
Age, sex, body mass index (BMI), mode of respiratory support (invasive mechanical ventilation [IMV] or noninvasive mechanical ventilation [NIV]) and presence of comorbid diseases such as cardiovascular diseases, diabetes mellitus, hypertension and chronic lung disease were recorded.
The Glasgow coma scale (GCS) score, Acute Physiology and Chronic Health Evaluation (APACHE) II score and Sequential Organ Failure Assessment (SOFA) score were calculated in the first hour of ICU admission.
All patients were followed throughout their hospitalization from the date of enrollment. The in-hospital mortality rate was calculated by taking the time passed until discharge from the hospital.
Exposure and endpoints
The primary exposure was ONSD measured during ICU admission. The primary endpoint was mortality or live discharge at any point during hospitalization. The secondary endpoints were length of hospital stay and mechanical ventilation during hospitalization.
Sample size and statistical analysis
A sample size calculation was performed using the Pearson product–moment correlation in which a power of 80%, significance level of 5% and moderate effect size (R = 0.3) were considered. This test yielded a sample size of 85 individuals for detecting the specified effect. Considering data losses, 91 patients were included in the study.
The data were analyzed statistically using IBM SPSS Statistics for Windows version 22 (IBM Corp., Armonk, NY, USA). Continuous variables were presented as median (interquartile range) and mean (standard deviation) values. Categorical variables were presented as frequency rates and percentages. The chi-square test was used to assess between-group differences with respect to categorical variables. The Mann–Whitney test was used to assess nonparametric continuous variables. Spearman’s correlation test was used to examine the relationships between two variables.
Univariate and multivariate Cox proportional hazard regression analyses were used to investigate the relationship between age, sex, BMI, comorbid diseases, arterial blood gas analysis, ONSD, APACHE II score, SOFA score, GCS score, glucose, urea, creatine, sodium, potassium, AST, ALT, albumin, CRP, D-dimer, respiratory support mode (IMV and NIV), PaO2:FiO2 ratio and in-hospital mortality (Model 1). Model 2 was applied with the same covariates by categorizing the ONSD cutoff point. Hazard ratio (HR) and 95% confidence intervals (CIs) were calculated for the assessment of demographics, comorbidities, clinical characteristics and ONSD during ICU admission associated with survival outcomes. Receiver operating characteristic (ROC) analysis and the area under the curve (AUC) were used to examine the ONSD with regard to predicting in-hospital mortality. The Kaplan–Meier survival analysis and log-rank test were performed, categorizing ONSD measurements as ≤5 mm and >5 mm. P < 0.05 was considered to indicate significance.
Results
The patients were divided into two groups: survivor (n = 48) and nonsurvivor (n = 43). No difference between the groups in terms of age, sex and BMI. Hypertension was the most common comorbid disease in both groups and was significantly higher in the survivor group than in the nonsurvivor group. The number of comorbid diseases was not different between the groups.
The laboratory results (glucose, urea, creatine, sodium, potassium, AST, ALT, albumin, CRP and D-dimer) measured during ICU admission were comparable between the two groups. In the arterial blood gas analysis, only the bicarbonate level was significantly lower in the nonsurvivor group than in the survivor group (P = 0.044).
The median SOFA and APACHE II scores measured during ICU admission were significantly higher in the nonsurvivor group than in the survivor group (3 vs. 2, P < 0.001; 12 vs. 8, P < 0.001, respectively). The median GCS score was lower in the nonsurvivor group than in the survivor group (P < 0.001). Demographic and clinical characteristics of the groups are shown in Table 1.
Demographic and clinical characteristics of the groups
| Parameters | Survivor (n = 48) | Nonsurvivor (n = 43) | P value |
|---|---|---|---|
| Sex | |||
| Male | 26 (54.2%) | 24 (55.8%) | 0.875a |
| Female | 22 (45.8%) | 19 (44.2%) | |
| Age, years | 75 (65–84) | 71 (63–84) | 0.247b |
| BMI, kg/m2 | 24.6 (23.3–27.8) | 25.95 (22.8–31.2) | 0.209b |
| Comorbid diseases | |||
| Cardiovascular disease | 26 (54.2%) | 22 (51.2%) | 0.774a |
| Diabetes mellitus | 16 (33.3%) | 21 (48.8%) | 0.133a |
| Hypertension | 43 (89.6%) | 30 (69.8%) | 0.018a |
| Chronic lung disease | 13 (27.1%) | 10 (23.3 %) | 0.675a |
| Number of comorbid diseases | |||
| 1 | 8 (16.7%) | 8 (16.7%) | 0.808a |
| 2 | 32 (66.7%) | 30 (69.8%) | 0.751a |
| 3 | 7 (14.6%) | 5 (11.6%) | 0.677a |
| 4 | 1 (2.1%) | 0 | 0.341a |
| Glucose, mg/dl | 145 (116–234) | 172 (137–238) | 0.061b |
| Urea, mg/dl | 54 (42–71) | 60 (39–73) | 0.877b |
| Creatine, mg/dl | 1 (0.81–1.22) | 1 (0.8–1.38) | 0.937b |
| Sodium, mmol/l | 137 (133–139) | 138 (134–142) | 0.232b |
| Potassium, mmol/l | 3.92 (3.34–4.43) | 4.2 (3.54–4.6) | 0.180b |
| AST, U/l | 26 (18–58) | 27 (23–43) | 0.946b |
| ALT, U/l | 18 (12–27) | 18 (15–24) | 0.696b |
| Albumin, g/dl | 2.77 (2.5–3.2) | 2.75 (2.53–2.99) | 0.382b |
| CRP, mg/dl | 7.41 (2.1–12.5) | 9.9 (3.8–16) | 0.278b |
| D-dimer, ug/l | 1446 (849–2320) | 1610 (923–3380) | 0.373b |
| Arterial blood gas analysis | |||
| pH | 7.39 (7.37–7.45) | 7.40 (7.33–7.45) | 0.349b |
| pCO2, mmHg | 39 (32–42) | 36 (34–45) | 0.656b |
| HCO3−, mmol/l | 24 (22–25) | 22 (20–25) | 0.044b |
| ONSD, mm | 4.15 (4.06–4.25) | 5.95 (5.8–6.25) | <0.001b |
| APACHE II score | 8 (8–9) | 12 (10–15) | <0.001b |
| SOFA score | 2 (2–2) | 3 (3–4) | <0.001b |
| GCS score | 15 (15–15) | 14 (11–15) | <0.001b |
| PaO2:FiO2 ratio, mmHg | 227 (200–250) | 130 (120–160) | <0.001b |
| IMV | 9 (19%) | 32 (74%) | <0.001a |
| NIV | 39 (81.3%) | 11 (25.6%) | |
| Length of ICU stay, day | 4 (3–9) | 8 (6–14) | <0.001b |
Categorical data shown as number (percentage). Non-normally distributed continuous variables displayed as median (interquartile range). P < 0.05: significant (shown in bold).
BMI, body mass index; AST, aspartate aminotransferase; ALT, alanine aminotransferase; CRP, C-reactive protein; pH, potential of hydrogen; PCO2, carbon dioxide arterial partial pressure; HCO3−, bicarbonate; ONSD, optic nerve sheath diameter; APACHE II, Acute Physiology and Chronic Health Evaluation II; SOFA, Sequential Organ Failure Assessment; GCS, Glasgow Coma Scale; PaO2:FiO2, arterial blood gas and arterial partial pressure of oxygen:fraction of inspired oxygen; IMV, invasive mechanical ventilation; NIV, non-invasive mechanical ventilation; ICU, intensive care unit.
Chi-square test,.
Mann–Whitney’s test.
ONSD measurements and COVID-19-related-in-hospital mortality
Overall in-hospital mortality in our cohort was 47% (43/91). The median ONSD was significantly higher in the nonsurvivor group than in the survivor group (5.95 mm vs. 4.15 mm, P < 0.001; Figure 1). The ROC curve analysis on the ONSD was performed to predict in-hospital mortality. The ONSD cutoff for predicting mortality during ICU admission was 5 mm (AUC, 0.985; sensitivity, 98%; and specificity, 90%). With the ONSD cutoff set at 5 mm, the median survival of those with ONSD ≤5 mm in the Kaplan–Meier life analysis was 13.26 days (n = 52 [57%]; 95% CI 24 to undetermined), and the median survival of those with ONSD >5 mm was 11.57 days (n = 39 [43%]; 95% CI 5.38–10.61; log-rank test, P = 0.001; Figure 2). In model 1, i.e. the univariate and multivariate Cox proportional hazard regression analyses on factors (contains 26 covariates) that influenced in-hospital mortality in the ICU, ONSD was found to be significant (unadjusted HR, 1.96; 95% CI, 1.27–3.01; P = 0.002; adjusted HR, 4.12; 95% CI, 1.46–11.55; P = 0.007; Table 2). When model 2 was created with the same covariates by categorizing ONSD according to the cutoff point (ONSD ≤5 mm and >5 mm), ONSD was found to be significant (unadjusted HR, 4.11; 95% CI, 1.57–10.72; P = 0.004; adjusted HR, 16.90; 95% CI, 2.80–101.79; P = 0.002).
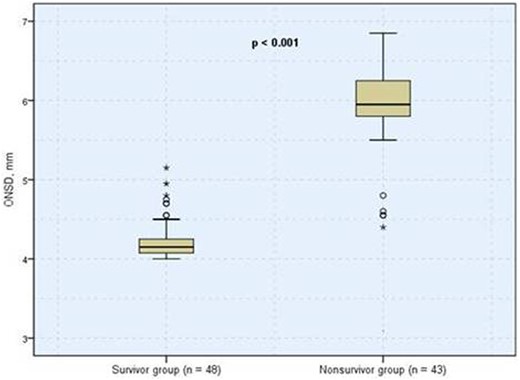
Boxplots of ONSD showing comparison between survivor and nonsurvivor groups. The median ONSD between groups were significantly different. ONSD, optic nerve sheath diameter.
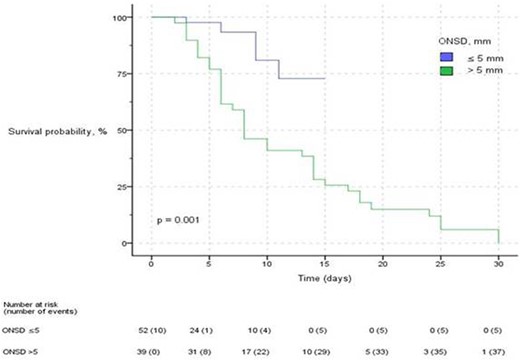
Kaplan–Meier plot of probability of survival over time. The plot is categorized by ONSD measurement during ICU admission above or equal to and below the cutoff of 5 mm. ONSD, optic nerve sheath diameter; ICU, intensive care unit.
Univariate and multivariate Cox proportional hazard regression analyses on demographic, comorbidities, clinical characteristics and optic nerve sheath diameter related to in-hospital mortality in patients with critical COVID-19 in the intensive care unit (Model 1)
| Parameters | Unadjusted HR (95% CI) | P value | Adjusted HR (95% CI) | P value |
|---|---|---|---|---|
| Gender | 0.71 (0.37–1.38) | 0.322 | 0.02 (0–0.28) | 0.003 |
| Age, years | 1.01 (0.98–1.03) | 0.401 | 1.02 (0.98–1.06) | 0.253 |
| BMI, kg/m2 | 1.03 (0.98–1.08) | 0.183 | 0.99 (0.89–1.09) | 0.874 |
| Comorbid diseases | ||||
| Cardiovascular disease | 1.08 (0.58–2.01) | 0.787 | 4.76 (1.04–21.72) | 0.043 |
| Diabetes mellitus | 1.09 (0.59–2.03) | 0.770 | 1.03 (0.26–4.02) | 0.962 |
| Hypertension | 0.79 (0.4–1.54) | 0.499 | 1.09 (0.29–4.06) | 0.896 |
| Chronic lung disease | 1.14 (0.55–2.38) | 0.710 | 0.67 (0.11–3.80) | 0.654 |
| Arterial blood gas analysis | ||||
| pH | 0.14 (0–2.23) | 0.164 | 115.08 (0–333366) | 0.460 |
| PaCO2 | 1 (0.97–1.04) | 0.634 | 0.99 (0.89–1.1) | 0.920 |
| HCO3− | 0.98 (0.9–1.06) | 0.626 | 1.11 (0.82–1.49) | 0.485 |
| ONSD, mm | 1.96 (1.27–3.01) | 0.002 | 4.12 (1.46–11.55) | 0.007 |
| APACHE II score | 1.12 (1.05–1.18) | <0.001 | 1.34 (1.02–1.75) | 0.033 |
| SOFA score | 1.23 (1.1–1.36) | <0.001 | 0.47 (0.25–0.91) | 0.025 |
| GCS at admission | 0.85 (0.77–0.93) | 0.001 | 0.69 (0.48–1) | 0.055 |
| PaO2:FiO2 ratio, mmHg | 0.98 (0.98–0.99) | 0.005 | 0.98 (0.95–1) | 0.142 |
| IMV | 1.41 (0.7–2.86) | 0.333 | 0.16 (0.02–1.06) | 0.058 |
| Glucose, mg/dl | 1 (1–1) | 0.010 | 1.01 (1–1.02) | <0.001 |
| Urea, mg/dl | 0.99 (0.98–1) | 0.153 | 0.95 (0.93–0.98) | 0.002 |
| Creatine, mg/dl | 1.07 (0.53–2.17) | 0.839 | 0.76 (0.14–4.19) | 0.760 |
| Sodium, mmol/l | 1.08 (1.02–1.14) | 0.004 | 1.15 (1.01–1.30) | 0.029 |
| Potassium, mmol/l | 0.88 (0.58–1.33) | 0.549 | 2.99 (1.07–8.36) | 0.036 |
| AST, U/l | 0.99 (0.98–1) | 0.332 | 0.97 (0.95–1) | 0.119 |
| ALT, U/l | 0.99 (0.99–1) | 0.495 | 1.04 (1–1.07) | 0.017 |
| Albumin, g/dl | 0.79 (0.34–1.83) | 0.590 | 0.34 (0.02–4.48) | 0.418 |
| CRP, mg/dl | 1.02 (0.98–1.07) | 0.200 | 1.08 (0.96–1.22) | 0.185 |
| D-dimer, ug/l | 1 (1–1) | 0.859 | 1 (1–1) | 0.844 |
P < 0.05: significant (shown in bold).
Apachi II, Acute physiology and chronic health evaluation II; ICU, intensive care unit; BMI, body mass index; pH, potential of hydrogen; PCO2, carbon dioxide arterial partial pressure; HCO3−, bicarbonate; ONSD, optic nerve sheath diameter; APACHE II, Acute Physiology and Chronic Health Evaluation II; SOFA, Sequential Organ Failure Assessment; GCS, Glasgow Coma Scale; PaO2:FiO2, arterial blood gas and arterial partial pressure of oxygen:fraction of inspired oxygen; IMV, invasive mechanical ventilation; AST, aspartate aminotransferase; ALT, alanine aminotransferase; CRP, C-reactive protein.
According to Spearman’s correlation, an inverse correlation was found between ONSD with PaO2:FiO2 ratio and GCS, whereas a positive correlation was found between APACHE II score and SOFA score, and it was significant (Table 3, Figure 3).
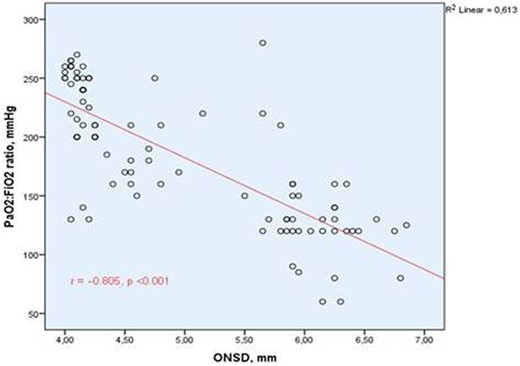
Correlation graph between the optic nerve sheath diameter and PaO2:FiO2 ratio. Abbreviation. ONSD, optic nerve sheath diameter; PaO2:FiO2, arterial partial pressure of oxygen:fraction of inspired oxygen. Spearman’s correlation test was used.
Correlations between the optic nerve sheath diameter and clinical parameters upon admission to the intensive care unit
| Parameters | Correlation coefficient | P value |
|---|---|---|
| PaO2:FiO2 ratio, mmHg | –0.805 | <0.001 |
| APACHE II score | 0.758 | <0.001 |
| Sofa score | 0.736 | <0.001 |
| GCS score | –0.435 | <0.001 |
| CRP, mg/dl | –0.013 | 0.906 |
| ICU stay, day | 0.377 | <0.001 |
| pCO2 | –0.103 | 0.330 |
Spearman’s correlation test was used. P < 0.05: significant (shown in bold).
APACHE II, Acute Physiology and Chronic Health Evaluation II; ICU, intensive care unit; PaO2:FiO2, arterial partial pressure of oxygen:fraction of inspired oxygen; Apachi II, Acute physiology and chronic health evaluation II; Sofa, Sequential organ failure assessment; GCS, Glasgow Coma Scale; CRP, C-reactive protein; PaCO2, carbon dioxide arterial partial pressure.
Adverse effects of ONSD measurement
In both the training and intervention periods, no adverse effects related to ONSD measurements were reported by either the patients or ICU professionals.
Discussion
The novelty of this study is related to the finding that ONSD ultrasonographic measurement during ICU admission is a simple, cheap, easily applicable and reliable predictor for COVID-19-related-in-hospital mortality during the ICU stay. To the best of our knowledge, this study is the first to assess prospectively ONSD ultrasonographic measurement as an early predictor of outcomes in patients with critical COVID-19 admitted in the ICU.
The estimation of ICP may help in the management of patients with critical illness. Ultrasonographic measurement of the ONSD is a reliable tool for noninvasive estimation of ICP on admission to the hospital or ICU.14,15 Transorbital sonography has the advantages of being low cost, with short investigation times, good reproducibility and bedside availability, and most importantly of being noninvasive and simple.16,17
Acute hypoxia and hypercapnia may develop frequently as a result of severe lung injury caused by COVID-19 in the ICUs. Acute hypoxic hypercapnia increases ICP, primarily through cerebral vasodilatation and increases in cerebral blood volume, which, clinically, is the most important effect of hypercapnia on the central nervous system. In our study, a negative correlation was found between partial oxygen pressure and ONSD.
An elevated ICP can result in many clinical and traumatic circumstances and is a life-threatening condition.18 The ‘gold standard’ methods for measuring elevated ICP can put patients with critical illness at further risk due to the invasive nature of the intervention, and these gold standard approaches carry a notable risk for severe complications such as hemorrhage, infection and malfunction. Therefore, these approaches are not indicated in patients in critical condition.19
Predictive scoring systems are measures of disease severity that are used to predict outcomes, typically mortality, of patients in the ICU. Predictive scoring systems, which are used to monitor disease severity and prognosis in the ICUs, have many disadvantages. For example, in APACHE II scoring, the number of input variables is high, and the score may change because of worsening performance over time. The SOFA score has been used in the identification of patient populations at greater risk of dying from sepsis. However, no scoring system is superior to each other. In addition, the large number of scoring system parameters may lead to the clinician wasting a substantial amount of time and obtaining incorrect calculation. As ONSD measurement is an easy method that can be performed in a short time, we found that it was superior to SOFA and APACHE II scores in predicting mortality in the ICU.
In a study conducted in 2014, 220 patients with traumatic brain injury in the ICU were examined, and a 1-mm increase in ONSD was associated with a 2-fold increase in-hospital mortality.20 Patel et al.21 examined 86 patients with ischemic or hemorrhagic stroke who had ONSD ultrasonographic measurements within the first 2 days of hospitalization. The mean ONSD differed in patients who survived versus those who died before discharge because of ischemic (0.53 vs. 0.58 cm; P = 0.009) or hemorrhagic (0.57 vs. 0.62 cm; P = 0.019) stroke. In our study, the best ONSD cutoff in patients with COVID-19 was 5 mm, other than cerebrovascular diseases, within a very short time, such as the first 3 h of their admission to the ICU. In addition, in our study, a 1-mm increase in ONSD was associated with a 4-fold increase in-hospital mortality. The early detection of elevated ICP cannot only prevent mortality but also aid in more aggressive management.
This study has several limitations that warrant caution when interpreting the results. First, our results demonstrate an association between ONSD and increased ICP but do not suggest a predictive ability of which patients will develop increased ICP during their illness. Importantly, ICP and ONSD have a dynamic relationship, which requires a close temporal association. Ultrasound studies have demonstrated that ONSD acutely fluctuates within minutes of changes in ICP when the pressure–volume characteristics of the intracranial compartment are altered.22–24 Second, ONSD was measured only during ICU admission. ONSD could not be measured in the intensive care follow-ups after hospitalization. Owing to the heavy burden of the pandemic on ICUs, there was not enough time to allocate work. Third, this study was valid during hospitalization. It could not keep track of the life situation after discharge. Finally, this study was examined using single-center data. Larger, multicenter studies are needed to obtain more conclusive evidence.
Conclusion
The ONSD ultrasonographic measurement at the time of ICU admission is a promising way to evaluate COVID-19-related mortality. This noninvasive bedside tool is simple, cheap and available for serial measurements.
Supplementary material
Supplementary material is available at QJMED online.
Conflict of interest: None declared.
Data availability
The dataset generated during and analyzed during the current study are available from the corresponding author on reasonable request.
