


Abstract
There is limited comprehensive evidence on the potential association between early menarche and subsequent health outcomes.
To evaluate the existing evidence for the association of early menarche with later health outcomes and assesse the strength and validity of the evidence for these associations.
Umbrella review.
We searched PubMed, Web of Science, Embase, CINAHL, Cochrane Database of Systematic Reviews and Google Scholar, and manually screened retrieved references to find systematic reviews and meta-analyses from inception to July 2021. Early menarche was defined by taking into account ethnicity and birth year, and the outcomes were long-term consequences in adulthood.
Thirteen reviews encompassing 283 original articles and over 6.8 million participants from 39 countries across 5 continents were included. In categorical outcomes, early menarche was associated with metabolic syndrome (n = 37 543 pooled adjusted relative risk [aRR] 1.56, 95% confidence interval (CI) 1.33, 1.83; high certainty [Hi]), endometrial cancer (n = 874 188, aRR 1.40, 95% CI 1.17, 1.68; Hi), type 2 diabetes mellitus/impaired glucose tolerance (n = 1 185 444, aRR 1.30, 95% CI 1.19, 1.42; Hi), breast cancer (n = 103 574, aRR 1.19, 95% CI 1.06, 1.33; Hi), death from all causes (n = 152 747, aRR 1.11, 95% CI 1.03, 1.19; Hi), obesity (n = 54 006, aRR 1.68, 95% CI 1.53, 1.84; moderate certainty [Mod]), gestational diabetes mellitus (n = 48 535, aRR 1.32, 95% CI 1.09, 1.58; Mod), hypertension (n = 1 682 689, aRR 1.24, 95% CI 1.20, 1.29; Mod), endometriosis (n = 885 390, aRR 1.22, 95% CI 1.09, 1.37; Mod), ovarian cancer (n = 1 022 451, aRR 1.17, 95% CI 1.04, 1.31; Mod) and asthma (n = 22 859, aRR 1.31, 95% CI 1.09, 1.57; low certainty [Lo]). For continuous outcomes, early menarche was associated with increased body mass index (BMI) in adults ≥40 years of age (n = 121 943, adjusted pooled standardized mean difference [aSMD] 0.30, 95% CI 0.28, 0.32; Mod), BMI in adults <40 years of age (n = 124 728, aSMD 0.39, 95% CI 0.36, 0.43; Mod), serum fasting insulin level (n = 17 020, aSMD 0.52, 95% CI 0.48, 0.57; Mod) and homeostatic model assessment of insulin resistance (n = 7925, aSMD 0.27, 95% CI 0.19, 0.35; Mod).
We found varied levels of evidence for the association between early menarche and the development of subsequent health problems. Our results recommend that physicians should pay attention to these associations, as early menarche can be a potential indicator of metabolic disorders and female-specific cancer and cause death in women.
Introduction
Puberty is a transition period of sexual maturation and fertility.1 The onset of puberty and menarche in girls has been associated with environmental factors such as nutritional status, obesity and endocrine-disrupting chemicals, over the last few decades.1–3
In response to trends of earlier pubertal timing, previous epidemiologic studies have focused on the associations between age at menarche and various health outcomes in adults such as cardio-metabolic disorders, female-specific cancers and psychosocial problems.4–6 Several existing meta-analyses have also investigated the effects of age at menarche on long-term health consequences; however, the majority of these studies were observational studies, and the comprehensive assessment of these evidences has not been evaluated. It is important to systematically assess the wide range of associations, strength, validity and/or quality of evidence on the relationship between early menarche and long-term health outcomes. An umbrella review can provide more evidence and lead to a better understanding of uncertainties, biases and knowledge gaps.7
There have been few systemic reviews that investigated the association between early menarche and long-term consequences. We conducted an umbrella review of existing meta-analyses to summarize the current evidence on early menarche and long-term health outcomes in adults.
Methods
We conducted an umbrella review7 to summarize and evaluate the association between early menarche and several long-term health outcomes in women by searching for systematic meta-analyses. This umbrella review adhered to the Preferred Reporting Items for Systematic Reviews and Meta-Analyses (PRISMA)8 guidelines, and the protocol was registered with PROSPERO (Registration No CRD42021276069).
Literature search strategy and selection criteria
Two researchers (J.S.L. and D.K.Y.) independently searched PubMed, Embase, CINAHL, Google Scholar and the Cochrane Database of Systematic Reviews database from inception to August 2021 for meta-analyses of observational studies that investigated the association between early menarche and long-term health in women. We used the following search strategy: (puberty OR menarche) AND (meta-analysis OR systematic review) using truncated terms for all fields. We also manually searched the references of the eligible articles. Two researchers meticulously reviewed the titles, abstracts and full texts of the studies found through the search (J.S.L. and D.K.Y.). Additional details of our search strategy are provided in Supplementary methods.
Figure 1 summarizes the study's selection process. Articles were considered eligible if they were meta-analyses that described the systematic review process in sufficient detail, attempted to identify all of the relevant primary studies in at least one database, provided a search strategy and performed a quality appraisal of the primary studies included.9 We only included meta-analyses of observational studies (cohort, case–control and cross-sectional with binary outcomes) and full-text articles published in English because there was no randomized control trial study. The articles were included if they pooled any combination of relative risks, odds ratios, relative rates or hazard ratios from studies that compared exposure to the same health outcome. We used the following criteria for multiple systematic reviews of the same health outcomes in the same population: We chose the highest-quality review if the primary studies were completely overlapping. If the primary studies partially or completely overlapped, we chose the largest meta-analysis with the greatest number of trials and the most recent one. If an article presented more than one meta-analysis, each one was evaluated separately based on the inclusion criteria. The following articles were excluded; old articles with duplicate results, articles that were not large systematic reviews or meta-analysis, based on total sample size, and articles that only analyzed increasing menarche and not early menarche.
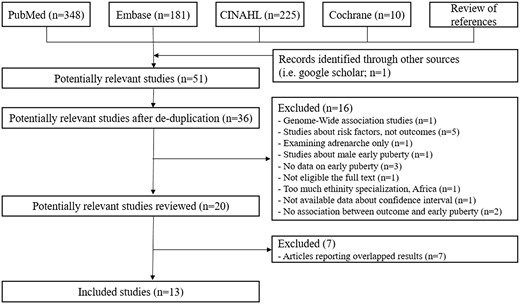
Study flow chart.
The outcomes of interest were obesity,10 body mass index (BMI) in adults over or under 40 years of age,10 type 2 diabetes or impaired glucose tolerance,11 gestational diabetes mellitus,12 serum fasting insulin level13 homeostatic model assessment of insulin resistance (HOMA-IR),13 hypertension,14 systolic blood pressure,14 diastolic blood pressure,14 metabolic syndrome,15 endometriosis,16 ovarian cancer,17 endometrial cancer,18 breast cancer,4 depression,19 asthma,20 death from total cardiovascular disease (ischemic heart disease and stroke),6 death from ischemic heart disease,6 death from stroke6 and death other causes.6
Early menarche was defined differently depending on the country and the year of birth of the study subjects. This was a common concern among the authors of meta-analyses that looked at the effects of early menarche. In general, the definition of early menarche was considered based on ethnicity and birth year; therefore, we defined early menarche as defined by each meta-analysis research (most were under 12 years old, the lowest age criterion was 10 years or younger, and the highest age criterion was less than 13 years old).
Data extraction and re-analysis
Two researchers (J.S.L. and D.K.Y.) independently screened the titles and abstracts and selected articles for full-text review. They then independently reviewed the full-text articles for eligibility. A third researcher, Y.J.L., arbitrated any differences that could not be resolved by consensus. For each published meta-analysis, we extracted the following data: first author, journal, year of publication, number of studies, number of participants, outcomes of interest, search strategy, selection criteria, method of pooling estimates and quality assessment, and methods of detecting publication bias.
We re-analyzed each meta-analysis using the Der Simonian and Laird random fixed effects model, which takes into account the variance between and within studies. We accomplished this by extraction exposure and outcome data, as published in each meta-analysis article when these data were available in sufficient detail. We also reviewed the primary study articles included in each meta-analysis in the case of insufficient data. We did not re-analyze any of the dose–response meta-analyses due to a lack of published estimates for the number of cases and controls/participants required for a dose–response analysis. We performed several analyses to identify the following: I2 statistic to find heterogeneity as an estimate of the proportion of variance reflecting true differences in effect size,7 with I2 values greater than 50% suggesting significant heterogeneity; p-curve analysis to detect p-hacking;21 95% prediction interval (95% PI) for the summary of random-effects estimates to assess the uncertainty of the observed association7 (this can predict the value of a new observation based on an existing model using Bayesian statistics and whether future studies might find that the exposure produced no effect or the opposite effect on the outcome); Egger’s test to find publication bias with a P value <0.1 was considered significant; and the Hartung–Knapp–Sidik–Jonkman method to reduce inappropriate type 1 error rates through sophisticated meta-analysis statistical technique.22 We performed statistical analyses using the R software, version 3.1.1.23,24 A two-sided P value of <0.05, was considered significant.
Furthermore, we defined population-attributable fractions for each outcome based on the relative risk of early menarche and calculated them using the confounder-unadjusted attributable risk formula assuming a 10% prevalence of early menarche in women.25 We only assumed population attributable fractions for the female population to provide a straightforward comparison in a single visualization. We approximated the equivalent RRs or SMDs of different metrics using the guidelines outlined in a previous study.7
Assessment of methodological quality of included studies and quality of evidence
We used A Measurement Tool Assessment Systematic Reviews 2 (AMSTAR 2) checklist to evaluate the methodological quality and assign an overall rating to the included reviews. Two researchers (J.S.L. and D.K.Y.) independently assessed the methodological quality of the reviews using the AMSTAR 2 quality appraisal instrument.7 In the event of disagreements or a failure to reach a consensus, a decision was reached by consulting a third reviewer (Y.J.L.).
We used the Grading of Recommendations, Assessment, Development and Evaluation (GRADE) working group classification to assess the quality of evidence for each outcome included in the umbrella review.7 The modified GRADE approach categorizes evidence from systematic reviews and meta-analyses into ‘high’, ‘moderate’, ‘low’ or ‘very low’ quality. We assigned Grade 3 (moderate) for large-scale prospective cohort studies and Grade 2 (low) for retrospective cohort studies to account for such characteristics of epidemiological research. This modified GRADE approach was supported by several previous studies that suggested a distinction between evidence levels in prospective and retrospective cohort studies.7 Imprecision was determined when the sample size was insufficient (1000) or the confidence interval (CI) value exceeded 1. We judged imprecision when the full CI length was greater than 0.5; indirectness reflects differences in study populations; we assigned inconsistency when heterogeneity measured by the I2 statistic was greater than 50% for binary outcomes, and the Cochrane Collaboration had a revised cut-off of I2 > 75% for high heterogeneity. The publication bias study was determined to have publication bias when the funnel plot was asymmetrical and the P values for Egger's test was 0.10. We determined the dose–response relationship if the effect size increased proportionally with age at menarche. The large magnitude of the effect was assessed using the Hartung–Knapp–Sidik–Jonkman method rather than the DerSimonian and Laird method, and the plausible residual confounding supporting inferences regarding conclusions such as adiposity, age and ethnicity, among other things, raise the quality of the evidence, as described in Table 1. Finally, the GRADE was calculated while accounting for all accountable biases.
Description of total meta-analysis studies investigating the potential relationship between early puberty and all-related health outcomes
| Outcome | First author | Published year | All plausible confounding factors | Included countries | AMSTAR2 |
|---|---|---|---|---|---|
| T2DM/IGT | Cheng TS | 2020 | Adiposity (BMI, waist circumference or body composition) and ethnicity | China, Bangladeshi, African-American, Korea, USA, UK, Italy, France, Spain, the Netherlands, Germany, Sweden, Denmark, Iran and Brazil | Low |
| GDM | Xiao Y | 2018 | BMI | China, USA and Australia | Low |
| HOMA-IR | Zhang Z | 2019 | Study design, age, BMI, sample size and ethnicity | Korea, USA and UK | Low |
| Fasting insulin (uIU/ml) | Zhang Z | 2019 | Study design, age, BMI, sample size and ethnicity | Korea, USA, Brazil, UK and New Zealand | Low |
| Obesity | Prentice P | 2013 | Not done | USA, UK and Sweden | Low |
| Adult BMI (≥40 years) | Prentice P | 2013 | Not done | USA, UK and Austria | Low |
| Adult BMI (<40 years) | Prentice P | 2013 | Not done | USA and UK | Low |
| Hypertension Systolic blood pressure Diastolic blood pressure | Bubach S | 2018 | Study design, sample size, early and later menarche age categories, adjustment for confounders (Childhood and adult socioeconomic status, body weight, BMI at 7 years, menopausal status at 53 years, BMI at 7 years, level, marital status, occupation, smoking status, alcohol consumption, oral contraceptive use, physical activity level, parental history of diabetes, number of pregnancy and use of tobacco products) | Japan, UK, China, Portugal, Spain, Germany, India, Singapore, USA and Korea | Moderate |
| Asthma | Lieberoth S | 2014 | Not done | Mexico, USA, Canada, Finland, Sweden, Iceland, Norway, Denmark, Estonia, Belgium, the Netherlands, Germany, Austria, Switzerland, France, Greece, Italy, Spain, Portugal, Algeria, India, New Zealand, Australia and UK | Moderate |
| Endometriosis | Lu MY | 2020 | Study area (developed vs. developing), study design, study start years (before vs. after 2000) and study quality (Newcastle-Ottawa scale score >5 vs. ≤5) | USA, Australia, Italy, Iran, Germany, France, Egypt, Sweden and Canada | Low |
| Metabolic syndrome | Kim Y | 2019 | Geographical region, study design, number of subjects, BMI and adjustment for confounders (smoking, alcohol and physical activity) | China, Germany, USA, Portugal, Bangladesh, Brazil, Taiwan, Korea and China | Low |
| Death from all causes | Charalampopoulos D | 2014 | BMI | Norway, Japan, UK, USA and Australia | Low |
| Death from ischemic heart disease | Charalampopoulos D | 2014 | Smoking | USA, Singapore, China, Japan and Korea | Low |
| Death from stroke | Charalampopoulos D | 2014 | Not done | China, Korea, USA, Singapore and Japan | Low |
| Death from cardiovascular disease | Charalampopoulos D | 2014 | Not done | Singapore, Korea, Japan and UK | Low |
| Ovarian cancer | Gong TT | 2013 | Study quality, study design, exposure assessment (self-administered questionnaire vs. trained interviewers), type of control subjects for case-control studies (population-based vs. hospital-based controls), study population (Asians, Americans or Europeans), cancer grading (invasive vs. borderline), cancer histotype (invasive serous vs. borderline serous) and adjustment for confounders (BMI, parity, use of oral contraceptives, exogenous hormones use, menopause status and smoking status) | USA, Korea, Japan, China, Denmark, France, Germany, the Netherlands, Norway, Spain, Australia, Mexico, Italy, Sweden, Greece, Poland and UK | Moderate |
| Endometrial cancer | Gong TT | 2015 | Ethnicity (Non-American vs. American), exposure assessment (trained interviewer vs. self-administered questionnaire), number of cases (<400 vs. ≥400), duration of follow-up (<10 years vs. ≥10 years) and adjustment for confounders (BMI, parity, oral contraceptive use, exogenous hormones use, menopause status and smoking status) | USA, Denmark, France, Germany, Greece, Italy, the Netherlands, Spain, Sweden, UK and Norway | Moderate |
| Depression | Galvao TF | 2014 | Not done | USA, Finland and New Zealand | Moderatea |
| Breast cancer | Cancer CGoHFiB | 2012 | Year of birth, parity, age at first birth, height, BMI (young adult), BMI (current), use of hormonal contraceptives, smoking, alcohol, menopausal status and age at menarche (years) | USA, UK, Sweden, Canada, Japan, UK, Iceland, Netherlands, China, Denmark, Norway, New Zealand, Australia, Costa Rica, Spain, Switzerland, Germany, Italy, Poland, Cyprus, Mexico, Israel, Brazil, Slovenia, France, Singapore, Philippines, Greece, South Africa, India and Iran |
BMI, body mass index; CGoHFiB, Collaborative Group on Hormonal Factors in Breast Cancer; GDM, gestational diabetes mellitus; HOMA-IR, Homeostatic Model Assessment for Insulin Resistance; IGT, impaired glucose tolerance; T2DM, type 2 diabetes mellitus.
This meta-analysis was included by individual level. We cannot calculate AMSTAR2.
Patient and public involvement
No patients were involved in setting the research question or the outcome measures, nor were they involved in developing plans for the design or implementation of the study. No patients were asked to advise on the interpretation or writing up of results. However, we plan on disseminating the results of this study to any of the study participants or wider relevant communities on request.
Results
The literature search yielded a total of 764 results. After removing duplicates and screening titles and abstracts, we selected 20 articles for full-text screening. The results of the systematic search and selection of eligible studies are depicted in Figure 1. Following a review of 20 full-text articles for eligibility, 13 meta-analyses of observational studies with 21 outcomes encompassing 283 original articles, including 145 cohorts, and over 6 million participants published between 2012 and 2020 were included across 39 countries and 5 continents. Supplementary Table S1 provides a list of excluded studies, along with the reasons for exclusion, after screening the titles, abstracts and full text.
Summary of long-term health outcomes
Table 1 summarizes the data from the studies included in this umbrella review, including the outcome, exposure and AMSTAR2 rating. Table 2 displays re-analyzed risk estimates for each outcome for early, average, late, or not early (both average and late) menarche. Supplementary Table S2 summarizes the subgroup analysis of each outcome.
Re-analysis of effect size using DL method and HS method, heterogeneity, Egger’s P values, population attributable factor, 95% prediction interval and GRADE
| Outcome | Exposure (early) vs. non exposure | Included studies (cohorts) | Metric | Total sample | Reported summary ES (95% CI)—random-effect model | Re-analyzed summary ES (95% CI) DL method | Re-analyzed summary ES (95% CI) HS method Random-effect model | Heterogeneity I2 (%) | Egger’s P-value | PAF (95% CI) | 95% prediction interval | GRADE (certainty of evidence) | ||
|---|---|---|---|---|---|---|---|---|---|---|---|---|---|---|
| Fixed-effect model | Random-effect model | Largest study | ||||||||||||
| T2DM/IGT | Not early | 23 (23) | OR | 1 185 444 | 1.39 (1.25–1.55) | 1.32 (1.28, 1.35) | 1.39 (1.26, 1.53) | 0.98 (0.86, 1.12) | 1.31 (1.20, 1.44) | 87.28 | 0.21226 | 3.01 (1.96, 4.22) | (0.90, 2.14) | High |
| GDM | Not early | 5 (5) | RR | 48 535 | 1.31 (1.05, 1.56) | 1.36 (1.20, 1.53) | 1.36 (1.15, 1.60) | 1.34 (1.14, 1.58) | 1.36 (1.10, 1.67) | 33.23 | 0.85991 | 3.48 (0.99, 6.28) | (0.93, 1.99) | Moderate |
| HOMA-IR | Average | 5 (1) | WMD | 7925 | 0.40 (0.28, 0.52) | 0.39 (0.28, 0.51) | 0.39 (0.28, 0.51) | 0.42 (0.21, 0.69) | 0.41 (0.29, 0.58) | 0 | 0.75369 | (0.18, 0.41) | Moderate | |
| Fasting insulin (uIU/mL) | Average | 9 (4) | WMD | 17 020 | 1.28 (1.13, 1.43) | 1.30 (1.24, 1.36) | 1.28 (1.23, 1.44) | 2.00 (0.91, 3.09) | 1.29 (1.21, 1.38) | 8.12 | 0.67836 | (0.99, 1.65) | Moderate | |
| Obesity | Not early | 5 (5) | OR | 54 006 | 2.00 (1.79, 2.24) | 1.97 (1.83, 2.12) | 2.00 (1.79, 2.24) | 1.93 (1.69, 2.22) | 1.97 (1.73, 2.23) | 35.02 | 0.83040 | 8.84 (6.80, 10.95) | (1.50, 2.67) | Moderate |
| Adult BMI (≥40 years) | Not early | 6 (6) | SMD | 121 943 | 0.29 (0.28, 0.31) | 0.30 (0.28, 0.31) | 0.32 (0.28, 0.35) | 0.29 (0.27, 0.30) | 0.30 (0.28, 0.32) | 36.32 | 0.08680 | (0.28, 0.36) | Moderate | |
| Adult BMI (<40 years) | Not early | 4 (4) | SMD | 124 728 | 0.39 (0.37, 0.40) | 0.39 (0.37, 0.40) | 0.40 (0.37, 0.43) | 0.39 (0.37, 0.40) | 0.39 (0.36, 0.43) | 53.25 | 0.44684 | (0.32, 0.48) | Moderate | |
| Hypertension | Not early | 17 (10) | OR | 1 682 689 | 1.25 (1.17, 1.34) | 1.34 (1.31, 1.36) | 1.25 (1.17, 1.34) | 1.41 (1.36, 1.47) | 1.34 (1.27, 1.41) | 84.69 | 0.04860 | 3.29 (2.63, 3.94) | (0.99, 1.58) | Moderate |
| Systolic blood pressure | Not early | 8 (4) | RMD | 15 064 | 0.8 (−1.52, 3.12) | 1.27 (0.59, 1.96) | 0.80 (−1.52, 3.12) | 2.50 (1.58, 3.42) | 1.27 (−1.05, 3.60) | 87.56 | 0.5613 | (−6.63, 9.17) | Moderate | |
| Diastolic blood pressure | Not early | 8 (4) | RMD | 15 064 | 0.14 (−1.17, 1.46) | 0.68 (0.24, 1.12) | 0.14 (−1.17, 1.46) | 1.40 (0.79, 2.01) | 0.70 (−0.69, 2.10) | 84.272 | 0.3030 | (−3.73, 5.13) | Moderate | |
| Asthma | Not early | 7 (7) | OR | 22 859 | 1.37 (1.15, 1.64) | 1.31 (1.19, 1.44) | 1.37 (1.15, 1.64) | 1.25 (1.10, 1.43) | 1.31 (1.09, 1.57) | 54.88 | 0.38546 | 3.01 (0.89, 5.39) | (1.07, 1.32) | Low |
| Endometriosis | Not early | 16 (7) | RR | 885 390 | 1.34 (1.16, 1.54) | 1.22 (1.16, 1.29) | 1.34 (1.16, 1.54) | 1.18 (1.06, 1.31) | 1.22 (1.09, 1.37) | 71.95 | 0.32131 | 2.15 (0.89, 3.57) | (3.55, 10.51) | Moderate |
| Metabolic Syndrome | Late menarche | 11 (3) | RR | 37 543 | 1.62 (1.40, 1.88) | 1.56 (1.43, 1.71) | 1.62 (1.40, 1.88) | 1.48 (1.03, 2.12) | 1.56 (1.33, 1.83) | 57.14 | 0.16761 | 5.30 (3.20, 7.66) | (1.04, 2.53) | High |
| Death from all causes | Median | 5 (5) | HR | 152 747 | 1.18 (1.08, 1.29) | 1.11 (1.07, 1.15) | 1.18 (1.08, 1.29) | 1.09 (1.05, 1.13) | 1.11 (1.03, 1.19) | 57.53 | 0.04461 | 1.09 (0.30, 1.87) | (0.90, 1.13) | High |
| Death from ischemic heart disease | Median | 5 (5) | HR | 97 963 | 1.22 (0.95, 1.56) | 1.19 (1.04, 1.37) | 1.18 (1.02, 1.36) | 0.82 (0.47, 1.43) | 1.19 (0.87, 1.63) | 59.28 | 0.71765 | 1.87 (−1.32, 5.93) | (0.56, 2.64) | Low |
| Death from stroke | Median | 5 (5) | HR | 91 051 | 1.05 (0.94, 1.19) | 1.05 (0.94, 1.19) | 1.05 (0.94, 1.19) | 0.99 (0.83, 1.18) | 1.05 (0.89, 1.25) | 0 | 0.37610 | 0.50 (−1.11, 2.44) | (0.86, 1.29) | Moderate |
| Death from cardiovascular disease | Median | 4 (4) | HR | 362 106 | 1.05 (0.90, 1.21) | 1.03 (1.93, 1.15) | 1.04 (0.90, 1.21) | 0.94 (0.74, 1.2) | 1.03 (0.82, 1.30) | 43.10 | 0.35284 | 0.30 (−1.83, 2.91) | (0.40, 2.69) | Moderate |
| Ovarian cancer | Late menarche | 25 (5) | RR | 1 022 451 | 1.18b(1.03, 1.33) | 1.17 (1.08, 1.27) | 1.17 (1.03, 1.33) | 1.14 (0.88, 1.47) | 1.17 (1.04, 1.31) | 42.23 | 0.86570 | 1.67 (0.40, 3.01) | (0.79, 1.76) | Moderate |
| Endometrial cancer | Oldest | 8 (8) | RR | 874 188 | 1.47b(1.24, 1.72) | 1.40 (1.25, 1.57) | 1.47 (1.24, 1.74) | 1.39 (1.11, 1.72) | 1.40 (1.17, 1.68) | 41.90 | 0.13885 | 3.85 (1.67, 6.37) | (0.97, 2.24) | High |
| Depression | Not early | 3 (3) | RR | 4945 | 1.33 (1.02, 1.73) | 1.26 (1.07, 1.47) | 1.33 (1.02, 1.73) | 1.15 (0.94, 1.4) | 1.26 (0.75, 2.11) | 54.55 | 0.31109 | 2.53 (−2.56, 10.00) | (0.08, 21.52) | Very low |
| Breast cancera | Not early | 117 (35) | RR | 103 574 | 1.12 (1.09, 1.15) | 1.19 (1.06, 1.33) | Very high | |||||||
BMI, body mass index; CI, confidence interval; DL, Der Simonian and Laird; GDM, gestational diabetes mellitus; HOMA-IR, Homeostatic Model Assessment for Insulin Resistance; HR, hazard ratio; HS, Hartung–Knapp–Sidik–Jonkman; IGT, impaired glucose tolerance; OR, odds ratio; RMD, raw mean differences; RR, relative risks; SMD, standard mean differences; T2DM, type 2 diabetes mellitus; WMD, weighted mean differences.
This meta-analysis was included by individual level. We cannot calculate several values such as heterogeneity, Egger’s P values and 95% prediction interval.
The reciprocal of the value presented in the original text was used.
All meta-analyses reported estimates that had been adjusted for a variety of confounding factors are shown in Table 1. Meta-analyses examined a wide range of outcomes including obesity, BMI in adults over or under 40 years of age, type 2 diabetes or impaired glucose tolerance, gestational diabetes mellitus, log-transformed levels of serum fasting insulin and log-transformed homeostatic model assessment of insulin resistance (HOMA-IR), hypertension, systolic blood pressure, diastolic blood pressure, metabolic syndrome, endometriosis, ovarian cancer, endometrial cancer, breast cancer, depression, asthma, death from total cardiovascular disease, death from ischemic heart disease, death from stroke and death from all causes. Previous meta-analysis studies concluded that there was a lack of association between the examined outcome and early menarche for three of the 21 outcomes (death from ischemic heart disease, stroke and total cardiovascular disease). These associations were not identified even after the re-analysis.
The following results are summarized in table 3 by converting the estimated risk of each outcome into a relative risk.
Evidence map of umbrella review by early menarche and subsequent health outcomes
| Certainty of evidencea | Outcome | RR (95% CI) | SMD (95% CI) | Direction |
|---|---|---|---|---|
| High (convincing evidence; Class I) | Metabolic syndrome | 1.56 (1.33, 1.83) | Positive | |
| Endometrial cancer | 1.40 (1.17, 1.68) | Positive | ||
| T2DM/IGT | 1.30 (1.19, 1.42) | Positive | ||
| Breast cancerb | 1.19 (1.06, 1.33) | Positive | ||
| Death from all causes | 1.11 (1.03, 1.19) | Positive | ||
| Moderate (Highly suggestive evidence; Class II) | Obesity | 1.68 (1.53, 1.84) | Positive | |
| Gestational diabetes mellitus | 1.32 (1.09, 1.58) | Positive | ||
| Hypertension | 1.24 (1.20, 1.29) | Positive | ||
| Endometriosis | 1.22 (1.09, 1.37) | Positive | ||
| Ovarian cancer | 1.17 (1.04, 1.31) | Positive | ||
| Death from stroke | 1.05 (0.89, 1.25) | No (not significant) | ||
| Death from cardiovascular disease | 1.03 (0.82, 1.30) | No (not significant) | ||
| Serum fasting insulin (uIU/ml) | 0.52 (0.48, 0.57) | Positive | ||
| HOMA-IR | 0.27 (0.19,0.35) | Positive | ||
| Adult BMI (≥40 years) | 0.30 (0.28,0.32) | Positive | ||
| Adult BMI (<40 years) | 0.39 (0.36,0.43) | Positive | ||
| Systolic blood pressure | 0.05 (−0.08,0.17) | No (not significant) | ||
| Diastolic blood pressure | 0.01 (−0.10, 0.13) | No (not significant) | ||
| Low (suggestive evidence; Class III) | Death from ischemic heart disease | 1.19 (0.87, 1.63) | No (not significant) | |
| Asthma | 1.27 (1.08, 1.48) | Positive | ||
| Very low (weak evidence, Class IV) | Depression | 1.26 (0.75, 2.11) | No (not significant) |
BMI, body mass index; HOMA-IR, homeostatic model assessment for insulin resistance; IGT, impaired glucose tolerance; RR, relative risk; SMD, standard mean difference; T2DM, type 2 diabetes mellitus.
In accordance with previous umbrella reviews, we categorized the strength of the evidence.
This meta-analysis was performed at the individual level. We cannot calculate the Hartung–Knapp–Sidik–Jonkman method.
Obesity and BMI
Early menarche was associated with a 68% increased risk of obesity (RR 1.68, 95% CI 1.53, 1.84) and BMI (aSMD 0.30, 95% CI 0.28, 0.32 in adults ≥ 40 years of age; 0.39, 95% CI 0.36, 0.43 in adults <40 years of age, respectively).
Type 2 diabetes mellitus/impaired glucose tolerance, gestational diabetes mellitus, HOMA-IR and serum fasting insulin levels
Early menarche was consistently associated with a higher risk of disturbance in glucose metabolism. The risk of type 2 diabetes mellitus/impaired glucose tolerance in women with early menarche is 30% (RR 1.30, 95% CI 1.19, 1.42) higher when compared to the risk of type 2 diabetes mellitus/impaired glucose tolerance in women with late menarche. The risk of gestational diabetes mellitus is 32% (RR 1.32, 95% CI 1.09, 1.58) higher in women with early menarche when compared to the risk of gestational diabetes mellitus in women with late menarche.
Compared to women with average menarche, serum fasting insulin level (log) and HOMA-IR (log) were higher in women with early menarche (aSMD 0.52, 95% 0.48, 0.57; 0.27, 95% 0.19, 0.35, respectively).
Hypertension, systolic blood pressure and diastolic pressure
Early menarche was associated with a 24% higher risk (RR 1.24, 95% CI 1.20, 1.29) of hypertension compared to late menarche. However, early menarche was not associated with increased systolic (SMD 0.05, 95% CI −0.08, 0.17) or diastolic blood pressure (SMD 0.01, 95% CI −0.10, 0.13), respectively.
Metabolic syndrome
Compared to late menarche, early menarche was associated with a 56% higher risk (RR 1.56, 95% CI 1.33, 1.83) of metabolic syndrome.
Endometriosis
Compared to late menarche, early menarche was associated with a 22% higher risk of endometriosis (RR 1.22, 95% CI 1.09, 1.37).
Ovarian cancer, endometrial cancer, and breast cancer
Early menarche was associated with a higher risk of malignancy when compared to late menarche, as follows: ovarian cancer, RR 1.17, 95% CI 1.04, 1.31; endometrial cancer, RR 1.40, 95% CI 1.17, 1.68; and breast cancer, RR 1.19, 95% CI 1.06, 1.33 (re-analyzed using DL method).
Asthma
Early menarche was associated with a 27% increased risk of asthma menarche, (RR 1.27, 95% CI 1.08, 1.48) when compared to late menarche.
Death from all causes, death from ischemic heart disease, death from stroke and death from total cardiovascular disease
Early menarche was associated with an 11% higher risk (RR 1.11, 95% CI 1.03, 1.19) of death from all causes when compared with average menarche. However, there was no statistically significant association between death from ischemic heart disease, stroke and total cardiovascular disease.
Depression
There is consistency in the association between depression and early menarche. There is a lack of significant association between early menarche and depression (RR 1.26, 95% CI 0.75, 2.11).
AMSTAR 2, GRADE classification, heterogeneity, publications bias and population attributable fractions of included studies
There was no ‘high’ or ‘very low’ rating for AMSTAR 2, and the most common flaw was that the authors did not provide a list of excluded studies as well as a justification for their exclusion (Supplementary Text and Supplementary Table S3). Supplementary Table S4 shows a breakdown of GRADE scores for each study (high certainty, 25.0%; moderate certainty, 60.0%; low certainty, 10.0%; very low certainty, 4.8%), and we summarized several outcomes in Table 3 according to the certainty of evidence. Except for four outcomes (death from total cardiovascular disease, HOMA-IR, serum fasting insulin level and depression), the shape of the p-curve was significantly right-skewed (P < 0.05), indicating no evidence of p-hacking.
When we re-analyzed 21 outcomes by random effects, we found that nine (42.9%) of the 21 meta-analyses that we re-analyzed had significant heterogeneity (I2 > 50%). Four (19.0%) of the 21 meta-analyses had significant heterogeneity (I2 > 75%). One study, an individual meta-analysis, could not be re-analyzed using the Hartung–Knapp–Sidik–Jonkman method and because of heterogeneity (Table 2). We found statistical evidence of publication bias in 14.3% of the cases when we used Egger's regression test. The highest population—fraction, assuming causality between early menarche and outcome, was 8.84% (95% CI 6.80, 10.95) of obesity for early menarche vs. non-menarche. However, this may be over-estimated because the population-attributable fractions were calculated using data that did not account for confounders.
Discussion
Principal findings
The primary aim of our study was to summarize the quality of evidence of the associations between early menarche and long-term health outcomes in women and to evaluate the strength and validity of these associations. This umbrella review found a significant association between early menarche and an increased risk of metabolic syndrome (high), endometrial cancer (high), type 2 diabetes mellitus/impaired glucose tolerance (high), breast cancer (high), death from other causes (high), obesity (moderate), gestational diabetes mellitus (moderate), hypertension (moderate), endometriosis (moderate), ovarian cancer (moderate) and asthma (low). Furthermore, early menarche was associated with increased fasting insulin level (moderate), adult BMI (moderate), and HOMA-IR (moderate), respectively. However, deaths from stroke, total cardiovascular disease, ischemic heart disease, systolic blood pressure and diastolic blood pressure were found to have no significant associations with early menarche (moderate to low GRADE evidence).
Using the AMSTAR 2 quality appraisal instrument, some reviews were rated as low quality. However, none of the reviews was rated as high quality. Inadequate reporting by review authors, particularly item 10 (failure to provide a list of excluded studies), rather than flaws in the review methods, may have resulted in an inadvertent reduction in the review's quality.
Biological plausibility
Pubertal development is initiated by the pulsatile secretion of gonadotropin-releasing hormone (GnRH).1 Although genetic factors are the main determinants of pubertal timing, prenatal and postnatal environmental factors such as birth status (small for gestational age or preterm), childhood obesity, exposure to endocrine-disrupting chemicals or nutritional factors also play roles in the activation of the hypothalamus–pituitary–gonadal axis.26 The mechanisms by which menarche timing contributes to adverse health outcomes later in life are unknown; however, there are risk factors involved in both early menarche and cardio-metabolic disorders and estrogen-dependent cancers. Therefore, we should be cautious about the interpretations of these associations unless the confounding has been properly adjusted.
There are possible confounders contributing to both early menarche and each outcome. First, several genes involved in the determination of pubertal timing may play important roles in metabolic regulation such as glucose homeostasis or adipogenesis.27–29 For example, kisspeptin, induced by KISS1 (upstream regulators integrating both central and peripheral signals with GnRH release from the hypothalamus30) also modulates glucose-stimulated insulin secretion.31,DLK1, another causative gene for central precocious puberty, is also a molecular gatekeeper of adipogenesis;32 mutation of DLK1 has been associated with rapid weight gain, abnormal lipid metabolism and fatty liver in mice.33 The overlap of genetic loci involved in pubertal timing and obesity has been reported.34 Therefore, similar genetic factors may lead to a shared effect on both early menarche and obesity.
Secondly, the central ceramide signaling pathway has recently been proposed to mediate obesity-induced precocious puberty via hypothalamic accumulation.35 Ceramide, a lipid-signaling molecule, also plays a variety of metabolic roles, such as central leptin or ghrelin actions.36,37 However, the accumulation of ceramide in many tissues such as the blood vessels and heart may lead to cardio-metabolic disease.38 Therefore, the ceramide pathway may serve as a mediator between obesity, early menarche and long-term adverse health outcomes.
Thirdly, early exposure to endocrine-disrupting chemicals has been proposed as a risk factor for early pubertal development and menarche, and there is a growing evidence showing its effects on adult health outcomes such as metabolic dysfunction, cancer risk or cognitive deficits.39–41 In other words, endocrine-disrupting chemicals, when exposed through sustained behavior and cumulative environmental factors, can cause early menarche, which may increase and independently lead the risk of various health problems in adults.
Finally, as estrogen is known to have various effects on several parts of the body, including the brain, adipose tissue, breast, endometrium and endothelium by mediating different estrogen receptors,11 early-life estrogen exposure caused by early menarche may contribute to the development of several estrogen-related cancers such as breast cancer, endometrial cancer, ovarian cancer and metabolic disorders.42,43
Comparison of findings from previous studies
The main findings in this study (metabolic disease and cancer) were comparable to the findings of a previous meta-analysis.15 In contrast to a previous meta-analysis and previous proof-of-concept study,44 early menarche was not associated with an increased risk of depression when re-analyzed using our sophisticated statistical techniques such as the Hartung–Knapp–Sidik–Jonkman method, p-curve and GRADE system. The original meta-analysis on depression was limited by a small number of samples (included three studies), high heterogeneity (54.6%) and a ‘very low’ GRADE. Although several epidemiologic studies have shown that girls with early menarche are more likely to experience mental health problems such as internalizing problems (depression, excessive psychosomatic symptoms, bulimia and anxiety) and externalizing problems (bullying, smoking, substance abuse and truancy) because they more vulnerable to negative peer influences,44,45 a previous study found no statistically significant differences in the odds of depressive symptoms between early, late or normal menarche groups.46 We found significant associations between early menarche and asthma as an outcome, as in the original meta-analysis; however, high heterogeneity resulted in a low GRADE of evidence. Therefore, we believe that more long-term and well-designed research on neuropsychiatric disorders and asthma is needed.
Also, there are slight differences in the numbers overall. First of all, the statistical method we applied is different from the original meta-analysis articles, there is a difference in rounding the decimal point, and it is thought that the difference occurred because there were cases in which a few meta-analysis articles made a mistake in numerical input when running statistics.
Policy implication
In this study, we found significant associations between early menarche and long-term health outcomes, ranging from metabolic disorders and female-specific cancers to all-cause mortality. Although the causal relationship is uncertain because the underlying mechanism involves shared risk factors such as obesity or exposure to endocrine-disrupting chemicals, early menarche can be an important indicator of various adulthood health outcomes when managing patients. Adolescents who experience early menarche may have underlying genetic or environmental risk factors for developing subsequent adverse health outcomes and can be a potential target for intervention. Multidisciplinary approaches are required, and early menarche should be addressed by all doctors, including endocrinologists, cardiologists, gynecologists, psychiatrists and family medicine doctors, as well as members of society, such as nutritionists and educators. Physicians should be aware of the clinical significance of early menarche and pay special attention to this group for active monitoring and management of concomitant cardio-metabolic risk factors. Finally, more research into the risk factors for early menarche, and a larger, long-term between the association of early menarche and long-term health outcomes is needed to provide policymakers with a multifaceted solution for what are considered risk factors for early menarche.
Strengths and weaknesses and in relation to other studies
The strength of this review is that it systematically includes all published evidence meets predefined criteria from inception up to 2021 a systematic and transparent search of the literature and is the first umbrella review of the association between early menarche and long-term health outcomes in women. We also evaluated the methodological quality and evidence level using a variety of validated tools and sophisticated statistical techniques (GRADE system, AMSTAR grade, p-curve, Hartung–Knapp–Sidik–Jonkman statistical model and 95% PI). Furthermore, uncertain relationship of early menarche with neuropsychiatric disorders was identified, and relevant associations and directions on early menarche with long-term adverse health adverse outcomes such as all-cause death, metabolic-related disorders and female-specific specific cancers.
There are some limitations to this study. First, based on the underlying mechanism, obesity and its related epidemiologic, environmental and genetic factors are likely to mediate or affect the relationship between early menarche and later health outcomes; therefore, these factors may lead to over-estimation and misinterpretation of effect sizes. Although we used GRADE scoring to assess whether corrections were made for factors that could affect both long-term health outcomes and early menarche, future studies (well-designed or Mendelian randomized trials) are required for a more accurate estimate of effect sizes. A more detailed environment-wide association study can also provide evidence to uncover the uncertainty of the environmental mechanisms involved in complex traits. Second, some primary studies included in our meta-analyses were based on information from adult retrospective recall, and these results may provide suboptimal estimates of effect sizes. As a result, future prospective studies are needed, and official register data can help reduce retrospective recall bias. Thirdly, with the exclusion of outcomes such as testicular cancer,47 multiple sclerosis,48 sexual and reproductive health,49 and vasomotor menopausal symptoms,50 re-analysis and further research on the aforementioned outcomes (depression, death from ischemic heart disease, stroke or total cardiovascular disease) are needed. Furthermore, our findings revealed non-significant directions for depression, implying that more research on the relationship between depression and early menarche is needed, and it is also necessary to study whether there is a relationship between early menarche and other neuropsychiatric and behavior problems besides depression.
Conclusions and recommendations
We found that early menarche was associated with an increased risk of metabolic derangement (type 2 diabetes mellitus/impaired glucose tolerance, gestational diabetes mellitus, obesity, increased adult BMI, metabolic syndrome, insulin resistance, hyperinsulinemia and hypertension), sex-specific disorders (endometrial cancer, breast cancer, endometriosis and ovarian cancer), chronic respiratory diseases (asthma) and all-cause death. In particular, early menarche was linked to metabolic syndrome, endometrial cancer, type 2 diabetes mellitus/impaired glucose tolerance, breast cancer and all-cause mortality.
Early menarche can be a potential indicator of long-term health outcomes, and physicians should be aware of its clinical significance. Our findings suggest that all physicians, particularly pediatricians, should be on the lookout for problems associated with early menarche and take appropriate action to prevent their consequences. We hope that this review will assist all physicians in fully comprehending the lifestyle health issues associated with early menarche and in participating in the prevention of early menarche and its complications.
Supplementary material
Supplementary material is available at QJMED online.
Author contributions
D.K.Y. had full access to all of the data in the study and took responsibility for the integrity of the data and the accuracy of the data analysis. D.K.Y. and Y.J.L. were contributed equally. All authors approved the final version before submission. Study concept and design: J.L. and D.K.Y.; Acquisition, analysis or interpretation of data: J.L. and D.K.Y.; Drafting of the manuscript: S.L. and D.K.Y.; Critical revision of the manuscript for important intellectual content: J.L., Y.A.L., C.H.S., D.I.S., D.K.Y. and Y.J.L.; Statistical analysis: D.K.Y.; Study supervision: D.K.Y. D.K.Y. is guarantor. The corresponding authors (D.K.Y. and Y.J.L.) attest that all listed authors meet authorship criteria and that no others meeting the criteria have been omitted.
Conflict of interest: None declared.
