


Summary
The association between dietary thiamine intake and the risk of diabetes remains unknown.
We aimed to evaluate the relation of dietary thiamine intake with new-onset diabetes and examine possible effect modifiers.
Prospective cohort study.
A total of 16 272 participants who were free of diabetes at baseline were enrolled from China Health and Nutrition Survey (CHNS). Dietary nutrients intake information was collected by 3-day dietary recalls in addition to using a 3-day food-weighed method to assess cooking oil and condiment consumption. New-onset diabetes was defined as a fasting blood glucose ≥7.0 mmol/l or a glycated haemoglobin (HbA1c) ≥6.5% (48 mmol/mol) or diagnosed by a physician during the follow-up.
During a median follow-up duration of 9.0 years, new-onset diabetes occurred in 1101 participants. Overall, the association between dietary thiamine intake and new-onset diabetes followed a U-shape (P for non-linearity <0.001). Consistently, when thiamine intake was assessed as quartiles, compared with those in the 2–3 quartiles (0.75 to 1.10 mg/day), the significantly higher risks of new-onset diabetes were found in participants in the first quartile [adjusted hazard ratio (HR), 1.33; 95% confidence interval (CI): 1.10, 1.61] and the fourth quartile (adjusted HR, 1.39; 95% CI: 1.17, 1.67). Similar results were found when further adjusting for the intake of other major nutrients or food groups; or using the propensity score weighting to control the imbalance of covariates.
Our results suggested that there was a U-shape association between dietary thiamine intake and new-onset diabetes in general Chinese adults, with a minimal risk at 0.75–1.10 mg/day.
Introduction
Diabetes is one of the most common non-communicable diseases, which can cause multiple serious complications and increase the risk of premature death.1 According to the estimates of International Diabetes Federation (IDF), in 2019, there were 463 million adults living with diabetes worldwide, and the number was estimated to reach 700 million by 2045.2 As such, it is necessary to identify more risk factors and adopt effective primary prevention strategies to reduce the burden of diabetes. Recently, the associations between nutrients intake and diabetes have raised great attention.3
Thiamine (vitamin B1) is a water-soluble vitamin, and it is important for both endocrine and exocrine functions of the pancreas.4 Thiamine deficiency had been reported to be related to a marked impairment in insulin synthesis and secretion.5 Accordingly, some cross-sectional studies had found that patients with diabetes had lower plasma thiamine concentrations,6 and thiamine intake levels7 were inversely associated with the prevalence of diabetes. However, a previous population-based ecological study8 showed that the prevalence of diabetes increased in parallel with the increase in thiamine consumption among US adults. Of note, both the cross-sectional and ecological designs of these studies prevented the evaluation of causality between thiamine intake and diabetes. Nevertheless, few previous prospective studies had investigated the relation of thiamine intake with the risk of diabetes. As such, to date, the association between thiamine intake and new-onset diabetes remains unknown.
To address the above important gaps in knowledge, our present study aimed to evaluate the prospective relation of dietary thiamine intake with new-onset diabetes, and examine possible effect modifiers, using data from China Health and Nutrition Survey (CHNS), a national health and nutrition survey in China.
Methods
The institutional review boards of the University of North Carolina at Chapel Hill and the National Institute of Nutrition and Food Safety, and Chinese Center for Disease Control and Prevention, approved the study. Each CHNS participant provided their written informed consent. The data, and study materials that support the findings of this study can be found from the CHNS official website (http://www.cpc.unc.edu/projects/china).
Population and study design
Details of the study design, sampling methods and response rates of the CHNS have been described elsewhere.9–11 Briefly, CHNS is an ongoing multipurpose longitudinal open cohort study initiated in 1989, and has been followed up every 2–4 years. A multistage, random cluster approach was used to draw the sample from nine provinces [Heilongjiang (enrolled in 1997), Liaoning, Shandong, Henan, Jiangsu, Hubei, Hunan, Guizhou and Guangxi (from north to south)] and three largest autonomous cities (enrolled in 2011, Beijing, Shanghai and Chongqing). By 2011, the provinces included in the CHNS constituted 47% of China’s population.10 The CHNS rounds have been completed in 1989, 1991, 1993, 1997, 2000, 2004, 2006, 2009, 2011 and 2015.
We conducted a prospective cohort based on seven rounds of CHNS data from 1997 to 2015. We first excluded participants who were pregnant, <18 years of age, or with missing data about diabetes diagnosis. Among the remaining participants, those, who were surveyed in at least two study rounds (n = 16 895), were included, and the first survey round is considered as baseline. Furthermore, participants with diabetes, or with missing dietary thiamine data or with extreme dietary energy data (male: >4200 or <600 kcal/day; female: >3600 or <500 kcal/day)12 were also excluded. Finally, a total of 16 272 participants were included in the final analysis (Supplementary Figure S1).
Dietary nutrient intakes
Dietary measurements in CHNS have been described in detail elsewhere.13–16 Briefly, both individual and household level data were collected in each survey round. Individual dietary information was collected by a trained investigator conducting a 24-h dietary recall on each of three consecutive days. The three consecutive days were randomly allocated from Monday to Sunday and were almost equally balanced across the 7 days of the week for each sampling unit. In Chinese cuisine, cooking oil and condiments are added to food during cooking and preparation. Cooking oil and condiments consumption was determined by conducting an examination of changes in household inventory for the same 3 days in combination with a weighting technique. Specifically, on each of the three consecutive days, interviewers conducted a household visit to weight and record the household food inventories, including food purchased and discarded, as well as the individual’s proportion of food consumption. We allocated proportions of cooking oil and condiments consumed at the household level to each individual based on the consumption proportion. Nutrient intakes were calculated using the China food composition tables. The accuracy of 24-h dietary recall designed to assess energy and nutrient intake has been validated.17
In the analyses, 3-day average intakes of dietary macronutrients and micronutrients in each round were calculated. Moreover, we defined an average nutrient intake to represent a long-term nutrients status of each participant and minimize within person variation. The average of each nutrient intake was calculated for each participant using all results up to the last visit prior to the date of new-onset diabetes, or using all results among those without new-onset diabetes.
Blood pressure and covariate measurements
After the participants had rested for 5 min, seated blood pressure was measured by trained research staff using a mercury manometer, following a standard method. Triplicate measurements on the same arm were taken in a quiet and bright room. The mean systolic blood pressure (SBP) and diastolic blood pressure (DBP) of the three independent measures were used in analysis.
Demographic and lifestyle information was obtained through questionnaires, including age, sex, smoking, alcohol drinking, occupations, education levels, urban or rural residents, regions and concomitant diseases at each follow-up survey. Height and weight were measured following a standard procedure with calibrated equipment. Body mass index (BMI) was calculated as weight (kg) by height squared (m2). Physical activity was collected by staff-administered questionnaires exploring all occupational, transportation, domestic and leisure activities in adults.
Study outcome
The study outcome was new-onset diabetes, which was defined according to the answer (‘yes’ or ‘no’) of a question ‘has a doctor ever told you that you suffer from diabetes?’ in each follow-up. Moreover, blood samples were collected and assayed only in 2009. Therefore, in 2009, we included fasting blood glucose ≥7.0 mmol/l or glycated haemoglobin (HbA1c) ≥6.5% (48 mmol/mol) as an additional criterion for outcome definition.18,19
When a participant was first identified with new-onset diabetes in a following survey, the middle date between this and the nearest survey before was used to calculate the follow-up time. For those free of diabetes in all following surveys, the last survey date was used to calculate the follow-up time.
Statistical analysis
Population characteristics were presented as mean ± standard deviation (SD) for continuous variables and proportions for categorical variables. Differences in population characteristics by dietary thiamine intake quartiles were compared using ANOVA tests, or chi-square tests, accordingly.
A restricted cubic spline function with three knots (25, 50 and 75 percentiles) was applied to display the relation of dietary thiamine intake with new-onset diabetes. The risk of new-onset diabetes with thiamine intake were estimated using Cox proportional hazards models [hazards ratio (HR) and 95% confidence interval (95% CI)] without and with adjustments for age, sex, survey year, BMI, smoking, alcohol drinking, SBP, DBP, antihypertensive drugs, education levels, urban or rural residents, regions, occupations, physical activity, as well as intakes of fat, protein, carbohydrate, fibre, sodium and potassium. Possible modifications of the association between dietary thiamine intake and new-onset diabetes were evaluated by stratified analyses and interaction testing. Moreover, propensity score weighting Cox model was applied to control the impact of covariate imbalance in thiamine intake groups. Multinomial propensity scores were estimated by applying generalized boosted machine-learning models,20 the specific calculation process was carried out by R package ‘twang’.21 After weighting, the standardized mean differences of covariates <0.2 were consider to be balance.22 In addition, multiple imputation with multivariate imputation by chained equation was used for handling the missing values in covariates. Then, using the complete data, a sensitivity analysis of dietary thiamine on new-onset diabetes was also performed.
A two-side P < 0.05 was considered to be statistically significant in all analysis. All statistical analyses were performed using R version 3.6.3.
Results
Characteristics of the study participants
A total of 16 272 participants were included in this study (Supplementary Figure S1). The mean age was 43.1 (SD: 15.3) years and the average dietary thiamine intake was 0.95 (SD: 0.33) mg/day.
As shown in Table 1, participants with higher dietary intake thiamine tended to be younger; had lower BMI, SBP and education levels, lower percentages of females, antihypertensive drugs usage and urban residents, and higher physical activity levels, higher percentages of smokers, alcohol drinkers and farmers, as well as higher intakes of energy, carbohydrate, protein, fat, fibre, sodium and potassium.
Population characteristics by quartiles of thiamine intakea
| Quartiles of thiamine, mg/day | P-value | ||||
|---|---|---|---|---|---|
| Q1 (<0.75) | Q2 (0.75 to 0.92) | Q3 (0.92 to 1.10) | Q4 (≥1.10) | ||
| N | 4068 | 4068 | 4068 | 4068 | |
| Age, years | 47.6 ± 17.1 | 43.7 ± 15.0 | 41.2 ± 14.0 | 40.0 ± 13.8 | <0.001 |
| Female | 2762 (67.9) | 2366 (58.2) | 1897 (46.6) | 1298 (31.9) | <0.001 |
| BMI, kg/m2 | 23.0 ± 3.5 | 22.8 ± 3.3 | 22.7 ± 3.3 | 22.8 ± 3.2 | 0.001 |
| Smoking | 898 (22.1) | 1107 (27.3) | 1356 (33.5) | 1738 (42.8) | <0.001 |
| Alcohol drinking | 1022 (25.3) | 1262 (31.4) | 1551 (38.6) | 1911 (47.7) | <0.001 |
| SBP, mmHg | 121.7 ± 18.7 | 119.4 ± 17.8 | 118.5 ± 16.8 | 119.1 ± 15.4 | <0.001 |
| DBP, mmHg | 77.7 ± 10.8 | 77.5 ± 11.0 | 77.3 ± 10.7 | 77.7 ± 10.4 | 0.374 |
| Antihypertensive drugs | 336 (8.3) | 208 (5.1) | 168 (4.1) | 137 (3.4) | <0.001 |
| Education | <0.001 | ||||
| Illiteracy | 1017 (25.5) | 874 (22.0) | 702 (17.6) | 648 (16.3) | |
| Primary school | 655 (16.4) | 804 (20.3) | 861 (21.5) | 780 (19.6) | |
| Middle school | 1036 (26.0) | 1210 (30.5) | 1384 (34.6) | 1467 (36.9) | |
| High school or above | 1280 (32.1) | 1080 (27.2) | 1051 (26.3) | 1079 (27.2) | |
| Urban residents | 1880 (46.2) | 1573 (38.7) | 1425 (35.0) | 1268 (31.2) | <0.001 |
| Region | <0.001 | ||||
| Central | 1912 (47.0) | 1705 (41.9) | 1819 (44.7) | 2394 (58.8) | |
| North | 1187 (29.2) | 936 (23.0) | 759 (18.7) | 603 (14.8) | |
| South | 969 (23.8) | 1427 (35.1) | 1490 (36.6) | 1071 (26.3) | |
| Occupations | <0.001 | ||||
| Farmer | 851 (21.1) | 1305 (32.4) | 1488 (37.0) | 1687 (41.9) | |
| Worker | 382 (9.5) | 476 (11.8) | 499 (12.4) | 539 (13.4) | |
| Inoccupation | 1659 (41.0) | 1198 (29.8) | 950 (23.6) | 784 (19.5) | |
| Other | 1150 (28.5) | 1044 (26.0) | 1088 (27.0) | 1020 (25.3) | |
| PA, MET-h/week | 134.5 ± 123.1 | 154.9 ± 127.2 | 162.8 ± 134.4 | 162.9 ± 135.9 | <0.001 |
| Dietary intake | |||||
| Energy, kcal/day | 1633.6 ± 367.3 | 2041.1 ± 312.2 | 2280.6 ± 346.5 | 2590.0 ± 454.0 | <0.001 |
| Carbohydrate, g/day | 214.2 ± 66.3 | 285.6 ± 63.8 | 323.0 ± 69.9 | 380.1 ± 94.9 | <0.001 |
| Protein, g/day | 49.6 ± 14.0 | 62.0 ± 12.3 | 69.8 ± 12.7 | 82.3 ± 17.3 | <0.001 |
| Fat, g/day | 64.3 ± 26.2 | 72.3 ± 23.9 | 78.8 ± 26.7 | 82.3 ± 32.4 | <0.001 |
| Fibre, g/day | 7.5 ± 4.3 | 9.6 ± 4.5 | 11.0 ± 5.0 | 14.1 ± 6.2 | <0.001 |
| Na, g/day | 4.8 ± 3.0 | 4.9 ± 2.7 | 5.1 ± 2.7 | 5.5 ± 3.0 | <0.001 |
| K, g/day | 1.3 ± 0.4 | 1.6 ± 0.4 | 1.7 ± 0.4 | 2.0 ± 0.6 | <0.001 |
For continuous variables, values are presented as mean±SD, for categorical variables, values are present as N (%).
PA, physical activity; SBP, systolic blood pressure; DBP, diastolic blood pressure; BMI, body mass index; Na, sodium; K, potassium.
Association of dietary thiamine intake with new-onset diabetes
During a median follow-up duration of 9.0 years (interquartile range, 4.1–15.1 years), new-onset diabetes occurred in 1101 (6.8%) participants.
Overall, the association between dietary thiamine intake (mg/day or mg/1000 kcal) and new-onset diabetes followed U-shapes (both P-values for non-linearity <0.001) (Figure 1). Accordingly, when dietary thiamine intake (mg/day) was assessed as quartiles, compared with those in the second quartile of thiamine intake (0.75 to 0.92 mg/day), the adjusted HRs (95% CI), with adjustments for age, sex, survey year, BMI, smoking, alcohol drinking, SBP, DBP, antihypertensive medications, education levels, urban or rural residents, regions, occupations, physical activity, as well as intakes of fat, protein, carbohydrate, fibre, sodium and potassium, were 1.32 (1.08, 1.62), 0.98 (0.81, 1.20) and 1.38 (1.11, 1.71), respectively, in participants in the first quartile, third quartile and fourth quartile. Considering the similar risk for new-onset diabetes, we combined the second and the third quartile of thiamine intake into one group (the 2–3 quartiles, 0.75 to 1.10 mg/day). As expected, compared with those in the 2–3 quartiles, significantly higher risks of new-onset diabetes were found in participants in the first quartile (adjusted HR, 1.33; 95% CI: 1.10, 1.61) and the fourth quartile (adjusted HR, 1.39; 95% CI: 1.17, 1.67) of thiamine intake (Table 2). Consistently, when thiamine intake was expressed as mg/1000 kcal (energy density form), the lowest risk of new-onset diabetes was found in those with thiamine intake 0.37–0.45 mg/1000 kcal (the 2–3 quintiles) (Supplementary Table S1).
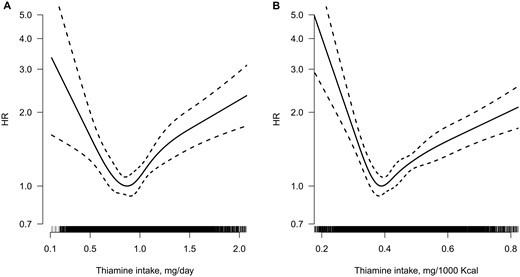
Smoothing curve for the relationship between absolute thiamine intake expressed as mg/day (A) and thiamine intake expressed as mg/1000 kcal (B) with new-onset-diabetes.a aAdjusted for age, sex, survey year, body mass index, smoking, alcohol drinking, systolic blood pressure, diastolic blood pressure, antihypertensive drugs, education levels, urban or rural residents, regions, occupations, physical activity and dietary intakes of sodium, potassium, fibre, carbohydrate, protein and fat.
The association of new-onset diabetes with thiamine intakea
| Thiamine intake, mg/day | Events (incidence) | Crude | Adjusted | |
|---|---|---|---|---|
| HR (95% CI) | HR (95% CI) | P-value | ||
| Quartiles | ||||
| Q1 (<0.75) | 251 (8.4) | 1.51 (1.27, 1.81) | 1.32 (1.08, 1.62) | 0.007 |
| Q2 (0.75 to 0.92) | 245 (5.9) | Ref | Ref | |
| Q3 (0.92 to 1.10) | 259 (5.8) | 0.98 (0.82, 1.16) | 0.98 (0.81, 1.20) | 0.866 |
| Q4 (≥1.10) | 346 (8.1) | 1.38 (1.17, 1.62) | 1.38 (1.11, 1.71) | 0.004 |
| Categorical | ||||
| Q1 (<0.75) | 251 (8.4) | 1.53 (1.32, 1.78) | 1.33 (1.10, 1.61) | 0.003 |
| Q2–3 (0.75 to 1.10) | 504 (5.9) | Ref | Ref | |
| Q4 (≥1.10) | 346 (8.1) | 1.39 (1.22, 1.60) | 1.39 (1.17, 1.67) | <0.001 |
Adjusted for age, sex, survey year, body mass index, smoking, alcohol drinking, systolic blood pressure, diastolic blood pressure, antihypertensive drugs, education levels, urban or rural residents, regions, occupations, physical activity and dietary intakes of sodium, potassium, fibre, carbohydrate, protein and fat.
Incidence: number of new-onset diabetes per 1000 person-years.
Similar trends were found in models with further adjustments for dietary intakes of riboflavin, niacin, zinc, copper, magnesium and selenium (Supplementary Table S2), or further adjustments for the intakes of nuts, vegetables, fruits, whole gain, refined gain and red meats (Supplementary Table S3). Moreover, defining new-onset diabetes based only on the diagnosis of physicians (Supplementary Table S4) or handling missing data by multiple imputation also did not materially alter our results (Supplementary Table S5).
Propensity score weighting to control the imbalance of covariates
After propensity score weighting, the imbalances of other covariates were greatly improved (Supplementary Figure S2). Although there are still two variables that not achieve the balance, but the standardized mean differences (carbohydrate: 0.30 and protein: 0.22) were just slightly above the balance threshold of 0.2 (Supplementary Table S6). In the following propensity score weighting Cox models without or with adjustment covariates, thiamine and diabetes still showed a significant U-shaped association. Comparing with the 2–3 quartiles of thiamine intake, the adjusted HRs were 1.59 (95% CI: 1.01, 2.52) in the first quartile and 1.58 (95% CI: 1.18, 2.11) in the fourth quartile (Table 3).
Propensity score weighting Cox models to control the impact of covariate imbalance in thiamine intake groupsa
| Thiamine intake, mg/day | Events (incidence) | Crude | Adjusted | |
|---|---|---|---|---|
| HR (95% CI) | HR (95% CI) | P-value | ||
| Q1 (<0.75) | 369 (8.9) | 1.54 (0.99, 2.39) | 1.59 (1.01, 2.52) | 0.046 |
| Q2–3 (0.75 to 1.10) | 504 (5.9) | Ref | Ref | |
| Q4 (≥1.10) | 502 (8.5) | 1.48 (1.16, 1.88) | 1.58 (1.18, 2.11) | 0.002 |
Adjusted for age, sex, survey year, body mass index, smoking, alcohol drinking, systolic blood pressure, diastolic blood pressure, antihypertensive drugs, education levels, urban or rural residents, regions, occupations, physical activity and dietary intakes of sodium, potassium, fibre, carbohydrate, protein and fat.
Incidence: number of new-onset diabetes per 1000 person-years.
Stratified analyses by potential effect modifiers
Stratified analyses were performed to assess the association between dietary thiamine intake (the first quartile vs. the 2–3 quartiles vs. the fourth quartile) and the risk of new-onset diabetes in various subgroups.
None of the variables, including sex, age, SBP, BMI, smoking, alcohol drinking and the intake of fat, protein and carbohydrate significantly modified the association between dietary thiamine intake and new-onset diabetes. Although the P-values for interactions for urban residents and fibre intake were lower than 0.05, these results may not have significant clinical implications given multiple testing and similar directionally of the associations (Figure 2).
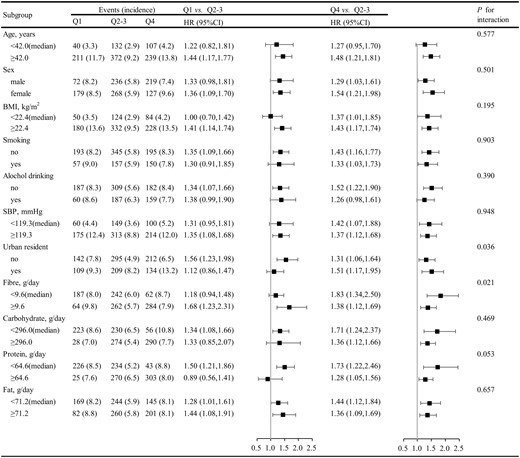
Subgroup analyses for the association between thiamine intake and new-onset diabetes.a aAdjusted, if not stratified, for age, sex, survey year, body mass index, smoking, alcohol drinking, systolic blood pressure, diastolic blood pressure, antihypertensive drugs, education levels, urban or rural residents, regions, occupations, physical activity and dietary intakes of sodium, potassium, fibre, carbohydrate, protein and fat.
Discussion
In this relatively large-scale, national, prospective study among general Chinese, we found for the first time that there was a U-shaped association between dietary thiamine intake and new-onset diabetes, with the minimal risk at 0.75–1.10 mg/day (the 2–3 quartiles) of dietary thiamine intake. The results of U-shaped association were robust in subgroup analyses or a series of sensitivity analyses, including using propensity score weighting to balance other covariates between groups, and the further adjustments of other nutrients or different foods intake.
To date, only a few ecological8 or cross-sectional studies6,7 had evaluated the association between thiamine and the prevalence of diabetes, and the reported findings have been inconsistent. An ecological study in the American population revealed that the increase in the prevalence of diabetes was highly positively correlated with the increase in thiamine consumption.8 However, Thornalley et al.6 reported that low plasma thiamine concentration was prevalent in patients with diabetes. And Duc et al.7 found that inadequate thiamine intake was related to higher prevalence of diabetes. Therefore, the association between thiamine intake and the risk of new-onset diabetes remains uncertain. Our present study, a Chinese national-wide cohort, provided an opportunity to assess the dose–response relation of dietary thiamine intake and new-onset diabetes in the general population with comprehensive adjustments for a number of covariables, and a series of subgroup analyses and sensitivity analyses.
Our study provides some new insights. Overall, there was a U-shape association between dietary thiamine intake and new-onset diabetes in general Chinese adults. First, compared with those with thiamine intake of 0.75 to 1.10 mg/day, a significantly higher risk of new-onset diabetes was found in participants with lower thiamine intake. Consistently, it has been reported that thiamine intake was inversely correlated with 2-h plasma glucose concentrations in the Hoorn Study.23 Thiamine may increase insulin sensitivity by reducing the activity through the hexosamine pathway, prevent endothelial dysfunction, increase adenosine triphosphate synthesis and decrease oxidative stress.24 However, the exact mechanisms linking optimal thiamine intake and decreased risk of new-onset diabetes still need to be further investigated.
Second, compared with those with thiamine intake of 0.75 to 1.10 mg/day, a higher risk of new-onset diabetes was found in participants with higher thiamine intake. Of note, the implementation of mandatory fortification of grains had led an obvious increase in the consumption of thiamine in the USA. The mean of usual intakes of thiamine was about 1.6 mg/day in Americans in National Health and Nutrition Examination Surveys (NHANES) 2011–16.25 Accordingly, a recent ecological study in the American population found that the prevalence of diabetes increased in parallel with the increase in the consumption of thiamine.8 The possible explanations may be that high thiamine supplementation was related to increased appetite, energy intake and body weight.26 More studies are necessary to confirm our findings and further examine the underlying mechanisms.
The Recommended Dietary Allowances (RDAs) of thiamine established by US Institute of Medicine (IOM) for men and women were 1.2 and 1.1 mg/day, respectively.27 This is inconsistent with our findings. The thiamine RDAs established by IOM were mainly based on the controlled depletion–repletion study by Sauberlich.28 Of note, the energy intake (2800–3600 kcal/day) in this study28 was much higher than that in our study. And, the body size of US population is larger than Chinese. However, the RDA range of thiamine for adults with moderate physical activity established by European Food Safety Authority (EFSA) was 0.78–1.13 mg/day,29 which is consistent with the optimal range in our study. As expected, the energy intake used to calculate the EFSA RDAs were similar to our study.30 Furthermore, the thiamine RDA for IOM and EFSA were both set at 0.4 mg/1000 kcal in energy density form, it is also consistent with our findings: 0.37–0.45 mg/1000 kcal of thiamine intake (Supplementary Table S1).
Limitations of the present study should also be noted. First, although we had controlled for a number of dietary and non-dietary covariates, unmeasured and residual confounding remains possible. Second, we did not have detailed information on dietary supplement use. However, data from the 2010–12 China Nutrition and Health Surveillance (CNHS),31 a nationally representative cross-sectional study covering all 31 provinces, autonomous regions and municipalities in China, showed that only 0.71%, 0.03% and 0.21% of the Chinese population reported using nutrient supplements, multivitamins and vitamin B supplements, respectively. Due to the low supplement proportion of nutrients, especially thiamine, we speculated that our results may not be materially changed by the dietary supplement use. Third, fasting glucose and glycated haemoglobin were only available in round 2009, the incident rate of diabetes might be underestimated. Fourth, there may be a potential recall bias in dietary intake assessment using the 24-h dietary recall compare to the gold standards like 24-h food diaries. Finally, our study was conducted in Chinese living in China, whether the observed findings can be extrapolated to other populations needs further investigation. Therefore, our results should be regarded as hypothesis-generating. Further confirmation of our findings in more studies is essential.
Conclusions
Our results suggested that there was a U-shape association between dietary thiamine intake and new-onset diabetes in general Chinese adults, with a minimal risk at 0.75–1.10 mg/day. Our results emphasized the importance of maintaining the optimal dietary thiamine intake for primary prevention of diabetes in general population.
Supplementary material
Supplementary material is available at QJMED online.
Acknowledgements
This research uses data from China Health and Nutrition Survey (CHNS). We thank the National Institute for Nutrition and Health, China Center for Disease Control and Prevention, Carolina Population Center (P2C HD050924, T32 HD007168), the University of North Carolina at Chapel Hill, the NIH (R01-HD30880, DK056350, R24 HD050924, and R01-HD38700) and the NIH Fogarty International Center (D43 TW009077, D43 TW007709) for financial support for the CHNS data collection and analysis files from 1989 to 2015 and future surveys, and the China-Japan Friendship Hospital, Ministry of Health for support for CHNS 2009, Chinese National Human Genome Center at Shanghai since 2009, and Beijing Municipal Center for Disease Prevention and Control since 2011.
Authors’ contributions
C.L. and X.Q. designed the research; C.L. and X.Q. conducted the research; C.L. performed the data management and statistical analyses; C.L. and X.Q. wrote the manuscript; all authors reviewed/edited the manuscript for important intellectual content; and all authors read and approved the final manuscript.
Funding
The study was supported by the National Natural Science Foundation of China [81973133 and 81730019].
Conflict of interest: Dr. X. Qin reports grants from the National Natural Science Foundation of China [81973133 and 81730019]. No other disclosures were reported.
References
Diabetes Facts and Figures,
