


Summary
Coronavirus disease 2019 (COVID-19) has rapidly become a global pandemic. Age is an independent factor in death from the disease, and predictive models to stratify patients according to their mortality risk are needed.
To compare the laboratory parameters of the younger (≤70) and the elderly (>70) groups, and develop death prediction models for the two groups according to age stratification.
A retrospective, single-center observational study.
This study included 437 hospitalized patients with laboratory-confirmed COVID-19 from Tongji Hospital in Wuhan, China, 2020. Epidemiological information, laboratory data and outcomes were extracted from electronic medical records and compared between elderly patients and younger patients. First, recursive feature elimination (RFE) was used to select the optimal subset. Then, two random forest (RF) algorithms models were built to predict the prognoses of COVID-19 patients and identify the optimal diagnostic predictors for patients’ clinical prognoses.
Comparisons of the laboratory data of the two age groups revealed many different laboratory indicators. RFE was used to select the optimal subset for analysis, from which 11 variables were screened out for the two groups. The RF algorithm were built to predict the prognoses of COVID-19 patients based on the best subset, and the area under ROC curve (AUC) of the two groups is 0.874 (95% CI: 0.833–0.915) and 0.842 (95% CI: 0.765–0.920).
Two prediction models for COVID-19 were developed in the patients with COVID-19 based on random forest algorithm, which provides a simple tool for the early prediction of COVID-19 mortality.
Introduction
At present, the new coronavirus has become a global disease, showing a pandemic trend around the world, and has affected 200 countries.1,2 Globally, as of 11:09 am CEST, 1 June 2021, there have been 170 363 852 confirmed cases of COVID-19, including 3 546 870 deaths, reported to World Health Organization (WHO).3 The type of pneumonia caused by COVID-19 is highly infectious, and the WHO has declared the ongoing outbreak as a pandemic with a high short-term mortality rate.4 The clinical manifestations of severe acute respiratory syndrome coronavirus 2 (SARS-CoV-2) infection range between asymptomatic infection, mild symptoms, and severe illness, defined as respiratory and/or multiple organ failures and death.5 In addition, many studies have shown that age is a risk factor for death in COVID-9 patients.6–9 Due to the weak resistance of the elderly to the virus, COVID-19 represent high incidence among the elderly.10 Therefore, there may be some differences in the factors affecting death between younger and elderly patients.
An elderly group is at higher risk of severe new coronary pneumonia.11 And the mortality rate of elderly patients with new coronary pneumonia is also higher than that of young and middle-aged patients. Besides, elderly patients with new coronary pneumonia are more likely to develop serious diseases.12 A study conducted by Liu and his team found that according to the Pneumonia Severity Index, the proportion of elderly patients with grade IV and grade Vpneumonia was higher than that of younger patients.13 Given the current lack of COVID-19-specific drugs14, early identification of elderly COVID-19 patients at risk of severe pneumonia facilitates appropriate supportive care while it is essential to reduce poor prognosis in this population.
This study aimed at comparing the clinical differences between younger and elderly COVID-19 patients as well as sharing insights on the relationship between age and death in patients with COVID-19. Also, we hope to provide evidence and support in laboratory diagnosis basis for the younger group and the elderly group, respectively.
Methods
Study design and participants
We retrospectively recruited 437 laboratory-confirmed COVID-19 patients from 29 January to 26 March 2020, at Tongji Hospital of Wuhan, China. Ethical Committee of Tongji Hospital of Huazhong University of Science and Technology (No.TJ-IRB20200364) and China-Japan Union Hospital of Jilin University (No.2020032607) approved the study.
Data collection
The patients included in this study were all confirmed by nucleic acid antibody testing. Electronic medical record information was collected and extracted retrospectively, including demographic characteristics, blood, urine routine, biochemical testing, inflammatory cytokine, lymphocyte subset testing results, etc. All data were extracted by two independent researchers using a unified data collection form. The severity of the illness is graded according to the ‘Guidelines for the Diagnosis and Treatment of New Coronavirus Pneumonia (Eighth Edition)’.15 The patients were divided into two groups according to their age: patients > 70 years old as elderly group and patients ≤70 years old as younger group.
Statistical analysis
Categorical variables were presented in frequency and percentage, continuous variables with normal distribution were presented as mean ± standard deviation (SD), and those with non-normal distribution as median (interquartile range [IQR]). The proportions of categorical variables were compared using χ2 test. As for continuous variables, the mean values of continuous variables were compared when data was normally distributed, and the independent group t test was used. Otherwise, the Wilcoxon rank sum test was used. All statistics were two-tailed and a P values less than 0.05 was considered to be statistically significant. All statistical analyses were performed using SPSS software (version 22.0).
Based on the recursive feature elimination method (RFE), the variables important to the outcomes for younger group and the elderly group were selected, respectively, and 10-fold cross-validation was performed to avoid information redundancy. Then two Random Forest classification models (RF) were established to predict the mortality of COVID-19 patients. The random forest process is briefly presented as follows. Usually, the random forest model is first built by building the training set, and then the test or validation set is used to assess prediction performance. In the output part, the mean reduction precision (MDA) and the mean reduction Gini (MDG) representing the importance of the variable are then generated. According to the method of eliminating recursive characteristics, variables with lower MDA and MDG are excluded, and the remaining variables are incorporated to build a simplified training model. In this study, 70% of patients were assigned to the training dataset, and the remaining 30% were kept for random verification. The performance of the random forest model was evaluated by the receiver operating characteristic curve, and the area under the curve (AUC) was acquired. All statistical analyses were performed using R software (version 3.5.1).
Results
Demographics and clinical characteristics
As shown in Table 1, 437 patients were recruited into the study, among whom 240 were male and 197 were female. The median age of all the 437 patients was 65 years. Further, the patients were divided into two groups. By age, 298 (68.2%) patients were classified as younger (≤70 years old) subjects, and 139 (31.8%) patients were classified as elderly (> 70 years old) subjects. Besides, there were 297 cases in the non-severe group and 140 cases in the severe group based on disease severity.
Baseline characteristics and laboratory findings in the two groups
| Total | Age ≤ 70 | Age >70 | P value | |
|---|---|---|---|---|
| (n = 437) | (n = 298) | (n = 139) | ||
| Age | 0.001 | |||
| Ages, median (IQR) | 65 | 60 | 77 | |
| Minimum age | 20 | 20 | 65 | |
| Maximum age | 95 | 64 | 95 | |
| Gender | 0.023 | |||
| Female | 197 | 132 | 65 | |
| Male | 240 | 166 | 74 | |
| Death | 102 | 56 | 46 | 0.001 |
| Disease severity | <0.001 | |||
| Non-severe | 297 | 222 | 75 | |
| Severe | 140 | 76 | 64 | |
| WBC (×109/l) | 6.3 (4.8–9.9) | 6.0 (4.6–9.3) | 7.1 (5.3–10.1) | 0.010 |
| RBC (×109/l) | 4.1 (3.7–4.6) | 4.10 (3.7–4.6) | 4.04 (3.7–4.6) | 0.639 |
| Platelet (×109/l) | 202 (146–270) | 211.5 (149–280) | 184 (1135–259) | 0.401 |
| Hemoglobin (×109/l) | 126 (113–139) | 125 (112.7–138) | 126 (114–143) | 0.459 |
| Neutrophil (×109/l) | 4.56 (3.2–8.5) | 4.2 (2.7–7.3) | 5.4 (3.8–9.8) | <0.001 |
| Lymphocyte (×109/l) | 0.9 (0.6–1.4) | 1.0 (0.6–1.6) | 0.8 (0.6–1.2) | <0.001 |
| Monocyte (×109/l) | 0.5 (0.3–0.6) | 0.4 (0.3–0.6) | 0.5 (0.3–0.7) | 0.729 |
| Hematocrit (vol%) | 36.6 (33.1–40.3) | 36.9 (33.1–40.3) | 36.4 (33.1–41.4) | 0.962 |
| Glucose (mmol/l) | 6.56 (5.46–8.92) | 6.30 (5.3–8.42) | 7.06 (5.82–10.33) | 0.001 |
| ESR (mm/h) | 36 (16–62) | 34 (14–60) | 41 (20–63) | 0.079 |
| NT-proBN (pg/ml) | 377 (129–1241.5) | 254 (80.5–1090) | 633 (225–1843) | <0.001 |
| Hs-CTnT (pg/ml) | 11 (3.3–51.7) | 6.1 (2.2–32.5) | 18.35 (6.53–82.4) | <0.001 |
| Procalcitonin (μg/ml) | 0.09 (0.04–0.25) | 0.08 (0.03–0.23) | 0.12 (0.05–0.47) | 0.003 |
| ALT (U/ml) | 24 (16–41) | 26 (15–44) | 22 (16–37) | 0.154 |
| AST (U/ml) | 30 (20–46) | 28 (20–45) | 34 (20–49) | 0.107 |
| Total protein (g/l) | 67.8 (63.9–72.4) | 68.15 (63.98–72.63) | 67.5 (63.7–72.1) | 0.338 |
| Albumin (g/l) | 33.1 (29.8–36.7) | 33.5 (29.8–36.9) | 31.9 (28.9–34.9) | <0.001 |
| Globulin (g/l) | 34.49 ± 5.80 | 33.62 (±5.99) | 35.28 ± 5.50 | 0.002 |
| TBIL (μmol/l) | 10.5 (7.5–14.95) | 9.95 (7.1–14.2) | 11.8 (8.7–17.6) | <0.001 |
| DBIL (μmol/l) | 4.7 (3.2–6.8) | 4.4 (2.97–6.2) | 5.4 (3.5–8.30) | <0.001 |
| ALP (U/l) | 70 (56–91.5) | 72 (56.75–92.25) | 67 (55–91) | 0.160 |
| GGT (U/l) | 31 (20–56) | 33 (20–58) | 28 (20–51) | 0.150 |
| TCHO (mmol/l) | 3.7 (3.07–4.32) | 3.8 (3.14–4.43) | 3.58 (2.96–4.14) | 0.007 |
| LDH (U/l) | 330 (235.5–490.5) | 302.5 (223–479.25) | 363 (274–498) | 0.004 |
| K | 4.36 (3.9–4.68) | 4.36 (3.91–4.65) | 4.35 (3.85–4.81) | 0.814 |
| Na | 140.2 (137.3–142.7) | 140.3 (137.2–142.4) | 139.8 (137.3–143.6) | 0.546 |
| CL | 101.2 (98.4–103.7) | 101.2 (98.2–103.6) | 101. (98.8–104.4) | 0.205 |
| Ca | 2.13 (2.04–2.23) | 2.14 (2.04–2.24) | 2.1 (2.04–2.19) | 0.081 |
| UREA (mmol/l) | 5.4 (3.7–8.4) | 5 (3.4–7.03) | 6.9 (4.6–11.1) | <0.001 |
| Creatinine (μmol/l) | 74 (59–93) | 71 (58–88) | 84 (66–110) | <0.001 |
| Uric acid (μmol/l) | 259 (187–325) | 246.5 (179.75–320.25) | 270 (209–343) | 0.033 |
| 24 (21.6–26.05) | 24.25 (22.27–26.23) | 23.4 (19.7–25.4) | 0.001 | |
| hs-CRP (μmol/l) | 38.5 (7.2–92.8) | 27.5 (4.75–83.55) | 56 (13.3–99.6) | <0.001 |
| PT (s) | 14.2 (13.5–15.3) | 14.1 (13.5–15.1) | 14.6 (13.8–15.9) | 0.002 |
| Fibrinogen (g/l) | 4.84 (±1.79) | 4.73 (±1.74) | 4.94 (±1.82) | 0.124 |
| D-Dimer (mg/l) | 1.52 (0.6–5.9) | 1.3 (0.4–4.0) | 2.1 (1.2–7.6) | <0.001 |
| IL-2R (Pg/ml) | 740 (433–1179) | 666.5 (393.5–1063.5) | 973 (566–1376) | <0.001 |
| IL-6 (Pg/ml) | 12.3 (3.2–51.5) | 9.8 (2.28–45.43) | 25.6 (5.8–72.0) | <0.001 |
| IL-8 (Pg/ml) | 13.4 (6.2–28.4) | 12.3 (6.2–26.1) | 19.0 (6.5–42.2) | 0.012 |
| IL-10 (Pg/ml) | 5.0 (5.0–9.1) | 5.0 (5.0–8.4) | 5.0 (5.0–10.7) | 0.081 |
| TNF-α (Pg/ml) | 8.3 (5.7–12.0) | 7.5 (5.5–11.3) | 10.7 (6.7–14.4) | <0.001 |
Laboratory findings of younger and elderly patients on admission
All test results were collected from all the patients after admission. There were plenty of differences in laboratory findings between the two age groups (Table1). The results of the blood routine test showed significant differences in white blood cells (WBC, P = 0.01), neutrophils (NEU, P < 0.001) and lymphocytes (LY, P < 0.001) between the young and old groups, and the levels of these three were all higher in the elderly group. The level of glucose was different between younger and elderly groups (P = 0.001). NT-proBNP (P < 0.001) and Hs-CTnT (P < 0.001) in the two groups have significant differences that indicate a more serious heart failure in elderly group. In the aspect of renal function examination, the levels of albumin (P < 0.000), globulin (P = 0.002) and total bilirubin (P < 0.00) in elderly group were higher compared with the younger group. Also, higher levels of TCHO (P = 0.007), LDH (P = 0.004), UREA (P < 0.00), creatinine (P < 0.00), prothrombin time (P = 0.002) have been demonstrated in the elderly group. The levels of IL-2R (P < 0.00), IL-6 (P < 0.00), IL-8 (P = 0.012) and TNF-α (P < 0.00) were higher in the elderly group, which indicated that there might be a more severe inflammatory reaction. As for D-dimer level, patients in the elderly group had a significantly higher level of D-dimer.
Feature selection and random forest model construction
To select the optimal subset of clinical features, an RFE processed with 10-fold cross-validation was used to select the best subset. The RFE could eliminate the redundant and irrelative information from the COVID-19 patients and enhance the performance of the RF classification model. In the younger group, 11 variables were selected, which were LDH, NEU, FIB, PT, CA, WBC, PCT, IL-6, LY, D-dimer and IL-10 (Figure 1a). In the elderly group, 11 variables were selected, including HCO3−, LDH, AST, hs. CRP, IL-10, NEU, Hs.CTnT, TCHO, IL-2R, IL-6 and TNF-α (Figure 1b). Next, the RF classification model was used to predict the prognoses of COVID-19 patients based on the best subset of variables. Moreover, out-of-bag (OOB) error represented the generalization ability of the RF to calculate the proportion of misclassification. In Figure 2, the OOB error gradually decreased and stabilized as the forest size increased, and it finally reduced to less than 0.2 when the tree number reached 400 in the both younger group and the elderly group. As we know, the result of the RF classification model was obtained by selecting the results of the combined predictions among 500 decision trees, and the Gini index was the split criterion. RF-Gini is one of the best methods for feature ranking worldwide. The higher the Gini coefficient, the better the predictive ability of the model. As shown in Figure 3, the importances of variables that were ranked by Gini index. The final diagnostic capability of the RF classification calculations was assessed using the test group’s accuracy, which was 84.2% in younger group and 80.4% in elderly group, and the AUC of the two groups is 0.874 (95% CI: 0.833–0.915) and 0.842 (95% CI: 0.765–0.920). (Figure 4).

(a) Use RFE to select important variables for the younger group. (b) Use RFE to select important variables for the elderly group.
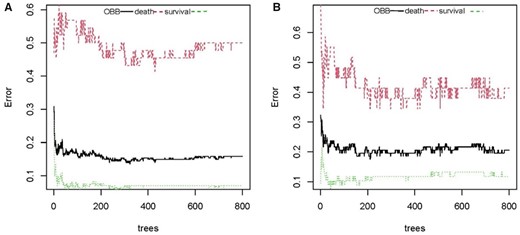
The OOB error rate to evaluate the quality of RF prediction of COVID-19 patients’ outcomes. The middle line depicts the OOB error rate of all data. The top line shows the OOB error in the subgroup of survival patients and the bottom line shows OOB error in the subgroup of dead patients. (a) younger group and (b) elderly group.
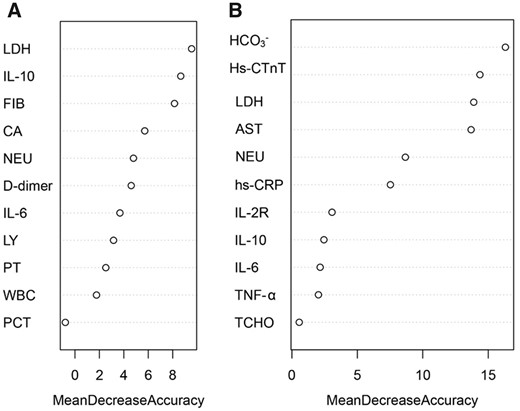
Identification of optimal diagnostic clinical characteristics for the prognoses of COVID-19 patients. Ranking of the clinical characteristics, according to Gini index. (a) younger group and (b) elderly group.
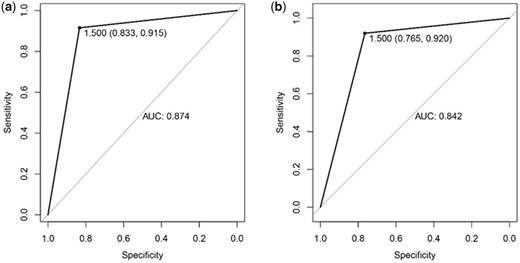
The receiver operating characteristic curves of testing samples in the younger group (a) and elderly group (b) prediction models.
Discussion
In the present study, we described the clinical characteristics as well as the risk factors related to the fatality of COVID-19 patients. The prominent features of over-70 patients in our study were distinctly increased death. The patients were divided into an over-70 group and an under-70 group. The study showed that there was a total of 298 under-70 patients with 56 deaths (18.8%) and a total of 139 over-70 patients with 46 deaths (33.1%). The results proved that SARS-CoV-2 infection caused a higher mortality rate in the elderly.16
Then for establishment of prediction models, patients with new coronary pneumonia were divided into two groups according to age, then the important clinical variables of the two age groups were selected using the recursive feature elimination method, and the Random Forest was used to sort according to the Gini coefficient. Important variables in the younger group included LDH, IL-10, fibrinogen, NEU, PT, CA and WBC. And the important variables in the elderly group are HCO3−, hypersensitivity cardiac troponin, LDH, D-dimer. It can be seen that the important variables of new coronary pneumonia patients in the younger group and the elderly group were distinct.
Among patients with new coronary pneumonia, especially those who are critically ill, acute kidney injury often occurs, resulting in a higher mortality rate.17 Severe infections can cause cytokine-mediated tissue damage and the release of LDH.18 LDH being present in lung tissue (isoenzyme 3), patients with severe COVID-19 infection release large amounts of LDH into the body circulation, as severe forms of interstitial pneumonia usually progress to acute respiratory distress syndrome, which is a hallmark of the disease. However, the contribution of different LDH isoenzymes to the increase in LDH observed in COVID-19 has not yet been determined. In addition, LDH levels increase during thrombosis and microvascular disease is often linked to kidney failure and myocardial damage.19 Several studies have shown that high level of LDH can predict a poor prognosis for hospitalized patients.20 Thus, the elevated LDH levels appear to reflect that damage and failure of multiple organs may play a greater role in the clinical outcome of patients with COVID-19 in this pathology.
Liver injury (elevated values of liver biochemical tests) is a common feature of COVID-19 associated with adverse outcomes such as intensive care unit (ICU) admission/mechanical ventilation and death.21 Liver injury in COVID-19 has been associated with some hypercoagulable parameters, and liver pathology has shown microthrombi.22 Procoagulant states are highly prevalent in COVID-19, and thrombotic complications are key causes of morbidity and mortality.23 Many patients with severe COVID-19 have coagulation abnormalities, such as diffuse intravascular coagulation (DIC) or thrombotic microangiopathy, or other systemic coagulation diseases related to serious infections.24 As previously stated, abnormal coagulation function is common in critically ill patients. Systemic microvascular thrombosis may occur in most deaths, and was confirmed by a recent autopsy.25 Elevated fibrinogen levels were believed to be associated with liver injury, and fibrinogen production from hepatocytes was amplified by crosstalk with liver sinusoidal endothelial cells following IL-6 trans-signaling.26 The clinical manifestations of coagulation dysfunction in COVID-19 patients are mainly organ dysfunction. Changes in hemostatic biomarkers represented by the increase in D-dimer and fibrin/fibrinogen degradation products indicate that the essence of coagulopathy is the formation of large amounts of fibrin.27 Compared with bacterial sepsis-related coagulopathy/DIC, prothrombin time prolonged, partial thrombin activation time prolonged, and antithrombin activity decreased in COVID-19 are less frequent, and thrombocytopenia is relatively rare.28
According to reports, D-dimer is an independent factor predicting the death of patients with new coronary pneumonia, and it has been pointed out that patients with D-dimer levels > 2 mg/l tend to have a higher mortality rate than those with low levels of D-dimer.29 In general, D-dimer can be used as an early and useful indicator of the severity of COVID-19.
In our research, it is shown that patients with COVID-19 may have higher aspartate aminotransferase than non-patients. Current research shows that in course of COVID-19, patients with underlying cardiovascular disease and other comorbidities are more likely to develop myocardial damage. Myocardial injury is significantly related to the fatal outcome of COVID-19.30 It is worth noting that elderly patients are more likely to suffer from myocardial injury than younger patients. This may be related to more basic cardiovascular diseases and critical illness in elderly patients, but the mechanism is still unclear. Acute heart injury and heart failure are the main risk factors leading to patient death with COVID-19, in addition to ARDS (Acute Respiratory Distress Syndrome)31, indicating that elderly patients are more vulnerable to heart damage when infected with SARS-CoV-2. Particular attention should be paid to cardiovascular protection during treatment for COVID-19.32
In addition, we found that the immune status of the younger group and the elderly group are quite different. The levels of IL-2R, IL-6, IL-8 and TNF-α in the elderly group are higher than those in the younger group. There is evidence that in human and animal models, respiratory virus infections associated with elevated levels of cytokine and chemokine production have a poor clinical prognosis.33 The possible pathophysiological effects of SARS-CoV-2 involve the combination of the virus and alveolar epithelial cells, activating the innate and adaptive immune system, leading to the release of cytokines. These proinflammatory markers increase vascular permeability, causing a large amount of fluid and blood cells to leak into the alveoli, causing breathing difficulties, and ultimately respiratory failure.34 Cytokines characterized by an increase in tumor necrosis factor-α have been found in severe COVID-19 disease.35
Limitations
Despite of the above findings, we must admit that our study has the following limitations. First, our study is a retrospective study that included 437 patients which may only represent a part of the population, and a larger prospective study may be needed to verify these findings. Secondly, our study only includes clinical parameters of patients as many as we could access from their hospital records which may be restricted by the armarium and thus the models cannot be built based on all clinical indicators. Finally, dynamic monitoring is more meaningful for disease assessment and prediction. Here, we cannot fully describe the dynamic changes of some critical indicators of COVID-19 because of missing value in such an urgent epidemic situation.
Conclusion
In conclusion, COVID-19 patients aged 70 or older were more likely to have lower levels of lymphocytes, neutrophils, platelets. The percentage of severe cases among the elderly group patients was also higher, correlating with a higher death rate among them. The factors affecting death in the elderly group and younger group are also slightly different. Our research compared the clinical characteristics of the two populations with different immune statuses, and provided differentiated risk factors for constructing prediction models of death from COVID-19. In addition, our model also has strong predictive ability, can better distinguish between patients and non-patients.
Acknowledgements
We appreciate all patients and medical staffs involved in this study.
Conflict of interest. None declared.
References
WHO. World Health Organization Coronavirus Dashboard. Jun 1, 2021. https://covid19.who.int/
National Health Commission of the People’s Republic of China, The Eighth Revised Trial Version of the Novel Coronavirus Pneumonia Diagnosis and Treatment Guidance. Apr 16,
Author notes
X. Cui, S. Wang and N. Jiang contributed equally to this work.
