


Abstract
Background: Previous studies show that statins reduce total cholesterol (TC) concentration by both 21% in primary prevention (PP) and secondary prevention (SP) in clinical trials and by ∼24% in the general population. There are few data about the efficacy of statins on TC concentration and cardiovascular (CV) outcome in patients with chronic kidney disease (CKD). We evaluated the reduction of TC concentration and subsequent risk of CV morbidity and mortality with statins in CKD patients.
Methods: A population-based cohort study using a record-linkage database in Tayside, Scotland. A total of 2369 patients who had a primary diagnosis of CKD from Scottish Morbidity Record data or biochemistry database (serum creatinine of 220 μmol/l or higher) and who had at least two separate TC measurements between 1993 and 2007 were studied. Patients were categorized into statin-exposed and statin-unexposed groups according to statin use status during the follow-up. They were also classified into PP (n = 1325) and SP (n = 1044) cohorts at the entry date. The main outcomes were TC concentration change from baseline, CV events [Antiplatelet Trialist's Collaboration (APTC)] and all-cause mortality during the follow-up. Cox regression models, in which statin use was a time-dependent variable, were employed to assess the risk of outcome and adjusted for other known confounders.
Results: Statin-associated TC concentrations decreased by 0.59 mmol/l (12%) in PP cohort and 0.56 mmol/l (13%) in SP cohort from 4.77 and 4.48 mmol/l at baselines, respectively. Statin use was associated with a reduced risk of APTC events, CV mortality or all-cause mortality in PP {adjusted hazard ratio (HR), 0.65 [95% confidence interval (CI) 0.48–0.88]; 0.73 (95% CI 0.52–0.98); 0.59 (95% CI 0.48–0.73)} and SP [adjusted HR, 0.66 (95% CI 0.52–0.84); 0.60 (95% CI 0.47–0.77); 0.56 (95% CI 0.47–0.68)], respectively.
Conclusion: Statin use reduced TC concentrations by ∼13% in patients with CKD. Statins were protective of APTC events, CV mortality and all-cause mortality in patients with or without established CV disease.
Introduction
Chronic kidney disease (CKD) is a worldwide public health concern and it is estimated that 8.5% of the population have stages 3–5 CKD in the UK.1 Patients with any stage of CKD have an increased risk of developing cardiovascular (CV) disease,2–4 and are more likely to die from cardiovascular disease (CVD) than to progress to end-stage kidney failure.5–8 Dyslipidemia occurs often in CKD patients and contributes to both CVD and worsening renal function.9 Statins reduce incident and recurrent CV events in trial population.10 In trials of CKD, statins reduced low density lipoprotein (LDL) cholesterol by the same amount as in those without CKD.11–13 Recently two meta-analyses of randomized controlled trials (RCTs) indicated that there was a reduction of recurrent CV events with statin use in patients with any stage of CKD, and a reduction in all-cause and CV mortality only in patients with less severe CKD.11–12 The benefit of statins on the primary prevention (PP) of CV events was not observed in a subgroup analysis with small number CKD patients.10 The main weakness of these studies was the small-scale and short follow-up.
Low density lipoprotein-C is rarely measurement in clinical practice in the UK and doctors make treatment decisions based on total cholesterol (TC) plus or minus high density lipoprotein measurements. We have shown that TC reductions with lipid-lowering drugs were almost as good as low density lipoprotein-C as a guide to therapy in the statin trials14 and that TC can be used with confidence in the absence of low density lipoprotein-C.15 In the present study, we investigated the impact of statins on TC concentration and on the primary and secondary prevention (SP) of Antiplatelet Trialist's Collaboration (APTC) events and all-cause mortality in CKD patients in the setting of normal care.
Methods
We performed a cohort study in Tayside, Scotland using the Medicines Monitoring (MEMO) Unit record-linked database. The MEMO database covers a geographically compact population and serves about 400 000 patients in the National Health Service (NHS) in Tayside, Scotland. It has all-dispensed prescription data in the Tayside community from 1989 onward. The data collection methods have previously been described.16 In brief, MEMO contains several data sets including all dispensed community prescriptions, hospital discharge data, biochemistry data and other data; these data are linked by a unique patient identifier, the community health index number. Data are anonymized for the purposes of research as approved by the Caldicott Guardians. This project was also approved by the Tayside Committee on Research Medical Ethics.
Study population
The study population consisted of residents of Tayside who were registered with a general practitioner between January 1993 and December 2007 and remained resident in Tayside or died during the study period.
Study subjects
Study subjects were those with a primary diagnosis of CKD between January 1993 and December 2007. They were identified from the following databases: Scottish Morbidity Record 1 (SMR01) data coded either as 585 or 403 according to the 9th revision of International Classification of Disease (ICD9) or N18 according to the 10th revision (ICD10)17 and regional biochemistry database (serum creatinine of ≥220 μmol/l). The date of the first diagnosis of CKD was used as the entry date. These subjects had at least two TC measurements within a minimum time interval of 30 days during the follow-up. They were categorized into statin-exposed and statin-unexposed groups according to whether or not they were taking statin treatment during the follow-up. Patients who used statins prior to the study entry were excluded from the study. Subjects who were prescribed other lipid-lowering drugs after the entry date or within 180 days prior to the entry date were excluded. The cohort was also classified into PP and SP cohorts in the analysis according to whether they had established CVD [stroke, transient ischemic attack (TIA), myocardial infarction (MI), angina and heart failure (HF)] prior to the entry date.
TC measurements
Serum TC measurements were obtained from the regional biochemistry database. Baseline TC concentration was the concentration measured on the nearest date to the entry date. This date was in the range of within 1 year before or within 30 days after the entry date. Follow-up TC concentration met the following criteria: (i) on or within 180 days prior to the incident or recurrent CV admission; (ii) the last available TC measurement during follow-up in patients without CV admission; and (iii) at least 30 days after the statin treatment in the statin-exposed group.
Outcome variables
The primary study outcome was TC concentration change from baseline, and the secondary outcomes were incident or recurrent APTC events and all-cause mortality during the follow-up. We used the APTC end point of non-fatal MI (ICD9: 410; ICD10: I21), non-fatal stroke (ICD9: 431, 434.9, 436; ICD10: I61, I63, I64) or CV death (ICD9: 390–459; ICD10: I00–I99) as the primary CV end points. They were ascertained from SMR01 data according to the ICD9 or ICD10 codes and occurred at least 30 days after statin treatment in the statin-exposed group or after the entry date in the statin-unexposed group. All-cause mortality data were obtained from the General Register Office for Scotland. Same criteria to TC measurement for CV outcome were applied to the all-cause mortality outcome.
Covariates
The covariates were consisted of patient characteristics (age at entry to the study, gender, socioeconomic status and TC concentration at baseline), use of medications at baseline including analgesics, corticosteroids, non-steroidal anti-inflammatory drugs (NSAIDs) and CV drugs of positive inotropic drugs, diuretics, antiarrhythmic drugs, β-adrenoceptor blocking drugs, drugs used in hypertension and HF, nitrates, calcium-channel blockers and other antianginal drugs, anticoagulants, antiplatelet drugs, comorbidities of diabetes mellitus, angina, TIA or HF. The Scottish Index of Multiple Deprivation (SIMD) was used as a measure of socioeconomic status.18
Statistical analysis
Data were summarized as mean (SD) for continuous variables and numbers of subjects (percentage) for categorical variables. To examine differences in baseline characteristics between the groups, χ2 and t-tests were performed. TC concentration changes were calculated as baseline TC concentration minus follow-up TC concentration. In the statin group, patients started statin treatment at different times during the follow-up period. Therefore, the time between the date of study entry and the date of first statin prescription is immortal. To control this immortal time bias, a Cox regression model with a time-dependent variable of statin treatment was constructed to analyze the time to CV admission and separately for all-cause mortality and adjusted for potential confounders. Data were expressed as hazard ratios (HRs) with 95% confidence intervals (CIs). The Cox model assumptions were checked before the analysis. Sensitivity analyzes were performed in patients who had at least two high density lipoprotein-C concentration measurements. All analyses were carried out using SAS version 9.1. All P-values were two-sided.
Results
PP
Figure 1 shows a flowchart of the patients in the study. The PP cohort consisted of 1325 CKD patients (740 in the statin-exposed group and 585 in the statin-unexposed group). Patients in the statin-exposed group were more likely to be younger, taking medications of analgesics, corticosteroids and CV drugs, and had more diabetes than those in the statin-unexposed group (Table 1).
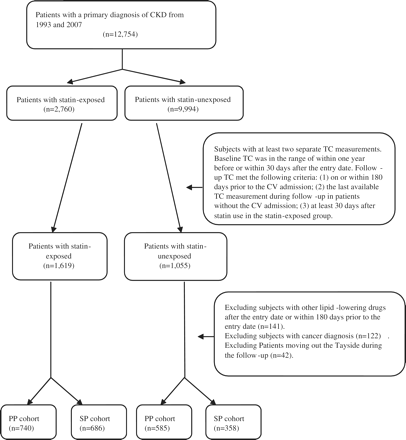
Flowchart for identification of patients in the statin-exposed and statin-unexposed cohorts.
Baseline characteristics of subjects in the PP and SP of CVD
| Baseline characteristics | PP | SP | ||||
|---|---|---|---|---|---|---|
| Statin- exposed n (%) | Statin- unexposed n (%) | P value | Statin- exposed n (%) | Statin- unexposed n (%) | P-value | |
| Number of subjects | 740 | 585 | – | 686 | 358 | – |
| Agea | 67.7 (13.5) | 70.2 (15.6) | <0.001 | 73.4 (10.1) | 77.2 (9.6) | <0.01 |
| Male | 387 (52.7) | 315 (54.7) | 0.50 | 411 (60.4) | 224 (62.8) | 0.45 |
| Baseline TC concentration (mmol/l)a | 4.77 (1.38) | 4.67 (1.20) | 0.17 | 4.48 (1.35) | 4.68 (1.32) | 0.203 |
| Social economic status | ||||||
| 1 (most deprived) | 172 (24.1) | 150 (26.7) | 0.76 | 201 (30.3) | 116 (33.2) | 0.47 |
| 2 | 167 (23.4) | 125 (22.2) | 148 (22.3) | 82 (23.5) | ||
| 3 | 147 (20.6) | 106 (12.9) | 111 (16.7) | 63 (18.1) | ||
| 4 | 108 (15.1) | 92 (16.4) | 100 (15.1) | 46 (13.2) | ||
| 5 (most affluent) | 121 (16.9) | 89 (15.8) | 104 (15.7) | 42 (12.0) | ||
| Concurrent use of drugs | ||||||
| Analgesics | 510 (68.9) | 358 (61.2) | <0.01 | 504 (73.5) | 217 (60.6) | <0.01 |
| Positive inotropic drugs | 60 (8.1) | 67 (11.5) | 0.03 | 146 (21.3) | 99 (27.7) | 0.02 |
| Diuretics | 543 (73.4) | 345 (58.9) | <0.01 | 566 (82.5) | 281 (78.5) | 0.12 |
| Antiarrhythmic drugs | 15 (2.0) | 13 (2.2) | 0.84 | 48 (7.0) | 31 (8.7) | 0.34 |
| β-Adrenoceptor blocking drugs | 341 (46.1) | 172 (29.4) | <0.01 | 389 (56.7) | 113 (31.4) | <0.01 |
| Hypertension and HF | 527 (71.2) | 261 (44.6) | <0.01 | 495 (72.2) | 185 (51.7) | <0.01 |
| Nitrates and calcium-channel blockers | 524 (70.8) | 284 (48.6) | <0.01 | 546 (79.6) | 219 (61.2) | <0.01 |
| Anticoagulants | 99 (13.4) | 80 (13.7) | 0.83 | 166 (24.2) | 80 (22.4) | 0.50 |
| Antiplatelet drugs | 433 (58.5) | 207 (35.4) | <0.001 | 535 (78.0) | 221 (61.7) | <0.01 |
| Corticosteroids | 248 (33.5) | 156 (26.7) | <0.001 | 235 (34.3) | 84 (23.5) | <0.01 |
| NSAIDs | 144 (19.5) | 110 (18.8) | 0.71 | 132 (19.2) | 58 (16.3) | 0.23 |
| Comorbidity | ||||||
| Diabetes mellitus | 231 (31.2) | 115 (19.7) | <0.01 | 209 (30.5) | 85 (23.7) | 0.02 |
| Angina, TIA and HF | 61 (8.2) | 38 (6.4) | 0.62 | 239 (34.8) | 116 (32.4) | 0.44 |
aData expressed as mean (SD).
Statin-associated TC concentration fell by 0.59 mmol/l (95% CI 0.48–0.70) (12%) from the baseline of 4.77 mmol/l (SD 1.38) to follow-up of 4.18 mmol/l (SD 1.17) (Figure 2a). TC concentration also fell by ∼3% in the statin-unexposed group. Statins had a similar effect on TC concentration reduction regardless of male or female patients (Figure 2a).
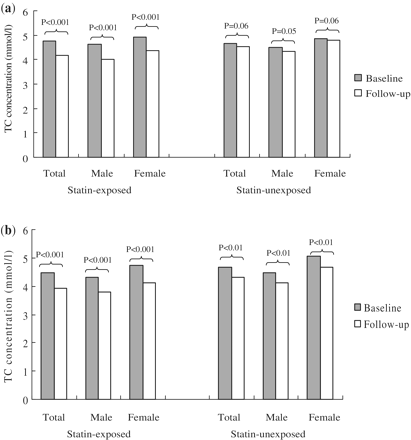
TC concentration changes in the (a) PP and (b) SP of CVD.
There were 99 CV events in the statin-exposed group and 109 in the statin-unexposed group during the 2301 and 1408 person-years (PYs) follow-up, with the crude incidence of APTC events per 100 PYs of 4.30 (95% CI 3.53–5.24) and 7.75 (95% CI 6.43–9.33), respectively (Table 3). There were 34 non-fatal MI, 18 non-fatal stroke, 71 CV deaths and 165 all-cause deaths in the statin-treated groups and 34, 22, 98 and 269 in statin-unexposed groups. The crude event rate for each component of APTC and the crude mortality rate in two groups were shown in Table 3.
Compared with the statin-unexposed group, statin treatment reduced risk of CV events [adjusted HR, 0.65 (95% CI 0.48–0.88)] (Figure 3). Patients who were older, use of positive inotropic drugs, with hospital admission of angina, TIA or HF had an increased risk of CVD. However, patients who were more affluent, or used analgesics, corticosteroids and NSAIDs carried a lower risk of CVD (Table 2). An effect of statins on CV mortality was observed [adjusted HR, 0.73 (95% CI 0.52–0.98], but not on non-fatal MI or non-fatal stroke (Figure 3). Statin use was associated with 41% reduction in all-cause mortality [adjusted HR, 0.59 (95% CI 0.48–0.73)].
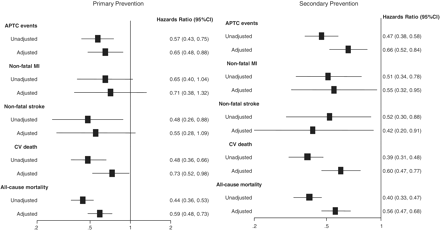
Unadjusted and adjusted hazards ratios of APTC events and mortality associated with statins.
Univariate and multivariate analyzes in the PP and SP of CVD
| Outcome predictor | PP | SP | ||
|---|---|---|---|---|
| Unadjusted HR | Adjusted HR | Unadjusted HR | Adjusted HR | |
| Statins | 0.57 (0.43–0.75) | 0.65 (0.48–0.88) | 0.47 (0.38–0.58) | 0.66 (0.52–0.84) |
| Age | 1.05 (1.03–1.06) | 1.04 (1.03–1.06) | 1.03 (1.02–1.04) | 1.02 (1.00–1.03) |
| Male/female | 1.06 (0.81–1.40) | 1.14 (0.85–1.53) | 0.83 (0.67–1.02) | 0.89 (0.71–1.12) |
| Baseline TC concentration (mmol/l) | 0.99 (0.89–1.10) | 1.08 (0.96–1.21) | 1.00 (0.94–1.08) | 1.00 (0.92–1.08) |
| Social economic status | ||||
| 1 (most deprived) | 1.00 | 1.00 | 1.00 | 1.00 |
| 2–3 | 0.63 (0.45–0.87) | 0.54 (0.38–0.75) | 1.08 (0.85–1.37) | 0.96 (0.75–1.22) |
| 4–5 (most affluent) | 0.78 (0.55–1.08) | 0.62 (0.44–0.88) | 0.85 (0.65–1.11) | 0.78 (0.59–1.02) |
| Concurrent use of drugs | ||||
| Analgesics | 0.64 (0.48–0.85) | 0.69 (0.50–0.94) | 0.49 (0.40–0.61) | 0.50 (0.40–0.63) |
| Positive inotropic drugs | 1.94 (1.33–2.83) | 1.71 (1.11–2.61) | 1.28 (1.03–1.60) | 0.99 (0.77–1.29) |
| Diuretics | 0.95 (0.70–1.27) | 0.86 (0.61–1.21) | 0.96 (0.72–1.27) | 1.10 (0.81–1.49) |
| Antiarrhythmic drugs | 1.11 (0.46–2.69) | 0.71 (0.29–1.78) | 0.80 (0.54–1.19) | 0.70 (0.47–1.05) |
| β-Adrenoceptor blocking drugs | 0.79 (0.60–1.05) | 0.78 (0.58–1.05) | 0.51 (0.41–0.63) | 0.59 (0.47–0.75) |
| Hypertension and HF | 0.67 (0.51–0.88) | 0.82 (0.60–1.21) | 0.55 (0.44–0.68) | 0.70 (0.55–0.88) |
| Nitrates and calcium-channel blockers | 0.85 (0.64–1.13) | 1.03 (0.75–1.41) | 0.62 (0.49–0.79) | 0.95 (0.73–1.23) |
| Anticoagulants | 1.14 (0.79–1.64) | 1.01 (0.67–1.53) | 0.94 (0.74–1.19) | 0.82 (0.61–1.10) |
| Antiplatelet drugs | 1.29 (0.97–1.70) | 1.24 (0.91–1.68) | 0.64 (0.51–0.80) | 0.74 (0.56–0.98) |
| Corticosteroids | 0.51 (0.37–0.70) | 0.68 (0.49–0.95) | 0.65 (0.52–0.83) | 0.77 (0.60–0.98) |
| NSAIDs | 0.50 (0.34–0.73) | 0.52 (0.35–0.77) | 0.57 (0.43–0.75) | 0.67 (0.51–0.89) |
| Comorbidity | ||||
| Diabetes mellitus | 0.80 (0.58–1.11) | 0.86 (0.61–1.21) | 0.97 (0.77–1.21) | 1.04 (0.82–1.31) |
| Angina, TIA and HF | 2.36 (1.65–3.39) | 2.45 (1.68–3.58) | 1.45 (1.18–1.78) | 1.96 (1.56–2.46) |
SP
A total of 1044 patients (686 statin-exposed and 358 statin-unexposed) with established CVD were included in this cohort. Patients in the statin-exposed group were younger, had more diabetes, used more analgesics and corticosteroids and more some CVD drugs (Table 1). Figure 2b shows that there was 13% TC reduction (0.56 mmol/l 95% CI 0.46–0.67) with statin therapy from baseline TC of 4.48 mmol/l (SD 1.35). There was also an 8% TC reduction observed over time in the statin-unexposed group. Comparable TC changes in male and female were observed in two groups (Figure 2b).
Recurrent CV events occurred in 208 statin-exposed patients and in 157 statin-unexposed patients during 1822 and 640 PYs follow-up time with crude event rates of 11.42 (95% CI 9.97–13.08) per 100 PYs and 24.88 (95% CI 21.31–29.05) per 100 PYs, respectively (Table 3). For the individual APTC components, there were 55 non-fatal MI, 33 non-fatal stroke and 148 CV deaths. There were also 244 all-cause deaths in the statin-exposed group. Correspondingly, 38, 23, 161 and 259 events occurred in the statin-unexposed group. The crude event rates per 100 PYs for each outcome were described in Table 3.
The crude event rate per 100 PYs for each end point
| PP | SP | |||
|---|---|---|---|---|
| Statin-exposed | Statin-unexposed | Statin-exposed | Statin-unexposed | |
| APTC end point | 4.30 (3.53–5.24) | 7.75 (6.43–9.33) | 11.42 (9.97–13.08) | 24.88 (21.31–29.05) |
| Non-fatal MI | 1.40 (1.00–1.96) | 2.21 (1.58–3.09) | 2.68 (2.06–3.49) | 5.41 (3.93–7.43) |
| Non-fatal stroke | 0.73 (0.46–1.16) | 1.56 (1.04–2.32) | 1.55 (1.10–2.19) | 3.22 (2.14–4.84) |
| CV death | 3.16 (2.50–3.98) | 6.55 (5.38–7.98) | 9.45 (8.04–11.10) | 23.97 (20.56–27.95) |
| All-cause mortality | 7.34 (6.30–8.55) | 16.80 (14.92–18.93) | 15.11 (13.33–17.13) | 36.90 (32.69–41.65) |
A significant risk reduction of 34% in recurrent CV events [adjusted HR, 0.66 (95% CI 0.52–0.84)], 45% in non-fatal MI, 58% in non-fatal stroke, 40% in CV mortality were observed in the statin-exposed group (Figure 3). Older patients and patients with prior hospitalizations of angina, TIA or HF had an increased risk of CVD. In contrast, use of analgesics, β-adrenoceptor blocking drugs, drugs used in hypertension and HF, antiplatelet drugs, corticosteroids and NSAIDs had a reduced risk of CVD (Table 2). The risk of all-cause mortality was reduced by 44% with statin use [adjusted HR, 0.56 (95% CI 0.47–0.68)].
Sensitivity analysis
In patients who had high density lipoprotein-C measurements available (PP: 696 in the statin-exposed and 505 in the statin-unexposed group; SP: 610 and 282, respectively) both high density lipoprotein-C concentration increased with statins by ∼6% from 1.34 mmol/l (SD 0.46) in the PP and by 5% from 1.27 mmol/l (SD 0.43) in the SP at the baselines. Statins had a comparable impact on CV events [PP: 0.61 (95% CI 0.45–0.84); SP: 0.59 (95% CI 0.46–0.78)] and all-cause mortality [PP: 0.62 (95% CI 0.50–0.79); SP: 0.55 (95% CI 0.44–0.68)] in patients with high density lipoprotein-C measurement. Meanwhile, a risk reduction of non-fatal MI, non-fatal stroke or CV mortality in patients with prior CV admission was consistent and the HRs were similar to the main results. High density lipoprotein-C could be used to guide statin use as well as TC in the absence of LDL-C measurements in patients with CKD.
Discussion
To our knowledge, this is the first population-based study to study the impact of statins on TC concentration and CV outcome among CKD patients in normal clinical care setting. Use of statins was associated with risk reductions of APTC events (non-fatal MI, non-fatal stroke or CV death), CV mortality and all-cause mortality in both PP and SP of CVD. Risk reductions of non-fatal MI and non-fatal stroke were observed in patients with prior CVD. These findings were robust when sensitivity analyzes were performed by taking HDL-C into the consideration or by excluding prevalent statin-exposed patients.
Compared with TC lowering with lipid-lowering drugs in the general population that excluded CKD patients (∼24% reduction)14 or TC reduction in the PP and SP of statin trials (both of 21% reduction),15 statin-associated TC reductions were smaller in patients with CKD than the general population. A lower baseline TC concentration in CKD patients than that in the general population appeared to be related to a lower TC reduction with statin therapy.
Three meta-analyzes have been done recently. Strippoli et al.11 analyzed 50 RCTs and found that TC concentration was significantly lower by 19% with statins than with placebo in CKD patients with established CVD. This is numerically larger than our TC reduction in SP (13%). Also, statin treatment reduced the risk of recurrent CV events [relative risk (RR) 0.78 (95% CI 0.73–0.84)] and CV mortality [RR 0.81 (95% CI 0.73–0.90)], but not in all-cause mortality [RR 0.92 (95% CI 0.82–1.03)]. Other two systematic reviews of RCT reported that statins decreased lipid levels in CKD patients requiring dialysis (∼27%) and not requiring dialysis (∼23%)12–13and these reductions were larger than in our study. Statin use was associated with major mortality benefits [all-cause mortality: RR 0.81 (95% CI 0.74–0.89); CV deaths: RR 0.80 (95% CI 0.70–0.90)] in CKD patients not requiring dialysis,12 but not in dialysis patients [all-cause mortality: RR 0.95 (95% CI 0.86–1.06); CV mortality: RR 0.96 (95% CI 0.65–1.40)].13 The benefit of statins in improving non-fatal CV events was observed in CKD patients not requiring dialysis [RR 0.75 (95% CI 0.66–0.85)]12 and with hemodialysis [RR 0.86 (95% CI 0.74–0.99)].13 But some potential limitations were that all these results were dominated by the results of one large study and there were small number of events in many studies. In general, the effect of statins in CKD patients in these trials was similar to that seen in our study.
The major strength of our study is that it was population based with a long follow-up (15 years) and included CKD patients with and without prior CVD. Also the accurate biochemical data of dyslipidemia was taken into account. It is possible that other unmeasured confounders might have influenced the results of our analysis. We used serum creatinine rather than estimated glomerular filtration rate that is a better measurement for renal function to identify patients in the study. We did not consider types of statins, statin dose titration, effects of lifestyles and others in our study.
In summary, our study results show that the percentage reduction of TC with statins in CKD is less than the general population. However, statins were associated with reduced risk of incident or recurrent CV events (non-fatal MI, non-fatal stroke or CV death) and improve all-cause mortality in patients with or without established CVD.
Conflict of interest: None declared.
