


Abstract
A long-standing and influential view in U.S. correctional policy is that “nothing works” when it comes to rehabilitating incarcerated individuals. We revisit this hypothesis by studying an innovative law-enforcement-led program launched in the county jail of Flint, MI: Inmate Growth Naturally and Intentionally through Education (IGNITE). We develop an instrumental variables approach to estimate the effects of IGNITE exposure, leveraging quasi-random court delays that cause individuals to spend more time in jail before and after the program’s launch. Holding time in jail fixed, we find that one additional month of IGNITE exposure reduces weekly misconduct in jail by 25% and three-month recidivism by 24%, with the recidivism effects growing over time. Surveys of staff and community members, along with administrative test-score records and within-jail text messages, suggest that cultural change and improved literacy and numeracy scores are contributing mechanisms.
I. Introduction
The United States has one of the highest incarceration rates in the world, with over 2 million people in correctional facilities daily (Zeng 2022). Over 600,000 of these individuals are held in local jails, the vast majority of whom are unconvicted or awaiting sentencing (Sawyer and Wagner 2023). These statistics partly reflect high rates of recidivism: one in four people released from jail, for example, are rejailed within a year (Jones and Sawyer 2019). Addressing such incarceration cycles, and reducing recidivism broadly, remain persistent policy challenges (Doleac 2023).
Views on the effectiveness of rehabilitation in U.S. prisons have generally been negative and slow to change since the influential “nothing works” doctrine, often attributed to Martinson (1974). From a review of observational studies of prison rehabilitation programs in the 1970s, Martinson concluded that with “isolated exception” there was no “appreciable effect on recidivism.” Although this conclusion has been challenged, with more optimistic recent findings on the efficacy of certain rehabilitative programs for certain populations (e.g., Weisburd, Farrington, and Gill 2017; Heller et al. 2017; Arbour 2022; Arbour, Lacroix, and Marchand 2024), the “nothing works” doctrine has become mantra for much of the U.S. correctional community. In the years after the Martinson report, U.S. correctional policy largely shifted away from principles of rehabilitation to a focus on deterrence and incapacitation (Andrews and Bonta 2010). Rehabilitative programs have received even less investment within U.S. jails, where resources are scant and stays are presumed short.
Outside the United States, rehabilitative programming is often a mainstay of incarceration and seen as crucial for reintegrating incarcerated people into society. Correctional policy in Norway, for example, bases rehabilitation efforts around the “principle of normality”: that life inside a correctional facility should resemble life outside as closely as possible. A recent quasi-experimental analysis finds that time spent in such facilities leads to large reductions in recidivism and other adverse outcomes (Bhuller et al. 2020). Inspired by these principles of rehabilitation, some U.S. cities have begun to incorporate such ideas into the design of their correctional facilities.1 But whether such rehabilitative policies and philosophies can work in other contexts—and particularly in U.S. jails—remains an open question.
This article studies an innovative law enforcement–led rehabilitation program, launched in September 2020 in the county jail of Flint, Michigan: Inmate Growth Naturally and Intentionally through Education (IGNITE). Nominally, IGNITE is an educational program offering tailored coursework and training to all jailed individuals with high take-up rates. In practice, IGNITE administrators emphasize a cultural change in the jail that goes beyond coursework and embodies a rehabilitative philosophy not unlike Norway’s principle of normality. Administrators say, for example, that IGNITE is “much more than giving people a free education. It’s about giving people hope when they have no hope” (Barrett and Greene 2023). At the same time, a notable difference with the Norwegian experience—besides the U.S. jail context—is the program’s cost: IGNITE is largely funded with existing county resources and staff, avoiding the kinds of large spending Norway and other countries have used to launch rehabilitative systems.2 This low cost and perceptions of broad success have recently led the National Sheriffs Association to begin scaling up programs similar to IGNITE in many jails across the United States.3
To estimate the effects of IGNITE exposure, we leverage unique administrative data and a novel instrumental-variables (IV) approach based on idiosyncratic delays in court appointments. Court delays are common for jailed individuals and can significantly extend their time spent in jail. In our setting, district court delays appear conditionally as-good-as-randomly assigned and extend time in jail by around two weeks (26%) on average, both before and after the launch of IGNITE. We use court delays to instrument for the time a jailed person is exposed to IGNITE, accounting for any baseline (i.e., non-IGNITE) effects of increased jail time, via a two-treatment IV specification. Our strategy effectively differences post- versus pre-IGNITE IV estimates to isolate the marginal effect of IGNITE exposure while holding fixed time in jail and netting out potential direct effects of delays. We formalize the key new assumption underlying this “difference-in-IVs” approach and develop graphical diagnostics akin to standard “pre-trend” checks in conventional difference-in-differences strategies. The IV independence, exclusion, and monotonicity assumptions in our approach can be contrasted with those underlying more conventional “judge IV” designs (employed in, e.g., Bhuller et al. 2020), which seem less tenable in our context.4
We find that IGNITE exposure dramatically reduces an individual’s propensity for misconduct in the jail and recidivism outside. One additional month of exposure to IGNITE is estimated to reduce the number of weekly major-misconduct incidents by 0.14 (25%) and to reduce three-month recidivism by 9 percentage points (24%). These effects are similar across different demographic groups, prior-offense status, and predicted exposure to the Flint water crisis. Estimated recidivism effects grow over time—to around a 15 percentage point reduction over one year—and are concentrated among people with high predicted recidivism risk. In economic terms, we find that one additional month of IGNITE exposure reduces the three-month social cost of crime and incarceration by at least $2,954 per incarcerated person. Over a year, the cost of crime and incarceration reduction is at least $7,285 per person-month.
These findings are robust to a number of potential threats to our IV strategy. Notably, we find that instrument compliers are similar on a wide range of observable characteristics before and after the launch of IGNITE, supporting our interpretation of difference-in-IV estimates as effects of the program itself. Other robustness checks probe the more standard identifying assumptions of as-good-as-random instrument assignment, instrument exclusion, and first-stage monotonicity, and show that our findings are not driven by changing conditions from the COVID-19 pandemic or changes in reporting behavior. We also obtain qualitatively similar (though less precise) recidivism estimates from a difference-in-differences strategy using less fine-grained data. An alternative difference-in-IVs strategy that uses a neighboring county as a control group in the post-IGNITE period, instead of our baseline pre-post comparison in the treated county, also yields similar recidivism effect estimates. We further show robustness in a “double” difference-in-IVs specification, which combines cross-county and over-time comparisons to relax our baseline identifying assumptions.
We explore two primary drivers of these large misconduct and recidivism effects. First, we show that exposure to the formal educational programming in IGNITE likely led to substantial improvements in literacy and numeracy among incarcerated individuals. Comparing standardized test scores before and after enrollment, we find that participants gained a full grade level, on average, in both math and reading from low baseline levels. While some score improvements may reflect heightened attention or improved test-taking, rather than human capital accumulation per se, they are massive even when compared to some of the most effective educational interventions from recent quasi-experimental analyses (e.g., Cohodes and Roy 2023).
Second, we deploy surveys to several stakeholders—including Flint community members, the formerly incarcerated, and current Genesee County custody staff—to assess the extent of cultural change alongside formal educational programming. We find that those who had personally been exposed to IGNITE or have relatives who were exposed are 23 percentage points (70%) more likely to view law enforcement favorably, suggesting a positive spillover effect from jail-based rehabilitation to perceptions about police. A sentiment analysis of administrative data collected from text messages sent from the incarcerated individuals to jail staff supports the survey findings: IGNITE-exposed individuals are more likely to use words categorized as positive and associated with trust than those incarcerated before IGNITE. Custody officers who interact more with IGNITE participants are also twice as likely to view educational programs for incarcerated individuals as worthwhile compared with officers who do not regularly interact with IGNITE participants. Taken together, these qualitative analyses support the view that a widespread cultural change occurred for both participants and staff.
Broadly, our findings suggest that “something works” for rehabilitating incarcerated individuals in U.S. jails. In fact, IGNITE generates recidivism reductions comparable to or larger than a wide range of rehabilitative programs in different settings and countries, including Norway (e.g., Bhuller et al. 2020; Arbour 2022; Mastrobuoni and Terlizzese 2022; Shem-Tov, Raphael, and Skog 2022; Arbour, Lacroix, and Marchand 2024). Notably, the recidivism reduction from IGNITE is similar to the impact of cognitive behavioral therapy (CBT) administered to juvenile arrestees (Heller et al. 2017), despite IGNITE serving high-risk adults with extensive prior criminal histories and arguably less malleable behavior. The effectiveness of IGNITE demonstrates that rehabilitative principles can be successfully implemented even in a county jail in one of the most disadvantaged cities in the United States: Flint, Michigan, which has been described as a once prosperous city “devastated by global economic forces, population loss, racism, disinvestment, and breakdowns in accountability at multiple levels of government” (Leiser, Wang, and Tatum 2022, 2). Despite these inherent challenges, we show that a relatively low-cost and law enforcement–led program resulted in better outcomes for incarcerated individuals and far-reaching improvements in public safety.
Our analysis contributes to a large literature studying the effects of various interventions on crime and recidivism. In particular, we add to a growing body of work documenting beneficial effects of rehabilitative programming (described above), diversion from the criminal justice system (Mueller-Smith and Schnepel 2021; Augustine et al. 2022), specialized criminal courts (Golestani, Owens, and Raissian 2024), improvements in prison conditions (Tobón 2022), and alternatives to incarceration (Di Tella and Schargrodsky 2013; Henneguelle, Monnery, and Kensey 2016; Williams and Weatherburn 2022; Lee 2023). Our article also relates to work documenting the impact of education on crime more broadly (Lochner and Moretti 2004; Lavecchia, Oreopoulos, and Spencer 2024). In addition to conventional recidivism outcomes, we estimate effects on within-facility misconduct—adding to a small but growing quasi-experimental literature with access to such outcomes (Arbour, Lacroix, and Marchand 2024; Cáceres Bravo 2024).
Methodologically, we contribute a new IV strategy that leverages administrative delays which extend individuals' time exposed to an institution before and after a policy reform. We develop several diagnostic tools and extensions of this difference-in-IVs approach, which may be fruitfully applied within and outside of criminal justice settings. Like Abdulkadiroğlu et al. (2016) and Autor et al. (2015), the approach uses a two-treatment IV model to isolate the causal effects of interest from quasi-experimental shocks. It is closest to Abdulkadiroğlu et al. (2016) in that we combine cross-sectional shocks with variation in potential policy exposure over time; it differs from Autor et al. (2015)’s approach and those in other papers studying the effects of delays or administrative interruptions themselves (Yang 2016; Iverson 2018; Ho, Hamilton, and Roos 2000; Dusek and Traxler 2024) in that we use quasi-experimental delay shocks as an instrument for the policy’s exposure. Our strategy is also similar to the IV approach in Aizer et al. (2024), which uses exogenous dismissals from the Civilian Conservation Corps as an instrument for training length.5 We pair our quasi-experimental approach with a series of qualitative analyses to help explore possible mechanisms, in the same mixed-methods spirit as Bergman et al. (2024).
The remainder of this article is organized as follows. Section II details the institutional setting. Section III describes data sources and the analysis sample. Section IV develops our IV strategy. Section V presents the main results and extensions. Section VI contextualizes our findings and explores possible mechanisms. Section VII concludes.
II. Institutional Setting
II.A. Genesee County Jail and Court System
IGNITE was launched in September 2020 in Genesee County Jail, which holds individuals primarily from the surrounding city of Flint, Michigan (see Online Appendix Figure I). Flint is a majority-Black city with around one-third of households living in poverty. It has experienced several major crises in recent years, including the famous water crisis and multiple cases of financial mismanagement. Flint also consistently has one of the highest crime levels among U.S. cities, with a homicide rate exceeding seven times the national average (Stebbins 2021).
As with the approximately 3,000 U.S. jails across the country, Genesee County Jail primarily holds three types of individuals: (i) arrested people who are being detained before trial, (ii) convicted people who are awaiting sentencing, and (iii) sentenced people with incarceration time of less than one year. Even compared with other jails in Michigan, Genesee County Jail has a very high share of people who are awaiting trial or sentencing. During our sample period, approximately 85% of individuals are convicted but awaiting trial, another 5% are awaiting sentencing, with the remaining 10% convicted and serving short sentences in jail. Those awaiting trial were either denied bail in the current case (20%), assigned money bail but unable to post the required amount (75%), or detained due to charges in another pending case (5%).6
Jail populations in Genesee County and across the United States are disproportionately male, young, and nonwhite. Incarcerated individuals are much more likely to lack a high school degree compared with the general population; a 2014 prison study found that 72% lacked literate proficiency compared with 52% of U.S. households (NCES 2014). Time spent in jail has increased over time, with the national mean length of stay rising over the last decade from 22.7 days to 32.8 days (Zeng 2022). Court delays, described further later, are a primary reason for longer jail spells.
Individuals’ first point of contact with Genesee County Jail occurs shortly after their arrest. On the basis of arrest charges and other considerations, a prosecutor decides whether to file criminal charges. The case then formally enters into the court system and follows a particular sequence of required events. The typical flow of a case through the Genesee County Court System is shown in Online Appendix Figure II. Defendants usually start their case in the district court, which handles all initial arraignments, probable cause conferences, and preliminary examinations, with cases assigned to a particular court based on location of arrest (State of Michigan, 67th District Court 2022; Michigan Supreme Court 2023). Misdemeanor offenses (less serious crimes that usually carry a maximum jail term of one year) proceed in the district court through the trial, plea, and sentencing processes. In more serious felony cases with sufficient evidence, the case is “bound over” (i.e., transferred) to the circuit court, which handles the pretrial, trial, plea, and sentencing processes. The district court and circuit court can also reconsider an individual’s bond amount and decide whether to release them on electronic tether.
Before IGNITE, Genesee County Jail had limited educational programming for incarcerated individuals. The jail only offered a GED class to a small group of selected people through a local school providing adult education (Mt. Morris Consolidated Schools). Such limited programming is typical of U.S. jails.7 As described by one correctional administrator in 2019: “we [in Genesee County Jail] were just kind of functioning. . . . We were sending people to court, sending people to prison, getting people out” (Barrett and Greene 2023).
II.B. Ignite
After the murder of George Floyd in May 2020 and the elevated racial tensions that followed in Flint and other parts of the country, the Genesee County Sheriff launched IGNITE: a new jail education program, made available to nearly all incarcerated people. The stated mission of IGNITE is to reduce recidivism and end the cycle of generational incarceration through education. We summarize key features of the program and its launch; Online Appendix B gives further institutional details.
Since its September 2020 launch, IGNITE has relied on repurposed jail space and staff. For instance, the day room in Genesee County Jail was transformed into a large classroom used by different groups at different times (see Online Appendix Figure III). Staffing consisted of two full-time deputies, who oversaw the day-to-day operations of the program, and a GED teacher from the nearby Mt. Morris Consolidated Schools who acted as a circulating educator. The jail installed two dedicated WiFi networks and purchased 565 tablets for IGNITE participants; 300 Chromebooks were donated by Mt. Morris. Program costs were partly offset by revenue generated from the program tablets, which participants could use in the post-IGNITE period to purchase and access music, games, and movies. Overall, the county budget for correctional services did not substantially change with IGNITE’s launch (see Online Appendix Figure IV): before and after IGNITE, Genesee County Jail spent around $70 per individual-day (Finley 2019).8
In addition to being available to nearly all incarcerated individuals (except for those deemed medically unstable or who were immediately released without charge), IGNITE has three distinguishing features. First, instruction is tailored to each person based on their educational background and baseline testing (see Online Appendix Figure V for examples). Participants are enrolled in class five days a week for two hours a day and are suggested short-term, medium-term, or long-term coursework depending on their predicted length of stay (though all programs are generally available). Some incarcerated people work on basic literacy while others work toward completing their GED and others complete programs for college credit. Individuals work on Chromebooks, allowing for more personalized instruction and for educators to float around the classroom, monitoring progress and answering questions. IGNITE offers additional technical programming, including certification for food handling, commercial driving, masonry, and welding. The program regularly hosts graduation ceremonies (see Online Appendix Figure III), where incarcerated people celebrate a new diploma, course completion, or job certification in cap and gown alongside family and friends. Upon leaving Genesee County Jail, IGNITE participants can continue in a free adult education program at Mt. Morris Consolidated Schools.
Second, participation in IGNITE is incentivized, and take-up rates are high (around 90%, per administrative data described below). Educational programming occurs during two dedicated hours of instruction woven into the daily schedule (see Online Appendix Figure VI). During instruction time, all other jail activities cease. Nonparticipating individuals remain in their cells, while participating individuals receive Chromebooks to access educational programming. Tablets, which participating individuals could use to purchase and access approved entertainment during non-IGNITE hours, were also available after people showed completion of IGNITE work.9 Some were likely also incentivized by the chance to take part in a graduation ceremony, during which they could see attending family and friends in addition to being recognized for their accomplishments.
Finally, IGNITE was intended to launch a meaningful cultural change for both incarcerated people and correctional officers. Correctional officers were asked to facilitate a learning environment by treating incarcerated individuals as students capable of change and growth. Staff perceived a change almost immediately, with one jail administrator noting that the start of IGNITE represented a “shock to the jail culture” and other officers saying, “We’re doing what? We’re bringing in teachers? We’re providing tablets? Are you kidding?” (Barrett and Greene 2023). In the post-IGNITE period, incarcerated individuals were described as not just waiting for court dates but as anticipating a productive life after release because of their participation in the program. Correctional staff expressed new views of incarcerated individuals. At a graduation ceremony, a correctional officer recalls holding the door for the graduating people and shaking their hands, stating that “It really humanizes people . . . It humanizes the inmate population, and it humanizes the deputy population” (Barrett and Greene 2023). We provide evidence of cultural change using original survey data in Section VI.C.
II.C. Court Delays
We leverage administrative delays in the Genesee County court system to estimate the effects of IGNITE exposure. Genesee County, as in many other parts of the United States, routinely experiences delays and backlogs that can cause people to spend many months or even years in jail waiting for cases to be adjudicated. In addition to these routine delays, the start of policy responses to the COVID-19 pandemic in March 2020 exacerbated delays and resulted in major court closures, which suspended trials indefinitely in Genesee County and neighboring Saginaw County. Administrative court delays contribute to lengthy jail spells. Among arrested individuals, the mean length of stay in Genesee County Jail is around 1.5 months, both pre- and post-IGNITE. Jail spells exhibit a long right tail, with a 95th percentile time in jail of 8.8 months pre-IGNITE and 8.5 months post-IGNITE.
Court delays stem from numerous opportunities for rescheduling, as shown in Online Appendix Figure II. Red arrows show the primary court hearings that can be rescheduled in the district court (which primarily handles initial hearings and misdemeanors) and purple arrows denote additional opportunities for court delays that can occur for felony cases in the circuit court. Because these court hearings occur prior to a finding of guilt or innocence, delays in the timing of these events will primarily affect individuals who are incarcerated pretrial and awaiting case disposition. In practice, these delays are common and highly impactful for an individual’s time in jail. One jail administrator notes: “if you think about the people that are in jail, they expect to go to court. But it gets adjourned, they get another court date, it gets adjourned, another court date, it gets dismissed, they have to reissue a warrant, and they never leave jail” (Diaz 2020). Such anecdotes align with patterns observed in our data where nearly 40% of all scheduled court dates are delayed, mostly by the district court.
As we show below, court delays appear idiosyncratic among individuals assigned to the same court during similar time periods and facing similar charges. Anecdotally, most delays are due to changes in the schedule of the judge or prosecutor assigned to the case and rarely occur at the request of the defendant or defense attorney.10 Although our data do not usually provide a rationale for each observed delay, most are not initiated by defendants. We show below that incarcerated individuals send internal text messages to jail administrators asking when they will next appear in court with a greater frequency in response to the delays. We perform several robustness checks that narrow in on sources of delay that are most likely to be court-induced.
III. Data and Sample Construction
Our analysis of IGNITE leverages administrative data from several sources along with original surveys of the local community, formerly incarcerated individuals, and correctional staff. This section describes each data source and key variables; Online Appendix C gives additional details.
III.A. Data Sources and Key Variables
1. The Jail Management System (JMS) and Recidivism
The JMS is a comprehensive electronic database, used by Genesee County Jail and other Michigan jails since 2015, that tracks incarcerated individuals from booking to release. We obtained JMS data for Genesee County Jail and Saginaw County Jail from January 2015 to May 2023. The JMS data include demographic information (age, name, race, home address), arrest date, booking date, release date, charges, and case disposition outcomes for each incarcerated person. Data from Genesee County also include the arrest location, which we use to identify the specific district court that handled the case. We use these data to construct our primary recidivism outcome, defined as whether an individual is rebooked in jail over a given time period.11 Our baseline recidivism outcome is measured over three months, though we study recidivism for up to one year. Although 90% of recidivism occurs in the same county (Raphael and Weiman 2007; Sabol 2007; Yang 2017; Alper, Durose, and Markman 2018; Schnepel 2018), we define recidivism as being rebooked in either Genesee or Saginaw Counties to allow for mobility.12 In practice, results are virtually identical when we restrict to Genesee County since only a small share of recidivism incidents come from Saginaw County (e.g., 6.4% for our baseline three-month recidivisim outcome). We also check robustness to alternative measures of recidivism based on an individual being recharged or reconvicted.
2. The District and Circuit Court Register of Actions (ROA) and Court Delays
We collect ROAs from district and circuit courts in Genesee and Saginaw Counties by scraping online case-management systems. The ROAs represent permanent case histories of all hearings and events during an individual’s case. These data include information on defendant charges, activities, proceedings, and filings for the case, along with dates and times of new court appointments, presiding judges, and notices of adjourned or rescheduled appointments. We use these records to create a comprehensive timeline of court hearings for each incarcerated individual. We identify court delays by changes to scheduled hearings that result in them being tagged as “removed from calendar.” Online Appendix Figure VII shows an example ROA with such an identified delay. Our baseline specification uses an indicator for any district court delay as an instrument, though we consider robustness to several other specifications.
3. Jail Incident Reports and Misconduct
We use Jail Incident Report data from Genesee County Jail to capture within-jail misconduct and medical events for incarcerated individuals. We observe these data through December 2022. Misconduct is categorized as either major or minor. Examples of major misconduct include threatening another with bodily harm, introducing contraband, violence and disruption, and refusing to follow instructions. Examples of minor misconduct include disorderly conduct, being in an unauthorized area, possession of unauthorized items, and lying. Medical events include suicidality and suicide attempts. We observe each incident date and the name of the involved people. We use major misconduct as a primary outcome of interest, as this is both more consequential for staff and incarcerated individuals and also less likely to suffer from misreporting. We study minor misconduct and medical outcomes as secondary outcomes.
4. The Kites Electronic Message System
Kites is an electronic internal messaging system between jail administrators and incarcerated people in Genesee County. Kites is available to all incarcerated individuals via kiosks in the jail. We observe the content of all messages along with the sender’s identity, the date of the message, and any follow-up responses. Incarcerated individuals can send messages to request services from numerous others, including staff or medical personnel. Incarcerated individuals also often send questions about their case, including inquiries about court-initiated delays and when they will be released (see Online Appendix Figure VIII). We use these data to assess the reaction of incarcerated people to court delays. We also study message sentiment to explore possible mechanisms.
5. Mt. Morris Educational Data
We obtain administrative data from Mt. Morris Consolidated Schools, which contain date- and time-stamped course advancement and completion records from 2021 onward. The data also include pre- and post-instruction test scores from September 2020 to October 2023. Test scores are from Comprehensive Adult Student Assessment Systems (CASAS) exams in math and reading, which are approved by the U.S. Department of Education. Pre-assessments are administered to all IGNITE participants to place them in appropriate educational programming. Once enrolled in IGNITE, incarcerated individuals take post-assessments every 40 hours of completed instruction to measure progress. Post-assessments vary in content and form from the pre-assessment, depending on a student’s placement, limiting the scope for mechanical retest effects (National Archives and Records Administration 2023). In practice, we do not have post-assessments for all participants because tests are not completed if an individual is discharged without sufficient lead time to inform staff. In addition, electronic testing was only made available recently. In the end, only a few hundred paired pre- and post-assessments are available for analysis. Nevertheless, we find that incarcerated individuals with these assessments are largely representative of the jail population (see Online Appendix Table I).
6. ViaPath Data
ViaPath is the internet service provider for Genesee County Jail and supplies connectivity for the Chromebook-based education and tablet-based entertainment available to IGNITE participants. ViaPath maintains logs of the amount of time incarcerated individuals spend in video and telephone calls to individuals outside of the jail. We have access to all ViaPath data, including individual identifiers, from February 2021 onward. We link these records to JMS data to determine the rate of IGNITE participation from tablet use: 90% of individuals incarcerated on or after February 2021 participated in IGNITE by this metric. Unfortunatelly, ViaPath data are not rich enough to identify participation in individual jail spells.
7. Community Survey
We conducted the Flint Community Survey in December 2023. Community members and two ministers of local churches distributed the survey to ensure it would not be influenced by IGNITE administrators. The survey was anonymous and asked respondents about their own experiences being incarcerated in Genesee County Jail or the experiences of a close friend or family member. Importantly, the survey did not mention IGNITE in these questions. Respondents received a $25 restricted-use eGift card for completing the survey; the overall response rate was 87%. We construct our main exposure variable as an indicator for the respondent or close relation being held in Genesee County Jail after IGNITE was introduced and find that participants are well balanced across this measure (see Online Appendix Table II). The primary survey outcome is a respondent’s trust in local law enforcement (this was elicited from all respondents) given that IGNITE was founded on a principle of procedural justice and legitimacy.13 Secondary outcomes elicited from those with direct or indirect jail experience include their or their close relation’s level of hopefulness for the future and their participation in positive activities (i.e., employment, education, or caregiving). The recruitment flyer is shown in Online Appendix Figure IX, Panel A. A link to the full survey and further details are given in Online Appendix D.
8. Custody Staff Survey
We administered The Genesee County Jail Custody Staff Survey to all current staff in January 2024. The purpose of the survey was to assess staff views toward incarcerated people in general, rehabilitation programs and educational opportunities in particular, and overall job satisfaction. The survey was anonymous and incentivized with a restricted-use $25 eGift card. The overall response rate was 44%. Here exposure is defined as spending more versus less time with IGNITE participants; Online Appendix Table III shows staff characteristics are well-balanced across this measure. The recruitment flyer is shown in Online Appendix Figure IX, Panel B. A link to the full survey and further details are given in Online Appendix D.
III.B. Main Analysis Sample
We combine the data sources, merging on unique case or person identifiers, to construct our main analysis sample. Online Appendix Figure X summarizes the sample construction. We start with the universe of arrests in the Genesee County JMS data and set aside those booked before January 1, 2016, which we use as a hold-out sample to predict recidivism risk for certain analyses. We also exclude those booked after May 2022, so as to have enough time to measure 12-month recidivism for all individuals. We merge JMS data to ROAs and exclude incarcerated individual-spells where the individual was immediately released without charge, since these people did not interact with the court system and were ineligible for IGNITE. We also exclude a small portion (3%) of remaining individuals who are not Michigan residents, since we are unlikely to accurately measure their recidivism, and individuals who are missing demographic information (2%) or have a conflicting booking date with Saginaw County (<1%). We link these data to Jail Incident Data, Kites data, and Mt. Morris data using individual identifiers. The resulting sample includes 23,756 incarcerated individual-spells representing 15,108 unique individuals. When studying recidivism outcomes, we further drop a portion (6%) of those who leave jail via a transfer to prison or individuals not yet released for at least three months to avoid mechanical incapacitation effects or right-censoring issues, respectively.
Sample summary statistics are shown in Online Appendix Table IV. The sample is 76% male, 53% Black, and the majority fall into the age range of 25–44 years. Around 43% of individuals were booked in the past year and 54% were booked on a felony charge, with 1.4 charges on average. The average time in jail is 1.6 months, with a standard deviation of 4.2. Nearly 40% of the incarcerated individual–spells in Genesee County Jail experience a court delay in district court (35% pre-IGNITE and 51% post-IGNITE). Eighteen percent are rebooked in the three months after release.
A potential concern when using administrative crime data is reporting behavior. In principle, correctional officers could underreport within-jail misconduct to demonstrate the effectiveness of IGNITE. In practice, this concern is lessened for our identification strategy, which uses variation in court delays rather than simple cross-sectional or over-time comparisons. Strategic misreporting would have to be correlated with the court-delay instrument. Moreover, there is minimal concern of strategic misreporting for our primary recidivism outcomes, as rearrest and rebooking decisions in Genesee and Saginaw Counties are made by the local police forces—not by the Genesee County Sheriff or jail administrators.14
III.C. Motivating Evidence
Figure I suggests possible effects of IGNITE on recidivism by plotting the relationship between predicted and observed recidivism among those booked in Genesee County before and after the start of IGNITE. Specifically, we plot the average three-month recidivism rates of individuals booked before and after September 2020 by bins of the individuals’ predicted recidivism risk, obtained from a logit regression on individual observables in a 2015 hold-out sample. Before the start of IGNITE, actual recidivism rates closely track these predictions. After IGNITE was launched, actual recidivism rates are significantly lower, uniformly across all levels of predicted risk. This pattern suggests a dramatic change in recidivism outcomes that coincides with the launch of IGNITE programming, though the purely time-series analysis is far from conclusive. Next we develop and apply a more sophisticated quasi-experimental strategy to estimate causal effects of IGNITE exposure.
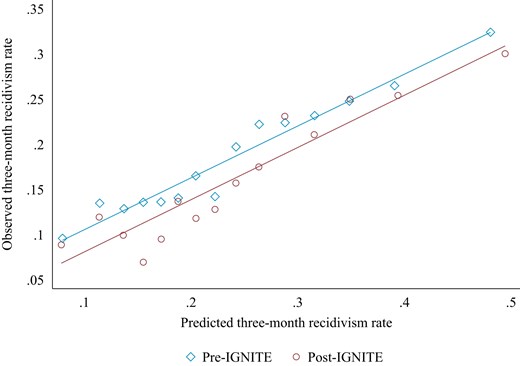
Observed Versus Predicted Recidivism, Before and After IGNITE
This figure plots observed three-month recidivism rates among individuals booked in Genesee County jail by equal-sized bins of predicted three-month recidivism risk, before and after the start of IGNITE. Predicted recidivism risk is estimated by a logit regression on the 2015 holdout sample. Predictors are the design and auxiliary controls discussed in the main text.
IV. Empirical Strategy
We develop an IV approach based on idiosyncratic delays in court appointments to estimate the causal effects of IGNITE exposure. The court-delay instrument helps address expected confounds of aggregate time-series analyses like in Figure I, by comparing observably similar individuals booked at the same time but subject to different exogenous shocks. As we will show, our individual-level IV approach also allows for a variety of checks of key identifying assumptions.
IV.A. Difference-in-IVs Approach
To formalize our IV strategy, consider a population of individuals booked into Genesee County Jail either before or after the launch of IGNITE in September 2020. Let |$P_i\in \lbrace 0,1\rbrace$| indicate that individual i was booked post-IGNITE, let |$M_i^J$| count the number of months individual i spends in jail, and let |$M_i^I$| count the number of months i is exposed to IGNITE within the jail. To start simply, we assume that nobody booked pre-IGNITE is exposed to IGNITE: that is, |$M_i^I=M_i^J\times P_i$|. Our general IV strategy, developed below, relaxes this assumption to allow individuals booked before IGNITE to be partially exposed through their continued incarceration in September 2020.
Consider a simple causal model relating |$M_i^J$| and |$M_i^I$| to an outcome |$Y_i$|:
where |$Y_i(0)$| is an untreated potential outcome, that is, the outcome that individual i would see with no time in jail or IGNITE. Here |$\gamma _i$| denotes the incremental effect of time in jail for individual i in the absence of IGNITE and |$\beta _i$| denotes the incremental effect of IGNITE exposure of individual i holding fixed their time in jail. We assume these potentially heterogeneous causal effects are linear in time only for initial ease of exposition; later we discuss a more general causal model.
To estimate causal effects, we assume that individuals are as good as randomly assigned to a court-delay indicator |$Z_i\in \lbrace 0,1\rbrace$|. Here, again for initial simplicity, we imagine |$Z_i$| is randomly assigned without any controls and is known to have no direct effect on outcomes, making it statistically independent of |$(P_i,Y_i(0),\gamma _i,\beta _i)$|. Court delays extend time in jail both pre- and post-IGNITE, making |$Z_i$| positively correlated with both |$M_i^J$| and |$M_i^I$|.
Under these conditions, an IV regression of |$Y_i$| on either |$M_i^J$| (in the pre-IGNITE period) or |$M_i^I$| (in the post-IGNITE period), instrumenting with |$Z_i$|, identifies a weighted average of causal effects:
where |$\omega _i^{Pre}$| and |$\omega _i^{Post}$| are weights that average to one and capture the relative “complier” status of individual i: i.e., the relative amount of time in jail individual i is induced to via court delays.15 When delays only weakly increase time in jail pre- or post-IGNITE (a natural first-stage monotonicity condition), both weighting schemes are convex: |$\omega _i^{Pre}\ge 0$| and |$\omega _i^{Post}\ge 0$|.
Equation (2) shows that the pre-IGNITE IV identifies a convex weighted average of time-in-jail effects |$\gamma _i$|, while equation (3) shows that the post-IGNITE IV identifies a weighted average of |$\gamma _i+\beta _i$|. The latter combines marginal IGNITE exposure effects |$\beta _i$| with baseline time-in-jail effects |$\gamma _i$|. To isolate IGNITE exposure effects, we consider the following condition on jail effects:
Equation (4) restricts heterogeneity in baseline time-in-jail effects pre- and post-IGNITE, similar in spirit to a conventional “parallel trends” restriction on untreated potential-outcome changes before and after a policy change in conventional difference-in-differences analyses. Our condition is satisfied when, if not for the start of IGNITE, the IV estimates would not have changed in September 2020.16 Clearly, this condition is satisfied when time-in-jail effects |$\gamma _i$| are homogeneous or otherwise uncorrelated with the IV weights |$\omega _i^{Pre}$| and |$\omega _i^{Post}$|. Next we show how the condition can be probed graphically, as with pre-trend checks in conventional difference-in-differences; we also relax it by incorporating additional cross-sectional comparisons with Saginaw County.
Under equation (2), a difference-in-IVs identifies a weighted average of IGNITE exposure effects. Specifically, differencing equations (3) and (2), we have by equation (4):
where again |$\omega _i^{Post}\ge 0$| when court delays do not reduce time in jail. |$\beta ^\Delta$| then captures a convex average of incremental effects of additional time exposed to IGNITE, |$\beta _i$|, holding time in jail fixed. Online Appendix E.B generalizes this result to nonlinear causal effects of |$M_i^J$| and |$M_i^I$|, showing that under an appropriate generalization of equation (4) the difference-in-IVs identifies an average causal response function, as in Angrist and Imbens (1995). Here |$\beta ^\Delta$| captures a weighted average of incremental IGNITE exposure effects at different margins of exposure.17
IV.B. IV Specification
Our main estimates come from a two-treatment IV specification that applies the above difference-in-IVs logic while accommodating additional controls and the possibility that individuals booked before the launch of IGNITE were exposed to the program after September 2020. For a given outcome |$Y_i$|, we estimate:
where again |$M_i^I$| and |$M_i^J$| count the months individual i is exposed to IGNITE and jail, respectively. Here |$X_i$| is a covariate vector that includes the indicator for a post-IGNITE booking |$P_i$| along with other controls and a constant. We instrument for the two endogenous variables, |$M_i^I$| and |$M_i^J$|, with |$Z_i$| and |$Z_i\times P_i$| (controlling for |$X_i$|), where |$Z_i$| again indicates a district court delay.
The main IV coefficient of interest, |$\beta$|, reduces to a difference-in-IVs when no individuals booked pre-IGNITE are exposed to IGNITE (i.e., |$M_i^I = M_i^J\times P_i$|), and when the controls in |$X_i$| are saturated in |$P_i$|. In this case, the IV estimate is given by |$\hat{\beta }=\hat{\beta }^{Post}-\hat{\beta }^{Pre}$|, where |$\hat{\beta }^{Post}$| and |$\hat{\beta }^{Pre}$| are estimates from two separate IV specifications run in the post-IGNITE and pre-IGNITE periods. Specifically, |$\hat{\beta }$| differences IV estimates of |$\beta ^{Pre}$| and |$\beta ^{Post}$| from specifications
with the first specification run in the |$P_i=0$| subsample and the second specification run in the |$P_i=1$| subsample. The general two-treatment IV specification, equation (6), extends this basic difference-in-IV logic while allowing people booked before IGNITE to have exposure to IGNITE.
We include two types of controls in |$X_i$| in addition to |$P_i$|. First, in all IV specifications, we include a set of design controls that account for nonrandomness in court delays. These design controls are court-division fixed effects (FEs) based on the location of arrest (since delays are more likely in some divisions of Genesee County than others), booking month and day-of-week FEs for the first scheduled hearing (since delay propensities exhibit seasonality), the number of charges and FEs for charge type (felony, misdemeanor traffic, misdemeanor DUI, and other misdemeanor crime) to account for different probabilities of delay by the seriousness of the charge. Second, in some IV specifications, we include auxiliary controls reflecting individual demographics and other characteristics. These controls are not needed for identification, but they may increase precision by absorbing residual variation in the outcomes.
IV.C. Identifying Assumptions and Tests
IV estimates of equation (6) capture average causal effects of IGNITE exposure and non-IGNITE time in jail under four assumptions. The first three assumptions are standard in IV analyses, and the fourth follows equation (4). Here we discuss each assumption and provide some initial empirical support.
Our first identifying assumption is that the court delay indicator |$Z_i$| is as good as randomly assigned given the design controls in |$X_i$|. This assumption is consistent with the institutional setting (see Section II.C) as well as a number of empirical balance tests shown in Table I. Panel A shows that several observable individual characteristics are uncorrelated with |$Z_i$| given the design controls, and Panel B further shows balance on the characteristics of census tracts in which individuals reside. The characteristics in these two panels constitute our auxiliary controls. Panel C summarizes balance by showing that the court-delay instrument has a precise null relationship with the predicted recidivism measure from Figure I, given the design controls. Section V.B discusses additional checks of as-good-as-random assignment.18
Court-Delay Balance Tests and First Stage
| Overall | Balance | Standard | |
|---|---|---|---|
| mean | coefficient | error | |
| (1) | (2) | (3) | |
| Panel A: Individual characteristics | |||
| Female | 0.240 | 0.003 | 0.007 |
| Age 18–24 | 0.207 | 0.010 | 0.006 |
| Age 25–34 | 0.379 | 0.005 | 0.008 |
| Age 35–44 | 0.227 | −0.009 | 0.007 |
| Age 45–54 | 0.119 | −0.006 | 0.005 |
| Age 55–64 | 0.059 | −0.001 | 0.004 |
| Age 65+ | 0.009 | 0.001 | 0.001 |
| Black | 0.525 | −0.011 | 0.008 |
| Booked in past year | 0.428 | −0.007 | 0.007 |
| Has a public defender | 0.089 | −0.000 | 0.004 |
| Panel B: Census tract characteristics | |||
| Share with elevated blood-lead level | 0.031 | −0.002 | 0.004 |
| Share Black | 0.423 | −0.006 | 0.007 |
| Share high school graduate or higher | 0.849 | 0.000 | 0.007 |
| Log median household income | 10.330 | 0.000 | 0.043 |
| Missing census tract information | 0.058 | 0.002 | 0.004 |
| F-statistic for joint test [p-value] | 1.453 [.120] | ||
| Panel C: Predicted risk | |||
| Predicted 3-month recidivism | 0.243 | −0.001 | 0.001 |
| Panel D: First stage | |||
| Months in jail | 1.553 | 0.399*** | 0.060 |
| Observations | 23,756 | ||
Notes. Panels A and B summarize balance tests for the court-delay instrument. Column (1) reports sample means of individual characteristics. Columns (2) and (3) report estimated coefficients and standard errors from regressing the characteristics on the instrument. All regressions include the design controls discussed in the main text. The census tract characteristics in Panel B are linked to an individual’s residential address as recorded in the JMS data. A tract’s share with elevated blood-lead level refers to the proportion of individuals with above 4.5 micrograms of lead per deciliter of blood among those tested in the census tract in 2017 (Data Driven Detroit 2022). A tract’s share Black, share high school graduate or higher, and log median household income are obtained from the 2016 American Community Survey (U.S. Census Bureau 2016). The missing census tract information indicator equals one if an individual cannot be matched to a census tract. The F-statistic is for the joint test of balance across all individual and census tract characteristics. Predicted three-month recidivism risk in Panel C is estimated by a logit regression on the 2015 holdout sample. Predictors are the design and auxiliary controls discussed in the main text. Panel D reports the coefficient from a first-stage regression of months in jail on the instrument including the design controls. Standard errors are clustered by individual. * p < .10, ** p < .05, *** p < .01.
Alongside these balance tests, Table I, Panel D shows that experiencing a court delay significantly extends an individual’s time in jail—an implicit instrument-relevance condition for our IV strategy. On average, individuals spend 0.4 months (around two weeks, or 26%) longer in jail when they experience a court delay. This first stage is highly significant, with an F-statistic of 65.39. We further explore the first-stage relationship below.
Our second and third identifying assumptions are a standard IV exclusion restriction and monotonicity condition: that court delays do not affect our outcomes of interest except by extending time in jail, and that delays only increase time in jail (both pre- and post-IGNITE) if they have any effect at all. These assumptions are consistent with the institutional setting, and we probe them empirically in Section V.B.
The final identifying assumption follows equation (4) and allows us to interpret estimates of |$\beta$| in terms of the causal effects of additional IGNITE exposure holding time in jail fixed. Intuitively, the assumption is satisfied when IV estimates of time-in-jail effects would not have systematically changed in September 2020 if not for the launch of IGNITE. There are two primary threats to this assumption. First, as in a conventional difference-in-differences approach, our identifying assumption could be violated if another unobserved policy change or broader change in Genesee County occurred around the start of IGNITE. Unlike with a conventional difference-in-differences approach, however, such time-varying confounds would have to affect the effects of time in jail rather than potential-outcome levels. Below we conduct a nonparametric analysis of court-delay effects over time—akin to the standard pre-trend check in conventional difference-in-differences analyses—which suggests minimal scope for such time-varying confounds in our setting.
The second potential threat to this assumption is that the types of individuals who comply with the court-delay instrument changed before and after IGNITE. More formally, equation (4) could fail if |$\beta ^{Pre}$| and |$\beta ^{Post}$| put different weight on heterogeneous time-in-jail effects. We will show that these effects are relatively small in the pre-IGNITE period and that causal effects are generally homogeneous across observable characteristics—reducing concerns of bias from effect heterogeneity. More direct evidence comes from Table II, which shows the average observable characteristics of instrument compliers before and after IGNITE.19 The differences in these averages are almost all statistically insignificant and suggest that compliers are broadly comparable before and after IGNITE.20
Complier Characteristics, Before and After IGNITE
| Pre-IGNITE | Post-IGNITE | Pre − Post | Full sample | |
|---|---|---|---|---|
| (1) | (2) | (3) | (4) | |
| Panel A: Individual characteristics | ||||
| Female | 0.141 | 0.115 | 0.026 | 0.240 |
| (0.050) | (0.043) | (0.065) | ||
| Age 18–24 | 0.273 | 0.203 | 0.069 | 0.207 |
| (0.080) | (0.067) | (0.102) | ||
| Age 25–34 | 0.322 | 0.388 | −0.066 | 0.379 |
| (0.083) | (0.079) | (0.112) | ||
| Age 35–44 | 0.208 | 0.115 | 0.093 | 0.227 |
| (0.066) | (0.068) | (0.094) | ||
| Age 45–54 | 0.131 | 0.139 | −0.008 | 0.119 |
| (0.060) | (0.053) | (0.079) | ||
| Age 55–64 | 0.018 | 0.124 | −0.105** | 0.059 |
| (0.034) | (0.040) | (0.052) | ||
| Age 65+ | 0.048 | 0.032 | 0.017 | 0.009 |
| (0.025) | (0.017) | (0.029) | ||
| Black | 0.618 | 0.461 | 0.157 | 0.525 |
| (0.085) | (0.082) | (0.116) | ||
| Booked in past year | 0.374 | 0.336 | 0.038 | 0.428 |
| (0.086) | (0.080) | (0.114) | ||
| Panel B: Crime characteristics | ||||
| Crimes against persons | 1.132 | 0.884 | 0.248** | 0.384 |
| (0.078) | (0.080) | (0.110) | ||
| Crimes against property | 0.236 | 0.062 | 0.174 | 0.222 |
| (0.080) | (0.084) | (0.114) | ||
| Crimes against public order | 0.044 | 0.040 | 0.004 | 0.098 |
| (0.044) | (0.040) | (0.058) | ||
| Drug crimes | 0.105 | 0.096 | 0.008 | 0.172 |
| (0.065) | (0.064) | (0.089) | ||
| Weapons crimes | 0.428 | 0.247 | 0.181 | 0.146 |
| (0.091) | (0.088) | (0.124) | ||
| Traffic crimes | 0.171 | 0.212 | −0.040 | 0.282 |
| (0.057) | (0.063) | (0.083) | ||
| Panel C: Census tract characteristics | ||||
| Share with elevated blood-lead | 0.035 | 0.036 | −0.001 | 0.031 |
| level | (0.006) | (0.005) | (0.008) | |
| Share Black | 0.521 | 0.346 | 0.175* | 0.423 |
| (0.069) | (0.067) | (0.095) | ||
| Share high school graduate or | 0.856 | 0.847 | 0.010 | 0.849 |
| higher | (0.013) | (0.011) | (0.017) | |
| Log median household income | 10.290 | 10.373 | −0.082 | 10.330 |
| (0.080) | (0.073) | (0.107) | ||
| Missing census tract information | 0.134 | 0.109 | 0.025 | 0.058 |
| (0.045) | (0.034) | (0.055) | ||
| Panel D: Predicted risk | ||||
| Predicted 3-month recidivism | 0.252 | 0.205 | 0.047 | 0.243 |
| (0.020) | (0.021) | (0.028) | ||
Notes. Columns (1) and (2) report estimated coefficients from IV regressions of the interaction between a given characteristic and months in jail on months in jail, instrumenting with a court-delay indicator and controlling for the design and auxiliary controls, for individuals booked pre- and post-IGNITE. As discussed in Online Appendix E, the estimated coefficients can be interpreted as a weighted average of instrument-complier characteristics along different margins of time-in-jail response. Column (3) reports the difference between the pre and post coefficients, while column (4) reports the sample mean of the characteristic. Predicted three-month recidivism risk is estimated by a logit regression on the 2015 holdout sample. Predictors are the design and auxiliary controls discussed in the main text. Individual-clustered standard errors are reported in parentheses. * p < .10, ** p < .05, *** p < .01.
Three further points on the interpretation of our IV estimates are worth highlighting. First, while we are primarily interested in the causal interpretation of the IGNITE exposure effect |$\beta$|, the combined |$\beta +\gamma$| coefficient may be interpretable under weaker conditions. Specifically, |$\beta +\gamma$| captures the average effect of increased time in jail in the post-IGNITE period even when baseline time-in-jail effects are not comparable pre- and post-IGNITE (i.e., when equation (4) fails). Correspondingly, we report estimates of this combined effect along with estimates of |$\beta$|.
Second, we note that |$\beta$| may retain its interpretation as an average causal effect of IGNITE exposure when the conventional IV assumptions (as good as random assignment, exclusion, and monotonicity) fail, provided the bias from such violations manifests similarly in the pre- and post-IGNITE periods. For example, the causal interpretation of |$\beta$| is robust to court delays directly affecting within-jail misconduct by increasing an individual’s frustration with the criminal justice system (a potential exclusion violation) provided such frustration effects are similar before and after IGNITE. Estimates of |$\gamma$| or the combined |$\beta +\gamma$| coefficient would not, however, be causally interpretable in such cases. In Section V.C we develop extensions of our baseline approach that further weaken the exclusion restriction.
Third, we note that |$\beta$| targets the average effect of exposure to IGNITE programming and not the effect of program participation. While participation rates are known to be high—around 90% on average—we do not have individual participation data that would let us study the latter. Under a plausible monotonicity condition, a hypothetical extended IV approach would scale our estimates by such a take-up rate.21 In this scenario, the magnitude of our effects can be viewed as giving a lower bound on the magnitude of effects from IGNITE participation.
V. Main Findings
V.A. Misconduct and Recidivism Effects
Figure II plots the reduced-form variation underlying our primary IV estimates. Each point shows the estimated effect of court delays on one of our primary outcomes—weekly major misconduct or three-month recidivism—separately by an individual’s booking month. We obtain these estimates by regressing the outcome on the court-delay instrument, adjusting for the design controls and the auxiliary controls from Table I, Panels A and B.
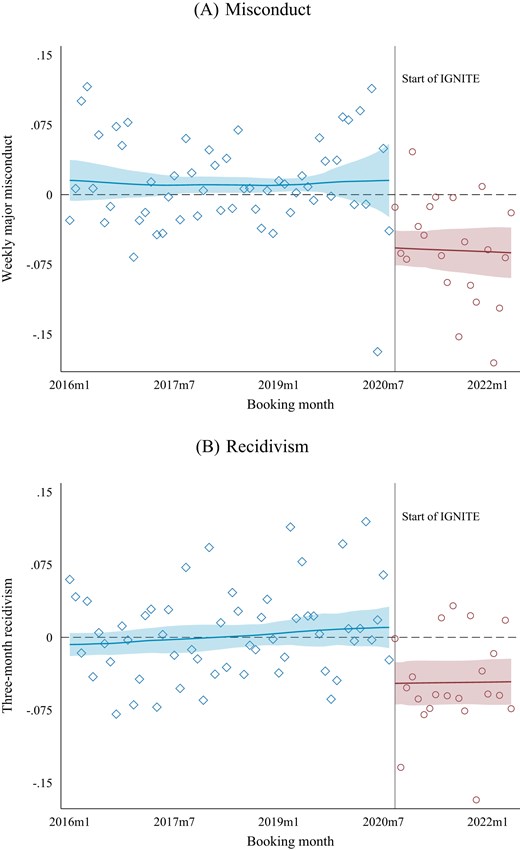
Reduced-Form Effects of Court Delays by Booking Month
This figure plots covariate-adjusted differences in weekly major misconduct rates and three-month recidivism rates between individuals who do and do not experience a court delay, by booking month. Covariates include the design and auxiliary controls discussed in the main text. The fitted lines are obtained by local linear regression with rule-of-thumb bandwidths, weighting by the number of incarcerated individuals booked in a month. Shading indicates 95% confidence intervals derived from individual-clustered standard errors. The vertical lines indicate the beginning of the IGNITE program in September 2020.
The figure shows strikingly different reduced-form effects of court delays pre- and post-IGNITE. Before September 2020, delayed individuals on average saw at most a small increase in within-jail weekly misconduct rates and no increase in post-release recidivism. A pre-IGNITE IV specification would scale these reduced-form effects by the corresponding first stage to find small or no effects on time in jail before the start of IGNITE. In contrast, court delays had sizable negative effects on misconduct and recidivism after the start of IGNITE. As described in Section IV.A, a difference-in-IVs estimate contrasting these pre- and post-IGNITE estimates would therefore suggest large negative IGNITE exposure effects, with Online Appendix Figure XIII showing the corresponding first-stage plot. Importantly for this interpretation, the figure shows no clear trends in the reduced-form effects of either outcome before or after September 2020. It is therefore plausible that if not for the start of IGNITE, the time-in-jail effects on misconduct or recidivism would have remained slightly positive or insignificant.
Table III reports our main reduced-form and IV estimates of misconduct and recidivism effects. IV estimates in columns (1) and (3) are from equation (6), with a post-IGNITE indicator and all design controls in |$X_i$|. In columns (2) and (4) we further include the auxiliary controls; consistent with the balance tests in Table I, these controls do not materially change the estimates. Online Appendix Table VIII shows corresponding first-stage estimates and multivariate first-stage F-statistics, computed as in Sanderson and Windmeijer (2016). Reduced-form estimates come from regressing outcomes on the two instruments, the court-delay indicator and its interaction with the post-IGNITE dummy, adjusting for the controls.
Effects of IGNITE on Misconduct and Recidivism
| Misconduct | Recidivism | |||
|---|---|---|---|---|
| (1) | (2) | (3) | (4) | |
| Panel A: Reduced form | ||||
| Court delay × Post-IGNITE | −0.076*** | −0.074*** | −0.049*** | −0.050*** |
| (0.016) | (0.016) | (0.013) | (0.013) | |
| Court delay | 0.013** | 0.013** | −0.002 | −0.003 |
| (0.007) | (0.007) | (0.007) | (0.006) | |
| Panel B: IV | ||||
| Months in IGNITE | −0.135*** | −0.134*** | −0.089*** | −0.089*** |
| (0.032) | (0.032) | (0.032) | (0.031) | |
| Months in jail | 0.077*** | 0.076*** | 0.012 | 0.008 |
| (0.026) | (0.026) | (0.029) | (0.028) | |
| Months in IGNITE + jail | −0.058*** | −0.058*** | −0.077*** | −0.081*** |
| (0.020) | (0.020) | (0.020) | (0.020) | |
| Complier control mean | 0.540 | 0.540 | 0.375 | 0.375 |
| Design controls | Yes | Yes | Yes | Yes |
| Auxiliary controls | No | Yes | No | Yes |
| Observations | 23,756 | 23,756 | 22,307 | 22,307 |
Notes. This table reports reduced-form and IV estimates of effects on weekly major-misconduct incidents in jail (columns (1) and (2)) and three-month recidivism after release (columns (3) and (4)). Reduced-form estimates come from regressions of the outcome on the court-delay instrument interacted with an indicator for whether an individual was booked post-IGNITE. IV estimates come from the specification discussed in the main text. All specifications include the design controls discussed in the main text; columns (2) and (4) also include the auxiliary controls. Control complier means are computed as discussed in footnote 22. Individual-clustered standard errors are reported in parentheses. * p < .10, ** p < .05, *** p < .01.
The table reports large estimated effects of IGNITE exposure on within-jail misconduct and post-release recidivism. On average, one additional month in IGNITE is estimated to reduce weekly major-misconduct incidents by 0.14 and three-month recidivism by 8.9 percentage points. These represent reductions of 25% and 24%, respectively, relative to reported control complier means.22 As in Figure II, we find no effects of additional months in jail on recidivism pre-IGNITE. The combined recidivism effect of months in IGNITE and jail is therefore similar to the estimated IGNITE exposure effect. We find a larger positive effect of months in jail on misconduct pre-IGNITE. The combined misconduct effect of post-IGNITE months-in-jail is therefore smaller than the estimated IGNITE exposure effect (around −5.8 percentage points). We further contextualize our primary IGNITE exposure effect estimates in Section VI.A.
Figure III shows how estimated misconduct and recidivism effects vary over time. We plot IV estimates of IGNITE exposure effects (obtained as in Table III, columns (2) and (4)) for two alternative outcomes: whether an individual experienced any major misconduct by a given week since booking (Panel A) and whether an individual was rebooked by a given month since release (Panel B). Panel A shows that estimated misconduct effects are relatively stable over time, with around a 6 percentage point reduction in misconduct risk in any given week since booking. In contrast, Panel B shows that estimated recidivism effects grow steadily over time—to around a 14 percentage point reduction in one-year recidivism post-release.
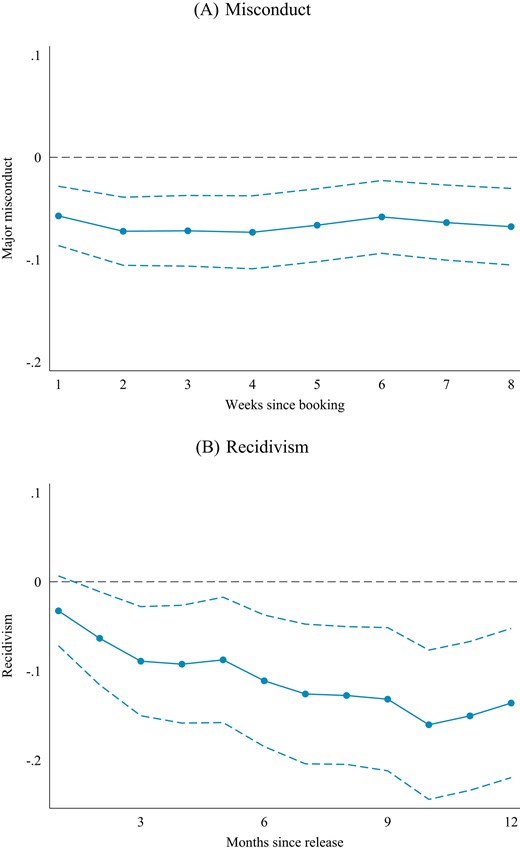
Misconduct and Recidivism Effects over Time
This figure plots estimated IGNITE exposure effects on the probability of involvement in major misconduct in t weeks since booking (Panel A) and the probability of ever being rebooked within t months of release (Panel B) for |$t=1,\ldots ,12$|. All specifications include the design and auxiliary controls discussed in the main text. Blue dashed lines indicate 95% confidence intervals derived from individual-clustered standard errors.
Online Appendix Figures XIV and XV explore heterogeneity in our baseline misconduct- and recidivism-effect estimates by individual demographics, prior-offense status, high versus low predicted lead exposure from the Flint water crisis, and predicted recidivism risk.23 Specifically, we estimate versions of equation (6) that (i) add as treatments interactions of the months-in-IGNITE or months-in-jail treatments with bins of observable characteristics, (ii) add to the instrument list interactions of |$(Z_i,Z_i\times P_i)$| with the same bins, and (iii) add the bin dummies as controls. The figures plot resulting estimates of bin-specific months-in-IGNITE and months-in-jail effects, which are valid under conditional versions of our main identifying assumptions. Overall, we find roughly similar effect estimates across demographic groups, prior-offense status, and predicted lead exposure (see Online Appendix Figure XIV). However, we find meaningful heterogeneity by predicted recidivism risk (see Online Appendix Figure XV): recidivism reductions are much larger for individuals in the top quartile of predicted risk, both in percentage point terms and as a percentage of control complier means (38%, compared with 24% in the full sample).
Estimated effects on alternative recidivism and misconduct measures, along with other related outcomes, are shown in Online Appendix Table IX. Panel A shows a significant reduction in the three-month probability of an individual being recharged and a (not statistically significant) reduction in the three-month reconviction probability. We find no significant effect of IGNITE on whether a person is rebooked through a probation violation. We find significant IGNITE effects on the rate of weekly serious violent misconduct within jail (such as threatening or inflicting bodily harm or escaping) but no effect on minor misconduct. Similarly, we find that the significant IGNITE recidivism effects are driven by violent offenses.
Online Appendix Table IX, Panel B shows no significant effects of IGNITE exposure on whether an individual is released on tether, released on bail, sentenced to prison, convicted, or released to a rehabilitation center. The lack of effects here is unsurprising because pretrial judges are not allowed to consider in-jail misconduct. Judges are also not provided such information by custody staff prior to making pretrial, conviction, or sentencing decisions. The large post-release recidivism effects we find in Table III thus do not appear to be mediated by the channels in Online Appendix Table IX, Panel B (e.g., incapacitation effects). We also find no effects of IGNITE exposure on suicide attempts or other medical incidents within jail, in contrast to the large major-misconduct effect estimates in Table III.
V.B. Robustness Checks
As discussed, the balance checks and trend analyses in Tables I and II and Figure II help support our IV strategy. Here we discuss a number of additional robustness checks in Table IV. Online Appendix Table X summarizes these and other checks of potential concerns with our baseline identification strategy.
Robustness Checks
| Misconduct | Recidivism | |
|---|---|---|
| (1) | (2) | |
| Baseline specification | −0.134*** | −0.089*** |
| (N = 23,756) | (0.032) | (0.031) |
| High predicted risk sample | −0.131 | −0.246*** |
| (N = 5,938) | (0.085) | (0.093) |
| Misconduct not involving others | −0.086*** | |
| (N = 23,756) | (0.023) | |
| Jail crowding × delay control | −0.120** | −0.073* |
| (N = 23,756) | (0.047) | (0.038) |
| Time trend × delay control | −0.144* | −0.157 |
| (N = 23,756) | (0.086) | (0.120) |
| Excluding COVID period | −0.322*** | −0.197** |
| (N = 20,919) | (0.115) | (0.090) |
| Including circuit court delay | −0.067*** | −0.051*** |
| (N = 23,756) | (0.016) | (0.015) |
| Fiscal crisis/holiday delays only | −0.105*** | −0.090*** |
| (N = 23,756) | (0.035) | (0.034) |
| Multiple delays per day | −0.133*** | −0.088*** |
| (N = 23,756) | (0.033) | (0.031) |
| Multiple delay events control | −0.133*** | −0.082** |
| (N = 23,756) | (0.032) | (0.032) |
| Non-IGNITE hours misconduct | −0.132*** | |
| (N = 23,756) | (0.032) | |
| Non-tablet hours misconduct | −0.107*** | |
| (N = 23,756) | (0.028) |
Notes. This table summarizes robustness checks for the primary IV estimates of months-in-IGNITE effects on weekly major misconduct and three-month recidivism. The first row reports estimates from our baseline specification (Table III, columns (2) and (4)). The second row restricts the sample to individuals with the top quartile of predicted recidivism risk. The third row estimates effects on rates of weekly major misconduct not involving other individuals. The fourth row includes a measure of jail crowding interacted with the court-delay instrument as controls. The fifth row adds a linear time trend interacted with the court-delay instrument as controls. The sixth row excludes observations from March 2020 to May 2021. The seventh row adds circuit court delays to define the instrument. The eighth row uses only delays associated with fiscal crises or within two weeks before or after a federal holiday to define the instrument. The ninth row only uses delays on days with three or more rescheduling events to define the instrument. The tenth row controls for an individual experiencing two or more court delays. The eleventh row estimates effects on rates of weekly major misconduct restricting to times of day with no IGNITE programming. The twelfth row estimates effects on rates of weekly major misconduct restricted to times of day with no tablet access. Individual-clustered standard errors are reported in parentheses. * p < .10, ** p < .05, *** p < .01.
One category of potential concerns stems from the COVID-19 pandemic. Major pandemic policy responses occurred between March 2020 (the start of lockdowns) and June 2021 (when vaccines were first widely distributed), which overlaps with the September 2020 launch of IGNITE.24 Genesee and Saginaw Counties saw similar COVID case and death rates (see Online Appendix Figure XVII). The counties also experienced similar closures and phased reopenings under the Michigan Supreme Court’s Administrative Order no. 2020-14.25 For example, in Genesee County, the district court was closed from the end of March 2020 and reopened intermittently from June 2020 onward with limited in-person activities, until fully reopening to the public on June 28, 2021. Sheriffs across the state also reduced jail populations during the pandemic, following state guidance to grant early releases to those who do not pose a public safety risk, as well as exercising their own discretion not to book those charged with nonviolent offenses.26
Given these changes in policies, one might imagine that jailed individuals were of relatively higher criminal risk (if lower-risk individuals were released to reduce jail populations), that misconduct rates declined simply because individuals were more segregated in the jail (due to quarantine protocols), that the effects we find are driven by a change in jail crowding, or that the pandemic and related policies more broadly affected how misconduct and recidivism outcomes were measured. For the first concern, it is reassuring that we in fact find larger recidivism effects among individuals with high levels of predicted recidivism risk (recall Online Appendix Figure XV). For the other concerns, Table IV reassuringly shows that we find significant effects on misconduct not involving others (e.g., counterfeiting or forgery) and that we obtain qualitatively similar misconduct and recidivism estimates when controlling for a time trend or a measure of jail crowding at booking, interacted with the court-delay instrument, or when altogether excluding March 2020 to June 2021 from the analysis sample (though these estimates are noisier). We show in Section V.C that (i) recidivism rates declined in Genesee County around September 2020 relative to Saginaw County, despite both counties being subject to the same statewide COVID-19 protocols, (ii) that the same IV specification deployed in Saginaw County finds no placebo IGNITE effects, and (iii) that we obtain similar estimates in an alternative difference-in-IV specification that compares Genesee and Saginaw Counties in the post-IGNITE period (when jail crowding exhibited similar trends). Together, these checks suggest our findings are not driven by changing pandemic conditions.
A second category of concerns is violations of as-good-as-random instrument assignment. One might be concerned, for example, that some district court delays are initiated by the incarcerated person and thus are potentially endogenous. Reassuringly, Table IV shows that we obtain similar estimates when using alternative definitions of the instrument that are less susceptible to manipulation: that is, when including circuit court delays, restricting to fiscal crisis delays and delays around federal holidays, or restricting to delays occurring on days with multiple court delays across different individuals. Online Appendix Figure XIX, Panel A gives further evidence that delays are not self-initiated. We find that the probability an incarcerated individual sent a Kites message with a communication or court-related request (using the words talk, speak, need, can, please, court, or judge) jumped in the four weeks after the COVID-induced court closure on March 17, 2020. Panel B shows no such increase in an analogous event study one year before. Together with the balance checks in Table I, these checks broadly support the view that court delays are as good as randomly assigned.
A third category of concerns focuses on the IV exclusion restriction. Even when delays are as good as randomly assigned, one might be concerned that they have direct effects on misconduct or recidivism by, for example, increasing an individual’s frustration with the criminal justice system. Table IV shows we obtain similar estimates when controlling for whether an individual experienced multiple court delays, as one proxy for such frustration. Recall that our baseline IV approach allows for any direct effects of the instrument provided they are similar in the pre- and post-IGNITE periods. Therefore, any time-invariant “frustration effect” would be differenced out and would not bias our IGNITE effect estimates. In Section V.C we discuss checks using alternative differencing strategies, which are valid under different or weaker exclusion restrictions.
A final concern, specific to the jail-misconduct outcome, is that IGNITE participation or access to tablets through the program simply occupied the time that person would have otherwise spent engaging in misbehavior. In other words, IGNITE might have reduced within-jail misconduct simply via an within-jail “incapacitation” effect. Reassuringly, Table IV shows we obtain similar misconduct effects when restricting to times of day when there was no IGNITE programming as well as to hours when tablets were not available for entertainment.
V.C. Alternative Identification Strategies
Table V shows we obtain similar recidivism effect estimates from alternative difference-in-IVs specifications that use Saginaw County as a control group in the post-IGNITE period.27 Column (1) presents our baseline estimates from Genesee County. Column (2) estimates equation (6) with data from both counties in the post-IGNITE period only, instrumenting |$(M_i^I,M_i^J)$| with |$(Z_i,Z_i\times S_i)$|, where |$S_i\in \lbrace 0,1\rbrace$| indicates that individual i was booked in Saginaw County, and including the baseline design and auxiliary controls (with |$S_i$| replacing |$P_i$|). As in our baseline analysis, we find no recidivism effect of increased time in jail in the absence of IGNITE but a large negative recidivism effect from IGNITE exposure. The −12.9 percentage point IGNITE effect is close to the baseline −8.9 percentage point effect, replicated in column (1). In column (3), we assess whether our main Genesee County estimates are confounded by simultaneous regional changes in jail or rearrest policy by estimating our main specification in Saginaw County only. We obtain a tight null estimate of the change in time-in-jail effects before and after September 2020. Finally, column (4) subtracts this Saginaw County placebo check from our baseline over-time IGNITE exposure effect in a “double” difference-in-IVs specification, showing again a large recidivism effect of −9.4 percentage points. Notably, this specification weakens our baseline identifying assumptions by differencing out any direct time (or county) effects that would otherwise confound the estimates in columns (1) or (2).
Alternative Difference-in-IVs Estimates of Recidivism Effects
| Difference-in-IVs | ||||
|---|---|---|---|---|
| Post vs. pre, | Post, Genesee | Post vs. pre, | Double | |
| Genesee (baseline) | vs. Saginaw | Saginaw | diff-in-IVs | |
| (1) | (2) | (3) | (4) | |
| Months in IGNITE | −0.089*** | −0.129*** | −0.094*** | |
| (0.031) | (0.030) | (0.032) | ||
| Months in jail | 0.008 | 0.017* | 0.006 | |
| (0.028) | (0.009) | (0.005) | ||
| Months in jail × post | 0.005 | |||
| (0.008) | ||||
| Observations | 22,307 | 7,987 | 15,877 | 38,184 |
Notes. This table reports IV estimates of effects on three-month recidivism with alternative IV specifications. Column (1) reports the baseline estimates from Table III, column (4). Column (2) reports estimates from a specification estimated in the post-IGNITE period comparing Genesee County and Saginaw County, as described in the main text. Column (3) estimates our baseline specification in Saginaw County, with the months-in-jail × post treatment replacing the months-in-IGNITE treatment in Genesee County. Column (4) reports the difference in the estimated coefficient on months in IGNITE in column (1) and the estimated coefficient on months in jail × post in column (3). All estimates include the design and auxiliary controls discussed in the main text. Individual-clustered standard errors are reported in parentheses. * p < .10, ** p < .05, *** p < .01.
Online Appendix Figure XXI shows estimates from an alternative difference-in-differences strategy, which compares overall trends in three-month recidivism rates from Genesee County to corresponding trends from neighboring Saginaw County. We plot event-study coefficients from regressing the recidivism of individuals booked in either county on a Genesee County indicator interacted with the individual’s booking date relative to December 2019: the period after which a nontrivial share of individuals booked in Genesee County were exposed to IGNITE starting in September 2020 (see Online Appendix Figure XXII). Recidivism trends are similar between the two counties prior to this period but diverge thereafter, with individuals booked in Genesee County seeing an average reduction in recidivism of around 3 percentage points (see Online Appendix Table XI), which translates to a reduction of around 11% for one month of exposure to IGNITE.28 Though less fine-grained than our IV strategy, the event study helps build further confidence in its core logic with flat pre-trends showing no unusual pre-IGNITE recidivism dynamics in Genesee County.
VI. Contextualization and Mechanisms
VI.A. Social Cost Effects
Online Appendix Table XII translates our main recidivism effect estimates into estimates of the effect of IGNITE exposure on post-release social costs of crime and incarceration. Specifically, we estimate equation (6) with an outcome that measures either the cost of crimes individuals are rebooked for or the cost of incarcerating individuals for these rebookings in jail, at different horizons. We follow the most conservative cost of crime estimates in Miller et al. (2021) and estimate the cost of jailing an individual at $70 a day.29 For our baseline three-month recidivism horizon, we find that one additional month of IGNITE exposure decreases the social cost of crime by around $2,671 per person and decreases the cost of incarceration in jail by around $283 per person. As in Figure III, these estimated effects grow over time, to a per person-month reduction of around $5,340 for the cost of crime and around $1,945 for the cost of incarceration over a horizon of 12 months. These large 12-month cost reductions, totaling $7,285 per person-month of IGNITE exposure, are especially notable given stable spending in Genesee County Jail before and after IGNITE.
VI.B. Literature Comparison
Online Appendix Figure XXIII compares our baseline recidivism effect estimates to other quasi-experimental estimates in the literature. Panel A compares the estimated relative effect of IGNITE exposure on one-year recidivism to comparable relative effect sizes of other rehabilitative programs for justice-involved individuals. When possible, we compute one-month effects of these programs by assuming linearity. See Online Appendix F for details on the effect size calculations.
Our main one-month IGNITE exposure effect (a 15% reduction in one-year recidivism) is comparable to the effects from other rehabilitative programs, including CBT programming (Heller et al. 2017; Arbour 2022), open prisons (Mastrobuoni and Terlizzese 2022), diversion (Mueller-Smith and Schnepel 2021; Augustine et al. 2022), and restorative justice conferencing (Shem-Tov, Raphael, and Skog 2022). Notably, the 95% confidence interval from our IV specification overlaps with that of Bhuller et al. (2020) for incarceration in Norway. We also compare our months-in-jail estimates to incarceration effects found in other studies of jail and prison (Panel B) and present estimates from programming geared toward high-risk (but not necessarily justice-involved) individuals for further context (Panel C). Together, these comparisons show that IGNITE—deployed in a U.S. jail among an especially high-risk adult population—generates similar reductions in recidivism as programming in other correctional environments and countries.
VI.C. Potential Mechanisms
Given the educational nature of IGNITE programming, one obvious candidate driver of effects is increased literacy and numeracy. Incarcerated people tend to enter IGNITE with very low reading and math achievement as measured by CASAS scores. Figure IV shows that the distribution of pre-assessment math and reading scores are centered around a fifth- to sixth-grade equivalence and a sixth- to seventh-grade equivalence, respectively. These relatively low scores are comparable to those of the general population of students in the Mt. Morris Adult Education program.
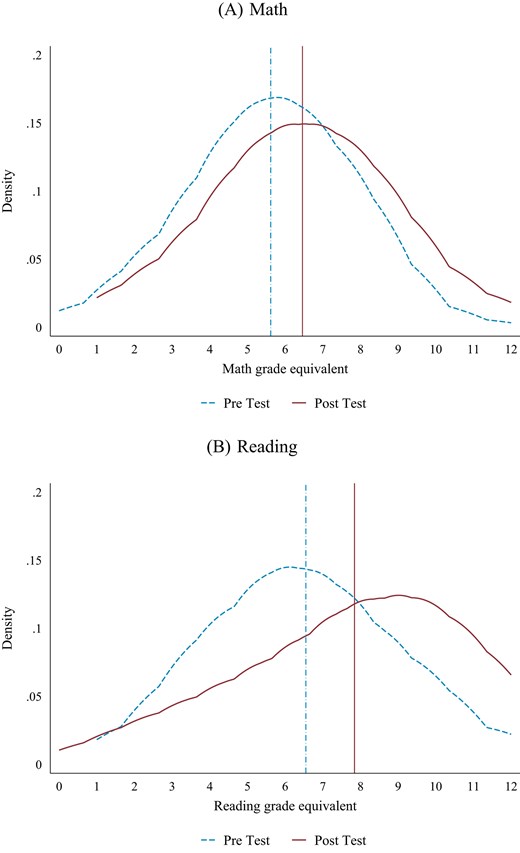
Pre and Post Test Performance
This figure plots the distribution of math (N = 439) and reading (N = 309) test scores before and after IGNITE program participation, of individuals who completed both tests. Scores come from Comprehensive Adult Student Assessment Systems exams administered by Mt. Morris Consolidated Schools and are normalized to standard grade equivalents. Each distribution is estimated with a Gaussian kernel and 1.5 times the rule-of-thumb bandwidth.
A comparison of test scores before and after an individual’s enrollment in IGNITE programming suggests substantial improvements in math and reading skill. Figure IV shows that on average, individuals gained the equivalent of around one grade level in both subjects. These gains also appear widespread: the full distribution of post-assesment scores is shifted to the right in both subjects, with a marked tilt toward higher grade equivalencies in reading. Although these gains may not solely reflect human capital accumulation (for example, because of the possibility of an increased routine and reduced distraction in IGNITE improving individuals’ test-taking skill), they are nevertheless suggestive of improved educational achievement. The magnitude of achievement gains are massive even when compared with some of the most effective educational interventions documented in recent quasi-experimental literatures (e.g., Cohodes and Roy 2023) and are consistent with policy makers’ views that IGNITE’s educational programming was a broad success (Erwin 2023).
However, institutional knowledge and our first-stage estimates suggest that formal educational programming is not the full story. As noted in Section II.B, IGNITE was intended to create significant cultural change in the jail, which could potentially enhance formal education and even possibly affect people who did not participate in programming. Our court-delay instrument only increased exposure to IGNITE by around two weeks on average, making it unlikely that the misconduct- and recidivism-reductions effects came from added instruction time alone. The fact that our recidivism estimates are driven by reductions in violent crime suggests that increased human capital and earnings potential from IGNITE is not the only mechanism at play. To explore the possible role of a within-jail cultural shift, we turn to our survey analyses.
Online Appendix Table XIII reports the effect of IGNITE exposure on impressions of law enforcement among community members and the formerly incarcerated. IGNITE exposure is defined as an indicator for whether the survey respondent or someone in their close social network served time in Genesee County Jail after the program was launched in September 2020. The primary outcome is respondents’ views of law enforcement. We find that IGNITE exposure predicts a positive view: agreement with the phrase “Law enforcement looks out for me and my community” is 23 percentage points higher for IGNITE-exposed respondents, which is roughly 70% of the unexposed mean. Column (2) moreover shows this effect is driven by respondents who had a longer IGNITE exposure. Columns (3)–(6) show results on post-incarceration outcomes that were elicited from the roughly 70% of respondents that were justice-affected. Here we find positive but insignificant effects of IGNITE on engagement in positive activities (defined as employment, education, or caretaking) and no effect on hopefulness about the future.30
The more favorable views of law enforcement by formerly incarcerated people are mirrored by more favorable views of educational programs for incarcerated individuals by custody staff at Genesee County Jail. Staff who regularly interact with IGNITE participants are 34 percentage points more likely to view education in jails as worthwhile (see Online Appendix Table XIV and Online Appendix Figure XXIV).31 In contrast, there is no overall effect on job satisfaction (Online Appendix Table XVI). Exposure to IGNITE participants is well-balanced among respondents (Online Appendix Table III), again supporting a causal interpretation of these findings.
Online Appendix Figure XXV further supports the apparent IGNITE culture change, via a sentiment analysis of Kites messages sent by incarcerated people to custody staff before and after September 2020. We use the NRC Word-Emotion Association Lexicon from Mohammad and Turney (2010), which labels each English word as being associated with up to two sentiments (negative and positive) and up to eight emotions (anger, anticipation, disgust, fear, joy, sadness, surprise, and trust). Panel A shows a significant increase in the share of Kites words categorized as having only positive sentiment of around 4 percentage points or 14% higher than the pre-IGNITE level. The share of words categorized as having only negative sentiment and of words categorized as having “neutral” sentiment (either both positive and negative or neither positive nor negative) fell after IGNITE. Panel B further shows that shares of words in Kites messages associated with anticipation, anger, fear, and sadness fell after IGNITE, while the share of words associated with trust increased. Together with the survey analysis, these qualitative findings support anecdotal evidence of a broad shift in Genesee County Jail culture for both incarcerated people and staff.
VII. Conclusion
We provide the first quasi-experimental evidence that educational programming in U.S. county jails can reduce post-release recidivism and potentially mitigate the kinds of incarceration cycles that have long stymied criminal justice policy making. Exposure to the IGNITE program dramatically and persistently reduces within-jail misconduct and post-release recidivism, with similar effects by race, sex, age, and prior-offense status. We find that one additional month of IGNITE exposure reduces the social cost of crime and incarceration by at least $7,285 per person in the year after their release. Qualitative evidence suggests a broad cultural change in the jail as a mechanism, resembling rehabilitation-oriented policies found outside the United States.
We expect the IV strategy we develop for estimating IGNITE exposure effects to prove useful in other settings where idiosyncratic delays in administrative policy extend an individual’s time exposed to an institution before and after a policy reform. For example, one could imagine evaluating the effects of reforms on health care or other benefit programs by comparing people whose appointments are and are not affected by idiosyncractic rescheduling in the pre- and post-reform periods. Our empirical framework shows how such variation can be leveraged with standard IV assumptions and a novel restriction on over-time effect homogeneity, which can be probed empirically.
An important question for future research is whether the large IGNITE effects we document can be replicated in other U.S. jails. Presently the National Sheriffs Association is committed to bringing IGNITE to all jails in the country, though this process is still at an early stage. As is often the case with scaling-up attempts, rigorous evaluation of this process will be essential (Duflo 2004), potentially using similar tools as those developed here. But broadly our findings suggest that—as in distressed Flint, Michigan—something can work.
Data Availability
The data underlying this article are available in the Harvard Dataverse, https://doi.org/10.7910/DVN/YYDXEJ (Alsan et al. 2025).
Footnotes
We thank Larry Katz, Nathan Nunn, and five anonymous referees for helpful comments and suggestions. We also thank Mauricio Cáceres Bravo, Jennifer Doleac, Sara Heller, Adriana Lleras-Muney, Matthew Mizel, Michael Mueller-Smith, Matthew Pecenco, Evan Rose, Nico Rotundo, Yotam Shem-Tov, and seminar participants at Harvard University, Opportunity Insights, the University of Connecticut, the University of Michigan, the NBER Economics of Crime Working Group, the NBER Economics of Education Program, and the University of California Los Angeles for helpful comments. We are grateful to Meghan Beal at the National Sheriffs’ Association, Superintendent Mickie Kujat and Principal Brad Basista of Mt. Morris Consolidated Schools, and the administration of Genesee County and Saginaw County Jails—especially Deputy Annie Bueche, Undersheriff Mike Gomez, Major Jason Gould, Lieutenant Ebony Rasco, and Sheriff Christopher Swanson. We gratefully acknowledge funding from Arnold Ventures (grant 23-09971). Xingyou Ye, Miguel Purroy, Meera Mody, Anne Fogarty, Lucia Gomez Llactahuamani, Luyuan Jia, Jeongmook Lim, and Michelle Wu provided expert research assistance.
For example, in 2020, a medium-security state prison outside of Philadelphia established a housing unit known as “Little Scandinavia,” with features modeled after Norway’s incarceration model (Strange 2023).
For example, Norway spends around $93,000 each year per prisoner in its system (Beaumont 2023). Genesee County Jail spends around $70 per incarcerated individual per day, or $25,500 per year (Finley 2019).
As of January 2025, 20 jails in 13 states have adopted IGNITE and several more have begun adoption.
For example, our monotonicity assumption requires that court delays weakly increase an individual’s time in jail—which seems more plausible than the often critiqued assumption of monotonic decision-making across judges (Mueller-Smith 2015; Frandsen, Lefgren, and Leslie 2023).
Closer in context is Bayer, Hjalmarsson, and Pozen (2009) and Mastrobuoni and Terlizzese (2022), who use quasi-random variation in the timing and duration of incarceration to estimate within-facility peer effects and the effects of prison conditions, respectively. We differ in instrumenting jail time with external delays.
In Michigan, individuals can be assigned release on personal recognizance or release on unsecured bond, money bail (10%, cash or surety), or denied bail altogether for charges like murder, treason, or other violent felonies. See Mich. Ct. R. §6.106.
According to Harlow (2003), 60% of U.S. jails reported any educational or training programming in its last census (1999); the quality and accessibility of such programming varies substantially and often depends on the discretion of jail administrators. The programming itself is generally carried out in a small classroom of dedicated space with capacity and staffing constraints.
See Online Appendix B.D for a more detailed accounting of programming costs. We estimate an average cost of $403–$982 per individual-year, before factoring in donated materials and tablet revenue.
Participating individuals had access to tablets for around six hours daily: one hour during the day after the second session of IGNITE programming and after dinner from 5 pm to around 10 pm. In practice, there were always enough tablets to go around to participating individuals. Individuals not participating in IGNITE might play games (e.g., cards or dominoes) or otherwise socialize during tablet times.
Delays can also stem from changes in courtroom availability. For example, a Genesee County District Court courtroom closed temporarily in 2023 because of a sewage leak (Jeltema 2023).
Officers that make arrests in the community are different from custody officers that run IGNITE in the jail, mitigating concerns of bias from changing rearrest behavior. See Online Appendix C for more details.
This measure of recidivism captures all instances of individuals being arrested and brought to jail to begin the paperwork and fingerprinting process, including those who are immediately released. The measure omits the small set of cases where an officer issues an “appearance ticket” for the individual to appear in court.
As discussed in a report by the Department of Justice as part of its Community Policing and Procedural Justice in Jails initiative (see https://portal.cops.usdoj.gov/resourcecenter/content.ashx/cops-w0975-pub.pdf): “The IGNITE program also emphasizes procedural justice. In designing the program, Sheriff Swanson was committed to ensuring the inclusion of community leaders, community activists, and individuals dedicated to criminal justice reform. Engaging with and including members of the community from wide-ranging backgrounds has helped cultivate a relationship of trust between the sheriff’s office and the community.”
While reported within jail and therefore subject to some misreporting concerns, the shares of major misconduct and medical incidents are roughly constant over time. We also find that the schedule outlined in Online Appendix Figure VI is roughly adhered to as measured by the floor-specific login times on Chromebooks (see Online Appendix Figure XI).
Formally, |$\omega _i^{Pre} = \frac{M_i^J(1)-M_i^J(0)}{E[M_i^J(1)-M_i^J(0)\mid P_i=0]}$|, where |$M_i^J(z)$| denotes individual i’s potential time in jail when |$Z_i=z$| and |$\omega _i^{Post}=\frac{M_i^I(1)-M_i^I(0)}{E[M_i^I(1)-M_i^I(0)\mid P_i=1]}$|, where |$M_i^I(z)$| denotes individual i’s potential time in IGNITE when |$Z_i=z$|. See Online Appendix E.A for derivations of equations (2) and (3).
Unlike a conventional parallel-trends assumption, equation (4) imposes no model on untreated potential outcomes |$Y_i(0)$|. Our strategy to avoiding omitted-variable bias from |$Y_i(0)$| can instead be viewed as “design-based” (Borusyak and Hull 2024), leveraging the as-good-as-random assignment of court-delay shocks.
The Online Appendix model continues to impose additive separability of time-in-jail and time-in-IGNITE effects, while allowing for arbitrary effect heterogeneity for these two treatments individually (i.e., fully relaxing the linear dose-response form of equation (1). Without separability, simple differencing as in equation (5) may not suffice to fully isolate IGNITE effects from non-IGNITE time-in-jail effects, although this is less of an issue for recidivism outcomes, where pre-IGNITE time-in-jail effects are small and insignificant. In practice, we find minimal effect heterogeneity across many observables including predicted time in jail—suggesting the baseline linear model gives a reasonable approximation.
Online Appendix Tables V and VI show a precise null relationship between the instrument and predicted recidivism in the pre- and post-IGNITE periods separately, with only slight statistical imbalance on age and race in the pre-IGNITE period and on having a public defender in the post-IGNITE period. Online Appendix Table VII further checks for differential attrition, which could introduce bias even when delays are as good as randomly assigned. Reassuringly, we find that court delays do not cause individuals to exit our baseline analysis sample at a significantly higher rate. For longer windows there is some evidence of differential attrition but effect sizes are small. With 12-month recidivism, for example, delays are found to make individuals 0.4 percentage points less likely to stay in the sample off a baseline follow-up rate of 99%.
Specifically, we report estimated means of individual characteristics weighted by the same measures of compliance status that underlie the IV estimates of jail-exposure effects pre- and post-IGNITE. See Online Appendix E.C for details.
Similarly, Online Appendix Figure XII shows that the weights our baseline IV specification puts on different margins of exposure time are relatively similar pre- and post-IGNITE. See again Online Appendix E.C for details on these calculations. We will show that effects are homogeneous across individuals with different predicted time in jail, reducing concerns about any pre-post differences in the exposure-time weights.
The exclusion restriction in this specification would generally rule out within-jail spillovers across individuals who do and do not participate in IGNITE. Our preferred exposure-treatment specification allows for and accounts for such spillovers, which may be important given the broad cultural change in the jail.
Control complier means come from IV regressions of |$Y_i\cdot \mathbf {1}[M_i^J\lt m]$| on |$\mathbf {1}[M_i^J\lt m]$| instrumenting by |$Z_i$| with design controls. Following Online Appendix E.C, this estimates average outcomes when individuals spend less than m months in jail. We set m to correspond to a “control” condition of less than three days in jail.
Lead exposure is predicted from an individual’s residential postal code. We predict recidivism risk by a logit regression on the auxiliary controls in the 2015 hold-out sample. Online Appendix Figure XVI shows we do not find heterogeneity by predicted time in jail, constructed analogously by OLS.
Court delays generally increased in response to pandemic-related responses. Before March 2020, 34% and 58% of cases experienced a court delay in Genesee and Saginaw, respectively. After March 2020, 60% and 53% of cases experienced court delays in Genesee and Saginaw.
See Michigan Governor’s Executive Order 2020-189. Genesee County Jail officials stated that “We never shut our jail down for assault cases … But if someone was arrested on a misdemeanor or non violent crime, we would not take them to jail” (https://thecitizenonline.com/sheriff-no-covid-19-in-county-jail-so-far/). Similarly, Saginaw County Jail officials stated that “The doors are still open for violent offenders, but we’ve drastically reduced the number of people coming through here to get booked” (https://www.mlive.com/coronavirus/2020/04/jails-in-saginaw-and-bay-counties-see-drop-in-inmate-population-amid-coronavirus.html). As a result, the Genesee County Jail population declined by around 20% at the onset of the pandemic before recovering to prepandemic levels in fall 2020; Online Appendix Figure XVIII shows trends in jail populations in both counties.
Online Appendix Figure XX presents crime rates in Genesee and Saginaw county, showing minimal pre-trends.
Individuals in Genesee County spend around 1.5 months in jail both pre- and post-IGNITE (Online Appendix Tables V and VI), average three-month recidivism is around 19 percentage points at baseline (see Online Appendix Table XI), and |$\frac{(3\, {\rm percentage\, points}/1.5 \,{\rm months})}{19 \,{\rm percentage\, points}}\,\approx 11\%$|.
The cost of crime calculation divides future crimes into DUIs, drug offenses, motor vehicle offenses, persons offenses, property offenses, public order offenses, weapons offenses, and other offenses. Within each crime type, we take the lowest social cost estimate from Miller et al. (2021) to provide the most conservative estimate; for example, we use the cost estimate for assault instead of murder for persons offenses.
Online Appendix Table II shows that IGNITE-exposed individuals are observably similar to other individuals in the survey, supporting the interpretation of these coefficients as estimates of causal effects.
Online Appendix Table XV lists some representative answers to a free-response question asking staff for ways IGNITE has changed their experience working in Genesee County Jail.
