


Abstract
A new experimental method to search for the double Gamow–Teller giant resonance using the double charge exchange (|$^{12}$|C, |$^{12}$|Be(0|$^{+}_{2}$|)) reaction is proposed and applied, for the first time, to a |${}^{48}$|Ca target at 250 MeV/nucleon using a |$^{12}$|C primary beam at the RIKEN RI Beam Factory. The events with double isospin- and spin-flip in |${}^{48}$|Ca were selected by measuring decay |$\gamma$|-rays from |${}^{12}$|Be(0|$^{+}_{2}$|). A forward-peaking component in the measured double-differential cross sections was observed with an integrated |$0^\circ$| cross section of |$1.33 \pm 0.12$| μb/sr in the excitation energy region below 34 MeV in |${}^{48}$|Ti. Reaction analyses based on distorted-wave Born approximation calculations and the multipole decomposition based thereon indicate that |$\sim$|40% of the forward-peaking component originates from the double Gamow–Teller transitions. The transition strength of the double Gamow–Teller transition is evaluated from the extracted forward-peaking cross section.
1. Introduction
Nuclear giant resonances (GRs) are highly collective excitations in nuclei in which an appreciable fraction of nucleons move coherently. GRs are interpreted as nuclear oscillations in coordinate, spin, and isospin spaces and are often regarded as excitations of phonons with corresponding quantum numbers. The emergence of GRs is a general property of nuclei and GRs can even be built on excited states as well as on the ground state [1]. Among such GRs, those built on top of other GRs are regarded as multiphonon states. Through the experimental studies at the Los Alamos Meson Physics Facility (LAMPF) using the double charge exchange (DCX) (|$\pi ^{+}$|, |$\pi ^{-}$|) and (|$\pi ^{-}$|, |$\pi ^{+}$|) reactions, non-spin-related two-phonon states, such as the double isobaric analogue state (DIAS), the double isovector dipole resonance, and the dipole resonance built on the isobaric analogue state, were observed [2]. The energies of the two-phonon states observed in these studies were found to be approximately equal to the sum of the energies of two constituting phonons, while their widths are close to the quadratic sum of the individual widths. This supports the harmonic picture in which the individual phonons behave independently.
The double Gamow–Teller giant resonance (DGTGR), which is the Gamow–Teller GR built on another Gamow–Teller GR, is one of the two-phonon states. The DGTGR remain unobserved experimentally though its possible existence was first proposed by Auerbach, Zamick, and Zheng in 1989 [3]. Theoretically, it is a natural extension of two-phonon giant resonances such as double isobaric analogue resonances and double giant dipole resonances. DGTGR is characterized by the double Gamow–Teller (DGT) operator of |$(\boldsymbol{\sigma }\tau _{\pm })^{2}$|, which consists of the GT|$^{\pm }$| operator of |$\boldsymbol{\sigma }\tau _{\pm }$|, where |$\boldsymbol{\sigma }$| and |$\tau _{\pm }$| are the spin and the isospin raising (|$\tau _{+}$|) or lowering (|$\tau _{-}$|) operator, respectively. From the “phonon” viewpoint, it is worth investigating whether the harmonicity also holds for the spin-related mode of DGTGR. The GT operator excites a larger number of microscopic states than non-spin operators, which affects the formation of the collective mode.
Not only DGTGR, but DGT transitions in general are not yet fully understood both experimentally and theoretically. Currently well-established experimental data on DGT are limited to two-neutrino double |$\beta$| decays (2|$\nu \beta \beta$|) in 11 nuclides [4]. Due to the limitation by the Q-value, only transitions to the ground state or low-lying states in granddaughter nuclei are accessible in 2|$\nu \beta \beta$|. The experimentally observed transition strengths of 2|$\nu \beta \beta$| are a tiny fraction (|$10^{-3}\!-\!10^{-4}$|) [4] of the total DGT strength expected from the sum rule [5,6] and the rest of the strength is expected to be located at higher excitation energies, mainly in GR regions [3,6,7]. The close connection between DGTGR and neutrinoless double |$\beta$| decay (0|$\nu \beta \beta$|) has also attracted attention recently [7–9]. The shell-model calculations by Shimizu et al. [7] predict that the centroid energy and the width of the DGTGR are correlated with the nuclear matrix element (NME) of |$0\nu \beta \beta$|, which opens a possibility to constrain the NME using the observed strength distribution of DGTGR.
Conditions required to observe DGTGRs clearly have not been simultaneously fulfilled in previous studies. The first condition is that the probe should induce spin-flip transitions. The pion DCX is not favorable to DGT despite the fruitful results in the non-spin-related mode because the spin of pions is zero. The second is that the probe should induce a GT|$^{-}$|-type transition in the |$N\gt Z$| target to avoid hindrance by Pauli blocking. The third is that the incident energy should be |$\gtrsim$| 100 MeV/nucleon so that the direct reaction is dominant [10] and the reaction theories are reliable. This energy also enhances the ratio of spin-flip to non-spin-flip interaction strength |$V_{\sigma \tau }/V_{\tau }$| in the effective nucleon–nucleon interaction [10,11].
Previously the |${}^{24}$|Mg(|${}^{18}$|O, |${}^{18}$|Ne)|${}^{24}$|Ne reaction in which the transition in the target is of GT|$^{+}$| type was measured at 100 and 76 MeV/nucleon at NSCL-MSU and GANIL, respectively [12]. The extracted differential cross section was a few nb/sr at these energies. The NUMEN project at INFN-LNS [13] adopts the same probe at 15 MeV/nucleon, in which the contribution from other competing processes such as multinucleon transfer is crucial in this energy domain. Their project includes the determination of such contributions and demonstrated their scheme with the transition between |$^{40}$|Ca|$_{\rm g.s.}$| and |$^{40}$|Ar|$_{\rm g.s.}$|. The only case where all three requirements are fulfilled, except for a slightly lower incident energy than 100 MeV/nucleon, is that of the (|${}^{11}$|B, |${}^{11}$|Li) measurements at 70 MeV/nucleon at RCNP, but no clear conclusion on the existence of DGTGR was obtained due to the small yield [14].
In this work, we employ the (|$^{12}$|C, |$^{12}$|Be(0|$^{+}_{2}$|)) reaction at 250 MeV/nucleon. This reaction satisfies all three of the requirements listed above by virtue of the features of an isomeric state of |${}^{12}{\rm Be}$| (excitation energy |$E_{\rm ex}=2.251$| MeV). First, the transition |$\mathrm{^{12}C_{g.s.}\rightarrow ^{12}Be}(0^{+}_{2})$| is regarded as a double spin-flip transition since the non-spin-flip strength with |$\mathrm{^{12}Be}(0^{+}_{2})$| as the final state is exhausted by the transition with its double isobaric analogue partner, namely the |$T=2$| |$\mathrm{^{12}C}(0^{+})$| state at 29.630 MeV [15,16]. The transition from the initial state of |${}^{12}$|C(g.s., 0|$^{+}$|) to the final state of |$^{12}$|Be(0|$^{+}_{2}$|) proceeds mainly through the intermediate of |${}^{12}$|B(g.s., 1|$^{+}$|). Since the total spin parity of the probe undergoes the transition of |$0^+\rightarrow 1^+\rightarrow 0^+$|, the target of total spin |$0^+$| also follows the transition of |$0^+\rightarrow 1^+\rightarrow 0^+$| with spin-flip in each step if the transfer of the orbital angular momentum is 0. Whereas the DGT operator acting on an initial |$0^{+}$| nucleus is capable of exciting |$0^{+}$| and |$2^+$| of final states, the transition to |$0^{+}$| states is emphasized by using this probe.
Another feature of |$^{12}$|Be|$(0^{+}_{2})$| is a larger p-shell component in the wave function than the ground state [17–20], which is manifested in the GT transition strength |$B({\rm GT})$| with the value of |$0.214\pm 0.051$| in the transition from |$^{12}$|B(g.s., 1|$^{+}$|) to |$^{12}$|Be(0|$^{+}_{2}$|), and |$0.184\pm 0.007$| in the transition to |${}^{12}{\rm Be(g.s., 0^{+}_{1})}$|. This originates from the well-known lowering of the |$1s$| orbit in the neutron-rich light nuclei [21,22]. Consequently, we can expect relatively strong double GT|$^{+}$| transitions in the |$\mathrm{^{12}C_{g.s.}\rightarrow {}^{12}B(1^{+})\rightarrow {}^{12}Be}(0^{+}_{2})$| process that, in turn, can be used to induce double GT|$^{-}$| transition in the target.
From the experimental perspective, this reaction has a prominent advantage of the capability of the clear reaction channel identification by measuring |$\gamma$|-rays deriving from |${}^{12}{\rm Be}(0^{+}_{2}$|). The 0|$^{+}_{2}$| state in |${}^{12}$|Be decays into the ground state by emitting an |$e^+e^-$| pair with a lifetime of 330 ns [23,24]. The back-to-back |$\gamma$|-rays from the annihilation of |$e^{+}$| are emitted accompanied by the decay of |$^{12}{\rm Be}(0^{+}_{2})$|. In addition, the long lifetime allows one to detect the delayed |$\gamma$|-rays far downstream from the target with smaller |$\gamma$|-ray background.
We present the result of the first measurement of the double charge exchange (|$^{12}$|C, |$^{12}$|Be(0|$^{+}_{2}$|)) cross section for a |$\mathrm{^{48}Ca}$| target at the RI Beam Factory (RIBF) at RIKEN [25], BigRIPS [26]. We selected |${}^{48}{\rm Ca}$| for a number of reasons. |$\mathrm{^{48}Ca}$| has a doubly closed shell with |$Z=20$| and |$N=28$|, which enables detailed nuclear structure studies. The ab initio calculation with coupled-cluster theory is also progressively developed as represented by the result of a first-principles explanation of the quenching factor [27]. In addition, the single GTGR has been well investigated experimentally [28,29]; thus a comparison between the single and double GR is possible. This enables us to discuss the harmonicity quantitatively by using the observables of the single GTGR as a reference. In the context of providing information on the NME, |${}^{48}{\rm Ca}$| is an important candidate for the experimental search of neutrinoless double |$\beta$| decay because it has the largest Q-value among the double |$\beta$| decaying nuclei [30]. The CANDLES project [31,32] employs |${}^{48}{\rm Ca}$| as a probe to take advantage of this feature.
2. Double charge exchange measurement at RIBF
The search for DGTGR using the (|${}^{12}$|C,|${}^{12}$|Be(0|${}^{+}_{2}$|)) reaction requires a |$^{12}$|C beam at 200–300 MeV/nucleon, a high-resolution magnetic spectrometer, and a system to distinguish the reaction product of |${}^{12}{\rm Be}$| from other lighter |$A/Z=3$| backgrounds. These requirements are fulfilled at the RIBF, where the |$^{12}$|C beam at an intensity of |$\le$|1 pμA is accelerated up to 250 MeV. Figure 1 shows an overview of the beamline. An upstream part of the fragment separator BigRIPS, from the target position (F0) to the fifth focal plane (F5), is used as a magnetic spectrometer [33,34] while the downstream part, from F5 to the eighth focal plane (F8), is used to remove t, |$^{6}$|He, |$^{9}$|Li background particles using degraders. The specification of BigRIPS as a spectrometer is shown in Table 1. Additionally, we can identify |$^{12}{\rm Be}(0^{+}_{2})$| by using the high-efficiency |$\gamma$|-ray detector array DALI2 [35].
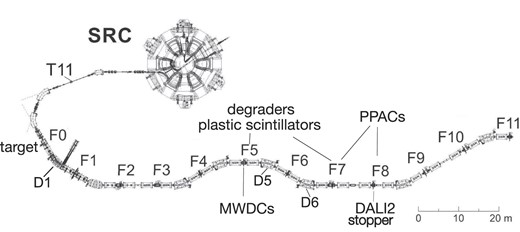
Schematic view of the beamline from the superconducting ring cyclotron (SRC), BigRIPS, and detectors and materials.
Design specifications of BigRIPS as a spectrometer [34].
| Flight length (F0–F5) | 54.916 m |
| Vertical magnification | |$-1.63$| |
| Horizontal magnification | |$-1.82$| |
| Momentum dispersion | 62.0 mm/% |
| Momentum range | |$\pm$|2% |
| Momentum resolution | 3400 |
| Acceptance angle: horizontal | |$\pm$|20 mrad |
| Acceptance angle: vertical | |$\pm$|40 mrad |
| Solid angle | 3.2 msr |
In the present experiment, the energy spread of the primary |${}^{12}{\rm C}$| beam is larger than the energy resolution of 2 MeV required for investigation of GRs. Therefore a dispersion matching optics was adopted. The other crucial point in the present experiment is the angular resolution. In the extraction of the Gamow–Teller (|$\Delta L=0$|) strengths, the momentum-transfer (q) dependence of the experimental cross section is used [10]. For reliable extraction of |$\Delta L=0$| strengths, cross sections at very forward angles are needed. In the present case, the required angular resolution is 0.3|$^{\circ }$|, as discussed in Section 4.
A 250 MeV/nucleon |$^{12}$|C beam was accelerated by the superconducting ring cyclotron (SRC). The typical intensity was 600 pnA, which is limited by the regulation on the total number of particles at the third focal plane (F3) (|$\le$| 10|$^{7}$| pps). The beam intensity was monitored throughout the experiment by counting the number of scattered particles from the primary target (F0) using the coincidence in three plastic scintillation counters. The beam impinged on a foil target of |$^{48}$|Ca (95.23% isotopic enrichment) with a thickness of 10.3 mg/cm|$^{2}$| placed at F0. The |$^{48}$|Ca foil was sandwiched by 4 μm thick graphene sheets to dissipate the heat due to the high-intensity beam and to prevent oxidation and nitridization of |$^{48}$|Ca during the installation process. In order to evaluate the contribution from the graphene sheet, we also carried out measurements with a natural carbon target of 7.6 mg/cm|$^{2}$| thickness made of stacked graphene sheets.
The emitted |$^{12}$|Be from the target was momentum-analyzed by the magnetic system between F0 and F5. At the momentum dispersive focal plane of F5, the trajectories of the scattered |$^{12}$|Be were measured by two sets of multiwire drift chambers (MWDC1, MWDC2). The MWDCs were operated at a low pressure of 10 kPa to minimize multiple scattering by their operation in a vacuum [36]. The specification of the MWDCs is shown in Table 2. In order to reduce impact of microstructures on the tracking efficiencies, the MWDCs consisted of 9 successive layers of X–X′–X′′, U–U′–U′′, and V–V′–V′′, in each of which the wires were staggered by 1/3 cell. The position resolution of each plane was 0.3 mm and the resolutions of the position determined by tracking were 0.1 mm for the horizontal and 0.2 mm for the vertical directions, respectively. In addition to the timing information from each MWDC wires the time-over-threshold information [37] was recorded for Z discrimination of the incident particles. Other charged-particle detectors include plastic scintillators at F5 (a thickness of |$5~{\rm mm}$|), the seventh focal plane (F7) (|$5~{\rm mm}$|), F8 (|$1~{\rm mm}$|), and parallel plate avalanche counters (PPACs) [38] at F7 and F8.
Specification of MWDCs.
| Sense wire | Au-W 20 μm|$\phi$| |
| Potential wire | Cu-W 75 μm|$\phi$| |
| Cell size | width = 10 mm, thickness = 10 mm |
| Gas | isobutane 10 kPa |
| Wire configuration | X = parallel to the vertical direction |
| U = inclined by |$30^\circ$| with regard to the vertical axis|${}^{*}$| | |
| V = inclined by |$-30^\circ$| with regard to the vertical axis|${}^{*}$| | |
| Plane ordering along beam | XX′X′′UU′U′′VV′V′′ from downstream to upstream|${}^{**}$| |
| High voltage | 1350 V (upstream), 1255 V (downstream) |
| MWDC1–MWDC2 distance | 633 mm |
|$^{*}$|Angles are measured in a clockwise direction viewed from upstream.
|$^{**}$|The wire positions of the X′ and X′′ planes are shifted by 1/3 and 2/3 cells, respectively.
We applied the dispersion matching optics so that the momentum spread of the beam should not contribute to the energy measurement at F5. The beam was made momentum-dispersed at F0 by tuning the quadrupole magnets in the injection beamline from T11 to F0, based on the design of the beam transport shown in Fig. 9 and Table 3 in Ref. [33]. The matching condition of the dispersion at F0, |$(x|\delta )_{\rm F0}=34$| mm/%, was realized by using the newly developed diagnostics method [39]: The beam trajectory at F0, where no tracking detector can be installed, was reconstructed from the track information at F3, F7 (achromatic foci) and F5 (dispersive focus). The information on x and a was obtained from the transfer matrix of F0–F3 while |$\delta$| was obtained from that of F5–F7. The horizontal profiles of the primary |$\mathrm{^{12}C}$| beam at F5 before and after the dispersion matching tuning are shown in Fig. 2. The beam spread at F5 was evaluated as 5 mm (FWHM) (see Fig. 2), which corresponds to a momentum spread of 0.078% and an energy spread of 4.1 MeV. After the tuning, the position spread at F5 was decreased to 1.7 mm (FWHM), which corresponds to a momentum spread of 0.026% and an energy spread of 1.4 MeV. In order to suppress the angular spread of the beam, a vertically parallel optics was adopted between SRC and T11, which is an interim point between SRC and F0 (see Fig. 1). After the beam tuning for T11–F0, the angular spread on the target was 0.15|$^{\circ }$| in the horizontal and 0.16|$^{\circ }$| in the vertical directions, respectively. The beam spot size was 5 mm (horizontal) |$\times$| 5 mm (vertical) (FWHM) at the F0 target.
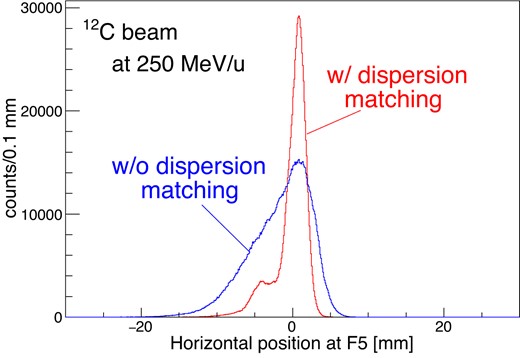
Beam momentum spread measured as the position at F5 in measurements without the F0 target. The blue and red lines show the spectra before and after the tuning of dispersion matching, respectively. The shoulders in the spectra at 5 mm left from the peak are due to the energy loss in MWDC wires at F3. The full widths corresponding to the beam spread were estimated from the half widths on the high-momentum side (right side in the figure) and they were 5 mm (without dispersion matching) and 1.7 mm (with dispersion matching), respectively.
After passing through MWDCs at F5, |$^{12}$|Be was transported to a |$^{9}$|Be stopper of |$50^H\times 50^W \times 18.8^t~{\rm mm}^3$| placed at F8. The |$\gamma$|-rays from the isomeric |${}^{12}{\rm Be}(0^{+}_{2})$| state were detected using the DALI2 array surrounding the stopper. A copper plate of 10 mm thickness was placed just downstream of the F5 MWDCs in order to remove other |$A/Z=3$| light ions such as t, |$^{6}$|He, and |$^{9}$|Li by their energy-loss difference and magnetic separation. At the F5 focal plane, light |$A/Z=3$| particles arrive at a high rate of |$\gt 10^{6}$| Hz, together with |$^{12}$|Be. After passing through the degrader at F5, |$Z\le 3$| particles other than a fraction of |$^{9}$|Li are swept away to the outside of the acceptance by the dipole magnets (D5 and D6) located between F5 and F7. Another copper plate of 13 |${\rm mm}$| thickness and an aluminum plate of 14.485 |${\rm mm}$| thickness were placed at F7 to stop |${}^{12}{\rm Be}$| in the |${}^{12}{\rm Be}$| stopper. The flight length from F0 to F8 is 89.500 m and the time of flight is 526 ns for 250 MeV/nucleon |${}^{12}{\rm Be}$|, following deceleration in the energy degraders. The time of flight corresponds to a survival ratio of 27% of the scattered |${}^{12}$|Be(0|$^{+}_{2}$|).
The data were recorded for the events that triggered the scintillator counter at F7. The coincidence window of DALI2 was set to |$2~\mu {\rm s}$| in order to detect the delayed |$\gamma$|-rays deriving from the decay of the |${}^{12}$|Be(0|$^{+}_{2}$|).
Data for the single charge exchange (SCX) |$^{48}$|Ca(|$^{12}$|C, |$^{12}$|B) reaction were also taken with the same setup except for the magnetic-field setting of BigRIPS. The data were used to confirm the overall performance of the experimental setup as well as to assess the reliability of the reaction analyses.
3. Data reduction and results
3.1. Selection of (|${}^{12}$|C,|${}^{12}$|Be(0|${}^{+}_{2}$|)) events
The |${}^{12}{\rm Be}(0^+_2)$| events were selected by identifying |${}^{12}{\rm Be}$| using the charged particle detectors placed from F5 to F8, and detecting decaying |$\gamma$|-rays at F8 with DALI2.
The scattered |${}^{12}{\rm Be}$| were selected by the energy deposited in MWDC2 at F5 and the plastic scintillator at F7 for the events in which the F8 PPAC is triggered. Figure 3 shows the correlation of the energy deposits in the F5 MWDC and the F7 plastic scintillator with the software cut adopted in the analysis. The main contaminants are |${}^{9}{\rm Li}$| with a ratio of 0.2%.
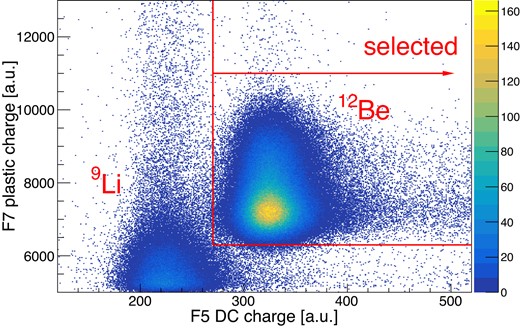
Correlation of charge distribution at F7 plastic and F5 MWDC2. Overlaid lines define the selected region.
The isomeric states of |$^{12}$|Be(0|$^{+}_{2}$|) were selected by the timing and the energy of the |$\gamma$|-rays measured with DALI2. |${}^{12}$|Be(0|$^{+}_{2}$|) decays into the ground state directly by emitting an |$e^+e^-$| pair with a branching ratio of 87.3% [40] while the rest decay via the 2|$^{+}$| (|$E_{\rm ex} = 2.107$| MeV) state by emitting 0.144 MeV and 2.107 MeV |$\gamma$|-rays. Detection of at least one of the |$\gamma$|-rays from |${}^{12}{\rm Be}$| in DALI2 is required within the following timing and energy gates. The timing gate starts 20 ns after the prompt |$\gamma$|-rays and the width is 940 ns. The end point of the timing gate was determined so that the S/N ratio is optimized. The left panel of Fig. 4 shows the energy distribution of the |$\gamma$|-rays within the timing gate. The main component is attributed to 511 keV photons. The energy gate is set to |$E_{\gamma }\lt 580$| keV.
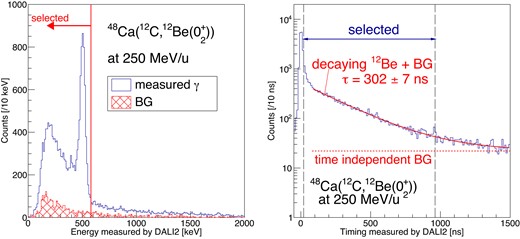
The spectra of |$\gamma$|-rays measured by DALI2. The energy distribution (left), the timing distribution (right).
The right panel of Fig. 4 shows the timing distribution of the |$\gamma$|-rays for the selected events. The decay curve was fitted with the function of an exponential and a constant background. The decay constant is found to be |$302 \pm 7$| ns, which is consistent with the literature value of |$331\pm 12$| ns [23]. The constant background reflects the accidental coincidence between |${}^{12}{\rm Be}$| and room-background |$\gamma$|-rays. The accidental coincidence ratio was evaluated by gating |$\gamma$|-ray timing in 100–400 ns before the prompt |$\gamma$|-rays. The corresponding energy spectrum is shown in red in the left panel of Fig. 4. The contamination is estimated to be 10% of the total events and it is eventually eliminated in the evaluation of the DGT components of the cross section.
The detection efficiency was estimated using simulation with GEANT4 [35]. The efficiency of the 511 keV photon, in which at least one photon in the photon pair produces a signal, is |$73\%$| including the detector solid angle. That of the 2.107 MeV |$\gamma$|-ray with signals inside the energy gate is |$27\%$|. Thus the 0|$^{+}_{2}$| state is tagged with an efficiency of |$67\%$|. The simulated efficiency is in agreement with calibration data from a |${}^{137}{\rm Cs}$| source within 15% relatively: 19.8% in the simulation and 23.4% in the calibration data, respectively. We assume that the relative deviation of 15% may also exist in the detection efficiencies for the 511 keV or 2.107 MeV |$\gamma$|-rays and evaluate the tagging efficiency as |$67\pm 10\%$|.
3.2. Excitation energy and scattering angles
The excitation energy in the residual nucleus |${}^{48}{\rm Ti}$| was obtained from the beam energy and the energy of the scattered |${}^{12}{\rm Be}$|. The central value of the beam energy was determined as 248.2 MeV/nucleon from the field strength of the D1 magnet given by the NMR probe. The momenta of the central ray of the F0–F5 spectrometer in the charge exchange measurement were also evaluated from the NMR readout of D1. The scattering angles were obtained from the trajectories at F5 using the ion-optical transfer matrix obtained from another measurement. The main matrix elements are |$(x|\delta )=64.86$| mm/%, |$(x|aa)=-0.0023$| mm/mrad|$^{2}$|, |$(a|a)=-0.480$|, and |$(b|b)=-0.765$|. The resolution of the scattering angle |$\theta _{\rm lab}$| is estimated as |$0.15^{\circ }$| in the horizontal and |$0.17^{\circ }$| in the vertical directions considering the angular spread of the beam (|$0.15^{\circ }$| (horizontal) and |$0.16^{\circ }$| (vertical)), the tracking resolution of the MWDCs (|$0.03^{\circ }$| and |$0.05^{\circ }$|), and the multiple scattering in the target (|$0.008^{\circ }$|). The systematic error in |$\theta _{\rm lab}$| comes mainly from the uncertainty of the transfer matrix and it is estimated to be 7%.
The spectrum of the SCX |${}^{12}$|C(|$^{12}$|C, |$^{12}$|B)|${}^{12}$|N reaction, shown in Fig. 5, together with that of the |${}^{48}$|Ca(|$^{12}$|C, |$^{12}$|B)|${}^{48}$|Sc reaction (to be shown later in Section 4.1) were used to validate the analysis. |${}^{12}{\rm B}$| events were well separated from other particles by selecting the time of flight by gating on the time difference between the F7 plastic scintillator and the RF signal. The ground state and the known peak at 4.1 MeV (|$2^-$|) in |${}^{12}{\rm N}$| were observed with an energy resolution of 1.5 MeV (FHWM). The energy resolution is understood with a quadratic sum of the energy spread of the beam (1.4 MeV), the energy-loss difference of |$^{12}$|C and |${}^{12}$|B in the target (0.2 MeV), and the energy resolution propagated from the tracking resolution at F5 (0.6 MeV) (summarized in Table 3). From the peak positions in |${}^{12}{\rm N}$| and |$1^+$| state in |${}^{48}{\rm Sc}$| (|$E_{\rm ex}= 2.5$| MeV), the systematic uncertainty in the excitation energy offset is evaluated as 0.5 MeV near the central ray |$E_{\rm ex}$| = 22.5 MeV for the double charge exchange reaction, with an additional scaling uncertainty of 2% in |$E_{\rm ex}$|. The energy resolution for the double charge exchange measurement is estimated to be 1.5 MeV (FWHM) with a contribution from the in-target energy-loss difference of 0.4 MeV.
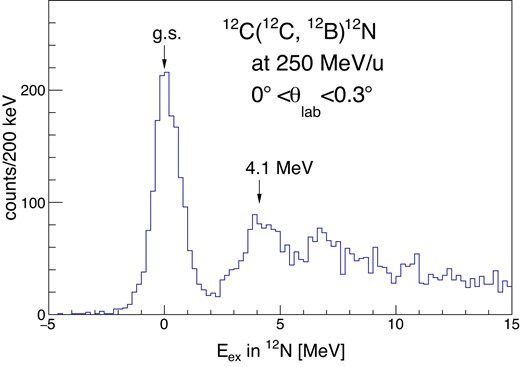
Excitation energy spectrum measured in the SCX reaction of |${}^{\rm 12}{\rm C}(^{12}$|C, |$^{12}$|B)|${}^{12}{\rm N}$| with a graphene target.
Contributions to the excitation energy resolution (FWHM).
| |$^{12}$|C(|$^{12}$|C, |$^{12}$|B)|$^{12}$|N | |$^{48}$|Ca(|$^{12}$|C, |${}^{12}$|Be(0|$^{+}_{2}$|))|$^{48}$|Ti | |
|---|---|---|
| Beam energy | 1.4 MeV | |
| F5 tracking resolution | 0.4 | |
| In-target energy-loss difference | 0.2 MeV | 0.4 MeV |
| Total resolution | 1.5 MeV | 1.5 MeV |
| |$^{12}$|C(|$^{12}$|C, |$^{12}$|B)|$^{12}$|N | |$^{48}$|Ca(|$^{12}$|C, |${}^{12}$|Be(0|$^{+}_{2}$|))|$^{48}$|Ti | |
|---|---|---|
| Beam energy | 1.4 MeV | |
| F5 tracking resolution | 0.4 | |
| In-target energy-loss difference | 0.2 MeV | 0.4 MeV |
| Total resolution | 1.5 MeV | 1.5 MeV |
Figure 6 shows the differential cross sections in the center of mass frame against the excitation energy in |$^{48}$|Ti for the |$^{48}$|Ca(|$^{12}$|C, |$^{12}$|Be(0|$^{+}_{2}$|)) reaction with nine angle steps of |$\theta _{\rm CM}=0^{\circ }$|–0.3|$^\circ$|, |$0.3^{\circ }$|–0.5|$^{\circ }$|, and in |$0.2^\circ$| intervals for larger angles up to |$\theta _{\rm CM}=1.9^\circ$|. Here the angular binning is selected so that each |$\Delta L$| component is enhanced at a different bin: the |$\Delta L=0,~1,$| and 2 components of the cross sections have angular peaks at |$0^{\circ }$|, |$\sim 0.5^{\circ }$|, and |$\sim 0.7^{\circ }$|, respectively, as discussed in Section 4.2. The distribution of the accidental coincidence events with room-background |$\gamma$|-rays is evaluated from the |${}^{12}{\rm Be}$| singles spectra without the coincidence with DALI2. The contribution of such events is subtracted in Fig. 6. Other corrections are made by the tracking efficiency of MWDCs (78%), the transmission from F0 to F8 and the reaction loss at the energy degraders (20%), the surviving ratio of |${}^{12}{\rm Be}(0^+_2)$| (27%), the efficiency of PPAC at F8 (98%), the live time of the data acquisition (DAQ) system (88%), and the overall DALI2 efficiency (70%). The error bars shown in Fig. 6 are only the statistical errors. Systematical errors arise from the number of incident particles (relative uncertainty of 20%), the target thickness (15%), DAQ efficiency (|$\lt 1$|%), the efficiency of DALI2 (15%), the efficiency of the PID and the tracking (2%), the survival ratio of |${}^{12}$|Be(0|$^{+}_{2}$|)(4%), the transmission (20%), and the reconstruction of the scattering angles (7%). The quadratic sum of these contributions leads to a total systematic uncertainty of 36% in the absolute value of the cross section.
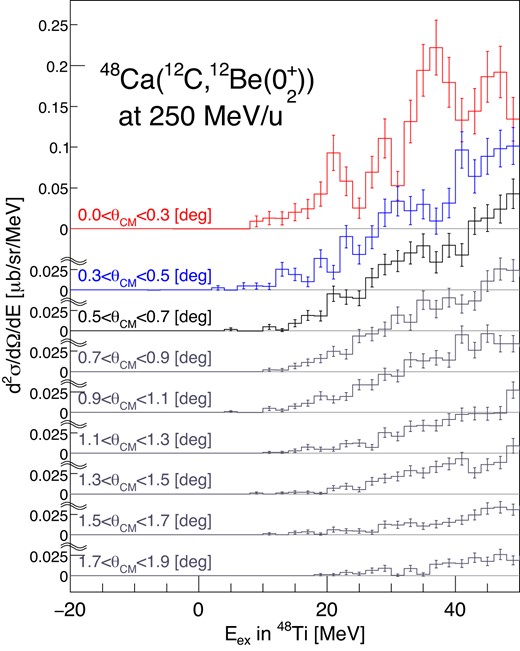
Double-differential cross sections of the |${}^{48}$|Ca(|$^{12}$|C, |$^{12}$|Be(0|$^{+}_{2}))^{48}$|Ti reaction for each angle from 0.0|$^{\circ }$| to 1.9|$^{\circ }$|.
The contribution from graphene sheets attached to the |${}^{48}{\rm Ca}$| foil was evaluated from the measurement with the natural carbon target. The contribution is negligible at |$E_{\rm ex}\lt 34$| MeV because the Q-value of the |${}^{12}{\rm C} ({}^{12}{\rm C},{}^{12}{\rm Be}(0^{+}_{2}))^{12}{\rm O}_{\rm g.s.}$| reaction is |$-59.3$| MeV corresponding to an excitation energy of 36.5 MeV in |${}^{48}{\rm Ti}$|, and it amounts to |$6\pm 2$|% of the spectra at |$E_{\rm ex}=34$|–50 MeV. The integrated cross section over 0–34 MeV is |$1.33 \pm 0.12$| μb/sr at an angular range of |$\theta _{\rm CM}=0^{\circ }$|–0.3|$^{\circ }$|.
At around 20 MeV, we observed an enhancement in the forward angle. The angular distributions at several excitation energies are shown in Fig. 7. The forward-peaking distribution suggests the existence of the |$\Delta L=0$| transition. This |$\Delta L=0$| component is the candidate for the DGTGR.
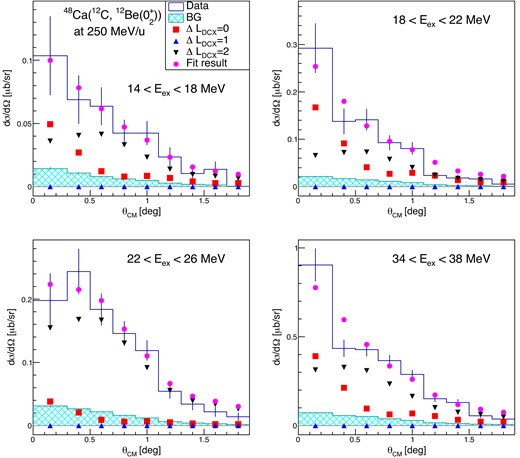
Angular distributions for |$E_{\rm ex}=$|14–18, 18–22, 22–26, and 26–30 MeV. The histograms with blue lines show the data, and the hatched histograms show evaluated backgrounds that are included in the data. The fitting results of the MD analysis are also shown by the points.
4. Discussion
For a quantitative argument on the existence of DGTGR, the cross section spectra are compared to coupled-channel calculations. Possible DGT transition strengths were extracted by employing a technique of multipole decomposition (MD), attributing the forward-peaking component of the spectrum to DGT transitions.
4.1. Calculation of the angular distribution of the DGT transition
We calculated the angular distributions of the cross section for the DGT transition and a unit cross section |$\hat{\sigma }_{\rm DGT}$| that corresponds to one unit of the DGT strength (|$B({\rm DGT})=1$|). The calculation was performed with the coupled-channel distorted-wave Born approximation using ECIS97 [41] (J. Raynal, unpublished works). Here a two-step transition is considered as |$^{48}$|Ca|$_{\rm gnd}(0^{+})\rightarrow$| |$^{48}$|Sc(1|$^{+}$|) |$\rightarrow$| |$^{48}$|Ti(0|$^{+}$|) in the target and |$^{12}$|C|$_{\rm gnd}(0^{+}$|) |$\rightarrow$| |$^{12}$|B|$_{\rm gnd}(1^{+}$|) |$\rightarrow$| |${}^{12}{\rm Be}(0^{+}_{2})$| in the projectile. Three states, i.e. the initial state of |$^{48}$|Ca|$_{\rm gnd}(0^{+}$|)+|$^{12}$|C|$_{\rm gnd}(0^{+}$|), the intermediate state of |$^{48}$|Sc(1|$^{+}$|)+|$^{12}$|B|$_{\rm gnd}(1^{+}$|), and the final state of |$^{48}$|Ti(0|$^{+}$|)+|$^{12}$|Be(0|$^{+}_{2}$|), are taken into consideration as individual channels.
The transition form factors for each step were obtained using FOLD (J. Cook and J. Carr, unpublished work) by double-folding the effective interaction at 270 MeV by Franey–Love [42] with transition densities for the projectile and the target. The transition densities for the projectile system were calculated using the shell-model code NuShellX [43]. The Utsuno–Chiba Hamiltonian for the |$p\!-\! sd$| shell [44] was used with the modification of an increasing |$p\!-\! sd$| shell gap by 1 MeV [20]. The obtained transition densities correspond to Gamow–Teller transition strengths B(GT) of 1.0 for |$^{12}$|C |$\rightarrow$| |$^{12}$|B and 0.27 for |$^{12}$|B |$\rightarrow$| |$^{12}$|Be(0|$^{+}_{2}$|) with a quenching factor of 0.6. They reproduce the values deduced from the |$\log {ft}$| values of the |$\beta$| decay [45] and the charge exchange reaction [20]. For the target, transitions of specific one-particle–one-hole (p,h) configurations were calculated individually. The (p,h) configurations taken here are (|$f_{7/2}$|, |$f_{7/2}^{-1}$|) and (|$f_{5/2}$|, |$f_{7/2}^{-1}$|) for the transitions of both |$^{48}$|Ca|$\rightarrow$| |$^{48}$|Sc and |$^{48}$|Sc |$\rightarrow$| |$^{48}$|Ti. The single particle radial wave functions for the projectile and the target were calculated in the Woods–Saxon potential [46] with the parameters of radius |$r_{0}=1.25$| fm, diffuseness |$a=0.65$| fm, and spin–orbit potential strength |$V_{\rm so}=7.0$| MeV, respectively, in which the potential depths of the volume term were tuned to reproduce the binding energies for neutrons and protons. The binding energies were taken as the neutron or proton separation energies.
The optical potentials for the entrance, the intermediate, and the exit channels were obtained through the double-folding model [47] constructed with the CEG07 G-matrix interaction [48,49]. The Q-value going to the intermediate state, which is defined as the energy difference compared to the initial state, was set to half of that of the final state.
The red solid lines in Fig. 8 show the angular distribution for the DGT transition obtained by setting the transfer of the orbital angular momentum |$\Delta L$| to 0 in both the transition from the initial to the intermediate, and from the intermediate to the final channel. We refer to this combination of transfer of |$\Delta L$| as “|$\Delta L_{\rm DCX} =0$|” in the following. There are four combinations of the (p,h) configurations in the target: [(p,h)|$_{{}^{48}{\rm Ca}\rightarrow {}^{48}{\rm Sc}}]\otimes$|[(p,h)|$_{{}^{48}{\rm Sc}\rightarrow {}^{48}{\rm Ti}}]=(f_{7/2},~f_{7/2}^{-1})\otimes (f_{7/2},~f_{7/2}^{-1}),~(f_{5/2},~f_{7/2}^{-1})\otimes (f_{7/2},~f_{7/2}^{-1}),~(f_{7/2},~f_{7/2}^{-1})\otimes (f_{5/2},~f_{7/2}^{-1}),~{\rm and}~(f_{5/2},~f_{7/2}^{-1})\otimes (f_{5/2},~f_{7/2}^{-1})$|. The difference in the shapes of the angular distributions is negligible and the absolute values of the cross sections differ essentially by the spin factor. These four patterns are averaged in the calculations. The left (right) panel in Fig. 8 shows the calculation at |$-Q= 24$| (54) MeV, which corresponds to an excitation energy in |$^{48}$|Ti of 0.9 (30.9) MeV. The difference in the diffraction pattern of the angular distribution is negligible for the DGT transition.
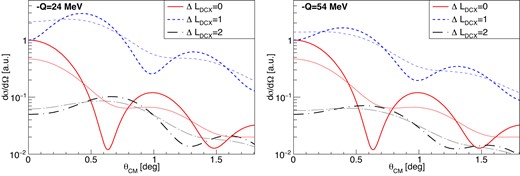
Calculated angular distributions for |$\Delta L_{\rm DCX}=$|0, 1, and 2. Calculation at |$-Q=$|24 MeV (left) and 54 MeV (right). The thick (thin) curves represent the distribution before (after) the angular smearing.
The calculation was validated by comparing the calculated angular distribution for the SCX reaction of |$^{48}$|Ca(|$^{12}$|C, |$^{12}$|B)|$^{48}$|Sc(1|$^{+}$|, 2.5 MeV) with the experimental data. The experimental angular distribution is shown by the points in Fig. 9 by integrating the measured cross section over |$1.6\lt E_{\mathrm{ex}}\lt 3.6$| MeV (see the inset of Fig. 9). The experimental angular distribution was compared with a superposition of the calculated cross sections of the |$\Delta L=0$| and |$\Delta L=2$| transitions. In the calculations, the (p,h) configurations of (|$f_{7/2}$|, |$f_{7/2}^{-1}$|) were taken for the target transitions and the calculated angular distributions were smeared by the experimental angular resolution. The data are described mainly by the |$\Delta L=0$| distribution with an additional |$\Delta L=2$| component up to |$\theta _{\rm cm}\sim 1^{\circ }$|. The normalization for the |$\Delta L=0$| component corresponds to a |$B({\rm GT})$| value of 1.4, which is close to the transition strength of |$1.09\pm 0.01$|, observed in an independent (|$^{3}$|He, t) measurement [50].
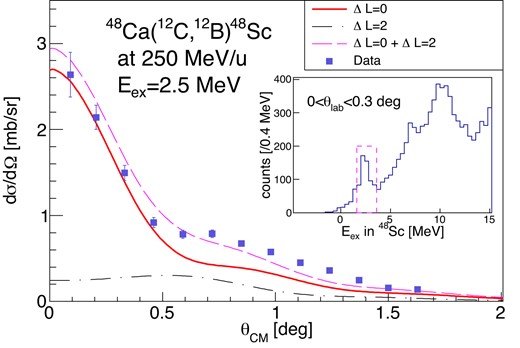
Angular distribution for the SCX reaction of |$^{48}$|Ca(|$^{12}$|C, |$^{12}$|B)|$^{48}$|Sc around |$E_\mathrm{ex}=2.5$| MeV. Red and black curves are calculated angular distributions using ECIS for |$\Delta L =0$| and |$\Delta L=2$|, respectively. The magenta curve is the sum of |$\Delta L=0$| and |$\Delta L=2$|. The inset shows the observed counts at |$\theta _{\rm lab}=0^{\circ }$|–|$0.3^{\circ }$| against the excitation energy in |${}^{48}{\rm Sc}$|.
4.2. MD analysis
The experimentally obtained angular distributions at each excitation energy bin |$\sigma ^{\rm exp}(\theta _{\rm cm}, E_{\rm ex})$| were fitted by the maximum likelihood method with the sum of the calculated angular distributions |$\sigma _{\Delta L_{\rm DCX}}^{\rm calc}$| weighted with fitting coefficients |$a_{\Delta L_{\rm DCX}}$| as
Here we take the background into account explicitly and |$\sigma _{\rm BG}(\theta _{\rm cm}, E_{\rm ex})$| is the cross section of the accidental coincidence events with room-background |$\gamma$|-rays. |$\Delta L_{\rm DCX}=0$| corresponds to the DGT transition, while the two others, |$\Delta L_{\rm DCX}=1$| and 2, are obtained by calculating |$^{48}$|Ca|$_{\rm gnd}(0^{+})\rightarrow$| |$^{48}$|Sc(2|$^{-}$|) with |$\Delta L=1$| and |$^{48}$|Sc(2|$^{-}$|) |$\rightarrow$| |$^{48}$|Ti(1|$^{-}$|) with |$\Delta L=0$| for |$\Delta L_{\rm DCX}=1$|, and |$^{48}$|Ca|$_{\rm gnd}(0^{+})\rightarrow$| |$^{48}$|Sc(1|$^{+}$|) with |$\Delta L=2$| and |$^{48}$|Sc(1|$^{+}$|) |$\rightarrow$| |$^{48}$|Ti(2|$^{+}$|) with |$\Delta L=0$| for |$\Delta L_{\rm DCX}=2$|. Figure 8 shows the calculated angular distribution for |$\Delta L_{\rm DCX}=1$| (blue dotted lines) and |$\Delta L_{\rm DCX}=2$| (black dashed lines) at |$-Q=24$| MeV (left) and |$-Q=54$| MeV (right). The |$\Delta L_{\rm DCX}=1$| and |$\Delta L_{\rm DCX}=2$| components have peaks at |$\sim 0.4^{\circ }$| and |$\sim 0.7^{\circ }$|, respectively. The required angular resolution in this experiment of 0.3|$^{\circ}$| described in Section 2 was determined in order to distinguish these different components. For the |$\Delta L_{\rm DCX}=1$| and |$\Delta L_{\rm DCX}=2$| components, the diffraction patterns became slightly less sharp as the Q-value increased. These calculated angular distributions were smeared by the experimental resolution and rebinned to the angular binning of the experiment. The smeared distributions are also shown in Fig. 8.
We fitted the experimental angular distribution for every 4 MeV bin of the excitation energy in |${}^{48}$|Ti. The cross section data at five angles in the most forward angular region, i.e. |$\theta _{\rm CM} \lt 1.1^\circ$|, were used in the three-parameter fitting. Figure 7 gives four examples of decomposed angular distributions. The overall trend of the angular dependence of the cross sections up to |$1.8^\circ$| is described well by the results of MD analysis shown with magenta circles. At these energy bins 30–60% of the cross sections at the most forward angle are attributed to the |$\Delta L=0$| component. The uncertainty in the likelihood fitting was evaluated in a standard way by drawing an envelope of |$-\ln {L}_{\rm min}$| + constant in the parameter space with |${\rm constant}=1.765$| corresponding to one standard deviation in the three-parameter fitting [51].
The excitation energy distributions of the decomposed spectra are shown in Fig. 10. The dots show the observed cross sections while the results of the MD analysis are shown as stacking histograms of the background (cyan), |$\Delta L_{\rm DCX}=0$| (red), |$\Delta L_{\rm DCX}=1$| (blue), and |$\Delta L_{\rm DCX}=2$| (black). There are noticeable strengths for |$\Delta L_{\rm DCX}=0$| around |$E_{\rm ex}=20$| and 36 MeV. We note that the contamination of the |${}^{12}{\rm C}({}^{12}{\rm C}$|, |${}^{12}{\rm Be}(0^{+}_{2}))^{12}{\rm O}$| events in the peak at 36 MeV (|$34\lt E_{\rm ex}\le 42$| MeV) is relatively small, as its contribution in the cross sections before the decomposition is |$6\pm 2\%$| when averaged at forward angles (|$\theta _{\rm CM}\lt 1.1^{\circ }$|). The cross section for the |$\Delta L_{\rm DCX}=0$| component at the most forward angle of 0|$^{\circ }$|–0.3|$^{\circ }$| amounts to |$0.50^{+0.35}_{-0.11}$| μb/sr when integrated over |$E_{\rm ex}=$|0–34 MeV. The error represents only the statistical error. Thus, the MD analysis has attributed |$\sim 38^{+26}_{-8}$|% of the |$\theta \le 0.3^{\circ }$| cross section observed in |$E_{\rm ex}\le 34$| MeV of 1.33|$\pm$|0.12 μb/sr to the |$\Delta L_{\rm DCX}=0$| transitions.
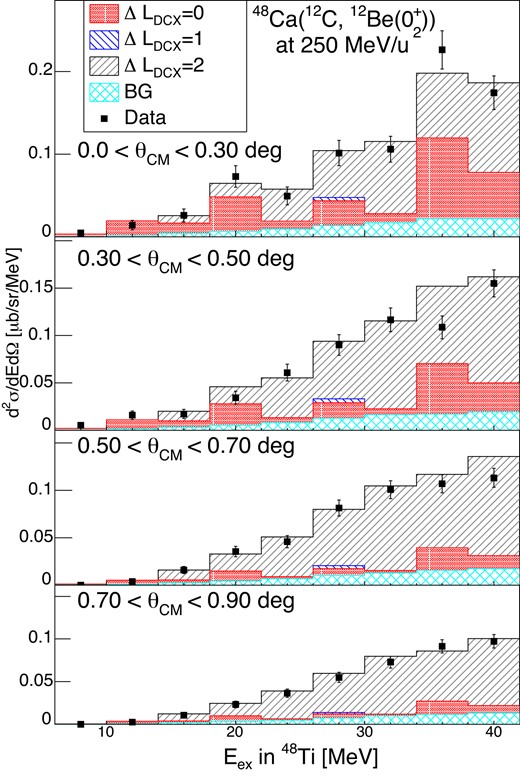
The decomposed cross section spectra of the |${}^{48}$|Ca(|$^{12}$|C, |${}^{12}$|Be(0|$^{+}_{2}))^{48}$|Ti reaction at forward angles.
The systematic uncertainty in the MD analysis was studied by changing the energy and angular bins, using four angular points (|$\theta _{\rm CM}\lt 0.9^\circ$|) instead of five, or using the Franey–Love interaction at 210 MeV. These do change neither the fitting quality nor the integrated cross section significantly.
In the extraction of |$\Delta L_{\rm DCX}=0$| components, other transitions with similar angular distributions to the DGT are not excluded. A transition that could be taken into consideration is an excitation of GT on top of an isovector spin monopole (IVSM) resonance. IVSM is a |$2\hbar \omega$| excitation known in the SCX channel with the same spin parity as the GT excitation. They are indistinguishable from each other by the angular distribution. Another possibility is double spin dipole (|$[\Delta L=1]\otimes [\Delta L=1]$|) excitation, which is also expected to have a forward-peaking component.
Assuming the simple superposition of their individual processes, we can estimate the energies where those double resonances lie. The centroid energy of the single GT resonance is |$\sim$|12 MeV from the ground state of |${}^{48}{\rm Ca}$| with a width of 5 MeV [28,29]; thus we expect that the DGTGR lies around |$12\times 2\sim 24$| MeV, which corresponds to |$E_{\rm ex}=28$| MeV in |${}^{48}{\rm Ti}$|, with a width of |$5\times \sqrt{2}\sim 7$| MeV. As the energy of IVSM is estimated to be 27 MeV [52] from the ground state of |$^{48}$|Ca, the position of the IVSM |$\otimes$| GT resonance is expected to be around 39 MeV. A double spin dipole would appear around 30 MeV according to the empirical formula in Ref. [53]. Thus we consider that the enhancement of the |$\Delta L_{\rm DCX}=0$| component around 20 MeV can primarily be attributed to the DGT, although further studies are needed for the quantitative separation. In the following section, we will show the derivation of the DGT transition strength by assuming that all the extracted components of |$\Delta L_{\rm DCX}=0$| are attributed to the DGT transition.
4.3. Derivation of DGT transition strength
B(DGT) is derived by assuming that all the extracted components of |$\Delta L_{\rm DCX}=0$| are attributed to the DGT transition. A proportionality relation analogous to that known for GT transitions [54] between the cross section and the strength is assumed to hold, i.e.
where |$\hat{\sigma }_{\rm DGT}$| is the normalization factor of the so-called “unit cross section” of the DGT transition. |$F(q,\omega )$| describes the dependences on momentum q and energy |$\omega$| transfers. |$F(q, \omega )$| is defined to be unity at |$(q, \omega )=(0, 0)$|. In heavy-ion reactions, B(DGT) may be factorized as
where |$B_{\rm target}$| and |$B_{\rm projectile}$| are the DGT strengths in the target and the projectile, respectively. |$B_{\rm projectile }$|(DGT) was taken as the product of B(GT) in |$^{12}$|C|$_{\rm gnd}(0^{+}$|) |$\rightarrow$| |$^{12}$|B|$_{\rm gnd}(1^{+}$|) [45] and |$^{12}$|B|$_{\rm gnd}(1^{+}$|) |$\rightarrow$| |${}^{12}$|Be(0|$^{+}_{2}$|) [20], leading to |$B_{\rm projectile}({\rm DGT})=0.21\pm 0.05$|.
|$\hat{\sigma }_{\rm DGT}$| was evaluated by performing the reaction calculations described in Section 4.1 at |$Q=0$| and |$\theta =0$| for four different (p,h) configurations in the target, which are (|$f_{7/2}$|, |$f_{7/2}^{-1}$|) or (|$f_{5/2}$|, |$f_{7/2}^{-1}$|) for each step. |$\hat{\sigma }_{\rm DGT}$| slightly depends on the configuration and the averaged |$\hat{\sigma }_{\rm DGT}$| value is |$0.37 \pm 0.02~\mu {\rm b/sr}$|.
The q and |$\omega$| dependence of |$F(q,\omega )$| was evaluated with the calculated cross section as
Figure 11 shows the ratio of the cross section at 0|$^{\circ }$| to the one at |$Q=0$| for each (p,h) configuration. Here |$E_{\rm ex}=0$| corresponds to |$-Q=23.1$| MeV. |$F(q,\omega )$| in Eq. (3) was obtained by averaging over different configurations of the target system.
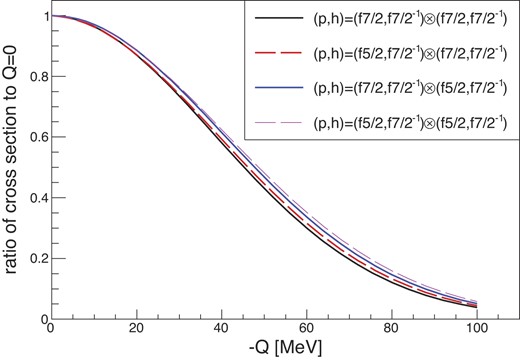
Excitation energy dependence of the DGT cross section for DCX.
The experimental |$B_{\rm target}$|(DGT) is derived from Eq. (3) with the |$\Delta L_{\rm DCX}=0$| cross section extracted by the MD analysis. Figure 12 shows the B(DGT) distribution. The errors denoted here are those from the determination of the |$\Delta L_{\rm DCX}=0$| cross section at each energy. The sum of the measured B(DGT) below 34 MeV is |$28^{+22}_{-7}$|. As the structure of the B(DGT) spectrum is ambiguous, we obtained the typical spectroscopic quantities of the centroid energy and the width by simply taking an averaged excitation energy |$E_{c}=\sum _{i}E_{i}B_{i}({\rm DGT})/\sum _{i}B_{i}({\rm DGT})$| and the standard deviation |$\Gamma = \sum _{i}(E_{i}-E_{c})B_{i}({\rm DGT})/\sum _{i}B_{i}({\rm DGT})$| over |$0\lt E_{\rm ex}\lt 34$| MeV: |$E_{c}=23\pm 3$| MeV and |$\Gamma =6\pm 1$| MeV.
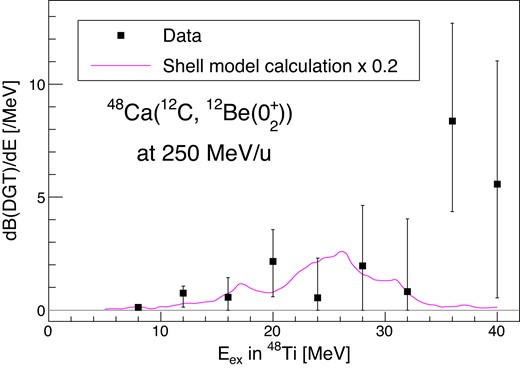
The double Gamow–Teller transition strength B(DGT) obtained by MD analysis of the |$^{48}$|Ca(|$^{12}$|C, |$^{12}$|Be(0|$^{+}_{2}$|)) reaction. The prediction by the shell-model calculation is shown by the magenta curve, which is scaled by 0.2.
The expected centroid energy of the DGTGR in the harmonic picture is |$E_{\rm ex}=28$| MeV with a width of 7 MeV, as described in Section 4.2. The measured centroid energy of the B(DGT) distribution below 34 MeV, though the uncertainty is large, is slightly smaller than that of the simple picture.
The shell-model calculation using the GXPF1B interaction [7] for the |$J^{\pi }=0^{+}$| final state is presented by the magenta curve in Fig. 12. The integrated transition strength for |$J^{\pi }_{f}=0^{+}$| is 127.4 in the calculation [7] while the approximated sum rule gives |$2(N-Z)(N-Z+1)=144$| [5,6]. The average energy of |$0^+$| DGTGR is predicted as 24 MeV, which is also smaller than 28 MeV. The integrated |$B({\rm DGT})$| below 34 MeV obtained in this work is |$22^{+17}_{-6}\%$| of the total value of this calculation. This factor of |$\sim 0.2$| is comparable to the typical quenching factor of |$\sim 0.6$| known for single GTGRs. In single GTGRs, quenching is understood as excitations to p–h configurations beyond the model space or excitations of nonnucleonic degrees of freedom [10,55]. If the same quenching occurs in each of the two steps, the quenching factor in DGTGR might be |$0.6\times 0.6=0.36$|. Thus the present value does not contradict this provisional counting. Still, further studies are required for qualitative discussion on the possible quenching since the current value suffers from uncertainties in both measurement and analysis.
The structure above 34 MeV, especially the distinct strength with a width of |$\sim 5$| MeV in the region of |$34\lt E_{\rm ex}\lt 38$| MeV, is not accounted for by the shell-model calculation. The contribution from the 12C(12C, |$^{12}$|Be(0|$^{+}_{2}))^{12}$|O reaction accounts for approximately |$6\pm 2$|% of the observed strength. Possible interpretations of this structure are that the DGT strength distribution is pushed to higher energy, or that it should be attributed to transitions other than DGT. The expectation of the energy of IVSM |$\otimes$| GT, 39 MeV, is close to the observed enhancement. The double spin dipole excitation could also be taken into consideration with the expectation on 30 MeV. Nevertheless the above-mentioned resonances have rather broad energy distributions in SCX spectra [52,53,56]. Considering the observed width, the peak might not be attributed to these excitations without some novel mechanism. Further studies are needed to establish and interpret the enhancement at 36 MeV.
It is possible in principle to relate the observed strength distribution to the NME of |$0\nu \beta \beta$| using nuclear structure theory [7]. However, the statistics of the present results do not allow us to constrain the NME beyond the current uncertainty of the theory. Future high-statistics experiments using the method established in the present work would provide a data-based constraint on the NME of |$0\nu \beta \beta$|.
5. Conclusion
We have established an experimental technique to access the double Gamow–Teller strengths in highly excited states using the heavy-ion double charge exchange (|$^{12}$|C, |$^{12}$|Be(0|$^{+}_{2}$|)) reaction and applied it to |$^{48}$|Ca using a high-intensity 250 MeV/nucleon |$^{12}$|C primary beam available at RIBF. The dispersion matching and the identification of |${}^{12}{\rm Be}(0^{+}_{2})$| in the final state through |$\gamma$|-ray detection were found to work as expected.
A forward-peaking component in the (|$^{12}$|C, |$^{12}$|Be(0|$^{+}_{2}$|)) cross section was observed below 34 MeV excitation with a cross section of |$1.33 \pm 0.12$| (stat. uncertainty) μb/sr. We have applied a multipole decomposition analysis to the measured cross sections of the |${}^{48}{\rm Ca} \rightarrow {}^{48}{\rm Ti}(0^{+})$| transition and found that |$\sim 38^{+26}_{-8}$|% of the |$\theta \le 0.3^{\circ }$| cross section observed in |$E_{\rm ex}\le 34$| MeV is likely to be attributed to the DGT transition, which corresponds to the DGT strength of |$28^{+22}_{-7}$|.
The enhancement in the spectrum around 36 MeV is not accounted for in our current framework. It might indicate that our current understanding of the reaction mechanism is insufficient. Further studies from both the experimental and theoretical sides are needed for better assessment of DGTGR.
Acknowledgments
This experiment was performed at RIBF operated by RIKEN Nishina Center and CNS, University of Tokyo. The authors are grateful to the staff of RIBF for stable operation of the facility. They also appreciate H. Hasebe for providing the graphene sheet. The authors thank T. Kawabata for fruitful discussion. T.H., Y.H., S.Y.M., R.M., R.S., S.T., and R.T. acknowledge support from the RIKEN Junior Research Associate Program. S.W.H. acknowledges support from the RIKEN International Program Associate. This work was supported by a Grant-in-Aid of the Japan Society for the Promotion of Science, Grant No. 16H02197. This work was supported by the JSPS A3 Foresight Program.
