


Abstract
KAGRA is a newly built gravitational wave observatory, a laser interferometer with a 3 km arm length, located in Kamioka, Gifu prefecture, Japan. In this article, we describe the KAGRA data management system, i.e., recording of data, transfer from the KAGRA experiment site to computing resources, as well as data distribution to tier sites, including international sites in Taiwan and Korea. The amount of KAGRA data exceeded 1.0 PiB and increased by about 1.5 TB per day during operation in 2020. Our system has succeeded in data management, and has achieved performance that can withstand observations after 2023, that is, a transfer rate of 20 MB s-1 or more and file storage of sufficient capacity for petabyte class. We also discuss the sharing of data between the global gravitational-wave detector network with other experiments, namely LIGO and Virgo. The latency, which consists of calculation of calibrated strain data and transfer time within the global network, is very important from the view of multi-messenger astronomy using gravitational waves. Real-time calbrated data delivered from the KAGRA detector site and other detectors to our computing system arrive with about 4–15 seconds of latency. These latencies are sufficiently short compared to the time taken for gravitational wave event search computations. We also established a high-latency exchange of offline calibrated data that was aggregated with a better accuracy compared with real-time data.
1. Introduction
KAGRA is a ground-based laser interferometric gravitational wave detector placed underground in the Kamioka mine in Gifu prefecture, Japan [1–8]. It was originally called the Large-scale Cryogenic Gravitational Telescope (LCGT), but in 2012 it the adopted the nickname ‘KAGRA’ through a public offering. The primary purpose of the KAGRA detector is the direct measurement and observation of gravitational waves from astronomical objects such as compact star binaries consisting of black holes and/or neutron stars, core-collapse of supernovae, rotating pulsars, etc. (e.g., Refs. [9–11]). The science derived from gravitational wave observations is about not only astronomical issues but also fundamental physics of gravity and general relativity [12,13]. KAGRA is expected to play an essential role as a member of the global gravitational-wave detector network in conjunction with the Laser Interferometer Gravitational-Wave Observatory (LIGO) [14] and Virgo [15] in the next decade. LIGO consists of two detectors in the states of Washington and Louisiana in the United States. Virgo, which is named after the Virgo Cluster, is a gravitational-wave observatory located in the province of Pisa, Italy. Hence KAGRA is the fourth detector. Four detectors are required to realize many advanced features of gravitational wave detection, including an accurate estimation of source parameters, such as direction, distance, inclination angle of the binary orbit, and mass parameters of the source. Having a fourth detector will also increase the coverage of the sky and duty cycle of effective observation time [16].
Since it is impossible to predict when gravitational wave events occur or replay astronomical phenomena, KAGRA’s observational data have to be collected and stored without loss. They must contain all the detector’s control and environmental signals to eliminate spurious signals. These data are also important in evaluating operations for improvement of the detector. KAGRA’s data rate is currently about 20 MB s-1 in all, and therefore at least petabyte-class storage is necessary for a few years of observations. In addition, over a thousand CPU cores are required for the data analysis of gravitational waves to extract/identify weak signals. Some of these CPU cores will be involved in near real-time analysis and some as part of searches of archival data. Due to limited space allowance and power supply, however, computing resources cannot be installed on-site, and thus have been located offsite from the KAGRA detector site. Fast and reliable network transfers are required within KAGRA, as well as for the global gravitational-wave detector network.
Another important task of gravitational wave observations is to provide a useful channel of multi-messenger astronomy. Simultaneous observations and follow-up observations using other methods are needed, including e.g. electromagnetic radiation (radio waves, visible light, infrared light, X-ray, gamma-ray) and neutrino detection. Gravitational wave observations are expected to provide both an alert as well as a direction. For the follow-up observation to be successful, it is important to give an alert as soon as possible when a transient event occurs. In the case of the successful observation of binary neutron star merger GW170817, the binary star emitted gravitational waves, and a gamma-ray burst was detected 1.7 seconds after the merger time determined by gravitational waves [17]. Additionally, various follow-up observations were made with optical, near-infrared, ultraviolet, X-ray, and radio. Early gravitational wave event triggers are useful for things like fast afterglow observations. To generate such fast alert processing, a low latency transfer for data analysis including online calibration plays a key role in gravitational wave searches.
In addition to fast event triggers, estimation of the source direction using the global network is necessary. This is because by triangulating with non-colocated detectors, the direction of the source, the polarization of the gravitational waves, and the distance to the source can be estimated. These estimations would not be possible with a single detector. Thus, data sharing between gravitational wave observatories is essential for multi-messenger astronomy.
To achieve these objectives, we constructed a data system for KAGRA that consists of several servers and storage arrays at the Kamioka site where the KAGRA detector is located, the Kashiwa campus of Institute for Cosmic Ray Research (ICRR), the University of Tokyo, and a number of remote sites of the KAGRA collaboration (e.g. Ref. [18]).
2. Overview of KAGRA data system and data flow
The KAGRA data system serves three purposes: the first is to store all of the KAGRA data, the second is to distribute and exchange observational data with data analysis sites and overseas sites for gravitational wave experiments, and the last is to provide computing resources for data analysis. Since the calculation performance is out of the scope of this paper, we will focus only on the first two in the following. Figure 1 shows an overview of KAGRA’s data transfer, distribution, and exchange. This figure includes the alert base and follow-up observations to illustrate an overview of extended data transfer. However, these parts are outside the scope of this paper and will not be discussed here.
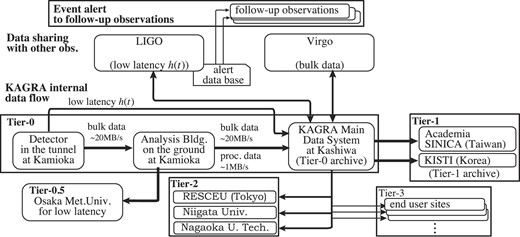
Overview of KAGRA’s data transfer, distribution, and exchange. The figure includes relations with the other gravitational wave observatories, LIGO and Virgo. The bulk data refers to all the raw data generated by the detector, used for archival search and lengthy, computationally expensive parameter estimation analyses, etc. Low latency h(t) is data of a calibrated signal in strain.
Our data system runs mainly on Linux, and we use standard Unix/Linux tools and a variety of software developed by the gravitational wave society as well as software developed within the KAGRA collaboration.
2.1. Data transfer from the KAGRA site to main storage
The computer cluster on the KAGRA site that controls the interferometer also handles the task of data acquisition. The data rate of the total acquired data is expected to reach 20 MB s-1. The process called FrameWriter [19], which is developed by the LIGO collaboration, saves the acquired data to files in a common data frame format for interferometric gravitational wave detectors [20] (the Frame format, for short). The current KAGRA implementation wakes this process up every 32 seconds. This size is determined as having a convenient length not only for gravitational wave analysis but also for noise spectrum and other instumental evaluations. It also considers a sampling frequency of digitization and file size that decides the processing speed of one file by using fast Fourier tansform (FFT). The server receives observed data, conducts the online calibration, and then outputs the calibrated signal in the Frame format. Due to limited power supply, cooling capacity, and space allowance preventing us from placing many storage devices and computer resources in the tunnel on the KAGRA site, we prepared a small computer cluster and a 200 TB disk array for spool space in the surface building at Kamioka and installed large storage resources with a 2.5 PB disk array at Kashiwa as part of the KAGRA data system. The main data system consists of a data-receiving server, a data-sending server, two gateway servers, two login servers, and 16 calculation servers. The servers in the tunnel and the servers in the surface building are connected by a dedicated fiber cable of 4.5 km, while the Kamioka site and Kashiwa site are connected via the Internet (The Science Information Network in Japan, SINET)1. Sufficient local storage is available to host up to four months of KAGRA data in the event of a network outage between Kamioka and Kashiwa.
In addition, a server dedicated to online calibration is placed at the KAGRA site. It outputs a calibrated signal every second.
2.2. Data transfer with other sites
The data transfer with other sites consists of two types, namely, bulk data transfer and low-latency data transfer. KAGRA data consists of many channels, e.g. an inteferometer servo signal, laser stabilization signal, mirror control signal, seismic motion measurements, temperature records, etc. It does not require high performance in latency tolerances, but since all channels of the observed data are transferred, the average transfer speed has to be faster than the data rate. The low-latency data transfer involves small chunks of observed data for online data analysis. Only a few channels of observed data are transferred in the low-latency data transfer.
The KAGRA main data system at Kashiwa plays the role of distributing data to data analysis sites and exchanging data with overseas sites. As for the bulk data transfer, data is transferred to the analysis building on the ground at Kamioka first, then transferred to the main system from the analysis building. Dedicated software developed in-house is used for this purpose, with further details described in Sect. 3. As for the low-latency data transfer, data for low-latency analysis is generated by the online calibration, which is conducted in a dedicated server at Kamioka, and transferred to the main system directly.
2.3. Data tiers
As shown in Fig. 1, we define data tiers from Tier-0 to Tier-3 according to the purpose of data distribution. Tier-0 is the bulk data transfer and storage. Servers related to Tier-0 are placed inside a Virtual Private Network (VPN) with dedicated VPN routers. Since all traffic over the VPN is already encrypted, software for data transfer within Tier-0 does not have to provide further encryption. Tier-1 is dedicated to mirroring data at overseas collaborator sites. Tier-1 not only facilitates access to data by overseas collaborators, but also prevents the loss of observation data even if the main data unit fails. The mirroring process it uses is the GridFTP transfer protocol. Tier-2 is the data distribution to data analysis sites for offline data analysis. This data is distributed via an rsync-based client that is managed by a script developed by the collaboration. Tier-3 is meant for data access by individual users within the KAGRA collaboration.
3. KAGRA bulk data transfer software
Bulk data consists of all data generated by the detector and is typically used for archival searches and lengthy, computationally expensive parameter estimation analyses, etc. KAGRA’s bulk data files are generated every 32 seconds by the digital control system that controls the KAGRA interferometer, captures signals from various locations, and records them in files. One file consists of many channels of acquired data, namely, the main laser interferometer signal, very large numbers of control signals of laser, optical elements, suspensions, and many statuses of experimental apparatuses, including vacuum, cryogenic, and environmental signals such as temperature, humidity, seismic motion, and external magnetic field. There are three types of bulk data, named ‘full’, ‘science’ and ‘trend’, respectively. A full data file contains all data from over 100,000 channels of KAGRA instruments. The typical size of one file is about 400 MB. The data rate is about 12.5 MB s-1, corresponding to about 400 MB of data created every 32 seconds. A science data file contains only some selected channels, and a trend data file consists of data from slow sampling channels. The data rate of these files is about 7.5 MB s-1, so that the total data rate reaches about 20 MB s-1. Fig. 2 displays the data rate and cumulative data history of KAGRA from 2016 to the spring of 2020. Bar charts indicate the data rates of the bulk data, full data, and shared data including calibrated data. The bulk data in this figure refers to the sum of full, science, and trend data. The shared data is the data received from LIGO and Virgo. During an observation period, KAGRA sends data to LIGO and Virgo, and at the same time receives data from LIGO and Virgo. In addition, offline calibrated data produced by KAGRA is also stored. The green chart shows the sum of the shared data and calibrated data. Solid lines show cumulative amounts of data. Red and blue lines represent the bulk data and ‘full’ data, respectively. The red dashed line is the expectation of future cumulative amounts with a rate of 20 MB s-1. Even if KAGRA is not in observation mode but in operation for detector improvement, KAGRA generates data at the same rate. These data are sent from from the KAGRA site in the underground tunnel to the main data system at Kashiwa using our original software.
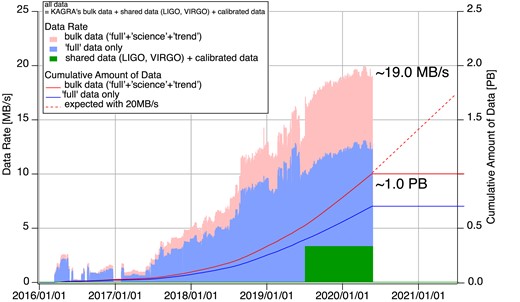
Amount and rate of KAGRA data. Bar charts show KAGRA data acquisition/transfer rates in MB/s (pink: all data, light blue: ’full’ data set without selected channel files, green: shared data from LIGO and Virgo). Lines show cumulative amounts of KAGRA data in PB (red line: all, blue line: ‘full’ data without selected channel packed file). The red dashed line displays the expected cumulative amount of data.
3.1. Data transfer software development and its performance
Data transfer software developed by the KAGRA collaboration takes on the role of transferring the bulk data from the KAGRA site to the main data system at Kashiwa. The data transfer software has to meet the following two requirements: to transfer data faster than the speed of data acquisition and to transfer data without loss even if a brief or several days’ network outage occurs. In this subsection, we briefly describe the data transfer software’s structure and show the performance test results.
The conceptual diagram of the data transfer software is shown in Fig. 3. The system mainly consists of three processes: the watchdog, sender, and receiver. These processes can be interactively operated via shared memory. Additionally, we developed other software for management including, for example, a monitor program showing the contents of the shared memory, a log system for recording the operational status, and a script for resending files that failed to be transferred.
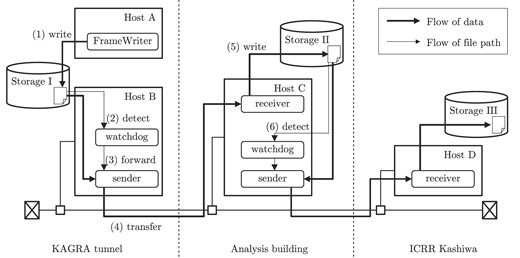
The conceptual diagram of the data transfer software.
FrameWriter creates the following three kinds of files: ‘full,’ ‘science,’ and ‘trend.’ In the storage, a directory is prepared for each of these three types, and sub-directories are created in the directory every 100,000 seconds. FrameWriter creates files in the sub-directories. A full path of a file is /data/full/12757/K-K1_C-1275700032-32.gwf, for instance. The name of the sub-directory is the uppermost five digits of the GPS time when the sub-directory is created. The basename of the file corresponds to an initial letter corresponding to the observatory, in this case K for KAGRA; a data type, such as C for calibrated data; and a GPS start time and the time length of the data, in accordance with the naming convention defined in reference [21]. The watchdog is a process for detecting the creation of a file on the disk by utilizing the inotify system call and forwarding the full path of the file to the next process. Within the directories for each kind of file, the watchdog process detects the creation of the sub-directories. When a sub-directory is created, the watchdog adds the sub-directory to the list it is watching. Within the sub-directories, the watchdog detects the creation of files. Our measured time between file creation and completion of the forwarding process by the watchdog was about 2.5 ms. It is negligibly small compared with the longest delay of 32 s for bulk data files. This is because the first data in the file is delayed by at least the length of the time series in the file.
The actual data transfer is conducted by a client–server system consisting of the receiver and the sender processes. They communicate via the socket API. As a prerequisite, both hosts are in the same VPN, where we ensure fast data transfer by keeping security measures to a minimum. The receiver process becomes a daemon after launch and waits for a connection from the sender process. When a connection request comes, it confirms that the counterparty is the regular sender process, then forks a child process and receives data from the sender.
The sender process transfers the file data, whose full path is forwarded from the watchdog process to the specified remote hosts. The remote target hosts are specified in a config file that the sender process reads when it is called. We can change the target hosts at any time. The actual transfers are conducted by child processes (sender1) forked by the sender process. When two or more target hosts exist, the file is transferred in parallel. Sender1 creates a symbolic link of the file to be sent before sending the connection request to the receiver on the remote host. It removes the symbolic link after succeeding in transferring the file. When the transfer fails for some reason or the sender1 process is aborted, the symbolic link remains. We can check whether files remain that have not been successfully sent to the target hosts by checking the directory where the symbolic links are created. This function plays an essential role in meeting the second requirement: to transfer data without loss, even if issues arise.
As a test of the performance of our data transfer system, we plotted a histogram of the speed of transfer from the Kamioka surface building to ICRR Kashiwa in Fig. 4. The data was measured between 2020 June 5 and 11. More than 98 percent of data is transferred with a speed of over 20 MB s-1. We can say that our system meets the first requirement: to transfer data faster than the speed of data acquisition. The files with transfer speeds slower than 20 MB s-1 were also eventually delivered to main storage without loss of data. As an overall average, the data transfer speed caught up with the acquired data with a sufficient margin, and we succeeded in steady and stable operation.
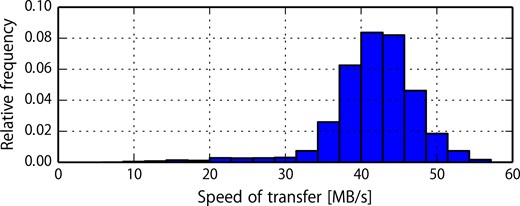
Histogram of the transfer speed from Kamioka surface building to ICRR.
3.2. Auto management of disk quota
The servers in the KAGRA tunnel and on the surface, which are intermediate spools for data transmission, have storage arrays of 20 TB and 200 TB, respectively, but these are not capacities that can permanently hold all of the observational data. Therefore, we must regularly check disk quotas and delete old files before running out of storage space. In doing so, it is also necessary not to delete data files that have not been sent to the main data system at Kashiwa. This operation is required every 10 days on the server in the KAGRA tunnel. We use automation to avoid cumbersome operations and human errors. The data transmission system records unsent data for any reason, such as a temporary network break. The remaining amount of storage is checked by crond every day, and a cleaning process will be initiated if the remaining amount is less than a certain threshold. Before deleting files, it is checked whether files to be deleted exist downstream and files that don’t exist downstream are marked unsent. The status and operations are reported to the administrator team by e-mail. They will manually resend files marked unsent and investigate the cause. This mechanism enables remote management by several people while automating routine disk operations.
3.3. Status monitors
We have to check many things to manage the data obtained by gravitational wave detectors. These include, for example, the status of the data transfer from the KAGRA experiment site at Kamioka to the main data system at Kashiwa, the status of the data exchange with the global gravitational-wave detector network (LIGO and Virgo), and so on. If an error occurs in these operations, we have to recover the normal state as soon as possible. However, the observational data are transferred every second for the low latency channel or about half a minute for bulk data, the frequency of which is too high for manual inspection of the data management system’s performance.
Since tools capable of confirming the current operation status quickly and automatically are required, we make daily summary plots of the data transfer performance, presented on webpages hosted on ICRR servers.
Examples of the daily summary plots of the data transfer are shown in Figs. 5 and 6. These plots are updated once a day at 12:10 PM JST (local time) and show the history of the previous four days. Note that it is also possible to plot the specified time and duration. Fig. 5(a) shows a summary plot of the received data at the server in the Kamioka surface building. The received data rate (in units of GB h-1) is plotted with a red line in the lower panel of Fig. 5(a). The cumulative amount of received data (in units of GB) from a specified date and the free disk (storage) space (in units of TB) are plotted with a green filled area and blue line in the upper panel of Fig. 5(a), respectively. The reader will see that the disk space increased around 8:00 AM, 2020 April 21, as a result of removing old files since the remaining disk space was small. Fig. 5(b) shows a summary plot of the sent data from the server in the Kamioka surface building. The amount of sent data (in units of GB) and the cumulative amount of sent data (in units of GB) from a specified date is plotted with a green line and pale orange filled area in Fig. 5(b), respectively. Fig. 6 shows the latency from the KAGRA experiment site at Kamioka to the main data system at Kashiwa. The median value of the latency (in units of seconds) within a one hour interval of the full (solid red line), trend (dashed green line), and science (dotted blue line) data are shown in this figure, respectively. These three plots are sent to the ICRR server and shown on the webpage. A snapshot of this webpage is shown in Fig. 7. The color of the square boxes at the top of the webpage indicates the current status of receiving the low-latency data from LIGO, Virgo, and KAGRA to Kashiwa and the bulk data transfer inside KAGRA. When the square is green, it means no problem is found; on the other hand, if the square is red, the situation it corresponds to is where the data transfer (sending and/or receiving) stopped due to an issue, including maintenance, etc. In the situation of Fig. 7, the Virgo panel is shown in red because the data is not being sent from Virgo to KAGRA. Therefore, by just looking at the top of the webpage, one can grasp whether the data transfer system is working properly or not at a glance. At the bottom of the webpage, one can see the detailed information on the data transfer operation status for the bulk data inside KAGRA and the receiving status of the low-latency data from LIGO, Virgo, and KAGRA in plain text, and one can obtain some daily summary plots of the bulk data and the low-latency data. The daily summary plots of the data transfer described above are shown in the middle of Fig. 7.
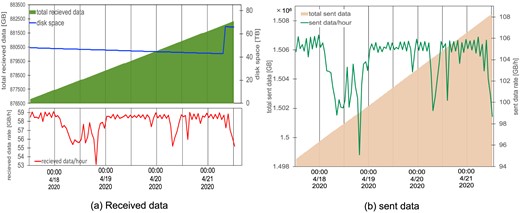
Example of a daily summary plot: (a) the amount of received data and (b) the amount of sent data at the server of the Kamioka surface building.
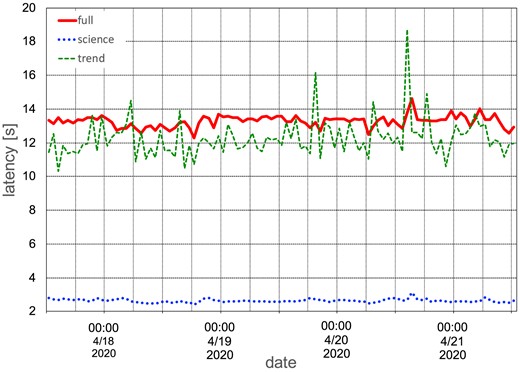
Plot of the latency from the KAGRA experiment site at Kamioka to the main data system at Kashiwa.
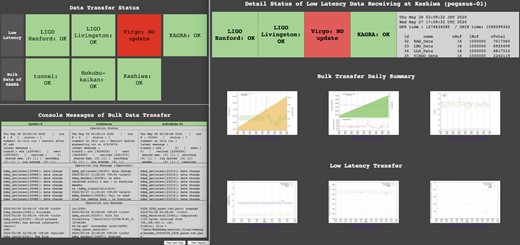
A snapshot of the webpage to check the status of data transfer operations. In this situation, the Virgo panel is shown in red because the data is not being sent from Virgo to KAGRA. The left- and right-hand windows correspond to the upper side and bottom side of the webpage, respectively.
In addition, we prepared another webpage to monitor the status of KAGRA’s calibrated low latency strain data, called ‘C10’, at the Osaka Metropolitan University server. This page provides C10 data in the time domain, its amplitude spectral density (ASD), spectrogram, and sky-averaged sensitivity to expected emission from binary neutron star coalescence, determined from the ASD. By making further improvements, this page will play roles not merely in checking the current status of the calibrated strain data but also in extracting some transient signals. These webpages may be useful to confirm the status of data transfer and low-latency data easily and quickly, even if the user is not an expert in these systems. These pages will be updated and improved in the future.
4. KAGRA international data tiers
4.1. ASGC Tier-1 center in Taiwan
The Academia Sinica Grid Center (ASGC) is located in the Academia Sinica campus in Taipei, Taiwan, and serves as a Tier-1 center of the Large Hadron Collider (LHC) worldwide grid. We use this opportunity to maximize the usage of hardware resources, particularly the data storage system, data transfer methods, and regular maintenance of the facility, without incurring a lot of cost or manpower. The Academia Sinica group in KAGRA is providing funding to purchase file servers and hard drives for ASGC, and ASGC is providing the installation, file server management, regular maintenance and so on, so that the duty and load to KAGRA members can be minimized.
All of the KAGRA full data are transferred from the Tier-0 center at the University of Tokyo Kashiwa campus to the data server at ASGC with a data rate of about 1.5 TB per day. ASGC has currently assigned 0.8 PB for KAGRA data storage, and it can be additionally increased by 0.5∼1 PB every year if needed. The assigned capacity is enough to keep the full KAGRA data permanently in long-term storage so that ASGC can serve as the data mirror center to back up the data which is located outside of Japan.
We use the xrootd protocol based on the worldwide GRID system for this purpose. xrootd was originally developed for LHC projects at CERN, the European Organization for Nuclear Research. The large amounts of data collected by High Energy Physics (HEP) experiments like the LHC require intensive data processing on a large scale in order to analyze and extract physics experimental results. The Worldwide LHC Computing Grid has been developed for such a purpose. The standard software used in HEP projects is called ROOT, which is a modular scientific software toolkit. It provides all the functionalities needed to deal with big data processing, statistical analysis, visualization, and storage. Therefore, the tools based on ROOT were considered to be essential for efficient scientific research, and xrootd has been developed as one of the components of ROOT and provides universal access to the distributed data across the worldwide computing centers.
In the case of KAGRA data transfers, the main reason to use xrootd is because of its reliability and transfer speed compared with standard Linux data transfer tools such as scp as well as the unified user authentication based on VOMS (Virtual Organization Membership Service) in grid computing, which is structured as a simple account database with fixed formats for the exchange of information and features single login, expiration time, backward compatibility, and multiple virtual organizations. Another advantage of using xrootd is that IT engineers who keep the system stably running 24 hours a day are familiar with LHC GRID tools such as xrootd, so they can provide their service with minimum additional duty and loads for KAGRA data management at ASGC. Due to its modern architecture and convenience for scientific users with supporting token-based authentication, LIGO also employs xrootd in data access on the open science GRID [22][23].
4.2. KISTI-GSDC tier center in Korea
The Global Science experimental Data hub Center (GSDC) belongs to the Korea Institute of Science and Technology Information (KISTI), located at Daejeon in Korea, which operates the National Supercomputing Center at a level of 25.7 PFLOPS (Peta FLoating point Operations Per Second). It aims at promoting data-intensive fundamental research by providing computing and storage resources and their operations. About 25 PB of storage and 12,000 CPU cores are used to support a variety of research areas dealing with large-scale data, including RENO experiments for neutrino research, genome sequencing projects for biomedical care, and HEP experiments such as Bell at KEK and ALICE/CMS experiments using LHC at CERN at the level of Tier-1/Tier-2 centers, respectively.
In particular, KISTI-GSDC supports all members of the Korean Gravitational Wave Group (KGWG), LIGO Scientific Collaboration (LSC) and KAGRA with 1,056 CPU cores (996 worker nodes), three GPU cards, 550 TB of storage, and a fast network connection to the Korea Research Environment Open NETwork (KREONET)2. At present, 50 per cent of worker nodes and 400 TB of storage are dedicated to all members of LSC for the service as the KISTI-GSDC LDG (LIGO Data Grid) Tier-2 Center. The remaining half of the worker nodes, 150 TB of storage and three GPU cards are allocated to all members of KGWG/KAGRA and their colleagues.
Some KAGRA full and trend data have been transferred from the Tier-0 Center at the Kashiwa Campus in Japan to KISTI-GSDC through the rsync-based transfer script provided by KAGRA. In the initial data transfer test between ICRR and KISTI, the value of the round-trip time (RTT) was poor, averaging 160 ms. In cooperation with KAGRA and KREONET, it was found that the network path between KISTI and ICRR was via Chicago, USA. Currently, the network path has been changed from TEIN (Trans-Eurasia Information Network) via Chicago to KREONet2-APAN-JP via Hong Kong, and the average RTT value has been improved to 92 ms. Currently, KISTI-LDG stores about 75 TB of data, such as some KAGRA full and trend data, and members of KAGRA are actively working with these data to develop KAGRA data analysis pipelines and noise identifications.
Finally, support for computing from KISTI-GSDC for the KAGRA experiment has been expanding since the collaboration of KGWG members started in around 2010. KISTI-GSDC will continue its support in various ways and plans finally to become a Tier-1 Center abroad, subject to available funds from the Korean government.
5. Data transfer and sharing with the global gravitational-wave detector network
Data sharing in the global gravitational-wave detector network proceeds via two different paths: low latency and high-latency data sharing.
Figure 8 shows the schematic diagram of data exchange between KAGRA and LIGO/Virgo. There are two layers of data sharing. Each layer consists of framelink for low latency (order of 1–10 s) and rucio (data GRID) for high-latency data, respectively. See sections 5.1 and 5.2 regarding these software applications.

Schematic diagram of data exchange between KAGRA and LIGO/Virgo. Data exchange between the global gravitational-wave detector network consists of two layers. The upper and lower part of this figure shows a low-latency and high-latency data exchange, respectively.
Latency in data analysis of gravitational waves is not determined only by network speeds, but is mainly influenced by four factors. Compared with bulk data cases, we have to consider them more carefully for calibrated data in data sharing. The first is the length of a data chunk. If we set the length to be a certain value, the latency to receive the first chunk will be greater than this value. Too short a chunk length, in contrast, leads to repetition of tedious processes and is likely to increase the total overhead of processing. The second factor is the calculation time to obtain a calibrated signal from the strain h(t). The strain h(t) is a conversion of the voltage measurement of the servo signal controlling the laser interferometer into its gravitational wave strain equivalent. This conversion requires the transfer function of the interferometer. Since it is a frequency-dependent function, we need to employ impulse response filters with calibration factor correction. Considering these two factors, we need to select an appropriate length of data chunk. The third factor is simply the network speed. The last is the time to search gravitational wave events in the data. In this paper, however, we will not discuss this further as the search time differs depending on the gravitational wave source. In any event, latency not exceeding the order of seconds is required for transient events.
5.1. Low-latency data sharing
For the cases of transient and occasional events of astronomical gravitational wave sources, a fast gravitational wave event search process is a key component of success. Data from observatories have to be acquired and transferred to the event analysis pipeline. To realize quick transfers on the order of seconds, we employ the Frame format and framelink software developed by LIGO and Virgo [24,25]. This software uses shared memory on the local server, and pushes or pulls other servers’ Frame format data to each shared memory, respectively.
A length of Frame time span can be chosen. In 2018, a 4-s length was used, and updated to using a 1-s length in observation in the year 2019. The size of typical Frame format data of 1 s is about 100–400 KB, which depends on the number of channels. The data includes the gravitational wave strain time series h(t), data quality state vectors, and a header data structure including a time stamp.
The latency of each data stream from gravitational wave observatories to the data server is determined by the data size, network transfer speed, and signal processing time that reconstructs the gravitational wave strain time series from the detector output. The latency from the KAGRA detector site, which is in the underground tunnel in the Kamioka-mine, to the main system at Kashiwa 300 km away, is about 3.5 s. The dominant delay is caused by the processing time for the strain reconstruction. LIGO and Virgo low-latency data are sent from a server at the California Institute of Technology. LIGO’s latency at KAGRA’s main system is about 7.5 s, and Virgo’s data latency is about 12–15 s. These latencies are shorter compared with the cadence of the event search pipeline in the observation run in 2020, but will not be enough in future observations. Therefore, attempts to make it faster, with just a few seconds' delay, are underway.
5.2. High-latency data exchange
Apart from the low-latency exchange of data, high-latency data exchange is also required.
For bulk data distribution and replication across multiple sites of LIGO and Virgo, the LIGO Data Replicator (LDR) was used until 2020, but it has now been replaced by Rucio [26], which was originally developed to allow the high-energy physics experiment ATLAS to manage its large volumes of data. It is a software framework that provides functionality to organize, manage, and access large volumes of scientific data using customizable policies. In order for KAGRA to join the network of bulk data distribution, we prepared a Grid-FTP server at the Kashiwa site. Data transfer in both directions is triggered from the LIGO side.
High-latency data transfers send and receive aggregate calibrated h(t) data in files of longer duration, e.g., one file consists of a time series of 4096 s ‘Frame’s in the case of KAGRA, and similarly for LIGO and Virgo data. These aggregated data include the final version of calibrated data that is regenerated offline with the best accuracy.
6. Summary
We have constructed a data transfer and storage system for KAGRA that can be safely stored in remote storage from the observation equipment in real-time. The data transmission speed achieved an average of 40 MB s-1 or more, which exceeded the observed data rate of about 20 MB s-1, enabling continuous operation without data loss. In addition, the data generated by the observation equipment installed underground are spooled by servers installed in the tunnel and on the ground facility to make it redundant and reduce the possibility of data loss due to network trouble and power outage. We also implemented security measures by isolating the data transfer environment by introducing a VPN. Finally, KAGRA data will be stored for a long time with petabyte-class storage and will be used for various gravitational wave data analyses.
In addition, we participated in data sharing with the global gravitational-wave detector network and supported the real-time sharing of observation data with low latency on the order of seconds and sharing of scrutinized data with high latency.
As described above, the KAGRA data system we constructed has the basic performance to support KAGRA’s observation in 2020.
Acknowledgement
This work was supported by MEXT, JSPS Leading-edge Research Infrastructure Program, JSPS Grant-in-Aid for Specially Promoted Research 26000005, JSPS Grant-in-Aid for Scientific Research on Innovative Areas 2905: JP17H06358, JP17H06361, and JP17H06364, JSPS Core-to-Core Program A. Advanced Research Networks, JSPS Grant-in-Aid for Scientific Research (S) 17H06133, the joint research program of the Institute for Cosmic Ray Research, University of Tokyo, National Research Foundation (NRF) and Computing Infrastructure Project of KISTI-GSDC in Korea, Academia Sinica (AS), AS Grid Center (ASGC) and the Ministry of Science and Technology (MoST) in Taiwan under grants including AS-CDA-105-M06, the LIGO project, and the Virgo project.
For the data exchange with the global gravitational-wave detector network, we would like to thank the LIGO and Virgo collaborations deeply.
Footnotes
References
