


Abstract
An attempt is made to theoretically estimate the values of electrical elements such as capacitance, resistance, and inductance for an ion sheath using experimental parameters. Quantitative estimations of the L, C and R components as a function of plasma density are analyzed for argon plasma at a particular electron temperature. The magnitude of the estimated grid bias approaches the real value for higher values of a correction factor.
1. Introduction
The basics of plasma sheath interaction physics have various roles to play in fundamental research of confined plasmas [1–3] and in the development of plasma-based technology in industrial applications. The physical understanding of boundary wall–plasma interaction processes has become a subject of fundamental importance both for basic [4,5] and applied interest [6]. The boundary wall modifies the plasma particle distributions in such a way that a thin layer of natural non-neutral plasma called a Debye sheath or ion sheath [7].
The richness (or excess) of positive or negative charges in this non-neutral layer formed in the vicinity of the biased electrode depends upon the polarity of the applied potential with respect to the bulk plasma. In the case of a highly negatively biased electrode or wall, a positive space-charge-limited sheath current is observable at the wall, which is normally described by the well-known Child–Langmuir law [8].
It is an established fact that the positive ion-rich sheath (in the Child limit) is equivalent to a series electrical circuit consisting of resistance (R), inductance (L), and capacitance (C) as the circuit elements under the diode-like ion sheath approximation in the presence of low frequency oscillation, but the oscillation frequency must be lower than the ion plasma frequency.
The physical origin of the sheath capacitance could be the formation of a localized positive space charge layer to shield the negative wall potential, and the origin of the sheath resistance could be associated with the ions in motion, which have to overcome the potential barrier to pass through the positive space charge layer. The physical origin of the sheath inductance is not clearly mentioned in literature, but it may be caused by some kind of ion fluctuation.
Prakash et al. studied the variation of these electrical components as a function of applied grid bias [9]. In the present work, we have theoretically estimated the frequency of oscillations for different densities of argon plasma at a constant electron temperature. The electrical components such as resistance, capacitance, and inductance for an ion sheath are estimated for a particular surface area at a fixed grid bias. The required plasma parameters are taken from an experiment performed in a double plasma (DP) device [10]. The sheath components are analyzed as a function of plasma density with few approximations.
2. Theory and estimation
For the theoretical estimation of sheath components, we have used experimental data from the work of Popa and Schrittwieser [11]. They performed an experiment in a DP device producing plasma only in the source chamber and using the target chamber as collector. Plasma leaked through the negatively biased (|${V}_{{\mathrm {G}}}$|) separating grid from source into target. The target chamber plasma was mainly a diffusion plasma [12]. The source chamber was at ground potential and the target chamber was either positively or negatively biased with respect to ground. The plasma potential in the target chamber changed almost linearly with the applied bias (|${V}_{{\rm T}}$|), which created a difference in plasma potential between source and target chambers, which was referred to as bi-potential asymmetry. When a positive space charge layer formed around the grid, low frequency instability was observed in the positively biased target chamber. The frequency of oscillation arises due to the asymmetric potential structure between the two plasma chambers.
For physical visualization, the source and target chambers along with the bias voltage applied to the grid (|${V}_{{\mathrm {G}}}$|) and the target chamber (|${V}_{{\mathrm {T}}}$|) are shown schematically in Fig. 1(a). The detail of the experimental setup is available in Ref. [11]. The asymmetric bi-potential structure produced in the system is also shown schematically in Fig. 1(b).
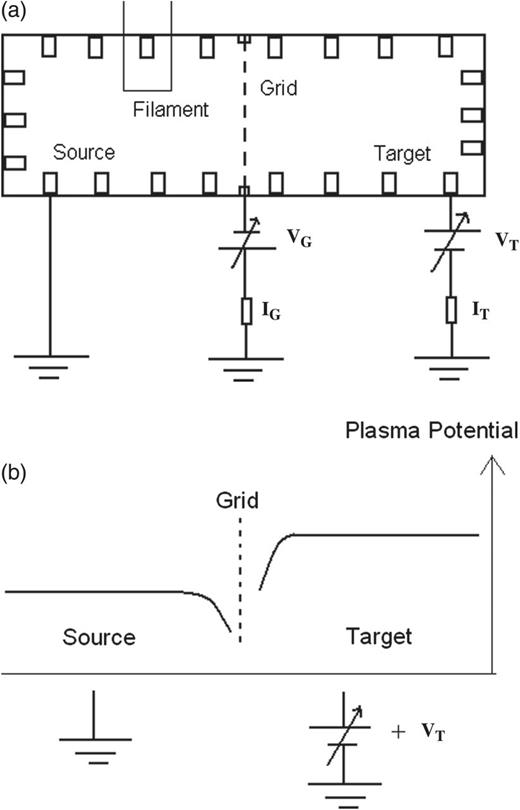
(a): Schematic diagram of a DP device showing source chamber, target chamber, and grid. The presence of filament indicates that plasma is solely produced in the source chamber. |${V}_{\mathrm {G}}$| and |${V}_{{\mathrm {T}}}$| are the grid and target chamber bias, respectively. |${\mathrm {I}}_{\mathrm { G}}$| and |$\hbox {I}_{{\mathrm {T}}}$| represent the grid and target chamber currents, respectively. (b): The difference in plasma potential in the source and target chambers caused by the target chamber bias |${V}_{{\mathrm {T}}}$|.
According to the experiment referred to here, |$f$| is the frequency observed in the target (diffusion) chamber and |$n$| is the plasma density of the source (discharge) chamber of the DP device.
The surface area of the grid (|$A$|) can be approximated by the cross section of the machine for low grid transparency.
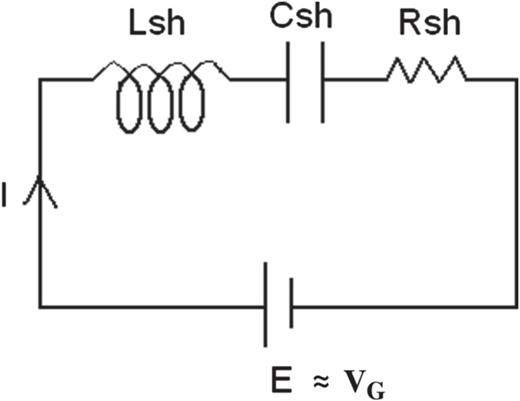
Schematic diagram of the sheath equivalent series LCR circuit. |$L_{\mathrm {sh}}$|, |$C_{\mathrm {sh}}$|, |$R_{\mathrm {sh}}$|, and |$E$| denote the sheath associated inductance, capacitance, resistance, and e.m.f., respectively. |$I$| denotes the Child current flowing through the circuit.
We have seen that for estimation of the sheath components one must know the plasma parameters such as density and electron temperature. We have used Eq. (1) to estimate the frequency of oscillations for different plasma densities at a constant grid bias |$V_{\mathrm { G}}$| obtained from Ref. [11]. Generally, the electron temperature changes with the change in discharge voltage, but in the experiment referred to here the electron temperature was very weakly dependent on the discharge current, in most cases in the range 2.8–3 eV, so they took a constant value of 2.9 eV.
Although Popa and Schrittwieser estimated plasma density by a different technique, we have used the density recorded by the Langmuir probe because it is the most simple and commonly used diagnostic tool.
The plasma parameters taken from Ref. [11] are shown in Table 1. The diameter of the machine was 0.44 m, which is approximated to be the diameter of the grid because of its low transparency (77 lines per centimeter), and hence the area |$A$| is approximately 0.152 m|$^{2}$|.
Plasma density and electron temperature from Ref. [11].
| Discharge current (mA) | Plasma density from Langmuir probe |$n\,(10^{14}\,m^{-3})$| | Effective electron temperature |$T_{\mathrm {e}}$| (eV) |
|---|---|---|
| 60 | 1.6 | 2.9 |
| 120 | 3.1 | |
| 180 | 4.5 | |
| 240 | 5.9 | |
| 300 | 7.5 |
| Discharge current (mA) | Plasma density from Langmuir probe |$n\,(10^{14}\,m^{-3})$| | Effective electron temperature |$T_{\mathrm {e}}$| (eV) |
|---|---|---|
| 60 | 1.6 | 2.9 |
| 120 | 3.1 | |
| 180 | 4.5 | |
| 240 | 5.9 | |
| 300 | 7.5 |
Again, the estimated frequency of oscillation (|$f$|) is found to be inversely proportional to the estimated sheath width (|$d$|), as can be seen from Figs. 3 and 4. The frequency of oscillation (|$f$|) and sheath width (|$d$|) are estimated using equation (1) and (5) respectively.
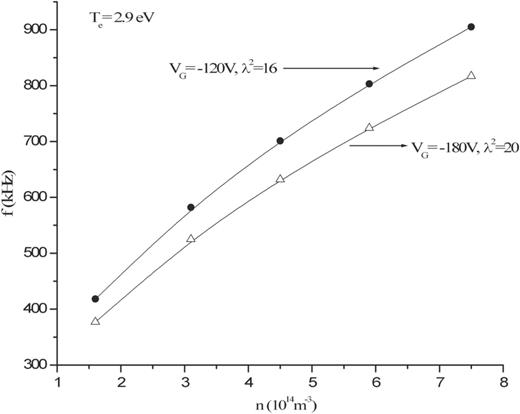
The variation of the estimated frequency (|$f$|) at different plasma densities (|$n$|) for fixed |$V_{{\mathrm {G}}}=-120$| V and |$-$|180 V at |$T_{{\mathrm {e}}}=2.9$| eV.
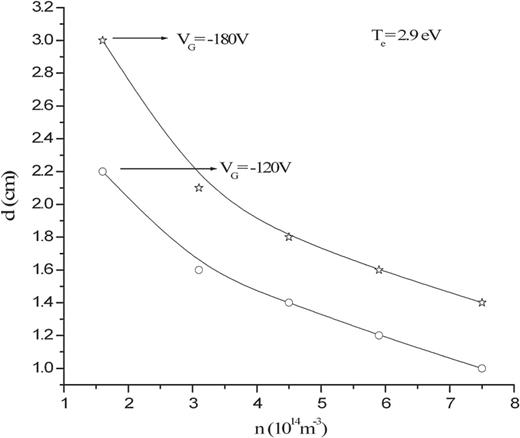
The variation of the estimated sheath thickness (|$d$|) at different plasma densities (|$n$|) for fixed |$V_{{\mathrm {G}}}=-120$| V and |$-$|180 V at |$T_{{\mathrm {e}}}=2.9$| eV.
The frequency of oscillation (|$f$|), ion plasma frequency (|$\omega _{ip}$|), ion transit time (|$\tau _{\mathrm {io}}$|), and |$\lambda ^{2}$|, calculated for different plasma densities for |$V_{{\mathrm {G}}}=-120$| V. The effective electron temperature 2.9 eV is considered.
| Plasma density |$n\, (10^{14}\,\hbox {m}^{-3})$| | |$f$| (kHz) | |$\tau _{\mathrm {io}}$| (|$\mu $|s) | |$\omega _{{\mathrm {pi}}}$| (MHz) | |$c_{\mathrm {s}}$| (10|$^{3}$| m/s) | Grid area |$A\, (m^{2})$| | |$\lambda ^{2}$| | |$d$| (cm) | |$f/f_{{\mathrm {ip}}}$| | |$\lambda _{\mathrm {De}}$| (cm) | |$D=d/\lambda _{\mathrm {De}}$| |
|---|---|---|---|---|---|---|---|---|---|---|
| 1.6 | 418 | 2.4 | 2.68 | 2.6 | 0.152 | 16 | 2.2 | 0.9 | 0.1 | |$\approx $|22 |
| 3.1 | 582 | 1.7 | 3.74 | 16 | 1.6 | 0.9 | 0.07 | 22 | ||
| 4.5 | 701 | 1.4 | 4.5 | 16 | 1.3 | 0.9 | 0.059 | 22 | ||
| 5.9 | 803 | 1.2 | 5.16 | 16 | 1.1 | 0.9 | 0.052 | 22 | ||
| 7.5 | 905 | 1.1 | 5.82 | 16 | 1 | 0.9 | 0.046 | 22 |
It is found that the estimated frequency of oscillation |$f$| increases with the increase in plasma density for a fixed grid bias voltage. The frequency has a lower value for higher negative values of |$V_{\mathrm {G}}$|. This is shown in Fig. 3. The ratio |$f/f_{{\mathrm {ip}}}$| (|$\approx $|0.9) remains constant. The ratio |$f/f_{{\mathrm {ip}}} <1$| suggests that the frequency of oscillation is always less than the ion plasma frequency. In such a case, the ion current across the sheath is at all times in equilibrium with the applied voltage and is often assumed to obey Child's law for a space-charge-limited current.
The sheath widths (|$d$|) obtained from relation (5) for different densities are plotted for two different grid bias voltages in Fig. 4. As usual, the sheath thickness was found to contract with the increase in density, and the sheath thickness was found to be greater for higher negative values of |$V_{{\mathrm {G}}}$|.
The values of |$R_{\mathrm {sh}}$| are calculated for different densities (frequency) using Eqs. (11) and (12). The estimated value of the sheath resistance was found to be of the order of |$10^{4}\Omega $|. The resistance decreases with the increase in plasma density and its value is higher for more negative values of |$V_{\mathrm {G}}$|. The variation of estimated sheath resistance with density is shown in Fig. 5.
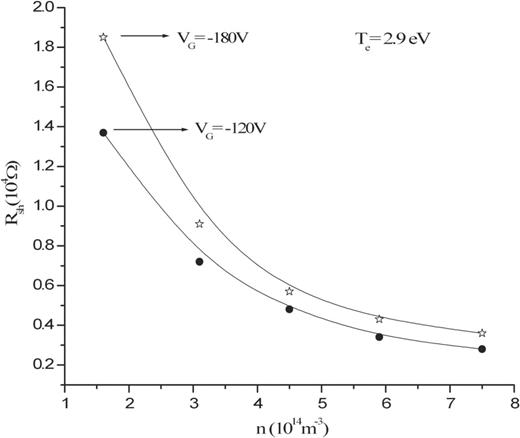
The variation of the estimated sheath resistance (|$R_{\mathrm {sh}}$|) at different plasma densities (|$n$|) for fixed |$V_{{\mathrm {G}}}=-120$| V and |$-$|180 V at |$T_{{\mathrm {e}}}=2.9$| eV.
The sheath capacitance at different densities was estimated using Eqs. (13) and (14), and was found to increase with the increase in plasma density. The estimated values of sheath capacitance lie in the range of |$10^{-10}$| Farad. The magnitude of the sheath capacitance decreases with increasing negative values of |$V_{\mathrm {G}}$|. The variation of estimated sheath capacitance with density is shown in Fig. 6.
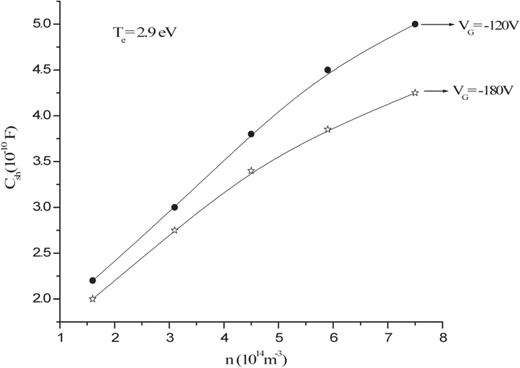
The variation of the estimated sheath capacitance (|$C_{\mathrm {sh}}$|) at different plasma densities (|$n$|) for fixed |$V_{{\mathrm {G}}}=-120$| V and |$-$|180 V at |$T_{{\mathrm {e}}}=2.9$| eV.
The sheath inductance at different densities was estimated using Eqs. (15) and (16). The negative values of the sheath inductance were found to decrease with an increase in plasma density. The sheath inductance possesses higher negative values for more negative |$V_{\mathrm {G}}$|. The estimated values of sheath inductance lie in the range of 10|$^{-3}$| Henry. The variation of estimated sheath inductance with density is shown in Fig. 7.
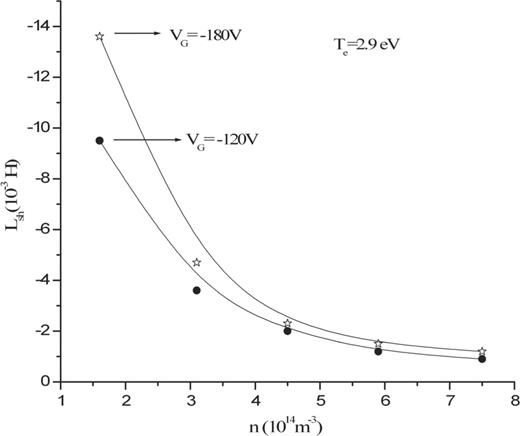
The variation of the estimated inductance (|$L_{\mathrm {sh}}$|) at different plasma densities for fixed |$V_{{\mathrm {G}}}=-120$| V and |$-$|180 V at |$T_{{\mathrm {e}}}=2.9$| eV.
Further, we can say that the sheath capacitance also behaves like a varactor diode. In such a diode, capacitance is inversely proportional to the thickness of the depletion region. Similarly, we have found that the estimated sheath capacitance is also inversely proportional to sheath thickness. In Fig. 8, the variation of sheath capacitance with sheath thickness is shown. Wood studied this behavior of ion sheaths using a variable capacitor model [20].
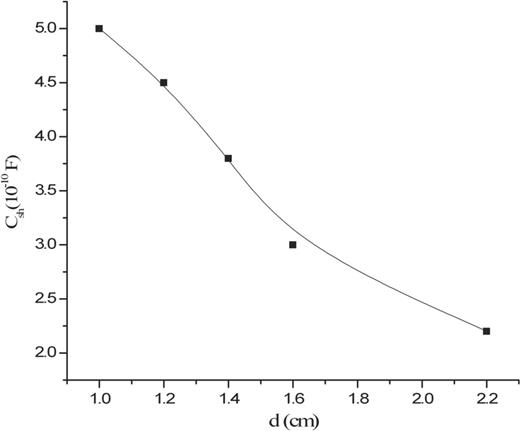
The variation of the estimated sheath capacitance (|$C_{\mathrm {sh}}$|) with sheath thickness (|$d$|).
The total charge in the sheath obtained from relations (18) and (19) was also found to increase with the increase in density, as shown in Fig. 9. For higher negative grid voltages, the value of the charge is found to be more. The estimated values of charge were found to lie in the range of 10|$^{-7}$| Coulomb.
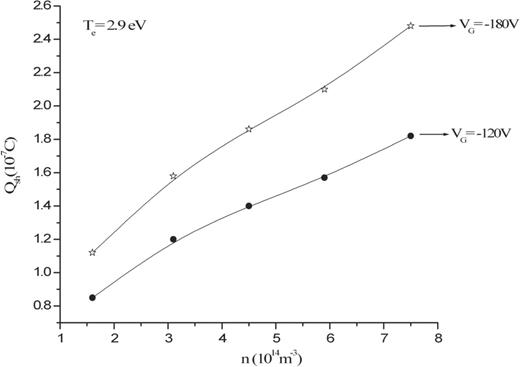
The variation of the estimated charge in the sheath (|$Q_{\mathrm {sh}}$|) at different plasma densities (|$n$|) for fixed |$V_{{\mathrm {G}}}=-120$| V and |$-$|180 V at |$T_{{\mathrm {e}}}=2.9$| eV.
The grid current |$I_{\mathrm {G}}$| at different plasma densities (sheath widths) are estimated using relations (23) and (24). The estimated grid current |$I_{\mathrm {G}}$| appeared in the range of mA, which is in agreement with the experimental values (Fig. 2(a) of Ref. [11]). The variations of |$I_{\mathrm {G}}$| for different plasma densities are plotted in Fig. 10.
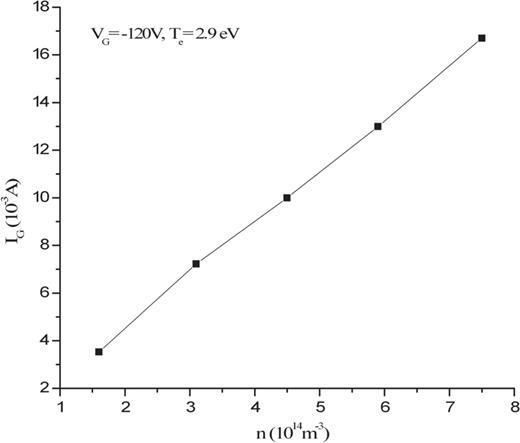
The variation of the estimated grid current (|$I_{\mathrm {G}}$|) at different plasma densities (|$n$|) for fixed |$V_{\mathrm {G}}=-120$| V at |$T_{{\mathrm {e}}}= 2.9$| eV.
Finally, to examine the reasonableness of the values of |$R_{\mathrm {sh}}$|, |$C_{\mathrm {sh}}$|, |$Q_{\mathrm {sh}}$|, and |$I_{\rm G}$| we have used relation (21) to get the approximate value of the grid bias |$V_{\mathrm {G}}$|.
Considering different values of the correction factor |$K=2$|, 3, 4, and 5, the approximate values of the grid bias |$V_{\mathrm {G}}$| were estimated. In Table 3, values of the estimated grid bias from relation (21) for different values of |$K$| at different plasma densities are shown. For |$K=2$|, the estimated value of the grid bias was found to be twice the magnitude of the grid bias (|$-$|120 V) used in the theoretical estimations, but as value of |$K$| increased, the estimated |$V_{\mathrm {G}}$| approached the magnitude of the assumed value, and at |$K=5$| both are nearly equal.
The estimated grid bias voltage at different plasma densities at |$V_{{\mathrm {G}}}=-120$| V for different values of |$K$|.
| Plasma density |$n\,(10^{14}\,\hbox {m}^{-3})$| | |$I_{\mathrm {G}}\,(10^{-3}A)$| | For |$K=2\ V_{\mathrm {G}}$| from Eq. (21) | For |$K=3$||$V_{\mathrm {G}}\,(V)$| | For |$K=4$||$V_{{\mathrm {G}}}\,(V)$| | For |$K=5$||$V_{{\mathrm {G}}}\,(V)$| |
|---|---|---|---|---|---|
| 1.6 | 3.5 | |$\approx $|240 | |$\approx $|176 | |$\approx $|144 | |$\approx $|124 |
| 3.1 | 7.2 | 240 | 176 | 144 | 124 |
| 4.5 | 10 | 240 | 176 | 144 | 124 |
| 5.9 | 13 | 240 | 176 | 144 | 124 |
| 7.5 | 16.7 | 240 | 176 | 144 | 124 |
As expected, the estimated |$V_{\mathrm {G}}$| was found to be independent of plasma density, as shown in Fig. 11.

The values of grid bias voltage |$V_{\mathrm {G}}$| estimated from Eq. (21) for different values of correction factor |$K$|.
Although there is no answer as to how to make the correct choice of |$K$| values, it is mentioned in the literature that for lower grid potentials, |$K=3$| seems to be more reasonable for close agreement of theoretical estimations with experimental findings [14].
3. Conclusion
The electrical components of an ion sheath were estimated by a simple analytical approach from experimental parameters. We have used formulae found in the literature to estimate these components as functions of argon plasma density. The plasma density was in the range of |$10^{14}\,\hbox {m}^{-3}$| and effective electron temperature was 2.9 eV. The estimated frequency of oscillation was in the range of few hundreds of kHz, which is below the ion plasma frequency.
The value of |$R_{\mathrm {sh}}$| was in the 10|$^{3}$| ohm range, |$C_{\mathrm {sh}}$| was in the 10|$^{-10}$| Farad range, and |$L_{\rm sh}$| was in the 10|$^{-3}$| Henry range. For a fixed grid bias voltage, the sheath resistance and inductance decrease with an increase in density, but sheath capacitance increases.
In the case of both resistance and inductance, the value was higher for higher negative values of |$V_{\mathrm {G}}$|, but in the case of sheath capacitance, the value is higher for lower negative values of |$V_{\mathrm {G}}$|. The magnitude of the estimated grid bias approached the real value (|$-$|120 V, assumed for theoretical estimations) as the value of |$K$| increased, and at |$K=5$| both were nearly equal.
This present study was undertaken for argon plasma having a grid area of 0.152 m|$^{2}$|, considering a constant electron temperature, and neglecting the presence of any impurity in the system. It can be extended to different grid areas for plasmas produced by any gas.
