


Abstract
We provide recent and detailed estimates of the prevalence of kinlessness (i.e., people lacking [close] kin) among older individuals in 27 countries. We add to the literature by considering a broad range of kinship ties and examining within-country variabilities by age, sex, education, and rurality of the residential area.
Using data from Wave 8 (2019–2020) of the Survey of Health, Ageing, and Retirement in Europe, we estimated the prevalence of kinlessness among individuals aged 65 and over in 26 European countries and Israel. We considered different definitions of kinlessness, from a less restrictive (based on the absence of both a partner and children) to a more restrictive one (absence of partner, children, grandchildren, parents, and siblings).
Kinlessness varied considerably across countries. The percentage of people aged 65 and over who lacked a partner and children ranged between 2% and 3.5% in the Czech Republic, Romania, Israel, and Bulgaria to more than 8% in Switzerland, Spain, Belgium, and Malta. The percentage of older people lacking all close kin considered (partner, children, grandchildren, parents, and siblings) ranged from 0.1% to 4.1%. In addition, there was substantial heterogeneity in kinlessness in some countries by age, sex, and rurality of the residential area, whereas, except for a few cases, we did not find significant differences by education.
Understanding the prevalence of kinless older adults is critical for policy-makers and healthcare providers to design appropriate support systems for this potentially vulnerable group of people.
In the complex tapestry of human relationships, kinship has historically occupied a central and indispensable role in shaping individual behaviors, conditions, and identities, as well as societal structures (Moffett, 2013). Kinlessness, which refers to the absence of close kin, represents a significant departure from traditional kinship structures. Although kinlessness has long existed at various life stages, such as in orphaned children or unmarried individuals, recent demographic shifts have exacerbated the trend, particularly among older adults. As a result, kinlessness has emerged as a critical area of scholarly inquiry (Margolis & Verdery, 2017; Verdery et al., 2019). Our study aims to provide up-to-date and detailed estimates of the prevalence of kinlessness across 26 European countries and Israel, as well as its variation across population subgroups.
The degree of kinlessness among older adults observed in a population at a given time is strongly influenced by past demographic trends, including fertility, mortality, partnership formation, and dissolution. Examining how such macro-level demographic trends affect the observed prevalence of kinlessness is a notably challenging endeavor (Caswell, 2019; Verdery, 2015; Verdery et al., 2019), and, indeed, it lies outside the scope of this study. Despite this complexity, it can be argued that increasing longevity in many countries over recent decades has led to a higher proportion of individuals who reach an advanced age with surviving kin. Conversely, recent trends in fertility act in the opposite direction: decreasing fertility levels over time imply shrinking kinship networks with fewer (grand)children and siblings, among others, and this effect may be intensified by reduced rates of partnership formation and increased rates of divorce (for an in-depth discussion, see Verdery et al., 2019). Prior research suggests that changes in fertility exert a greater influence on kinship network size than changes in mortality (Hammel, 2005). This trend has led to an increasing number of individuals reaching old age without close kin available, a pattern expected to intensify in the coming decades (Verdery & Margolis, 2017).
In the context of an aging population, examining the prevalence of kinlessness is particularly crucial because while kinship is vital for all individuals and communities, it becomes especially salient at older ages (Connidis & Barnett, 2018) as a source of social support (Carr & Springer, 2010; Umberson & Thomeer, 2020). Kin relationships offer emotional and practical support, companionship, and a sense of belonging, and previous research has shown that older adults who maintain close relationships with their kin are less likely to experience symptoms of depression and loneliness and more likely to have better health conditions (Arpino et al., 2022; Quashie et al., 2021). Informal caregiving by family members also helps older individuals avoid institutionalization (Wu et al., 2023). Additionally, kin exerts social control over each other’s health behaviors (Tucker, 2002; Umberson et al., 2010), placing pressure to avoid unhealthy behaviors and promote positive habits and lifestyles (Arpino et al., 2023).
Therefore, examining kinlessness is crucial for policy-makers and healthcare providers to develop effective support systems for this particular group of individuals who are at higher risk of experiencing health, social, and economic vulnerabilities (Carney et al., 2016).
Operationalization of Kinlessness
The concept of kinlessness is influenced by the socially evolving nature of kinship (Seltzer et al., 2005). Traditional family structures, characterized by nuclear families and kinship established through blood and marriage, have given way to more diverse forms of kinship relationships in Western societies (Furstenberg, 2020). Thus, all types of living (biological, adopted, and step-) children, as well as both married and cohabiting partners (even without legal recognition), should be considered when identifying the absence or presence of children and a partner. There is also a consensus regarding the importance of accounting for extended family, including grandchildren and siblings (Furstenberg, 2020). Conversely, ex-partners—namely, after divorce or separation—are not typically counted as available kin. However, due to data limitations, previous empirical studies on kinlessness have generally been unable to account for all main types of kin.
A few previous studies have focused on estimating the prevalence and sociodemographic characteristics of older individuals lacking a specific type of kin, such as children (Valerio et al., 2021) or grandchildren (Arpino et al., 2018; Margolis & Arpino, 2018). Brown and colleagues (2022) focused on sole family survivors, addressing older people who survive their family of origin (i.e., parents and siblings). Scholars have often defined kinlessness as the unavailability of both a partner and children (e.g., Mair, 2019; Plick et al., 2021), whereas others account for a more comprehensive array of kinship ties, including siblings (Verdery et al., 2019), and parents and siblings (Margolis & Verdery, 2017; Zhou et al., 2019). Despite the importance of grandchildren in the lives of many older adults (Bordone et al., 2023; Zanasi et al., 2023), research has often overlooked the availability of grandchildren in the definitions of kinlessness.
Contributions
We contribute to the literature by taking a cross-national perspective and providing estimates of four different definitions of kinlessness across countries. Based on data from Wave 8 (2019–2020) of the Survey of Health, Ageing, and Retirement in Europe (SHARE), we offer detailed and recent estimates for individuals aged 65 and over in 26 European countries plus Israel. A cross-national comparative perspective, allowing for the identification of differences (or similarities) across contexts, may enhance our understanding of kinlessness. Compared with the only other study that estimated kinlessness on a cross-national scale using data from 2015 (Verdery et al., 2019), we offer more recent estimates whereas also taking into account a broader set of kin types and kinlessness definitions.
We considered the (un)availability of five close kinship ties—partners (regardless of the legal formalization of the union), children, grandchildren, parents, and siblings—and estimated both the proportion of individuals lacking each type of kin separately and for different combinations. Children, grandchildren, and siblings include nonbiological ones. In particular, we propose four definitions of kinlessness, starting from the least restrictive, which defines kinlessness as the absence of both a partner and children. We then factored in additional definitions with increasing levels of restrictiveness, progressively adding the absence of grandchildren, parents, and siblings.
Furthermore, although previous studies have focused on within-country heterogeneity in kinship networks (Andersson & Kolk, 2023) or kinlessness within specific countries (Margolis & Verdery, 2017; Zhou et al., 2019), we examined within-country heterogeneity in kinlessness across several countries. Unlike the cross-national study conducted by Verdery et al. (2019), which investigated heterogeneities across population subgroups with a focus on assessing whether the characteristics of kinless individuals differ from those of non-kinless individuals (e.g., the gap in the percentage of low education between the two groups), our analyses addressed the prevalence of kinlessness among population subgroups. Specifically, we focused on differences by age, sex, education, and the type of area of residence, which are among the most relevant in influencing demographic trends that, in turn, may affect kinlessness (Lutz et al., 1998). As recently argued by Alburez-Gutierrez et al. (2022), heterogeneities in kin (un)availability significantly contribute to kinship inequalities from a socioeconomic perspective. Assessing within-country heterogeneities in kinlessness allows us to identify those subgroups of the older population that are at the highest risk of lacking family support. Additionally, the considered characteristics define population subgroups that may be easily targeted by policies and interventions.
Because it is difficult to predict which subgroups of the population display the highest levels of kinlessness, our approach was exploratory. When comparing kinlessness prevalence across age groups, two forces are predominantly at play: age (as individuals grow older, the likelihood of losing kin through death increases) and cohort (older individuals belong to cohorts characterized by different demographic dynamics, such as higher fertility). The combined effect of these two forces has challenging-to-predict and nonuniversal consequences on kinlessness.
As for sex differences, the prevalence of partnerless individuals may be expected to be higher among females because they tend to survive longer than males, thus making them more likely to lose their partners (who are also typically older; Oksuzyan et al., 2008). However, other dynamics, including differences between men and women in childlessness and partnership formation, further complicate the predictability of differences by sex in kinlessness.
Educational differences in kinlessness are shaped by educational gradients in the demographic forces affecting kinlessness and how these gradients have changed across cohorts. Nonstandard demographic behaviors that influence the likelihood of experiencing kinlessness at older ages, such as singlehood, divorce/separation, and childlessness, may be positively or negatively associated with education depending on the period, country, and specific behaviors considered (Beaujouan et al., 2016). For instance, the Second Demographic Transition framework argues that the adoption of nonstandard demographic and family behaviors is the result of a cultural shift and thus predicts that more-educated individuals are at higher risk of experiencing these behaviors (Lesthaeghe, 2014). Conversely, the pattern-of-disadvantage hypothesis (Perelli-Harris & Gerber, 2011) posits that individuals may experience nonstandard behaviors due to lower resources; accordingly, less-educated individuals would be more likely to “deviate” from traditional fertility and partnership patterns. In addition, the educational gap in mortality also differs across national contexts and over time (Bengtsson & Van Poppel, 2011).
Finally, kinlessness may be higher in urban areas because of the generally lower fertility rates among urban populations (Kulu, 2013) and because of internal migration from rural to urban areas coupled with the greater mobility of childless individuals (Thomas & Dommermuth, 2021). However, these dynamics can be context-dependent.
Data and Methods
The data analyzed in our study derived from Wave 8 of SHARE (Börsch-Supan et al., 2013). Based on computer-assisted personal interviewing, data collection began in October 2019 and was interrupted in March 2020 due to the outbreak of the coronavirus disease 2019 (COVID-19) pandemic. Our analyses included 27 countries: Austria, Belgium, Bulgaria, Croatia, Cyprus, Czech Republic, Denmark, Estonia, Finland, France, Germany, Greece, Hungary, Israel, Italy, Latvia, Lithuania, Luxembourg, Malta, Netherlands, Poland, Romania, Slovakia, Slovenia, Spain, Sweden, and Switzerland.
Our sample only consisted of individuals aged 65 and over at the time of the survey. Therefore, the analytical sample included people born between 1920 and 1955. Considering only older adults, and specifically individuals aged 65 and over, rather than considering a broader group of individuals, namely those aged 50 and over, represents an added value of our study. In fact, this allowed us to focus solely on the specific segment of the population where kinlessness starts to become relevant in terms of prevalence and may entail deleterious consequences, such as diminished chances for receiving family care (Wu et al., 2023). Additionally, in Wave 8 of SHARE, the refreshment samples could only be partially drawn due to the interruptions caused by the pandemic, thereby affecting the representativeness of the youngest age group but not that of the oldest one (Zanasi et al., 2023). Analyzing Wave 9 (2021–2022) would not have solved this issue, as no new refreshment samples were added in that wave (Bergmann et al., 2024); instead, it would possibly introduce bias in the estimates due to the excess of mortality that significantly affected the oldest age groups during the pandemic. In any case, using calibrated cross-sectional weights (Bergmann & Börsch-Supan, 2021) to account for survey design and attrition further addressed potential issues of representativeness in the data from Wave 8.
In each wave, SHARE collects data on different types of living kin, including partners, children, grandchildren, parents, and siblings. For each kin type, we built dummy variables, assigning a value of 1 for respondents who lacked that specific kin. Partners included those in a legally recognized union (marriage or registered union), regardless of their cohabitation in the same household, and cohabiting partners, even if not legally bonded. Widowed individuals and those who were divorced or separated from their partners were considered partnerless unless they were in a new partnership at the time of the interview. Children included biological, adopted, and stepchildren alive at the time of the interview. Grandchildren also included both biological and nonbiological offspring of respondents’ children. In SHARE, information on parents is restricted to biological parents, whereas siblings also include nonbiological relations (namely, half or stepsiblings).
In addition to estimating the prevalence of lacking each type of kin separately, we estimated the prevalence of kinlessness according to four definitions based on progressively lacking a more extended set of kin:
- K1: absence of partner and children;
- K2: absence of partner, children, and grandchildren;
- K3: absence of partner, children, grandchildren, and parents;
- K4: absence of partner, children, grandchildren, parents, and siblings.
Prevalence estimates, which are reported in tables and figures as percentages, were obtained as sample proportions by country (multiplied by 100), with observations weighted using the cross-sectional calibrated weights provided by SHARE that account for sampling design and attrition (De Luca et al., 2021). As previously stated, we also examined within-country heterogeneity in kinlessness. Specifically, we contrasted the percentage of kinless individuals differentiating between two age groups (65–79 and 80 and over), sex, two educational groups (low and high education, according to the ISCED classification, where a high educational level is defined as having at least a high school degree), and two types of residential areas (urban, including those who declared living in big cities, their suburbs, or large/small towns, and rural, which refers to rural areas or villages). The sample sizes according to age, sex, education, and type of residential area for each country are reported in Supplementary Table 1.
Results
Prevalence of Kinlessness Across Countries
Table 1 presents estimates of the percentage of individuals aged 65 years and over lacking a specific type of kin and the percentages of kinlessness based on our different definitions (namely from K1 to K4, in bold in the Table) for the 27 countries included in our analyses. The countries are listed in ascending order according to K1 (i.e., for increasing percentages of those lacking a partner and children). To compare countries in terms of kinlessness prevalence, we present 83.5% confidence intervals (in parentheses), with an overlap between two intervals indicating that the corresponding estimated percentages were not statistically different at the 5% level, whereas nonoverlap indicates a significant difference (Goldstein & Healy, 1995). Later, we discuss differences between countries only when statistically significant (p < .05). For completeness, Supplementary Table 2 reports 95% confidence intervals, which are more appropriate for assessing the uncertainty associated with each estimate separately.
Weighted Estimates and 83.5% Confidence Intervals (CIs) for Approximate 5% Pairwise Comparisons of the Percentage of People Aged 65 and Over Without Each Type of Kin Separately and According to Our Four Definitions of Kinlessness and Country
| Countries | No partner | No children | K1 (no partner & no children) | No grandchildren | K2 (K1 + no grandchildren) | No parents | K3 (K2 + no parents) | No siblings | K4 (K3 + no siblings) |
|---|---|---|---|---|---|---|---|---|---|
| Czech Republic | 35.9 (34.1, 37.7) | 3.2 (2.6, 3.9) | 2.0 (1.5, 2.6) | 7.7 (6.8, 8.7) | 1.8 (1.3, 2.4) | 93.4 (92.1, 94.5) | 1.8 (1.3, 2.4) | 29.4 (27.8, 31.2) | 0.4 (0.3, 0.7) |
| Romania | 42.5 (39.4, 45.6) | 5.1 (4.0, 6.6) | 3.3 (2.3, 4.6) | 12.3 (10.5, 14.4) | 2.7 (1.8, 3.9) | 97.2 (96.3, 97.9) | 2.7 (1.8, 3.9) | 27.5 (24.6, 30.6) | 0.6 (0.3, 1.3) |
| Israel | 31.7 (28.8, 34.8) | 4.5 (3.4, 6.0) | 3.4 (2.4, 4.7) | 11.2 (9.0, 13.9) | 2.8 (1.9, 4.0) | 91.6 (89.8, 93.0) | 2.4 (1.5, 3.6) | 18.4 (16.4, 20.6) | 0.7 (0.4, 1.3) |
| Bulgaria | 54.9 (51.8, 57.9) | 5.7 (4.3, 7.4) | 3.5 (2.4, 5.2) | 12.5 (10.6, 14.8) | 2.6 (1.7, 4.2) | 96.7 (95.3, 97.6) | 2.6 (1.7, 4.2) | 42.1 (39.1, 45.2) | 1.1 (0.6, 2.1) |
| Cyprus | 36.8 (32.9, 40.8) | 5.0 (3.5, 7.2) | 3.9 (2.5, 6.0) | 15.1 (12.3, 18.5) | 3.7 (2.3, 5.8) | 91.5 (88.7, 93.7) | 3.7 (2.3, 5.8) | 8.6 (6.8, 10.8) | 0.1 (0.0, 0.5) |
| Denmark | 37.7 (35.8, 39.6) | 6.5 (5.6, 7.5) | 3.9 (3.1, 4.8) | 12.6 (11.4, 13.9) | 3.9 (3.1, 4.8) | 93.6 (92.6, 94.8) | 3.7 (3.0, 4.5) | 20.6 (19.1, 20.1) | 1.3 (0.9, 1.9) |
| Poland | 45.5 (43.3, 47.7) | 5.5 (4.5, 6.7) | 4.3 (3.3, 5.4) | 10.9 (9.6, 12.4) | 4.2 (3.2, 5.3) | 93.4 (92.3, 94.4) | 3.9 (3.0, 5.0) | 22.6 (20.8, 24.6) | 0.3 (0.1, 0.6) |
| Slovenia | 42.8 (41.0, 44.6) | 5.9 (5.1, 6.9) | 4.6 (3.9, 5.5) | 12.9 (11.7, 14.2) | 4.4 (3.6, 5.3) | 94.0 (93.1, 94.8) | 4.1 (3.4, 5.0) | 22.3 (20.9, 23.8) | 0.6 (0.4, 1.1) |
| Hungary | 57.4 (52.3, 62.3) | 10.1 (7.5, 13.4) | 5.1 (3.1, 8.2) | 21.2 (16.8, 22.6) | 4.6 (2.7, 7.7) | 95.9 (94.2, 97.2) | 4.4 (2.5, 7.6) | 50.4 (45.1, 55.8) | 1.7 (1.0, 2.9) |
| Croatia | 42.9 (40.1, 45.7) | 9.2 (7.7, 11.0) | 5.1 (3.9, 6.7) | 15.4 (13.6, 17.5) | 4.0 (2.9, 5.5) | 94.6 (93.2, 95.8) | 3.6 (2.6, 5.0) | 29.5 (27.0, 32.0) | 1.8 (1.1, 2.8) |
| Netherlands | 31.7 (29.8, 33.7) | 10.0 (8.8, 11.3) | 5.2 (4.3, 6.3) | 20.5 (18.9, 22.1) | 5.2 (4.3, 6.3) | 94.9 (94.0, 95.7) | 4.9 (4.0, 6.0) | 12.0 (10.8, 13.4) | 0.7 (0.4, 1.2) |
| Slovakia | 47.4 (43.6, 51.3) | 10.0 (7.9, 12.7) | 5.5 (3.8, 7.9) | 17.7 (15.1, 20.6) | 4.4 (3.0, 6.5) | 97.5 (96.3, 98.3) | 4.4 (3.0, 6.5) | 47.0 (43,2, 50.8) | 2.9 (1.7, 4.8) |
| Lithuania | 49.4 (46.9, 51.9) | 8.3 (7.0, 9.9) | 5.5 (4.4, 6.9) | 15.5 (13.8, 17.5) | 5.2 (4.1, 6.6) | 96.5 (95.4, 97.3) | 5.2 (4.1, 6.6) | 26.4 (24.2, 28.7) | 1.2 (0.7, 1.9) |
| Germany | 39.9 (38.1, 41.7) | 10.3 (9.2, 11.5) | 5.9 (5.0, 7.0) | 24.4 (22.9, 26.0) | 5.7 (4.8, 6.7) | 93.7 (92.9, 94.4) | 5.4 (4.6, 6.5) | 28.6 (27.0, 30.2) | 1.6 (1.2, 2.2) |
| Austria | 38.8 (36.5, 41.1) | 8.8 (7.7, 10.1) | 5.9 (4.9, 7.0) | 19.8 (18.1, 21.6) | 5.5 (4.6, 6.6) | 94.2 (93.0, 95.1) | 5.2 (4.3, 6.3) | 29.3 (27.2, 31.4) | 1.6 (1.2, 2.3) |
| Sweden | 40.3 (38.6, 42.0) | 8.0 (7.1, 9.1) | 6.0 (5.1, 6.9) | 16.1 (14.8, 17.4) | 5.6 (4.8, 6.6) | 92.1 (91.0, 93.0) | 5.2 (4.4, 6.1) | 22.8 (21.5, 24.2) | 1.3 (1.0, 1.9) |
| Italy | 34.1 (32.0, 36.2) | 11.9 (10.6, 13.4) | 6.0 (5.0, 7.2) | 23.6 (21.9, 25.4) | 4.0 (3.2, 5.0) | 95.6 (94.7, 96.3) | 3.8 (3.0, 4.8) | 25.4 (23.6, 27.3) | 1.3 (0.9, 2.0) |
| Greece | 32.5 (31.0, 34.1) | 9.4 (8.5, 10.3) | 6.1 (5.4, 6.9) | 28.7 (27.4, 30.2) | 5.8 (5.1, 6.6) | 94.4 (93.7, 95.1) | 5.4 (4.7, 6.2) | 26.0 (24.6, 27.3) | 2.0 (1.6, 2.0) |
| France | 38.6 (37.0, 42.2) | 9.1 (8.2, 10.1) | 6.6 (5.8, 7.5) | 17.0 (15.8, 18.3) | 6.2 (5.4, 7.1) | 90.7 (89.7, 91.6) | 5.7 (5.0, 6.5) | 22.2 (20.8, 23.6) | 1.4 (1.0, 1.8) |
| Latvia | 50.4 (47.1, 53.7) | 9.8 (8.1, 11.8) | 7.2 (5.7, 9.0) | 19.0 (16.5, 21.7) | 6.0 (4.6, 7.7) | 95.8 (94.0, 97.0) | 5.8 (4.5, 7.5) | 49.4 (46.0, 52.7) | 4.1 (3.0, 5.6) |
| Finland | 41.0 (36.9, 45.2) | 9.4 (7.2, 12.3) | 7.3 (5.2,10.2) | 24.1 (20.9, 27.7) | 7.1 (5.0, 10.0) | 91.1 (88.3, 93.3) | 6.7 (4.6, 9.6) | 16.6 (13.6, 20.2) | 2.4 (1.1, 5.1) |
| Luxembourg | 40.2 (37.0, 43.5) | 12.6 (10.6, 14.9) | 7.4 (5.7, 9.5) | 27.3 (24.6, 30.1) | 7.4 (5.7, 9.5) | 93.3 (91.7, 94.6) | 7.1 (5.4, 9.2) | 26.1 (23.4, 29.0) | 1.5 (0.8, 2.8) |
| Estonia | 54.3 (52.7, 55.8) | 9.3 (8.4, 10.3) | 7.6 (6.7, 8.5) | 15.8 (14.7, 17.0) | 6.6 (5.8, 7.5) | 95.4 (94.7, 96.1) | 6.3 (5.6, 7.2) | 37.0 (35.5, 38.5) | 2.5 (2.0, 3.0) |
| Switzerland | 37.7 (35.8, 39.6) | 15.2 (13.9, 16.7) | 8.1 (7.0, 9.2) | 30.8 (29.1, 32.) | 7.7 (6.7,8.9) | 92.5 (91.4, 93.4) | 7.2 (6.2, 8.3) | 19.6 (18.1, 21.1) | 1.7 (1.3, 2.4) |
| Spain | 40.3 (37.9, 42.8) | 11.5 (9.9, 13.2) | 8.4 (7.0, 10.0) | 20.5 (18.6, 22.6) | 7.5 (6.2, 9.1) | 95.6 (94.5, 96.5) | 7.1 (5.8, 8.7) | 24.9 (22.8, 27.0) | 1.9 (1.2, 2.8) |
| Belgium | 38.1 (36.1, 40.2) | 12.0 (10.6, 13.4) | 8.5 (7.3, 9.8) | 20.4 (18.8, 22.2) | 8.3 (7.2, 9.6) | 94.0 (93.0, 94.9) | 8.1 (7.0, 9.4) | 25.7 (23.9, 27.6) | 3.3 (2.5, 4.3) |
| Malta | 31.4 (28.2, 34.8) | 16.3 (13.9, 18.9) | 8.7 (6.8,11.0) | 21.7 (18.9, 24.9) | 7.7 (6.0, 10.0) | 92.8 (90.9, 94.3) | 7.4 (5.7, 9.6) | 5.4 (4.1, 7.1) | 1.1 (0.5, 2.2) |
Notes: Countries are in ascending order of K1. Values of K1-K4 in bold. Calibrated cross-sectional weights were used to account for survey design and attrition. Confidence intervals at the 83.5% level were calculated to allow testing the difference between any pair of two estimated percentages at an approximate 5% significance level.
Source: Authors’ elaborations on SHARE data, Wave 8, 2019–2020.
Substantial variability emerged across countries in the prevalence of kinlessness. The prevalence of older individuals lacking a partner ranged from less than one-third in countries such as Malta, Israel, Netherlands, and Greece to more than half in Latvia, Estonia, Bulgaria, and Hungary. These disparities across countries in the prevalence of individuals without a partner were primarily attributed to variations in widowhood levels (which ranged between 19.7% in Sweden to 49.4% in Bulgaria) but also, to some extent, to differing rates of individuals who never married and those who were separated/divorced (see Supplementary Table 3). Considerable diversity was also evident in the proportion of childlessness, albeit with lower absolute values, ranging from around 5% in the Czech Republic, Israel, Cyprus, and Romania to over 15% in Switzerland and Malta.
The absence of both a partner and children is combined in our first definition of kinlessness (K1). The lowest levels, ranging from 2% to 4%, were observed in the Czech Republic, Romania, Israel, Bulgaria, Cyprus, and Denmark. Values exceeding 8% were found in Switzerland, Spain, Belgium, and Malta. Besides substantial between-country variability in K1, we note that countries cannot be easily categorized according to geographical clusters typically employed in family studies. To better highlight this within-group variability, Supplementary Table 4 reports the values of the four definitions of kinlessness included in Table 1 but with countries rearranged according to geographical areas. Among Northern European countries, K1 ranged from 3.9% in Denmark to 7.3% in Finland. Similarly, for Eastern European countries K1 values ranged from 2% in Czech Republich to 7.6% in Estonia. Conversely, all larger southern European countries exhibited similar medium-to-high values, ranging from around 6% in Italy and Greece to 8.4% in Spain (additionally, differences among them were not statistically significant).
Continuing the examination of Table 1 and moving to consider the third type of kin, grandchildren, we found that the prevalence of grand-childlessness, obviously exceeding that of childlessness, varied significantly across countries, ranging from 7.7% in the Czech Republic to 30.8% in Switzerland. The rank ordering of countries in terms of grand-childlessness closely mirrors that in childlessness, although variations could be attributed to country differences in fertility levels and fertility timing of older generations’ offspring and (child) mortality.
A lack of grandchildren is accounted for in our second definition of kinlessness. Due to its more stringent criteria, K2 (i.e., lacking a partner, children, and grandchildren) values naturally exhibited lower prevalence compared with K1 in all countries. Nevertheless, the gap between K2 and K1 varied between minimal discrepancies of almost 0 percentage points, observed in countries like Denmark, Netherlands, and Luxembourg, to more substantial differences of over 1 percentage point in countries such as Croatia, Slovakia, Latvia, and Italy. This variability is closely related to the percentage of grandparents among childless individuals, likely linked to different levels of child mortality across countries (a detailed breakdown of which can be found in Supplementary Table 5).
Moving to the fourth kin type, parents, it is noteworthy that although the percentage of older people with at least one surviving parent was generally small across the countries considered, it exceeded 8% in France, Finland, Cyprus, and Israel. Therefore, in these countries, our third measure of kinlessness, K3—which considered those without a partner, children, grandchildren, and any living parent—slightly decreased. In the rest of the considered countries, K3 was very similar to K2.
Finally, the percentage of older people who lacked siblings also showed considerable cross-country variability, with values ranging from less than 10% in Malta and Cyprus to approximately 50% in Slovakia, Latvia, and Hungary. Because a significant proportion of individuals we examined had siblings, including this kinship tie in our fourth definition of kinlessness (K4, lack of a partner, children, grandchildren, parents, and siblings) substantially reduced the prevalence of kinless individuals. Indeed, the prevalence of older individuals without any of the five types of kin considered was generally low, but, again, it varied significantly across countries. On one end, there were countries with K4 values lower than 1% (Cyprus, Poland, the Czech Republic, Romania, Slovenia, Israel, and the Netherlands); on the opposite end, there were countries where this percentage was 2.5% and higher (Estonia, Slovakia, Belgium, and Latvia).
In summary, the degree of kinlessness is influenced by the specific types of kin included in its definition, leading to a prevalence of kinlessness that varied significantly across countries and with rankings that differed for each of the definitions adopted. For instance, some countries with a high prevalence of partnerless individuals exhibited lower percentages of childlessness (e.g., Bulgaria) or vice versa (e.g., Italy and Malta). A few countries with the highest values of K1 (no partner and children) reported relatively low levels of the most restrictive K4 measure (no partner, children, grandchildren, parents, and siblings). This was the case in Malta and Switzerland, where the percentages were 8.7% and 8.1% for K1, and 1.1% and 1.7% for K4, respectively. This seems to result from high levels of childlessness, which were offset by relatively low rates of individuals lacking parents and siblings. Consequently, the overall agreement of the country rankings based on K1 and K4 is far from perfect (Kendall’s tau correlation among the ranks was 0.63), and, except for Slovakia, differences between K1 and K4 were statistically significant for all countries.
Heterogeneities in Kinlessness Prevalence Across Population Subgroups
We now turn to our examination of potential heterogeneity in kinlessness within countries, focusing on the first and last definitions of kinlessness, namely, K1 and K4. Figures 1–4 illustrate the prevalence of kinlessness for two groups defined respectively by age, sex, education, and type of residential area. In each figure, countries are listed in ascending order according to the overall proportion of K1 (lack of both a partner and children), as in Table 1. Statistically significant differences between the two groups (p < .05) are indicated with an asterisk, and the country labels on the y-axes are colored with the same color as the group displaying the highest prevalence of kinlessness. Numerical values of K1 and K4, together with their differences and p-values of tests of equivalence between the groups, are reported in Supplementary Tables 6–9.
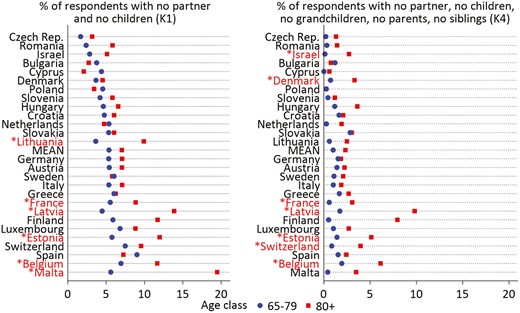
Weighted estimates of the percentage of people without a partner and children (K1) and without all close kin considered (K4) according to age groups and country. Notes: Countries are in ascending order of K1. Calibrated cross-sectional weights were used to account for survey design and attrition. In case of statistically significant differences between the two groups (p < .05), country labels on the y-axes are indicated with an asterisk and colored with the same color as the group with the highest prevalence of kinlessness. Source: Authors’ elaborations on SHARE data, Wave 8, 2019–2020.
As shown in Figure 1, the prevalence of both K1 and K4 tended to be higher among the older age group considered (80 and over; statistically significant differences were found in six countries for K1 and in seven for K4). However, age patterns in the prevalence of kinlessness were extremely diversified across countries. Although the age gaps were minimal in several countries, they were substantial in others, with the prevalence of kinlessness among the oldest individuals being more than double that of the youngest ones (e.g., in Estonia, Latvia, and Lithuania for K1).
Kinlessness patterns were even more diversified across countries when considering sex differences (Figure 2). In fact, although differences by sex were small and statistically nonsignificant in the majority of countries, kinlessness was significantly higher among women in some countries (seven countries for K1 and three for K4). We also identified a few countries where men showed significantly higher levels of lacking a partner and children (four countries for K1 and one country for K4).
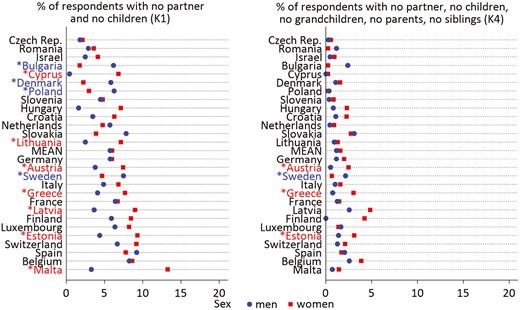
Weighted estimates of the percentage of people without a partner and children (K1) and without all close kin considered (K4) according to sex and country. Notes: Countries are in ascending order of K1. Calibrated cross-sectional weights were used to account for survey design and attrition. In case of statistically significant differences between the two groups (p < .05), country labels on the y-axes are indicated with an asterisk and colored with the same color as the group with the highest prevalence of kinlessness. Source: Authors’ elaborations on SHARE data, Wave 8, 2019–2020.
Figure 3 shows that, with the exception of a few cases, we did not find noteworthy differences in kinlessness according to education. K1 was significantly higher for less-educated individuals only in Malta and for more-educated individuals in Latvia. K4 was significantly higher among more-educated older adults only in France and Latvia. We also considered an alternative (relative) measure of education to guarantee a more homogeneous distribution across countries that produced similar results (see Supplementary Material Section B for details on the operationalization and results).
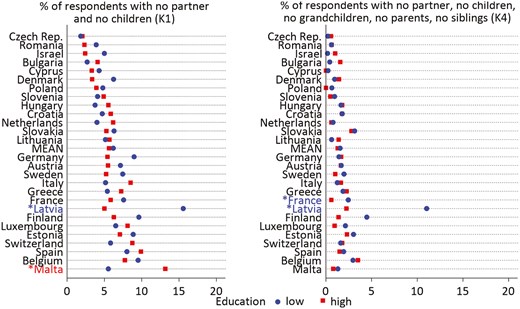
Weighted estimates of the percentage of people without a partner and children (K1) and without all close kin considered (K4) according to educational level and country. Notes: Countries are in ascending order of K1. Calibrated cross-sectional weights were used to account for survey design and attrition. In case of statistically significant differences between the two groups (p < .05), country labels on the y-axes are indicated with an asterisk and colored with the same color as the group with the highest prevalence of kinlessness. Source: Authors’ elaborations on SHARE data, Wave 8, 2019–2020.
Finally, when considering the area of residence (Figure 4), it is evident that kinlessness was significantly higher in urban areas in several countries (eight countries for K1 and four for K4). The only noteworthy exception in the opposite direction was found for K1 in Slovakia, where kinlessness was more prevalent in rural than in urban areas.
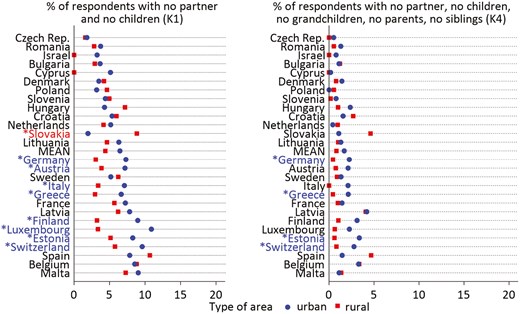
Weighted estimates of the percentage of people without a partner and children (K1) and without all close kin considered (K4) according to the type of residential area and country. Notes: Countries are in ascending order of K1. Calibrated cross-sectional weights were used to account for survey design and attrition. In case of statistically significant differences between the two groups (p < .05), country labels on the y-axes are indicated with an asterisk and colored with the same color as the group with the highest prevalence of kinlessness. Source: Authors’ elaborations on SHARE data, Wave 8, 2019–2020.
Discussion
Social support for older individuals in many countries traditionally relies heavily on kin, who play a pivotal role in providing care, assistance, and emotional support (Umberson & Thomeer, 2020). However, contemporary shifts in demographics and societal structures may challenge the sustainability of this system.
In this study, we used data from Wave 8 (2019–2020) of SHARE to examine the prevalence of kinlessness among individuals aged 65 and over across 26 European countries plus Israel. Although a previous cross-national study (Verdery et al., 2019) included some of the same SHARE countries we considered, it focused on a broader group of people aged 50 and above in 2015. Therefore, although their sample somewhat overlaps with our own, our findings are not directly comparable. Additionally, we expanded the types of kin considered (partner, children, grandchildren, parents, and siblings), providing estimates for the prevalence of individuals lacking each type of kin separately, and proposed four definitions of kinlessness that were progressively more restrictive.
Cross-national Variability in Kinlessness Prevalence
The prevalence of older individuals without a partner ranged from approximately 30% to over 50%. These disparities across countries result from factors such as widowhood, partnership formation, and divorce. Childlessness also exhibited significant cross-national diversity, with percentages fluctuating from under 5% to over 15%. These variations are closely linked to past fertility trends and, to a lesser extent, experiences of child mortality. The prevalence of kinlessness according to our first definition (K1, the absence of a partner and children) ranged between 2% and almost 9% across countries.
Partners and children often serve as the primary sources of support for older people (Umberson & Thomeer, 2020). However, it is essential to consider extended kinship ties, which are in line with the perspective advocated by several scholars (e.g., Furstenberg, 2020). Adhering to this call, we also accounted for other types of kin, such as grandchildren, parents, and siblings, which have been often overlooked in previous studies on kinlessness. Because grandparenthood represents a significant life transition for many older individuals (Di Gessa et al., 2020; Thiele & Whelan, 2006), our second definition of kinlessness (K2) also accounted for the availability of grandchildren. The ranking of countries based on K2 differed from that based on K1 due to variations in the prevalence of grand-childlessness, ranging from about 8% to 30%. This finding may be attributed to factors such as fertility dynamics (intensity and timing) among the individuals examined and their offspring, as well as mortality trends, including child mortality. As Margolis and Verdery (2019) noted, it is worth mentioning that some individuals, especially the youngest, who lacked grandchildren at the time of the survey may become grandparents later in life.
Our third definition of kinlessness (K3) included parents among the set of close kin considered. In the age group we focused on, the availability of parents was limited. The percentage of individuals aged 65 and above without both living parents varied from about 91% to 98%, which only slightly affected kinlessness prevalence across countries.
Finally, given the significant variability in the prevalence of lacking siblings, ranging from less than 10% to almost 50%, our most restrictive kinlessness measure, K4 (the absence of a partner, children, grandchildren, parents, and siblings), yielded lower values and exhibited significant cross-national heterogeneity. In some countries, only one out of 1,000 individuals aged 65 and over lacked all five types of kin considered, whereas in others, the prevalence of kinlessness rose to 41 per 1,000 individuals.
All in all, due to diverging sociodemographic dynamics, the relative positions of countries in terms of the absence of specific kin varied substantially, and this variation was reflected in changing rankings of countries depending on the definition of kinlessness.
The variability in lacking specific kin and in kinlessness reflects the intricate interplay of multifaceted cultural, historical, and demographic factors that influence kinship structures in diverse societal settings. Family and demographic studies have often clustered countries geographically or according to welfare regimes to capture contextual similarities and differences (Lesthaeghe, 2014; Sobotka & Toulemon, 2008). Although these geographical clusters capture important similarities in family support and demographic trends due to shared policies, norms, and socioeconomic conditions, our findings highlight that countries cannot be neatly categorized in terms of the prevalence of kinlessness. Except for the largest southern European countries, which consistently displayed relatively high values of kinlessness (according to all our definitions), considerable heterogeneity existed within all other geographically based clusters.
Within-Country Heterogeneity in the Prevalence of Kinlessness
The pattern of kinlessness becomes even more complex when considering within-country differences across sociodemographic groups defined by age, sex, education, and type of residential area. In most countries, we found small or otherwise statistically insignificant differences between the two age groups considered, which may be the result of compensation between age and cohort effects. However, in some countries, kinlessness—regardless of its definition—was significantly higher, and in some cases substantially so, among individuals aged 80 and over compared with those aged 65–79. The only two existing studies that examined age differences in kinlessness also found a higher prevalence of kinlessness among older individuals in the United States (Margolis & Verdery, 2017) and China (Zhou et al., 2019).
As for differences according to sex, the prevalence of K1 was significantly higher among women in seven countries, similar to what Margolis and Verdery (2017) observed for the United States. This may result from the longer life expectancy of women (Oksuzyan et al., 2008). In fact, in countries where the absence of both a partner and children (K1) was higher among women, we also observed higher shares of partnerless individuals because of widowhood (Supplementary Table 3). Nevertheless, the sex-based effect of widowhood on K1 can be counteracted by other forces, primarily those related to partnership formation and childlessness, giving rise to the insignificant sex gaps we found in the majority of countries or even in the higher K1 levels among men, as we found in four cases. For these latter countries, the higher proportion of men who never married compared with women (Supplementary Table 3), which may also contribute to their higher likelihood of being childless (Supplementary Table 10), may help explain this result. Zhou and colleagues also found higher K1 prevalence among men in China (2019). In our study, significant sex differences in K4 prevalence were detected only in four countries, and in three cases, women showed the highest levels.
We also investigated the prevalence of kinlessness separately for older individuals with different levels of education (i.e., those with or without at least a high school degree) and found significant differences in both directions in only a handful of countries. Only in the case of Malta and limited to our first definition of kinlessness (K1, lack of a partner and children), we found a higher prevalence of kinlessness among less-educated individuals. Conversely, in Latvia and France, the lack of all kin considered (K4, lack of partner, children, grandchildren, parents, and siblings) was higher among more-educated individuals (this was also the case for K1 in Latvia). Previous studies also found different educational gradients in kinlessness in different contexts. In China, for instance, kinlessness was found to be more prevalent among less-educated individuals (Zhou et al., 2019), whereas in the United States, the opposite was found, but only among women (Margolis & Verdery, 2017).
Finally, we investigated differences in kinlessness between urban and rural areas. The prevalence of K1 and K4 was significantly higher in urban areas in eight and four countries, respectively; the opposite was found only in one country for K1. This may be partially attributed to generally lower fertility rates among urban populations (Kulu, 2013) and is also likely influenced by internal migration from rural to urban areas coupled with the greater mobility of childless individuals (Thomas & Dommermuth, 2021). However, our results suggest that these dynamics can differ across countries and, in some cases, may result in a higher prevalence of kinlessness in rural areas, as we found in Switzerland (for our K1 definition) and as also found by Zhou et al. (2019) in China.
Implications
The variations we observed in kinlessness across countries are not merely a numerical curiosity; they suggest that, across Europe, there are substantial population subgroups lacking the customary close family ties typically responsible for supporting older people. This shift has significant ramifications, affecting the demand for institutionalized care (Wu et al., 2023), pension systems, and the overall welfare of older individuals. Although non-kin can have an essential role in supporting older kinless individuals (Huxhold et al., 2014; Seeman, 2000), kin play a pivotal role in the overall well-being of older individuals, serving as the primary providers of emotional and instrumental support, companionship, and social control over health behaviors. With the world’s population aging at an unprecedented rate, understanding and addressing kinlessness is paramount. The challenges implied by substantial and increasing kinlessness are exacerbated by the fact that not all individuals with kin can count on them for several reasons, including loss of contact, geographical distance, and the unwillingness or inability of kin to provide support (Fingerman et al., 2020).
Our study emphasizes that kinlessness is a multifaceted and multifactorial phenomenon. Variability in kinlessness prevalence cannot be attributed to a single factor but instead results from a complex array of cultural, historical, demographic, and policy-related factors. Policy-makers and researchers must acknowledge that a one-size-fits-all approach to understanding kinlessness is inadequate, as demonstrated by the cross-national differences in the level of kinlessness (even within clusters of countries routinely considered as similar), and by the existence of within-country heterogeneity for the specific subgroups that are at highest risk of lacking kin.
Future Directions and Conclusions
Although our research contributes to understanding variations in kinlessness, several avenues for future research remain. These include the exploration of the impact of kinlessness on older individuals’ mental and physical health and the extent to which this can be mitigated by non-kin networks (Mair, 2019). Investigating the underlying mechanisms behind disparities in kinlessness between and within countries is another area that warrants further examination. Additionally, kinship dynamics in non-European (and non-Western) contexts have not been studied, except for the study conducted by Zhou and colleagues (2019) on China.
In conclusion, our research demonstrates the complex and varied nature of kinlessness across countries and population subgroups. It underscores the importance of recognizing the diverse conditions of older individuals, particularly those without close kin, and calls for tailored policies and support systems to ensure their well-being. As the global demographic landscape continues to evolve, understanding and addressing kinlessness will remain a vital area of study, with implications for older individuals’ well-being and quality of life.
Funding
This work was supported by the co-funding of the European Union—Next Generation EU, in the context of The National Recovery and Resilience Plan, Investment Partenariato Esteso PE8 “Conseguenze e sfide dell’invecchiamento,” Project Age-IT, CUP: B83C22004800006.
Conflict of Interest
None.
Data Availability
This paper uses data from SHARE Wave 8 (DOIs: 10.6103/SHARE.w8.900) see Börsch-Supan et al. (2013) for methodological details.
Acknowledgments
The SHARE data collection has been funded by the European Commission, DG RTD through FP5 (QLK6-CT-2001-00360), FP6 (SHARE-I3: RII-CT-2006-062193, COMPARE: CIT5-CT-2005-028857, SHARELIFE: CIT4-CT-2006-028812), FP7 (SHARE-PREP: GA N.211909, SHARE-LEAP: GA N.227822, SHARE M4: GA N.261982, DASISH: GA N.283646) and Horizon 2020 (SHARE-DEV3: GA N.676536, SHARE-COHESION: GA N.870628, SERISS: GA N.654221, SSHOC: GA N.823782, SHARE-COVID19: GA N.101015924) and by DG Employment, Social Affairs & Inclusion through VS 2015/0195, VS 2016/0135, VS 2018/0285, VS 2019/0332, and VS 2020/0313. Additional funding from the German Ministry of Education and Research, the Max Planck Society for the Advancement of Science, the U.S. National Institute on Aging (U01 AG09740-13S2, P01 AG005842, P01 AG08291, P30 AG12815, R21 AG025169, Y1-AG-4553-01, IAG BSR06-11, OGHA 04-064, HHSN271201300071C, RAG052527A) and from various national funding sources is gratefully acknowledged (see www.share-project.org).
Preregistration
The study was not preregistered.
Author Contributions
B. Arpino and E. Pirani conceived the research and the data preparation; M. Pittavino managed the data, conducted the analyses, and handled the results’ preparation. All authors interpreted the results and wrote and reviewed the manuscript.

