


Abstract
This study examines how older adults’ (65 years old plus) daily activities shifted in the years around the coronavirus disease (COVID) pandemic.
Using data from American Time Use Survey, this study compares activities across the pre-pandemic (2019 to March 2020), early-pandemic (May to December 2020), and pandemic-normal (2021) periods.
In the first year of the pandemic, there was less time spent on average on leisure outside the home, traveling, and with nonhousehold members, and more time alone and at home, compared with before the pandemic. Moving beyond averages, sequence and cluster analyses find 5 similar typologies of days across the three periods, characterized by days predominated by (a) housework, (b) leisure at home, (c) TV, (d) a combination of leisure at home and outside with TV, and (e) paid work. Duration of time across various daily activities differed, however, even for the same clusters. For example, in days predominated by indoor leisure, adults spent 405 min in this activity before the pandemic, 432 min during the early-pandemic period, and 549 min during the pandemic-normal period. We also observed changes in the proportion of older adults in each cluster. Across the pre-pandemic and early-pandemic periods, the proportion of days predominated by leisure at home increased (9.9%–17.9%) whereas the proportion belonging to days predominated by housework decreased (45.7%–17.6%).
COVID-19 shifted the daily life of older adults, and our findings are consistent with selection, optimization, and compensation theory, documenting that older adult adapted across the first 2 years of the pandemic.
The coronavirus disease 2019 (COVID-19) pandemic is an unprecedented event that changed the way we live in many ways. Previous studies found that the pandemic induced negative outcomes, including worry, stress, and anxiety (McKinlay et al., 2021; Rodrigues et al., 2021). Poorer mental health and loneliness also increased over the pandemic period (Caruso Soares et al., 2021; Choi et al., 2021). Through social distancing and mandatory lockdowns, COVID-19 undoubtedly altered the ways we interact with one another and engage in our day-to-day activities.
Research is beginning to emerge describing the extent to which COVID-19 affected the social lives of older adults and their implications. For example, the COVID-19 pandemic and corresponding lockdowns in various parts of the world presented many changes to health-related behaviors, including physical activity, diet, sleep, and the attendance of health appointments (Bhutani et al., 2021; Eastman et al., 2021; Heid et al., 2021; Joseph et al., 2021; Khan & Moverley Smith, 2020; Robbins et al., 2022). Studies have reported that during the pandemic rates of physical activity declined, diets became less healthy, and alcohol consumption increased (Khan & Moverley Smith, 2020; Nordeck et al., 2022). Furthermore, many older adults had less access to receiving their usual healthcare during the pandemic, and findings from a study of 1,272 older adults indicated that most reported canceling medical appointments (68.8%) and surgeries or treatments (46.6%; Heid et al., 2021). It should be noted, however, that many of these changes were in compliance with distancing measures, with at least one study finding that most older adults reported adhering to the guidelines on physical distancing in the early days of the pandemic (Heid et al., 2021).
Although it may be important to consider how COVID-19 affected the health and activities of older adults, equally important is to examine how COVID may have reshaped daily life. Although research on the context of daily routine and activity engagement has explicated the influence of factors across multiple levels (Boulton et al., 2018; Tang et al., 2023), a global historical event such as COVID-19 also changed the macro-level context. Emerging literature has considered the effect COVID-19 has had on formal institutions such as workplaces (Sangster Jokić & Jokić-Begić, 2022) and schools and universities (Segre et al., 2021). These studies explicated how routines were altered given disruptions due to COVID-19. Equally important to note is that whereas younger and working-age adults have access to additional spheres such as workplaces or educational institutions, older adults’ routines primarily revolve around their neighborhoods and COVID-19 may have shut down access to most of these places in the early stages of the pandemic. Furthermore, although formal institutions adopted online platforms to facilitate daily operations during COVID, informal spaces that older adults primarily frequent may not have had the same structure in place to necessitate this shift. Consequently, it is less clear how older adults have adapted.
Previous research also theorized a social rhythm to our schedules and calendars, shaping the tempos of our days, weeks, months, and years (Zerubavel, 1981). Such rhythms are particularly important, as they reflect the social organization of time, and the implementation of social systems, policies, and practices that dictate the engagement of daily activities, such as the opening and closing hours of stores, schools, and workplaces, across different times of the day, different days of the week, and different weeks of the year.
Acknowledging that such rhythm exists underscores the value of investigating different types of days, as only considering averages may mask COVID’s impact on daily life. Given COVID as a historically unprecedented event, there are three key research questions and aims of the current paper: (a) to investigate whether and how various aspects of daily life changed across the early years of COVID, in terms of average duration of time in each type of activities, the presence of activity partners, and the location of activities; (b) to compare and contrast across the typologies of days across the three periods, to see if they are similar or different, and to report on whether we might observe a new typology of days that were not observed before COVID, given that policies and social practices changed dramatically in the early days of COVID; (c) to consider how even if we were to observe similar types of days across the three periods, whether what constitutes those typologies may have changed. As a case in point, there may have been secular changes in leisure time across the years. Therefore, one might observe average changes over the past decades in the duration of leisure time, as well as the presence of other people during leisure activities. However, we might also wish to study whether and how changes in leisure time may have varied across weekdays versus weekends, as those are arguably different types of days. Secular changes in leisure during the week as compared to the weekend might indeed denote different changes in daily life. The only difference in the present study is that we take an inductive data-driven approach through the creation of the typologies of days, because we do not have sufficient knowledge to confidently report on the “types of days” older adults might have, whereas an examination of changes in leisure time across weekdays versus weekends would be deductive because most people would accept that weekends and weekdays are different types of days.
We draw on two different theories to hypothesize how daily life might have been affected during the early years of COVID. The social–ecological model (Boulton et al., 2018; Bronfenbrenner, 1986; Tang et al., 2023) allows us to consider how the ecological context shapes older adults’ daily activities, acknowledging that the societal context has shifted across the three periods under investigation. It provides a framework for understanding the relationship between an older person and the environment in which they are embedded, such that with mandatory COVID lockdowns and restrictions in the first years of the pandemic, as well as with individuals’ desire to self-isolate to avoid contracting COVID, their daily activities may have shifted. In accordance with this theory, we might expect to find that there are different typologies of days across the three periods, given the drastic differences in restrictions and individuals’ daily lives.
The selection, optimization, and compensation theory (Carpentieri et al., 2017) allows us to consider that older adults are agentic. For instance, to optimize well-being and to compensate for any COVID restrictions, individuals might replace outdoor leisure with indoor leisure activities, or be strategic with regard to activity partners, prioritizing household versus nonhousehold members. In addition, there are various social forces that may influence older adults’ daily lives, above and beyond restrictions that may have been imposed during the early stages of the COVID pandemic. First, older adults may face external pressure and feedback from others such that although the macro-level context may have changed, social roles and relationships remain intact. Therefore, the engagement of activities may be in response to the performance of particular social roles and relationships. Second, daily activities may not all be solitary, such that activities co-engaged with others may still be well structured, and thus it may be more difficult to make changes to the daily routine. Lastly, activities are often linked with an identity (such as that of a worker). Thus, there are also intrinsic motivations to perform certain activities. Rather than daily life being drastically restructured, we might, therefore, see some adjustments instead in line with selection, optimization, and compensation theory.
Drawing on three waves of repeated cross-sectional data from a national survey, the American Time Use Survey (ATUS), with information on activities over a 24-hr period, this paper aims to describe how daily activity types, activity duration, activity patterns, activity partners, and activity locations of older adults shifted over the years 2019–2021. Doing so covers the year before the pandemic, the first year of the pandemic, and a year where the pandemic is beginning to become the “new norm.” It builds on existing studies on the impact of COVID on daily lives (Fuller & Huseth-Zosel, 2021; Stockwell et al., 2021) to begin to describe whether the rhythm of daily life has continued to diverge from before the pandemic, or whether in 2021, a year when the pandemic has become normalized that the daily life of older adults may start to resemble that in 2019, before the pandemic started.
Understanding the daily life of older adults and how it has been affected by COVID can help work toward building an evidence base to inform how the daily life of older people may change over time, as well as demonstrating how a worldwide event such as COVID, may have affected this.
Method
We draw on data from the ATUS. The ATUS is a nationally representative time-use survey conducted by the US Census Bureau and the Bureau of Labor Statistics (BLS). The ATUS sample is comprised of individuals who previously participated in the Current Population Survey (CPS). The CPS is a U.S. household survey whose main purpose is to collect information on labor force participation. The main goal of the ATUS is to collect information and measure how people divide their time across daily activities (Bureau of Labor Statistics, 2023). One member of the selected households aged 15 and older is selected to participate in the survey, in which they fill out a 24-hr diary with all the activities that they participated in the day before. Apart from the main activity, respondents also provide details on the location of the activity, and with whom they were with during each activity episode.
The data set used in this study was obtained from the American Time Use Survey Data Extract Builder (ATUS-X), available through the IPUMS-Time Use project (Flood et al., 2022). The extract builder provides harmonized data for the ATUS samples in a friendly format, enabling analysis of the raw files across common statistical packages.
We select the samples for the years 2019, 2020, and 2021, to compare different aspects of daily activities, and the activity profiles of older adults before, and during the early years of the pandemic. As the target of the study is the older adult population, we also select respondents aged 65 years and older. Our final sample is comprised of 7,757 respondents.
Though the data are extracted based on the calendar year, we separate our sample into three periods to distinguish responses in accordance with different periods in relation to the pandemic: (1) a pre-pandemic period covering data collection in 2019 and from January to March 2020 (3,178 respondents), (2) an early-pandemic period covering responses from May 2020 to December 2020 (1,908 respondents), and (3) a pandemic-normal period covering 2021 (2,671 respondents). We note that data collection was interrupted between March 18 and May 9, 2020. Table 1 shows the characteristics of the respondents across each of the periods. Overall, respondents across the three periods are quite similar in terms of their sociodemographic characteristics (see Supplementary Table 1), with the exceptions of educational attainment and living arrangements. As compared to the other periods, those who are in the pre-pandemic wave are over-represented in terms of belonging to the “Less than High School” category, and to “Living alone,” while those who are in the pandemic-normal wave are under-represented in the “Less than High School” category.
Average Time by Activity (Minutes Per Day)
| Activity | Pre-pandemic (n = 3,178) | Early-pandemic (n = 1,908) | Pandemic-normal (n = 2,671) | Sig |
|---|---|---|---|---|
| Sleep | 534 (130) | 536 (131) | 541 (127) | |
| Personal care | 48 (69) | 41 (63) | 44 (60) | a** |
| Eat | 71 (52) | 74 (51) | 75 (51) | c* |
| Childcare | 10 (55) | 9 (52) | 7 (45) | |
| Care for adults | 9 (39) | 7 (39) | 9 (42) | |
| Leisure at home | 122 (106) | 151 (81) | 133 (99) | a***b**c* |
| Leisure outside the home | 59 (223) | 35 (222) | 46 (210) | ac***b** |
| TV | 273 (80) | 283 (55) | 269 (73) | |
| Travel | 56 (144) | 34 (151) | 47 (150) | abc*** |
| Work | 48 (160) | 50 (165) | 50 (166) | |
| Housework | 183 (55) | 193 (51) | 194 (52) | c* |
| Other | 26 (301) | 27 (299) | 25 (299) | |
| Total | 1,439 | 1,440 | 1,440 |
Source: Own calculations from Flood et al. (2022).
Notes: Standard deviation in parentheses. Letters in column Sig denote significant differences between periods: a = pre-pandemic and early-pandemic; b = early-pandemic and pandemic-normal; c = pre-pandemic and pandemic-normal.
*p < .05.
**p < .01.
***p < .001.
From the time diaries, we aggregate the activities and compute the duration of time each respondent reports spending in the following activities: sleeping, personal care, eating, childcare, caring for adults, leisure at home, leisure outside the home, TV watching, travel, work, housework, and others. Activities are mainly based on the primary activity reported, but in the case of leisure, we also used the additional information on the location of the activity, especially given COVID restrictions during the early days of the pandemic. We explain later in greater detail the collection of the location’s information.
In addition to the activity carried out, we draw on information provided in response to a question that asked “with whom” activities were engaged, which identifies if the activity was done (a) alone, (b) with the spouse or partner, (c) with other household members, or (d) with nonhousehold members. There are a few activities in which the “with whom” question was not asked, including personal care activities (sleeping, grooming, etc.) and these may also be missing in cases in which respondents did not answer, or reported that they did not remember the activity partners.
The diary also recorded information on the location of the activity. In this instance, we categorize the location as either at home or not at home. At home refers to respondents’ residences, whereas not at home agglomerates a number of locations including the workplace, another person’s home, a restaurant, grocery store, or outdoors away from home. Location was not recorded when the respondent was sleeping, grooming, or doing personal activities as well as for the episodes in which the respondent refused to answer or did not remember. Finally, ChatGPT was utilized in the editing of the paper, for correcting grammatical and typographical errors.
Analytical Strategy
To address our first research question, we investigate variation in daily activities across the three time periods and report on the average duration of time (in minutes) across each (1) activity type, (2) presence or absence of other people during activities, and (3) activity location. We first run a one-way analysis of variance (ANOVA) test of differences for each measure to examine if the differences in the estimates across the three time periods are statistically significant. If they are different, we then run an additional test to determine which pairs are significantly different from the other (Montgomery, 2017).
To answer our second research question, we analyze daily patterns of activities and consider similarities and differences in the clusters across the three time periods. We draw on sequence analysis to establish clusters of individuals with similarly reported sequence of daily activities. Sequence analysis is a tool that has traditionally been used to analyze life events in the social sciences and has become a popular tool for analyzing time-use data (Freedman et al., 2019; Glorieaux et al., 2010; Kolpashnikova & Kan, 2021; Lam & Garcia- Roman, 2020). To carry out sequence analysis, we use TraMineR, which is an R package for mining and visualizing sequences of categorical data (Gabadinho et al., 2011). We input information from the diaries for the activity at minutes 0, 10, 20, 30, 40, and 50 of the hour. Over a 24-hr period, the sequence of events for each respondent corresponds to 144 activities. Sequence analysis techniques compare each observed sequence of events (i.e., primary activity) to all other sequences and calculate the shortest distance between sequences (Brzinsky-Fay et al., 2006; Freedman et al., 2019). This allows us to measure the similarities of the sequences of activities of individuals with one another (Abbott, 1984; Glorieaux et al., 2010). The statistical package then computes optimal matching distances and generates a distance matrix between the sequences. This information is then used to classify individuals into different clusters. The clusters are created using the Cluster package in R (Murtagh & Legendre, 2014). We determine the optimal number of clusters by drawing on a number of quality indicators obtained in the process, which informs the optimal number of clusters (Han et al., 2017). The quality indicators are shown in Supplementary Table 2 and the dendrograms are available upon request.
To address our third research question, we examine the information produced on the duration of time across different activities within the clusters. Thus, although our first research question examines average differences in the duration of time in activities across the three periods without consideration of the clusters, after consideration of various clusters, we also compare and contrast whether duration of time in activities varied across similar types of days across the three time periods. This allows us to move beyond mean differences across the periods to consider heterogeneity in any observed differences, with the typologies of days being the focal point of interest. This acknowledges the fact that it may be difficult to speak of a “typical day” in the daily life of older adults, but that changes brought about during the early years of COVID may be more drastic in a day devoted to specific activities, which we are only able to examine here after the construction of the clusters.
Results
Differences in Duration Across Activity Types Before and During the COVID Pandemic
Table 1 presents the average duration of time in each activity across the three time periods. As expected, estimates reveal several significant differences in the daily life of older adults across the three years. The most dramatic difference relates to the location of leisure activities. Leisure at home increased by almost half an hour during the early-pandemic period, as compared with the pre-pandemic period. This is replaced by a reduction in time on leisure activities outside the home by 24 min. We observe, however, a slight reversal during the pandemic-normal period, such that the duration of time in leisure activities was more similar to the pre-pandemic period.
Another significant difference was the amount of time older adults were traveling during the first year of the pandemic, on average 22 min less when compared to the pre-pandemic period (P value < .001). We observe a slight reversal during the pandemic-normal period, with 47 min a day spent traveling, though it is still significantly lower as compared to the duration of time traveling before the pandemic (9 min less, P value < .001). We also find that older adults reported slightly more time eating during the pandemic-normal period, as compared with the pre-pandemic period (3 min, P value < .05).
Comparisons of differences across other activity types were not significantly different, but the estimates do show older adults spending more time watching TV and doing housework (10 min each) during the early-pandemic period, as compared with the pre-pandemic period. As shown later, these averages may, however, be masking important changes in the proportions of older adults who are engaging in different types of primary activity of the day.
Differences in Duration in the Absence or Presence of Activity Partners Before and During the COVID Pandemic
Table 2 presents information on activity partners throughout the day. Note that the “with whom” question was not asked for certain activities including sleeping, grooming, and personal or private activities (such as using the bathroom). The most important difference is the higher duration of time spent alone during the pandemic, along with a lower duration of time with nonhousehold members in the early years of pandemic, as compared with the pre-pandemic period. During the pre-pandemic period, respondents reported engaging in activities alone on average 7 hr and 48 min over the course of the day, and this increased by a further 43 min during the early-pandemic period. In the year that followed, time alone decreased by 27 min, but was still significantly higher when compared to the pre-pandemic period.
Average Time by Co-presence (Minutes Per Day)
| With whom | Pre-pandemic (n = 3,178) | Early-pandemic (n = 1,908) | Pandemic-normal (n = 2,671) | Sig |
|---|---|---|---|---|
| Alone | 468 (301) | 511 (299) | 484 (299) | a***b** |
| With spouse | 243 (292) | 246 (287) | 252 (291) | |
| Other household members | 34 (123) | 36 (121) | 34 (123) | |
| Non household members | 153 (205) | 98 (178) | 124 (198) | abc*** |
| No information | 582 (134) | 578 (134) | 584 (131) |
Source: Own calculations from Flood et al. (2022).
Notes: Standard deviation in parentheses. Letters in column sig denote significant differences between periods: a = pre-pandemic and early-pandemic; b = early-pandemic and pandemic-normal; c = pre-pandemic and pandemic-normal.
*p < .05.
**p < .01.
***p < .001.
Another notable difference was the amount of time engaged in activities with nonhousehold members. Before the pandemic, older adults on average reported engaging in activities with nonhousehold members for 2 hr and 33 min; however, this decreased by 55 min during the first year of the pandemic, reversing somewhat during the second year of the pandemic. During the second year of the pandemic, time alone in activities also reversed somewhat back to pre-pandemic levels; although still higher by 16 min, the differences were no longer statistically significant. On the contrary, time with nonhousehold members during the second year of the pandemic was still significantly lower as compared to the pre-pandemic period (29 min, P value < .001), though has increased as compared with the first year of the pandemic (P value < .001).
Differences in the Duration of Time Spent Across Activity Locations Before and During the COVID Pandemic
The location of activity is of relevance during the COVID pandemic period, as movements were restricted given recommendations from authorities to stay at home to prevent the spread of the coronavirus. Such restrictions are reflected in Table 3 which shows that time at home increased by 82 min during the early-pandemic period as compared with the pre-pandemic period. During the second year of the pandemic, time at home is lower as compared with the first year of the pandemic but the difference with the pre-pandemic period is still statistically significant.
Average Time by Location (Minutes Per Day)
| With whom | Pre-pandemic (n = 3,178) | Early-pandemic (n = 1,908) | Pandemic-normal (n = 2,671) | Sig |
|---|---|---|---|---|
| At home | 626 (247) | 708 (224) | 662 (241) | abc*** |
| Not at home | 231 (235) | 154 (202) | 194 (225) | abc*** |
| Not reported | 582 (134) | 578 (134) | 584 (131) |
| With whom | Pre-pandemic (n = 3,178) | Early-pandemic (n = 1,908) | Pandemic-normal (n = 2,671) | Sig |
|---|---|---|---|---|
| At home | 626 (247) | 708 (224) | 662 (241) | abc*** |
| Not at home | 231 (235) | 154 (202) | 194 (225) | abc*** |
| Not reported | 582 (134) | 578 (134) | 584 (131) |
Source: Own calculations from Flood et al. (2022).
Notes: Standard deviation in parentheses. Letters in column sig denote significant differences between periods: a = pre-pandemic and early-pandemic; b = early-pandemic and pandemic-normal; c = pre-pandemic and pandemic-normal.
*p < .05.
**p < .01.
***p < .001.
Sequence Analysis
Our next research question surrounds whether the types of days had shifted during the COVID pandemic. As shown in Table 4, five clusters were most representative of respondents’ days across the three time periods. The decision to classify individuals into five clusters was based on the assessment of quality statistics (refer to Supplementary Table 2 and Han et al., 2017) and the analysis of dendrograms (available upon request). Thus, in contrast to expectations that we might observe a new typology of days, we find that these were relatively constant over time. Overall, our analysis revealed five distinct clusters characterized by a particular activity that day, which remained relatively consistent across the three periods. Across each period, there comprised a cluster that is distinguished by (a) housework, (b) leisure at home, (c) TV, (d) a combination of leisure activity at home, outside the home, and TV, and (e) paid work. At the descriptive level, this suggests a certain consistency in the “types of days” reported by older adults, despite the impact of COVID-19 leading to mandatory lockdowns and disruptions in daily life.
Distribution of Individuals in Each Cluster by Period
| Variable | Pre-pandemic (n = 3,178) | Early-pandemic (n = 1,908) | Pandemic-normal (n = 2,671) | ||||||||||||
|---|---|---|---|---|---|---|---|---|---|---|---|---|---|---|---|
| Housework | Leisure indoor | TV | Leisure mix | Work | Housework | Leisure indoor | TV | Leisure mix | Work | Housework | Leisure indoor | TV | Leisure mix | Work | |
| n | 1451 | 316 | 673 | 482 | 256 | 335 | 341 | 275 | 822 | 135 | 349 | 174 | 925 | 1026 | 197 |
| % | 45.7 | 9.9 | 21.2 | 15.2 | 8.1 | 17.6 | 17.9 | 14.4 | 43.1 | 7.1 | 13.1 | 6.5 | 34.6 | 38.4 | 7.4 |
| Average time by activity (minutes per day) | |||||||||||||||
| Sleep | 552 | 540 | 523 | 525 | 479 | 517 | 523 | 506 | 572 | 474 | 516 | 513 | 543 | 568 | 478 |
| Personal care | 55 | 41 | 30 | 56 | 47 | 41 | 38 | 26 | 47 | 43 | 37 | 36 | 32 | 56 | 50 |
| Eating | 76 | 75 | 56 | 77 | 69 | 80 | 73 | 51 | 79 | 72 | 80 | 66 | 66 | 83 | 69 |
| Childcare | 15 | 4 | 7 | 5 | 4 | 5 | 2 | 1 | 17 | 2 | 8 | 2 | 2 | 13 | 1 |
| Care for adults | 11 | 6 | 6 | 10 | 5 | 5 | 2 | 3 | 13 | 1 | 10 | 4 | 4 | 16 | 2 |
| Leisure at home | 110 | 405 | 53 | 100 | 59 | 83 | 432 | 50 | 118 | 61 | 66 | 549 | 97 | 140 | 62 |
| Leisure outside the home | 34 | 37 | 29 | 242 | 32 | 14 | 21 | 7 | 63 | 12 | 15 | 16 | 24 | 88 | 14 |
| TV | 219 | 159 | 592 | 169 | 132 | 164 | 182 | 691 | 264 | 152 | 181 | 120 | 489 | 173 | 145 |
| Travel | 49 | 34 | 32 | 131 | 70 | 38 | 20 | 15 | 44 | 40 | 35 | 17 | 30 | 69 | 51 |
| Work | 4 | 4 | 3 | 3 | 447 | 12 | 2 | 1 | 4 | 487 | 6 | 3 | 2 | 7 | 483 |
| Housework | 284 | 109 | 88 | 93 | 82 | 455 | 123 | 79 | 178 | 79 | 469 | 92 | 126 | 194 | 78 |
| Other | 31 | 26 | 20 | 28 | 14 | 26 | 21 | 9 | 39 | 17 | 18 | 21 | 24 | 33 | 8 |
Source: Own calculations from Flood et al., 2022.
To depict the daily activity patterns, tempographs were also generated for each period and cluster (see Figure 1). These figures illustrate the daily rhythms of activities by representing the proportion of respondents engaging in specific activities throughout the day. The tempographs provide a visual representation of the most prevalent activities, the duration of time spent on each activity by individuals in each cluster, and the sequential arrangement of activities throughout the day.
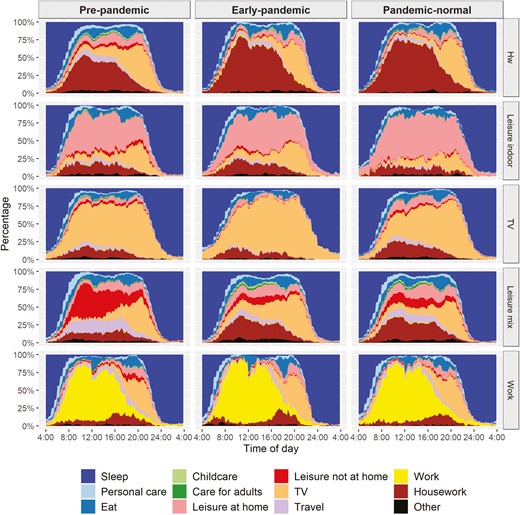
Tempograph showing the proportion of members in each cluster performing certain activities at each time point throughout the day (from 4 a.m. to 4 p.m.).
Changes Within and Across Clusters
Though we find a similar number of “types of days” across the three periods, notable differences were observed in the proportions of older adults belonging to each cluster, as well as differences in the duration of time spent across the same activities in each cluster. For instance, during the pre-pandemic period, the largest “typical day” was that of older adults primarily engaged in housework, comprising 45.7% of the sample. During the early-pandemic and pandemic-normal periods, the proportions of the sample reporting this “type of day” were dramatically lower, down to 17.6% and 13.1%, respectively. Conversely, a day that involved a mixture of leisure activities at home and outside, alongside housework were dramatically higher at 15.2% in the pre-pandemic period, but up to 43.1% and 38.4% in the early-pandemic and pandemic-normal periods, respectively. Similarly, a day that centered primarily on watching TV went from 21.2% during the pre-pandemic period, to 14.4% during the early-pandemic period, and rebounded to 34.6% of the sample during the pandemic-normal period. Conversely, a day focused on indoor leisure initially comprised 9.9% of the sample but increased to 17.9% during the early-pandemic period before decreasing to 6.5% in the pandemic-normal period. Remarkably, the proportion of older adults in the paid work cluster remained relatively stable, hovering between 7% and 8% across the three periods. It’s important to note that these findings are based on repeated cross-sectional data, thus not capturing within-individual changes. However, they suggest a significant shift in activity patterns among older adults during the initial years of the COVID-19 pandemic, consistent with expectations from selection, optimization, and compensation theory. For instance, the percentage of older adults dedicating an entire day to housework reduced as older adults integrated it with other activities such as leisure.
Furthermore, alongside the shifting proportions of individuals across clusters during the COVID periods, there were notable changes in the duration of time allocated to specific activities. For instance, although the proportion of individuals primarily involved in housework declined, the average time spent on housework by an individual whose day was mostly devoted to housework increased from 4 hr and 44 min (284 min) to 7 hr and 35 min (455 min) between the pre-pandemic and pandemic periods. Similarly, individuals in the paid work cluster reported an increased duration in work time, rising from around 7.5 hr (447 min) before the pandemic to around 8 hr (487 min) during the initial pandemic years. Notably, we observed a corresponding decrease in the travel time for individuals in this cluster. In other words, older adults whose day was primarily devoted to paid work likely swapped travel time for more work time during the early years of the pandemic. This pattern was also evident in the indoor leisure cluster, where the reported duration of time in leisure increased from 405 min pre-pandemic to 549 min in the pandemic-normal period.
Discussion
The COVID pandemic altered our lives in many ways. Building on existing knowledge and evidence regarding the daily activities of older adults, this paper begins to document how patterns of daily life shifted across the early years of the COVID pandemic. Drawing on a long-running annual survey that samples a large number of U.S. households inclusive of older adults, this paper describes meaningful shifts in activity types, activity partners, activity patterns, and activity locations across the year before and the first 2 years of the pandemic.
Our study has made several contributions. First, although prior research on the impact of COVID on daily activities may have been limited due to their selective samples, such as drawing on data from a particular region of a country, our study, based on a long-running national survey, is able to describe the activities of older adults from a large national sample.
Second, we are able to draw on the historical context, particularly surrounding a societal event such as COVID, to consider how this may shape the daily lives of older adults. Consistent with the selection, optimization, and compensation theory, we found secular changes in the activities of older adults across the early-pandemic period, likely due to imposed COVID lockdowns and restrictions, as well as self-imposed behavioral changes to avoid contracting COVID. This was reflected in the increase in the duration of time spent in leisure activities at home and less time spent traveling, along with reports of more time on average spent in activities alone and less time with nonhousehold members. As we extended our analysis into the second year of the pandemic, we also observed some reversal in these trends. This may reflect the fact that although cases were high, vaccines were becoming more readily available, and the lifting of restrictions in some parts of the United States had led to a less restricted lifestyle.
Finally, this study contributes by moving beyond the description of secular changes in terms of the average duration of time across activity types, activity partners, and activity locations. This is relevant as existing literature has alerted us to the fact that daily activities are diverse, and that there may not be a “typical day,” but that our schedules consist of typical days where we focus and prioritize different activities. Therefore, this paper also analyzes and develops typologies of days, examining how these may have shifted across the years surrounding the COVID pandemic. This provides a detailed portrait of the daily life of older adults, in terms of the proportion of older adults reporting different types of days, as well as changes in the makeup of each profile.
Overall, our findings suggest a change in the daily activities of older adults, from more active to more passive leisure, from activities with nonhousehold members to more time alone, and from time in public places to more time at home. These changes are in line with expectations regarding changes in activities due to physical distancing measures at the early stages of COVID. Understanding patterns of change and how older adults are adjusting to the ongoing pandemic is of interest to scholars and service providers. The move from active to passive leisure is of potential interest, as prior research finds that active, but not passive, leisure correlates with positive health outcomes (Yamashita et al., 2019). Time spent with various activity members also has implications for well-being, as prior research finds that a more diverse social network is associated with better well-being (Litwin & Shiovitz-Ezra, 2011). Declines in time spent with nonhousehold members and time outside one’s home may potentially have an impact on older adults’ networks, rendering them more homogenous. At the same time, older adults may nevertheless continue to maintain ties virtually. Future research that investigates whether COVID has, in fact, affected older adults’ social networks would be valuable.
Despite the contributions of this study, it is not without limitations. For example, we did not explore whether the activities we examined vary across different sociodemographic groups. Future research that investigates this would be helpful, as it may shed light on whether and how the daily lives of older adults varied across different groups of older adults during the pandemic. Future research considering regional differences would also be valuable. This is particularly important because different areas of the United States have had different mandates surrounding COVID restrictions, leading to variations in how daily activities may have changed. Cross-national descriptions of the daily lives of older adults would be equally valuable. As our paper describes marked shifts in the daily activities of older adults in the early years of the pandemic, future research that continues to describe the daily lives of older adults over the course of the pandemic would be helpful, as new variants, mitigation strategies, and technologies continue to evolve.
Supplementary Material
Supplementary data are available at The Journals of Gerontology, Series B: Psychological Sciences and Social Sciences online.
Source: Own calculations from Flood et al. (2022). A tempograph shows the proportion of respondents doing each activity for every moment of the day from 4 a.m. to 4 a.m. the next day.
Funding
This research was partially supported by an Australian Research Council Discovery Early Career Researcher Award (project number DE210100582) and by the Australian Research Council Centre of Excellence for Children and Families over the Life Course (project number CE200100025).
Conflict of Interest
None.

