


Abstract
Decades of research indicate that volunteering is associated with better health for the volunteer beyond the selection effects based on health. However, little is known about potential heterogeneity in health outcomes associated with volunteering in the context of good or poor health. This study addresses this gap by focusing on the frailty index (FI) to investigate the volunteering–health nexus across the population frailty distribution ranging from fit to frail.
Using nationally representative data from the Health and Retirement Study (person N = 34,986; 198,218 person-wave observations), we estimated unconditional quantile regression models with panel fixed effects to estimate changes in FI associated with changes in the share of volunteers in the population across the frailty distribution observed across the study period (1998–2020).
Our findings demonstrated that the volunteering–FI association was heterogeneous across the frailty distribution. The association was the most potent at the higher end of the frailty distribution, suggesting that efforts to promote volunteering may yield greater benefits for older adults experiencing high levels of frailty.
The current study findings provide unique and compelling evidence in support of earlier calls for considering volunteering as a public health intervention. The study findings are discussed in the context of population health outcomes and health disparities.
Formal volunteering, referring to prosocial activities directed toward addressing a community concern and assisting others in need through formal organizations, offers tremendous value to the recipients of these services and their communities (Carr et al., 2015). In addition to the benefits accrued at the level of the service recipients and the society, decades of research indicate that volunteering is also beneficial for the persons who volunteer across the life course and that the benefits for the volunteer often become more pronounced with age (Van Willigen, 2000). The benefits documented in the literature extend beyond an immediate sense of gratification and purpose to include an extensive set of mental and physical health outcomes. For instance, volunteering has been linked to reduced symptoms of depression and better cardiovascular and cognitive health, leading to longer and healthier life expectancy (Burr et al., 2021). In this regard, researchers argue that volunteering should not be viewed merely as a means of providing services to communities but also as a public health strategy promoting healthy aging (Carr et al., 2015).
The robust empirical evidence in support of this line of argument is continuing to grow (Burr et al., 2021). Importantly, while findings from earlier studies were often criticized for methodological shortcomings associated with selection bias, a growing body of longitudinal studies based on large, representative data attempt to overcome these shortcomings using quasi-experimental techniques that help to statistically adjust for the key differences observed between volunteers and their nonvolunteer in terms of their socioeconomic resources, as well as health characteristics (Kail & Carr, 2016, 2020; Kim et al., 2020; Kim & Halvorsen, 2021). Accordingly, these studies lend credence to the view that volunteering is causally linked to better health above and beyond the health advantage favoring individuals who select into volunteering compared to those who do not, thereby complementing findings from a small number of randomized control trials designed around volunteering among older adults (Fried et al., 2013).
It is worth mentioning that the robust evidence based on observational studies represents an average effect over the population that describes changes in health ascribed to volunteering for a group of volunteers whose characteristics, on average, are not different from nonvolunteers. These average effects present an important and useful estimand in informing policy and practice. However, it is important to note that the average effects often mask the heterogeneous effects of volunteering experienced across different subgroups. Indeed, earlier research indicates that the health benefits of volunteering vary across demographic characteristics and socioeconomic resources (Kim & Halvorsen, 2021; Morrow-Howell et al., 2009). Yet, we know little about whether and how much the health benefits may be different for groups who are in better or worse health. This is in large part because differences in underlying health across populations are treated as a statistical nuisance to be controlled for, rather than an important context for understanding the potential heterogeneous effects of volunteering.
This is a crucial gap, as the degree of heterogeneous health effects could bear significant implications for policy and practice. For example, if the average effects of volunteering are predominantly driven by those who are in good health to begin with, instituting public health interventions based on volunteering may inadvertently exacerbate health inequality within the population. Conversely, if health benefits are greater at the lower end of the health distribution, volunteering interventions would not only help to mitigate health disparities but also result in substantial savings in healthcare expenditures, which are known to be highly concentrated within a relatively small subgroup of individuals in poor health within the population (Shi et al., 2023).
The primary objective of this study is to bridge this gap by exploring the heterogeneous health benefits associated with volunteering across the population health distribution. To this end, we use longitudinal data from the Health and Retirement Study (HRS) to focus on the frailty index (FI), which is one of the two dominant conceptualizations of frailty capturing the accumulation of deficits across multiple physiological systems accompanied by increased vulnerability to stress (Hoogendijk et al., 2019). Importantly, we build on earlier HRS-based studies that have employed FI to investigate the dynamics and heterogeneity in the aging process (Dassel & Carr, 2014; Yang & Lee, 2009). This approach leverages the growing recognition in the literature that underscores FI’s utility in capturing population health distributions (Dent et al., 2019) and its capacity for tracking dynamic changes in health in both directions, with the most significant improvements often observed at the worse end of the FI distribution (Shi et al., 2023). Of particular interest in this study is the volunteering–FI association observed at the worse end of the FI distribution, given the immense burden and suffering experienced by affected individuals and families, along with the clear pattern of increased healthcare expenditures associated with frailty (Shi et al., 2023). In what follows, we first briefly summarize earlier research linking volunteering and health with a focus on how the underlying health of individuals was typically conceptualized and then review the theoretical and empirical literature on the heterogeneous effects of volunteering on health.
Earlier Works on Volunteering and Health
Researchers have long acknowledged the possibility that the relationship between volunteering and health may be reciprocal in nature, where health is considered both an antecedent as well as a consequence of volunteer engagement (Li & Ferraro, 2005; Thoits & Hewitt, 2001). The idea that health functions as an antecedent of volunteering stems from theoretical perspectives underscoring the role of supply-side factors often required of individuals for engagement in volunteer activities, such as social capital (e.g., social connectedness), cultural capital (e.g., religiosity), and human capital (e.g., education, wealth, health; Wilson & Musick, 1997). Although empirical research largely supports the notion that these resources serve as significant precursors to volunteering, the literature presents a somewhat inconsistent and paradoxical picture when it comes to how health influences volunteering. Although some studies found a modest positive correlation between better health and volunteer participation, many others found no substantial impact on health, independent of sociocultural and human capital factors (Dury et al., 2015; Kim, 2020). Intriguingly, several studies have also found that individuals characterized as having worse health, as evaluated by chronic illness, functional health, or depressive symptoms, volunteer more, not less, relative to their healthier counterparts (Dury et al., 2015; Li & Ferraro, 2005; Tang, 2006; Wilson & Musick, 1997). This counterintuitive observation is explained by the fact that individuals with compromised health, when adjusting for other sociocultural and human resources, are just as likely to be solicited for volunteer work as their healthier peers—the most common path to volunteer involvement. Furthermore, considering that poor health can inhibit other forms of social engagement (e.g., employment), individuals with compromised health often have more available time to dedicate to volunteering (Shandra, 2017).
Given these findings, it is not surprising that studies that explicitly account for health selection report robust health benefits associated with volunteering, often finding that most, if not the entirety, of the association between volunteering and health is ascribed to health benefits of volunteering, rather than selection based on health (Kail & Carr, 2016, 2020). It is in this context that we now turn to the question concerning the heterogeneous benefits associated with volunteering.
Heterogeneous Associations Between Volunteering and Health
Relative to the extensive attention paid to the issue of health selection, whether and how the health benefits of volunteering may vary across the health distribution remains an understudied area of research. The most direct evidence to date is provided by two European studies, one being a recent longitudinal study based on six panel surveys across Europe (de Wit et al., 2022). The study findings from quantile regression models suggested that the health benefits of volunteering, as assessed with self-rated health, are more pronounced at the worse end of the health distribution. Similarly, a British study revealed that the association between volunteering and life satisfaction is stronger for individuals at the lower end of the life satisfaction distribution (Binder, 2015). To our knowledge, no study to date has pursued this line of research beyond subjective measures of well-being.
Despite the scarcity of direct evidence, the well-documented mechanisms linking volunteering and health provide robust foundations for anticipating heterogeneous health benefits from volunteering across the health distribution favoring those at the worse end of the distribution. First, volunteering is known to bolster health by promoting physical and mental activities, serving as a source of purpose and meaning, and strengthening social networks and support (Burr et al., 2021). These mechanisms are most salient for less healthy individuals, whose poor health is largely shaped by deficits in these domains. Volunteering is also known to mitigate socioeconomic health disparities, which significantly contribute to overall population health disparities. This is partly because lower-socioeconomic status individuals have more to gain from the valued role and other psychosocial resources provided by volunteering (Kim & Halvorsen, 2021).
Further, population health disparities are also shaped by the unequal distribution of stress exposures (Thoits, 2010). Volunteering is known to serve as a protective buffer against daily stressors (Han et al., 2020) as well as major life course stressors (e.g., unemployment, widowhood; Carr et al., 2018; Griep et al., 2015), and such stress-buffering mechanism is likely to be more pertinent for individuals most frequently exposed to stressors often clustered at the lower end of the health distribution. Finally, health decline is often a process of one health problem engendering another and such a vicious cycle is what characterizes the health of individuals at the lower end of the distribution. Volunteering has shown to be effective in disrupting this vicious cycle (Kail & Carr, 2016), thereby potentially conferring more health benefits to individuals already experiencing health decline.
Current Study
The present study contributes to the literature by investigating the volunteering–FI nexus at different points in the population health distribution, using quintile regression and nationally representative data. We hypothesized that the health benefits associated with volunteering, as assessed with reductions in FI, would be heterogeneous across the FI distribution, and the association was expected to be greater in magnitude at the higher end of the frailty distribution compared to the healthier end. While volunteering is primarily conceptualized as a status variable in this study, we also explore whether and how volunteering intensity, as measured as hours committed to volunteering (dose effect; Kail & Carr, 2020; Kim et al., 2020), is associated with FI across the health distribution. Given the lack of research on the topic, we offer no hypothesis regarding the heterogeneous benefits associated with volunteering hours.
Method
Data Source and Study Sample
This study was based on longitudinal data from the HRS, an ongoing panel study representative sample of adults aged 51 and older, and their spouses, in the United States (Health and Retirement Study, 2023). Data for this project were primarily taken from the RAND constructed data file—an easy-to-use data set based on HRS core data that accounted for missing information and inconsistencies across waves (RAND Center for the Study of Aging, 2023). An exception was made for measures on volunteering and work disability, which were taken directly from the HRS core data available from the Survey Research Center at the University of Michigan.
We used 12 waves of biennial data from 1998 to 2020. Among 36,466 total respondents who were interviewed in the HRS during the observation period, we selected 35,082 individuals who were age-eligible and provided at least one nonproxy interview during the time window. Missing information on the key study variables was minimal (approximately 0.87% of person-wave observations); these missing person-wave observations were excluded from the analysis. The final analyses included 198,218 person-wave observations collected from 34,986 participants, equivalent to approximately 5.7 waves of observations per respondent.
Measures
Frailty index
Following recommended guidelines and earlier HRS-based studies, we constructed a 30-item index of frailty that captured a wide range of health deficits assessed at each wave (Dassel & Carr, 2014; Yang & Lee, 2009; for standard procedure for creating FI, see Searle et al., 2008). The items included eight chronic conditions, 12 activity limitations, eight symptoms of depression, self-rated health, and obesity (see Supplementary Materials for a detailed description of the index). The index is typically calculated as the count of deficits divided by the total number of possible deficits and can theoretically range from 0, indicating no deficits, to 1, indicating deficits on all indicators; however, the empirical near-maximum (e.g., 99th percentile) is consistently found below 0.70 (Stolz et al., 2021). Following earlier works, the index was calculated for observations that had valid information on at least 25 out of 30 items to maximize the analytic sample size (Dassel & Carr, 2014; Yang & Lee, 2009). The index showed good reliability, as indicated by α (range: 0.83–0.85 across study waves) and ω (range: 0.83–0.86) coefficients (Supplementary Table S1). We converted the index to a percentage scale (range: 0–100) to avoid presenting regression coefficients with many leading zeros. We also tested an alternative version of FI that included a more extensive set of health indicators (e.g., sensory impairment, cognitive impairment, and large muscle functioning) to ensure that the results were not sensitive to how FI was measured. Results from the sensitivity analyses were consistent with the main findings (Supplementary Tables S2 and S3).
Volunteering
At each wave, respondents were asked, “Have you spent any time in the past 12 months doing volunteer work for religious, educational, health-related, or other charitable organizations?” where the response was coded dichotomously to denote volunteer status (1 = volunteered; 0 = did not volunteer). For those participating in volunteering, a set of follow-up questions were asked to capture the annual time committed to volunteering. Based on this information, a multicategory measure for volunteer hours was created (e.g., 0 = 0 hours; 1 = 1–99 hours; 2 = 100–199 hours; 3 = 200+ hours), which was employed as a categorical variable to capture possible threshold effects (Burr et al., 2021).
Control variables
We included a set of time-varying covariates (TVCs) representing respondents’ social and human capital characteristics that could potentially confound the key estimates in the analyses. These included marital status (1 = married; 0 = not), work status (1 = working for pay; 0 = not), and household wealth (assets minus debts in $1,000, inverse hyperbolic sine-transformed). We also included a measure of work disability, assessed with the question, “Do you have any impairment or health problem that limits the kind or amount of paid work you can do?” (1 = yes; 0 = not) to account for any form of disability that likely limits social participation and further leads to worse health (Coyle & Putnam, 2017). Note that TVCs were measured at the same time as the key independent variable, which means that these variables can potentially function as a mediator, rather than a confounder. To address this concern, we estimated models using lagged versions of these variables, which yielded findings that were substantively identical to those reported here (Supplementary Table S4). Finally, the background characteristics of the sample, including birth cohort, gender, race–ethnicity, and education, are described below (Table 1), but the coefficients of these measures are not presented because the effects of time-invariant measures are subsumed by the person fixed effects in the current analytic framework.
Weighted Descriptive Characteristics of the Study Sample
| Variable | Mean | SD | % |
|---|---|---|---|
| Time-varying characteristics (N = 198,218 person-wave observations) | |||
| Frailty index (0%–100%) | 15.77 | 13.21 | |
| Volunteer status | |||
| Did not volunteer | 64.3 | ||
| Volunteered | 35.7 | ||
| Volunteer hours | |||
| 0 hr | 64.3 | ||
| 1–99 hr | 20.8 | ||
| 100–199 hr | 8.0 | ||
| 200+ hr | 6.9 | ||
| Age (in years; 51–109) | 65.38 | 9.82 | |
| Married | 61.6 | ||
| Working for pay | 45.0 | ||
| Household wealth (IHS; −8.6 to 14.7) | 5.04 | 2.77 | |
| Has work disability | 25.6 | ||
| Background characteristics (N = 34,986 persons) | |||
| Birth cohort (1892–1970) | 1,945.62 | 14.14 | |
| Female | 53.2 | ||
| Race–ethnicity | |||
| White, non-Hispanic | 74.8 | ||
| Black, non-Hispanic | 11.1 | ||
| Other, non-Hispanic | 4.7 | ||
| Hispanic | 9.4 | ||
| Education (in years; 0–17) | 12.89 | 3.14 | |
Notes: IHS = inverse hyperbolic sine; SD = standard deviation.
Analytic Strategy
The key research questions were addressed using unconditional quantile regression (UQR) combined with fixed effects (FE) modeling approach. To begin, FE models can be generally expressed as the following:
where i refers to individuals and t represents time; denotes the dependent variable, FI in percentage scale; the key independent variable, volunteering, measured as both status and intensity are denoted by ; and represents the set of TVCs described above, as well as age-related variables, which includes linear and quadratic age, as well as an interaction term involving age and birth year to allow for age-related changes in frailty to vary across the wide range of birth cohorts included in the study sample (Morrell et al., 2009). Finally, represents individual-specific fixed effects and represents the error term.
Whereas the general linear models, including FE models, uncover the effect of the predictor on the outcome at the mean (i.e., average effect for the relationship between variables of interest) conditional on other covariates in the model, UQR models allow for examining the potentially heterogeneous effects of the predictor on the outcome across the distribution of the outcome (Rios-Avila & Maroto, 2022). This approach has an additional advantage when the outcome variable in question is skewed, as is the case with FI (Figure 1), which makes the median, rather than the mean, a more adequate measure of central tendency (Rios-Avila & Maroto, 2022). Following Firpo et al. (2009), the dependent variable in UQR models is transformed into the recentered influence function (RIF), defined as the following:
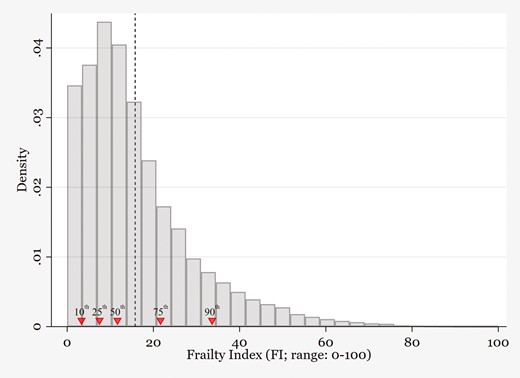
Frailty index (FI) distribution based on the Health and Retirement Study (HRS; 1998–2020). Histogram based on weighted HRS data (198,218 person-wave observations). The FI values corresponding to the 10th, 25th, 50th (median), 75th, and 90th percentiles were 3.3, 7.5, 11.7, 21.7, and 33.6, respectively. The mean value, denoted by dashed vertical line, was 15.8.
where τ indicates a specific quantile (e.g., 10th, or 0.10), is the value of the dependent variable at that specific quantile, is a function that equals 1 when an observation’s value of y is less than or equal to the value of the dependent variable at quantile τ, 0 otherwise, and is the density of y at quantile τ. The RIF-transformed outcome variable then replaces the original outcome in the FE model described above:
where captures the marginal effect on the unconditional τth quantile when there is a change in the distribution or prevalence of the predictor variables (e.g., volunteering), holding other covariates constant. The heterogeneity of the volunteering–frailty nexus can be evaluated by observing changes in across a set of UQR models across different points in the overall FI distribution.
We focus on the 10th, 25th, 50th, 75th, and 90th percentiles to describe the relationship between volunteering and frailty across the health distribution ranging from low (i.e., 10th and 25th; good health) to median (50th) and high frailty (i.e., 75th and 90th; poor health). All UQR models with fixed effects were estimated using the xtrifreg function in Stata 17 (Borgen, 2016). We also provide estimates from the FE model (estimated with xtreg) that describe the conditional mean effect as a point of reference. All analyses were based on survey weights provided by the HRS, which were rescaled so that the weighted sample size remained identical to the unweighted total, and robust standard errors were reported.
Results
Descriptive characteristics of the study sample are presented in Table 1. The mean value of FI observed during the study period was 15.8. However, its distribution was skewed with a long right tail, with the values corresponding to the 10th, 25th, 50th, 75th, and 90th percentiles being 3.3, 7.5, 11.7, 21.7, and 33.6, respectively (Figure 1). The value at the 99th percentile was 62.5, consistent with the empirical near-maximum values reported in earlier studies (Stolz et al., 2021). Volunteering was reported on about 36% of the person-wave observations, with approximately 21%, 8%, and 7% devoted to 1–99 hr, 100–199 hr, and over 200 hr of annual volunteering during the study period.
Results from regression models examining the linkages between volunteer status and FI are presented in Table 2. The first column presents estimates from FE models, where volunteering was associated with reductions in frailty controlling for a set of observed TVCs and unobserved individual characteristics (b = −0.92; p < .001). The FE model, however, assumes that the association between volunteering and frailty is constant across the overall frailty distribution. As shown in the subsequent columns in Table 2, estimates from the UQR models with fixed effects suggest evidence to the contrary, with the magnitude of the health benefits associated with volunteering showing substantial heterogeneity across the frailty distribution (Figure 2, Panel 1 for a graphical representation). The estimates are mostly negative, indicating that volunteering is associated with reductions in frailty, but the magnitude of the association is the largest at the 90th percentile (b = −2.90; p < .001) and becomes progressively smaller in lower quantiles (e.g., 75th percentile: b = −1.65; p < .001; 50th percentile: b = −0.32; p < .001; 25th percentile: b = −0.15; p = .004) until it becomes not statistically significant at the 10th percentile (b = 0.01; p = .89). This indicates that the estimate from the fixed effect model (b = −0.92) overestimated the health benefits associated with volunteering at the median of the frailty distribution and below and underestimated the benefits at the higher end of the distribution. In other words, results from the UQR models demonstrate that if the share of volunteers increased in the population, we would expect to see greater health benefits at the higher end frailty distribution (i.e., poor health) than at the lower end (i.e., better health).
Weighted Estimates From Fixed Effects (FE) and Unconditional Quantile Regression With Fixed Effects (UQR-FE) Models Predicting Frailty Index
| Variable | FE | UQR-FE | ||||
|---|---|---|---|---|---|---|
| Mean | 10th | 25th | 50th | 75th | 90th | |
| Volunteered | −0.92*** (0.07) | 0.01 (0.05) | −0.15** (0.05) | −0.32*** (0.06) | −1.65*** (0.13) | −2.90*** (0.27) |
| Age lineara | 0.29*** (0.01) | 0.17*** (0.00) | 0.26*** (0.00) | 0.28*** (0.01) | 0.29*** (0.01) | 0.26*** (0.02) |
| × birth cohorta | −1.00*** (0.11) | −0.41*** (0.08) | −0.42*** (0.08) | −0.35*** (0.10) | −1.13*** (0.21) | −3.63*** (0.43) |
| Age squareda | 0.08 (0.07) | −0.32*** (0.05) | −0.16** (0.05) | 0.32*** (0.06) | 0.51*** (0.14) | −0.89** (0.28) |
| × birth cohorta | −2.75*** (0.31) | 0.06 (0.18) | −0.11 (0.19) | −0.35 (0.23) | −4.22*** (0.51) | −12.53*** (1.09) |
| Married | −1.20*** (0.13) | 0.09 (0.08) | −0.04 (0.08) | −0.66*** (0.10) | −2.07*** (0.23) | −4.11*** (0.49) |
| Working for pay | −1.29*** (0.08) | −0.24*** (0.06) | −0.44*** (0.06) | −0.91*** (0.07) | −1.90*** (0.15) | −3.14*** (0.30) |
| Household wealthb | −0.18*** (0.02) | 0.02 (0.01) | −0.02 (0.01) | −0.04** (0.01) | −0.26*** (0.03) | −0.61*** (0.08) |
| Has work disability | 2.87*** (0.08) | −0.10** (0.03) | 0.40*** (0.04) | 1.63*** (0.06) | 5.19*** (0.15) | 7.71*** (0.34) |
Notes: Based on 198,218 person-wave observations collected from 34,986 participants (unweighted). Robust standard errors presented in parentheses.
Source: Health and Retirement Study, 1998–2020.
aMultiplied by 100 to reduce leading zeros; age and birth cohort centered at 65 and 1945, respectively.
bIn $1,000, transformed by inverse hyperbolic sine.
*p < .05. **p < .01. ***p < .001.
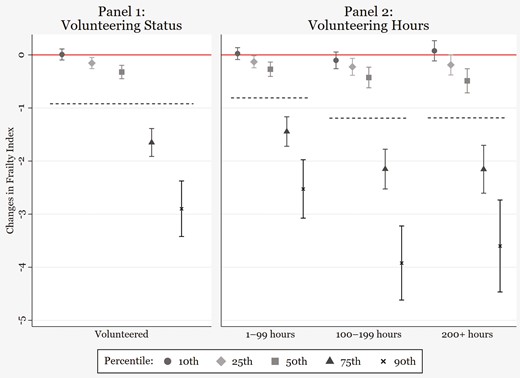
Heterogeneous health benefits associated with volunteering. Plots shown in Panel 1 are based on fully adjusted estimates (with 95% confidence intervals) from the unconditional quantile regression models with fixed effects reported in Table 2 and indicate changes in frailty index associated with volunteering status. The estimate from the fixed effects model (b = −0.92) is denoted with the dashed horizontal line for reference. Similarly, plots shown in Panel 2 are based on fully adjusted estimates reported in Supplementary Table S2.
Results from models exploring the associations between a set of volunteering hours and frailty are represented in Panel 2 of Figure 2 (see Supplementary Table S5). Again, the association between each level of volunteering hours and frailty showed substantial heterogeneity across the frailty distribution. Similar to the results on volunteering status, the magnitude of the estimate was the largest at the 90th percentile and became progressively smaller in lower quantiles. Overall, both the FE and UQR model results indicated that volunteering more than 200 hr annually did not confer more health benefits than volunteering 100–199 hr.
Discussion
The objective of this study was to contribute to the research literature linking volunteering and health, with an emphasis on investigating the extent to which health benefits associated with volunteering may be heterogeneous across the population health distribution. To this end, we focused on FI constructed based on a rich set of health indicators, which allowed us to gauge population health along a continuum ranging from fit to frail (Dent et al., 2019). Notably, one’s level of FI can fluctuate in either direction over time, even among those perceived as severely frail (Shi et al., 2023). This dynamic feature makes FI especially useful when evaluating the health benefits of an intervention, such as volunteering, aimed at reducing FI levels. The study findings based on longitudinal data from nationally representative HRS data provide unique and compelling evidence that health benefits associated with volunteering are heterogeneous across the population health distribution.
In line with our hypothesis, the magnitude of reductions in FI associated with volunteering became more pronounced with increasing quantiles of the FI distribution, indicating that volunteering yields greater benefits for subgroups of older adults who have poor underlying health compared to their counterparts in good health. Whereas volunteering did not have any association with changes in FI in the 10th percentile, the reductions in FI associated with volunteering were sizable at the 75th (b = −1.65) and 90th percentiles (b = −2.90). In addition, the findings revealed that health benefits of such magnitudes or larger could be obtained with about 100+ volunteer hours annually, which is equivalent to about 2 weekly hours (Figure 2 and Supplementary Table S4). To put these estimates in perspective, the marginal effects of age in the unadjusted model that included age-related parameters only (i.e., age and birth cohort polynomials and their interaction terms) were 0.57 and 0.81 in the 75th and 90th quantiles of the UQR models with FE effects, respectively (Supplementary Table S6). This means that the health benefits could be substantial enough to offset age-related FI increases and further lead to reductions in FI at the higher end of the FI distribution, but not at the lower end. While we are not able to offer empirical explanations for such heterogeneous effects, it is likely that unequal distribution of resources, opportunities, and stressors that overlap with the FI distribution across the population account for the current study findings (Burr et al., 2021; Dent et al., 2019). More research is needed to test these potential explanations.
While this study treated FI as a continuous measure, others often use 25% as a cutoff to indicate those who are frail as opposed to being in prefrail or robust health (e.g., frail ≥ 0.25; prefrail < 0.25; Hoogendijk et al., 2019). In this context, the volunteering–frailty association identified in this study could be seen as most potent among those classified as frail. As widely documented in earlier research, frailty is associated with substantial increases in healthcare expenditure and mortality risk (Hoogendijk et al., 2019). For example, one U.S. study reported that the expenditures associated with frail individuals were roughly three to five times that of nonfrail counterparts among Medicare beneficiaries and differences in mortality risks across frail and nonfrail groups were four- to sevenfold (Shi et al., 2023). This study also reported that among those categorized as moderate to severely frail (≥0.35 or 35%), reductions in FI that were deemed large (>0.045 or 4.5%) or small (>0.015–0.045 or 1.5%–4.5%) led to substantial reductions in Medicare spending ($46,864–$55,839) and mortality risks (15%–27%). Although the FI scores from earlier studies are not directly comparable to those reported here due to differences in the measurement instruments, these previous findings provide useful context for understanding the substantial benefits of volunteering for those who experience higher levels of FI.
The heterogeneous associations between volunteering and FI reported here substantiate earlier calls for considering formal volunteering as a public health intervention (Carr et al., 2015). The finding that health benefits are much greater for subpopulations characterized by poor health compared to their healthy counterparts, along with the observation that 100–199 annual hours (equivalent to 2–4 weekly hours) are associated with sizable health benefits, is promising in the context of promoting population health and alleviating health disparities. While many presume that individuals in poor or frail health are less likely to volunteer, empirical findings on this topic showed limited evidence for selection effects based on health (Kim, 2020; Shandra, 2017). Rather, volunteering is in large part determined by factors determined by voluntary organizations, such as flexible scheduling and the provision of small stipends (e.g., to cover travel expenses). Lowering barriers to volunteering as well as broadening recruitment efforts to individuals from diverse backgrounds, including those from historically marginalized racial–ethnic groups, could lead to large gains in population health outcomes and also reduce health disparities (Carr et al., 2015; Gonzales et al., 2015). To this end, ongoing efforts to promote volunteering among willing individuals from diverse backgrounds dealing with various forms of physical and cognitive limitations should be strongly supported (Carr et al., 2015; Klinedinst & Resnick, 2016; Sellon, 2023). Recommending approximately 2 weekly hours of volunteering, a dosage that is considered sustainable and sufficient for one to get immersed in the act of helping others, may prove to be effective in promoting the health of older adults grappling with health problems (Johnson & Post, 2017).
Limitations
Although we employed a measure of FI that draws from a rich set of indicators to capture health across various physiological systems, these indicators relied on self-reported data. Given the potential measurement bias in self-reported data, our study findings need to be corroborated using other measures of frailty, such as FI based on administrative data or frailty phenotype based on biomarkers (Hoogendijk et al., 2019; Shi et al., 2023). Furthermore, the approach used to construct FI assumes that each indicator has an equal contribution to the scale, but such an equal weight assumption may not be valid and should be further tested in future research (McNeish & Wolf, 2020). Finally, we were not able to distinguish between different types of volunteering (e.g., intergenerational, healthcare, and religious volunteering) due to limited data availability (Burr et al., 2021). Future studies should examine whether volunteering in different settings may lead to heterogeneous health outcomes.
Contributions and Conclusion
To the best of our knowledge, this is the first study to investigate the association between volunteering and health using UQR models, which, coupled with the nationally representative HRS data, allowed us to uncover evidence suggesting that health benefits associated with volunteering may be heterogeneous across the population health distribution. Using UQR in population studies to identify modifiable risk and protective factors that are especially effective for the most disadvantaged groups—rather than merely identifying average health effects—presents a promising avenue for future research. Our key study findings add a new perspective to the well-researched topic of health selection and expand our understanding of the nuanced relationship between volunteering and health. Investigating FI is another contribution, as population aging around the globe has placed frailty as one of the most pressing public health challenges, and evidence-based, cost-effective intervention strategies remain notably scarce (Dent et al., 2019). Our findings resonate with earlier recommendations for practitioners and healthcare professionals to devise and implement innovative strategies that integrate volunteering as part of healthcare to promote health and well-being among older adults, especially those in suboptimal health.
Funding
This research was supported by the National Institute on Aging (P30AG066614 to the Center on Aging and Population Sciences at the University of Texas at Austin) and by the Eunice Kennedy Shriver National Institute of Child Health and Human Development (P2CHD042849 to the Population Research Center at the University of Texas at Austin). This research was also supported by the Ministry of Education of Korea and National Research Foundation of Korea (BK21 FOUR [Fostering Outstanding Universities for Research]).
Conflict of Interest
None.
Acknowledgments
The content is solely the responsibility of the authors and does not necessarily represent the official views of the National Institutes of Health. The HRS is sponsored by the National Institute on Aging (grant number NIA U01AG009740) and is conducted by the University of Michigan.

