


Abstract
Purpose in life has been associated with diverse health outcomes; however, few studies have examined its associations with progressive motor decline in older adults. We tested if higher purpose would be associated with lower likelihood of incident parkinsonism as well as with lower levels and slower rates of increase in parkinsonian signs.
Participants were 2,626 older adults from the Rush Memory and Aging Project and Minority Aging Research Study followed for an average of 7.2 years (standard deviation [SD] = 4.6). Purpose was measured using the purpose in life subscale of the modified Ryff’s and Keyes’s measure of psychological well-being. Four parkinsonian signs (i.e., parkinsonian gait, rigidity, bradykinesia, and tremor) were assessed using the United Parkinson’s Disease Rating Scale. We examined purpose with risk of developing incident parkinsonism using Cox proportional hazards models. We also used linear mixed-effect models to assess the association between purpose and parkinsonian sign trajectories.
After including demographics, health conditions, and health behaviors in the model, for a 1-SD increase in purpose, the hazards ratio for incident parkinsonism was 0.88 (95% confidence interval [CI] 0.80, 0.97). A 1-SD increase in purpose was associated with a −0.19 (95% CI −0.24, −0.15) point lower score in the global parkinsonian summary score at baseline but no differences in rate of change were evident.
Higher purpose was associated with lower hazards of incident parkinsonism and lower levels of parkinsonian signs at baseline. Associations were seen even after adjustment for a wide range of covariates. Findings suggest higher purpose may contribute to maintenance of healthy physical function among older adults.
Parkinsonism, a clinical syndrome characterized by a combination of symptoms including parkinsonian gait, bradykinesia, tremor, and rigidity, is increasingly recognized as a highly prevalent indicator of declining physical functioning in older adults (Buchanan et al., 2021; Louis & Bennett, 2007). Studies have shown that this heterogeneous disorder affects 50% or more of adults by age 85 (Bennett et al., 1996) and is associated with increased risk of a wide range of adverse health outcomes such as mortality, Alzheimer’s dementia, mild cognitive impairment, and physical disability (Buchman et al., 2016). In addition, cerebrovascular disease pathologies either individually or in combination appear to play a role in the development of parkinsonism and its progression (Buchman, Yu, Oveisgharan, Farfel, et al., 2021). A greater accumulation of mixed-brain pathologies, particularly cerebrovascular disease pathologies that tend to accumulate in brains of older adults, is linked to faster progressive parkinsonism (Buchman, Yu, Wilson, Leurgans, et al., 2019). Importantly, individuals differ in their ability to tolerate accumulating brain pathologies, and this capacity has been previously referred to as resilience or neural reserve (Bennett, 2017; Stern et al., 2019). Given the high prevalence of parkinsonism and the increased risk of adverse health outcomes with which the syndrome is associated, it is important to identify protective factors that may confer greater resilience to progressive parkinsonism.
There is significant heterogeneity in the age-related declines in motor function, with some individuals experiencing little loss of function while others display rapid functional decline (Buchman, Yu, Oveisgharan, Petyuk, et al., 2021). Recent work has found that while almost all older adults exhibit some brain pathologies, the degree to which these pathologies contribute to motor impairment differs significantly between individuals (Buchman, Yu, Oveisgharan, Farfel, et al., 2021; Buchman, Yu, Wilson, Leurgans, et al., 2019). This suggests that certain factors may offer resilience by offsetting the negative effects of accumulating brain pathologies that contribute to motor decline. Studies have identified biological and behavioral factors such as motor resilience proteins and increased physical activity as examples of resilience factors against motor and cognitive decline (Buchman et al., 2023; Buchman, Yu, Oveisgharan, Petyuk, et al., 2021; Buchman, Yu, Wilson, Lim, et al., 2019). Further, studies have investigated higher-order factors such as educational attainment and social connections as potential sources of resilience (Bennett et al., 2003, 2006). While various facets of psychological well-being have been linked with greater likelihood of healthy aging and healthspan (James et al., 2019; Kim et al., 2019; Koga et al., 2022), few studies have directly assessed whether psychological well-being may serve as a resilience factor in the context of physical function and motor decline.
Purpose in life refers to the extent to which individuals feel their lives have meaning, purpose, and direction (Ryff, 2014; Ryff & Heidrich, 1997; Steger et al., 2006). It has been associated with a range of health outcomes including better cardiovascular health, reduced risk of mortality, and sustained physical functioning (Bennett, 2017; Buchman, Yu, Oveisgharan, Farfel, et al., 2021; Buchman, Yu, Wilson, Leurgans, et al., 2019). A prior longitudinal study in the Rush Memory and Aging Project (MAP) also found higher levels of purpose in life modified the association between Alzheimer’s dementia pathologic changes and cognition. Participants with higher levels of purpose exhibited better cognitive function despite the burden of the disease, suggesting purpose in life may provide resilience against these pathologies (Boyle et al., 2012). Given cognitive and motor declines share risk factors and common biology such as brain pathologies (Buchman & Bennett, 2011), prior research suggests that a higher sense of purpose in life may increase resilience to potential negative effects of brain pathologies. However, few studies have examined the association between purpose in life and motor decline or progressive parkinsonism. As research increasingly suggests that sense of purpose and meaning in life (a closely related concept to purpose in life) can be altered with active interventions (Breitbart et al., 2015; Klein, 2017), investigating whether a higher sense of purpose in life is prospectively associated with incident parkinsonism and trajectories of parkinsonian signs may inform future interventions to support healthy aging. To our knowledge, no studies have investigated whether purpose in life is associated with slower rate of parkinsonism progression.
We used longitudinal data from Rush MAP and Minority Aging Research Study (MARS), which are ongoing epidemiologic studies of older adults, to test the following hypotheses: (1) higher sense of purpose in life at baseline would be associated with lower incidence of parkinsonism over follow-up; (2) higher sense of purpose in life at baseline would be associated with lower levels of parkinsonian signs at baseline; (3) higher sense of purpose in life at baseline would be associated with slower rates of increase in parkinsonian signs over follow-up. In order to ease comparisons across studies, we assessed parkinsonian signs using a global summary score and also using separate domain scores. Following prior work, we also considered a range of potential confounders including sociodemographic factors, health conditions, and depressive symptoms as they have been associated with both sense of purpose in life and parkinsonism (Buchman et al., 2016; Cohen et al., 2016; Kim et al., 2017).
Method
Participants and Procedure
Participants were older adults without known dementia at baseline from the Rush MAP and MARS. These are longitudinal studies with similar data collection procedures and measures, allowing for pooled analyses (Barnes et al., 2012; Bennett et al., 2012). Enrollment for MAP and MARS is ongoing, and participants’ analytic baseline years differ based on their study entry dates. The MAP consists of predominantly White individuals with diverse socioeconomic backgrounds, and enrollment began in 1997. Participants were recruited from approximately 40 continuous care retirement communities and senior subsidized housing facilities in and around the Chicago metropolitan area (n = 2,252 at baseline). Assessment of purpose in life began in 2001. The MARS is a cohort of Black individuals that started enrollment in 2004. Participants were recruited from community-based organizations, churches, and senior housing facilities in the metropolitan Chicago area and outlying suburbs (n = 809 at baseline). Assessment of purpose in life began in 2004. All measures were collected at annual visits at participant homes (Barnes et al., 2012; Bennett et al., 2012). Baseline for analysis was considered as the time of study entry. Details of the recruitment method and study protocol have been described in detail elsewhere (Barnes et al., 2012; Bennett et al., 2005).
Participants were excluded from the analytic sample if they were missing the purpose in life measure at baseline (N = 243), missing data about parkinsonian signs at all time points (N = 21), missing data on more than four of the seven health condition measures at baseline (N = 6), if they reported using Parkinson’s disease (PD) medication at baseline (N = 62; in order to reduce concerns about reverse associations between purpose and risk of parkinsonism) or if they were missing information about use of PD medication (N = 1), if they had PD at baseline (N = 67), or if they were missing information about PD at baseline (N = 12). For incident parkinsonism analyses, participants were additionally excluded if they had parkinsonism at baseline (n = 564), had no data on parkinsonism at baseline (n = 13), or had no follow-up data on parkinsonism (n = 273). The final analytic sample was 1,839 for incident parkinsonism and 2,626 for parkinsonian signs analysis. The study was approved by the Institutional Review Board of Rush University Medical Center and informed consent was obtained from all participants.
Measures
Purpose in life
Purpose in life was assessed at the baseline interview using the purpose in life subscale of the modified measure derived from Ryff’s and Keye’s scales of psychological well-being. Participants were asked to rate their level of agreement with 10 items on a 5-point Likert scale. Items included phrases such as “I feel good when I think of what I’ve done in the past and what I hope to do in the future” and “I have a sense of direction and purpose in life” (see Supplementary Material Section 1 for all items). Negatively worded items are reversed so that higher scores indicated greater purpose in life. Following other work with these cohorts (Boyle et al., 2010a), item scores were averaged to create a total score ranging from 1 to 5. We considered the purpose in life score as a standardized continuous measure (z-score).
Parkinsonian signs
At the annual clinical evaluation, trained nurse clinicians scored each of the 26 items of the previously validated modified motor portion of the United Parkinson’s Disease Rating Scale (mUPDRS; Bennett et al., 1997; see Supplementary Material Section 2 for items) over up to 20 years of follow-up (Bennett et al., 1997, 1999). Each item was scored on a scale from 0 to 4 or 0 to 5, where 0 indicates normal or healthy functioning and higher scores indicate increasing dysfunction. Following prior work in these cohorts (Buchman & Bennett, 2020; Buchman et al., 2016), four parkinsonian sign domain scores were derived from the 26 items, including parkinsonian gait (six items), rigidity (five items), bradykinesia (eight items), and tremor (seven items). Each domain score was calculated by summing scores assigned to each relevant individual item, divided by the maximum possible score for that domain, and then multiplied by 100 to create a score ranging from 0 to 100, with a higher score indicating more severe dysfunction in that domain. This calculation was used to express the domain scores in a common metric (Bennett et al., 1997). A global parkinsonian summary score was derived by averaging scores of the four domains and used as a composite measure of dysfunction. Prior work suggests parkinsonian signs evaluated using this method closely correspond to evaluations obtained from neurologists with expertise in movement disorders (Bennett et al., 1997). The measure has high interrater reliability with intraclass correlations exceeding 0.97 for all items, and short-term temporal stability and reproducibility in men and women in a variety of cohorts (Abdolahi et al., 2013; Bennett et al., 1997, 1999). Due to the positively skewed distributions, following prior work (Buchman, Yu, Wilson, Leurgans, et al., 2019), we square-root-transformed the global parkinsonian summary score and the parkinsonian gait and bradykinesia domain scores and these were analyzed as continuous measures. We categorized the domain scores for tremor and rigidity as 0 or >0 and analyzed these scores as binary measures.
Incident parkinsonism
Parkinsonism was considered present if two or more of the four parkinsonian domains were rated as positive for parkinsonian signs. Each domain was considered positive if two or more of the items in that specific domain were scored ≥1, indicating mild abnormality (Buchman & Bennett, 2020). The first occurrence of parkinsonism was considered as incident parkinsonism.
Covariates
Baseline sociodemographic information was assessed as potential confounders, given prior work has found sociodemographic differences in purpose in life and parkinsonism (Hemming et al., 2011; Shiba et al., 2021). Study participants self-reported age (years), sex (male/female), race (White, Black, American Indian or Alaskan Native, Native Hawaiian or Other Pacific Islander, Asian, Other, or Unknown) and ethnicity (yes or no for Spanish/Hispanic/Latino), education (years of education), and marital status (never married, married, widowed, divorced, separated). Due to the limited sample size in some racial and ethnic groups, we recategorized participants based on race only to White and Black. We set race as “Other” for those who identified with the other categories.
Baseline health conditions were also assessed as potential confounders as they could affect both sense of purpose and parkinsonism. Based on prior work in this cohort, we assessed health conditions at baseline via a composite measure of seven medical conditions (Boyle et al., 2009). Conditions queried included diabetes, heart disease, hypertension, thyroid disease, cancer, head injury, and stroke. All conditions except for stroke and diabetes were assessed via self-report of a clinician’s diagnosis of specific conditions. For stroke, neurological examination by clinicians and review of prior brain scans (if available) were additionally incorporated. Diabetes was assessed based on self-report of diagnosis by a clinician or the use of relevant medication for the condition (participants supplied all medications taken in the 2 weeks prior to the evaluation; Schneider et al., 2005). The total count of conditions present in this sample ranged from 1 to 7 and was used as a continuous measure. For those missing information on >4 conditions, the score was considered as missing. PD was also assessed based on self-reported history for which dopaminergic medication was received. The use of medication for PD was also assessed via inspection of medications taken in the 2 weeks prior to the evaluation.
As prior work has linked depression with both purpose in life and parkinsonism (Hedberg et al., 2010; Uemura et al., 2013), depressive symptom was considered as a potential confounder. Levels of depressive symptoms were assessed with the modified 10-item version of the self-report Center for Epidemiological Studies—Depression scale (Kohout et al., 1993). Participants were asked if they experienced each of the 10 symptoms in the past week (yes/no). A total score is derived by summing the total number of symptoms reported. For participants missing <5 items, the score was rescaled to be out of 10 by averaging the nonmissing item values and multiplying by 10. For those missing more than five items, the score was considered as missing.
Building on prior work suggesting body mass index (BMI; assessed height and weight to derive kg/m2) and health behaviors could either confound the association or lie on the pathway between purpose in life and health outcomes (Kim et al., 2020), we evaluated models including these biobehavioral factors as well. Trained staff measured BMI at the baseline visit. Relevant health behaviors including smoking and alcohol consumption were also assessed by self-report at baseline. Never smoker, former smoker, and current smoker status was categorized based on the answer to the following two questions: “Do you smoke cigarettes now?” and “Did you ever smoke cigarettes regularly?” Alcohol consumption was assessed first by asking participants if they had consumed at least 12 drinks ever and in the last 12 months. Individuals who answered no to both questions were given a total alcohol consumption of 0 g. Those who responded yes were then asked to estimate the quantity of beer, wine, and liquor consumed and the frequency of consumption. The total grams of alcohol consumed per day was calculated based on these responses. Dummy variables for missingness were created for missing categorical covariates.
Statistical Analysis
To assess whether higher levels of purpose in life were associated with lower risk of incident parkinsonism, we used Cox proportional hazards models. Cox models facilitate evaluating not only if individuals developed parkinsonism, but also the time to when parkinsonism onsets. We examined proportional hazards assumption by Schoenfield residuals and the assumption was upheld for purpose in all models (p > .05). We employed the following sets of models for the analysis. Model 1 included baseline sociodemographic factors (i.e., age, race, education, marital status); Model 2 added further potential confounders to the model including baseline health conditions and depressive symptoms. Model 3 additionally included BMI, alcohol consumption, and smoking status that could be potential confounders or lie on the pathway from purpose in life to parkinsonian signs. Next, for the global parkinsonian summary score, parkinsonian gait, and bradykinesia, we used linear mixed-effect models with random intercepts and random slopes to test whether the rate of increase in parkinsonian signs over time was slower with higher levels of purpose in life. These models used the residual maximum likelihood method and a compound symmetry covariance structure. For tremor and rigidity, we employed mixed-effects logistic regression to test whether higher levels of purpose were associated with higher odds of having any sign for these two domains. We incorporated the same sets of covariates in increasingly adjusted models as described for the above analyses. All analyses were conducted in R 4.2.2.
As sensitivity analysis, we excluded those reporting three or more depressive symptoms at baseline. We also assessed associations after excluding those categorized as “Other” for race. To assess potential similarity in associations across groups, we also stratified analyses by race and looked at associations within White and Black individuals. Those categorized as “Other” for race were dropped from this analysis due to small sample size in this category. We did not test for interaction by race due to age differences by race of the participants. Further, to evaluate potential effect modification by sex, we included relevant interaction terms of purpose and sex in all models.
Results
The mean and maximum follow-up time was 7.17 (standard deviation [SD] = 4.6) and 20 years, respectively. On average, participants had four clinic-based assessments of parkinsonian signs over follow-up. Notably, the majority of the sample was female (75%), and 66% were White individuals. The mean age at baseline was 78 years (SD = 7.9). The mean purpose in life score at baseline was 3.7 (SD = 0.6; range = 2–5). This score was comparable to those excluded from the analysis due to having a PD diagnosis at baseline (mean = 3.7, SD = 0.5; range = 2.6–4.9). Baseline characteristics of the sample are shown in Table 1 and the mean purpose in life scores by categories of baseline characteristics are shown in Table 2. Purpose in life correlated positively with levels of education, and negatively with age, number of health conditions, and depressive symptoms at baseline (Table 2).
Baseline Characteristics, Rush Memory and Aging Project, and Minority Aging Research Study (N = 2,626)
| Characteristic | Mean (SD) | N (%) |
|---|---|---|
| Demographics | ||
| Age, years | 78.0 (8) | |
| Female | 1,977 (75) | |
| Race | ||
| White | 1,733 (66) | |
| Black | 865 (33) | |
| Asian | 10 (0) | |
| American Indian or Alaskan Native | <10 | |
| Native Hawaiian or Other Pacific Islander | <10 | |
| Other | <10 | |
| Unknown | <10 | |
| Education, years | 14.9 (3) | |
| Marital status | ||
| Never married | 162 (6) | |
| Married | 971 (37) | |
| Widowed | 1,065 (41) | |
| Divorced/separated | 426 (16) | |
| Health-related factors | ||
| CES-D | 1.2 (2) | |
| Body mass index | 28.2 (6) | |
| Health conditions | 2.5 (1) | |
| Health behaviors | ||
| Alcohol, g/day | 4.9 (13) | |
| Smoking | ||
| Never | 1,444 (55) | |
| Former | 1,076 (41) | |
| Current | 105 (4) | |
Notes: CES-D = 10-item modified version of the Center for Epidemiological Studies—Depression scale; SD = standard deviation. Sample sizes less than 10 are noted as <10 to protect the identifiability of individuals.
Descriptive Analyses of Purpose in Life Score With Baseline Characteristics (N = 2,626)
| Characteristic | Mean (SD) | Correlation coefficient | p Value |
|---|---|---|---|
| Sex | <.01 | ||
| Female | 3.72 (0.5) | ||
| Male | 3.78 (0.4) | ||
| Race | <.01 | ||
| White | 3.68 (0.5) | ||
| Black | 3.85 (0.5) | ||
| Marital status | <.01 | ||
| Never married | 3.65 (0.5) | ||
| Married | 3.83 (0.4) | ||
| Widowed | 3.64 (0.4) | ||
| Divorced/separated | 3.76 (0.5) | ||
| Smoking | .08 | ||
| Never | 3.75 (0.5) | ||
| Former | 3.72 (0.5) | ||
| Current | 3.68 (0.5) | ||
| Age | −0.29 | <.01 | |
| Education | 0.29 | <.01 | |
| Health conditions | −0.07 | <.01 | |
| Body mass index | 0.03 | .15 | |
| Depressive symptoms | −0.33 | <.01 | |
| Alcohol consumption | 0.04 | .05 |
Notes: SD = standard deviation. For categorical variables, group comparisons were conducted using t tests. For continuous variables, Pearson’s correlation coefficients were calculated.
Purpose in Life and Incident Parkinsonism
Over follow-up, 610 out of 1,839 participants (33.2%) developed parkinsonism. Unadjusted Kaplan–Meir curves are shown in Figure 1. After adjusting for baseline sociodemographic factors (Model 1), a 1-SD increase in purpose in life was associated with a 15% decrease in the hazards of incident parkinsonism (hazards ratio [HR] = 0.85 [95% confidence interval {CI} 0.78, 0.94]). After additional adjustment for covariates, this association was maintained (Model 2 HR = 0.88 [95% CI 0.80, 0.97] and Model 3 HR = 0.88 [95% CI 0.80, 0.97]).
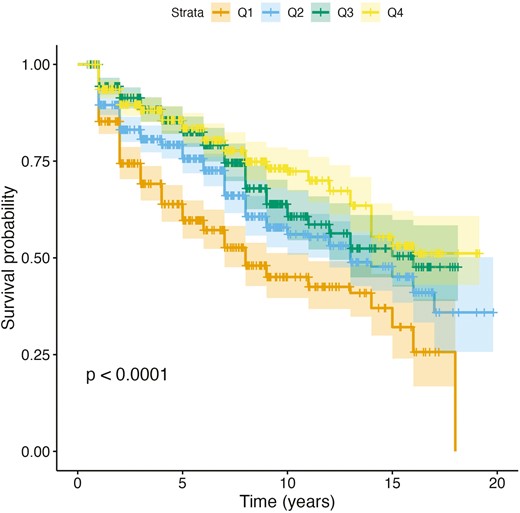
Unadjusted Kaplan–Meir survival curves for the global parkinsonian summary score, stratified by quartiles of sense of purpose in life at baseline. Q = quartiles; Q1 = lowest quartile of purpose in life; Q4 = highest quartile of purpose in life.
Purpose in Life With Levels and Changes in Global Parkinsonian Summary Score Over Time
On average, the global parkinsonian summary score increased by 0.08 points per year over follow-up (Time, Table 3, Model 3). In all models, higher sense of purpose at baseline was associated with lower scores for the global parkinsonian summary score. For example, after including demographics, health conditions, and health behaviors in the model, a 1-SD increase in purpose in life was associated with a −0.19 (95% CI −0.24, −0.15) point lower global parkinsonian summary score (Purpose, Table 3, Model 3). Higher sense of purpose was not associated with the rate of change in the global parkinsonian summary score (Purpose × Time, Table 3, Model 3).
Associations of Baseline Sense of Purpose in Life With the Global Parkinsonian Summary Score and Domain-Specific Scores (N = 2,626)
| Variable | Model 1 | Model 2 | Model 3 | ||||||
|---|---|---|---|---|---|---|---|---|---|
| Beta | OR | 95% CI | Beta | OR | 95% CI | Beta | OR | 95% CI | |
| Global summary | |||||||||
| Purpose | −0.25** | −0.30, −0.21 | −0.21** | −0.26, −0.16 | −0.19** | −0.24, −0.15 | |||
| Time | 0.08** | 0.07, 0.09 | 0.08** | 0.07, 0.09 | 0.08** | 0.07, 0.09 | |||
| Purpose × Time | 0.00 | −0.01, 0.01 | 0.00 | −0.01, 0.01 | 0.00 | −0.01, 0.01 | |||
| Gait | |||||||||
| Purpose | −0.36** | −0.44, −0.28 | −0.27** | −0.35, −0.19 | −0.25** | −0.33, −0.17 | |||
| Time | 0.18** | 0.16, 0.19 | 0.18** | 0.17, 0.19 | 0.18** | 0.17, 0.19 | |||
| Purpose × Time | −0.01 | −0.02, 0.01 | −0.01 | −0.02, 0.00 | −0.01 | −0.02, 0.00 | |||
| Bradykinesia | |||||||||
| Purpose | −0.26** | −0.34, −0.19 | −0.21** | −0.29, −0.14 | −0.21** | −0.28, −0.13 | |||
| Time | 0.08** | 0.07, 0.09 | 0.08** | 0.07, 0.09 | 0.08** | 0.07, 0.09 | |||
| Purpose × Time | 0.00 | −0.01, 0.01 | 0.00 | −0.01, 0.01 | 0.00 | −0.02, 0.01 | |||
| Tremor | |||||||||
| Purpose | 0.78** | 0.71, 0.87 | 0.79** | 0.71, 0.89 | 0.79** | 0.71, 0.88 | |||
| Time | 1.04** | 1.02, 1.06 | 1.04** | 1.02, 1.06 | 1.04** | 1.02, 1.06 | |||
| Purpose × Time | 1.01 | 0.99, 1.03 | 1.01 | 0.99, 1.03 | 1.01 | 0.99, 1.03 | |||
| Rigidity | |||||||||
| Purpose | 0.66** | 0.57, 0.77 | 0.66** | 0.57, 0.78 | 0.70** | 0.60, 0.82 | |||
| Time | 0.96 | 0.92, 1.00 | 0.96 | 0.92, 1.00 | 0.95** | 0.93, 0.98 | |||
| Purpose × Time | 1.01 | 0.98, 1.03 | 1.01 | 0.98, 1.03 | 1.00 | 0.98, 1.03 | |||
Notes: CES-D = 10-item modified version of the Center for Epidemiological Studies—Depression scale; CI = confidence interval; global summary = global parkinsonian summary score; OR = odds ratio. Model 1: adjusts for baseline age, sex, race, education, and marital status. Model 2: Model 1 + further adjusts for baseline health conditions and CES-D score. Model 3: Model 2 + further adjusts for BMI, alcohol consumption, and smoking.
*p < .05. **p < .01.
Purpose in Life With Levels and Changes in Parkinsonian Domain Scores Over Time
Parkinsonian gait and bradykinesia increased by 0.18 and 0.08 per year, respectively (Time, Table 3, Model 3). For tremor and rigidity, a 1-year increase in time was associated with 1.04 and 0.95 times the odds of having any versus no signs, respectively (Time, Table 3, Model 3). In all models, higher sense of purpose was associated with lower domain scores at baseline across domains. For example, after including demographics, health conditions, and health behaviors in the model, a 1-SD increase in purpose in life was associated with 0.25 (95% CI −0.33, −0.17) point lower parkinsonian gait score and 0.21 (95% CI −0.28, −0.13) point lower bradykinesia score. For tremor and rigidity, a 1-SD increase in purpose was associated with 0.79 times (95% CI 0.71, 0.88) and 0.70 times (95% CI 0.60, 0.82) the odds of having any versus no signs, respectively. No associations of purpose with rate of change were evident for any of the domain scores (Purpose × Time, Table 3, Model 3).
Sensitivity Analyses
Findings were similar after excluding those reporting three or more depressive symptoms at baseline (Supplementary Tables S1 and S2). Findings were also similar after excluding those categorized as “Other” for race (Supplementary Table S3). When evaluating associations separately by race for White and Black individuals, mean baseline scores for the global summary score and the four domain scores were higher for White individuals compared to Black individuals, likely due to difference in the age range in the two groups (mean age was 80.3 for White individuals and 73.5 for Black individuals). The associations between purpose in life and the scores were generally similar across race, although the association between purpose and incident parkinsonism was not evident in Black individuals likely due to the smaller sample size and the younger age range in this subsample (Supplementary Tables S4 and S5). We also found no interaction between purpose in life and sex (all p values for interactions >.05) in any model.
Discussion
In a sample of older adults, having a higher sense of purpose was associated with lower hazards of developing parkinsonism. A higher sense of purpose in life was also associated with a lower baseline global parkinsonian summary score but not the rate of change in this score over an average of 7.3 years of follow-up. Considering specific domains, baseline associations with purpose were evident in all domains, but we found no associations with rate of change in these scores over time. Notably, these associations were observed even after adjusting for a broad range of potential confounders including baseline sociodemographic factors, health conditions, and health behaviors. Associations were also robust to adjustment for depressive symptoms, suggesting that purpose in life may confer benefits beyond the absence of depression. Although further work is needed to explore potential mechanisms, these findings suggest purpose in life may confer resilience to progressive parkinsonism by contributing to a slower rate of motor decline.
Our findings extend previous work finding an association between purpose in life and physical functioning assessed more generally in later life. For example, a study using data from MAP found that a higher sense of purpose was associated with reduced risk of self-reported measures of disability including basic activities of daily living, instrumental activities of daily living, and mobility disability (i.e., walking up and down a flight of stairs, walking half a mile, and doing heavy housework; Boyle et al., 2010b). In contrast to self-reported measures of disability that could be influenced by a range of factors including physical, cognitive, and psychological functioning as well as living environments, the present study focused on parkinsonian signs, a particular phenotype of motor functioning that is evaluated by a clinician using a measure demonstrated to have high validity and reliability. Further, in the current study, these relationships were generally evident in both White and Black older adults although associations were somewhat weaker in Black individuals.
We investigated links between purpose in life and the separate domains of parkinsonism in addition to the global summary score to allow for more meaningful comparisons of findings across studies. Because parkinsonism has been defined and evaluated in various ways, comparisons across studies assessing parkinsonism can be difficult and content of the measures may vary (Buchanan et al., 2021). For example, MAP and MARS operationalize parkinsonism using a 26-item modified version of the Unified Parkinson’s Disease Rating Scale (UPDRS) Part III (motor scale; UPDRS-III). This modified measure includes a subset of items from the UPDRS and adds an additional item that assesses the capacity to turn 360 degrees (Bennett et al., 1997; Buchman et al., 2016). In comparison, the Washington Heights-Inwood Columbia Aging Project operationalizes parkinsonism using 10 items from the UPDRS and excludes several features that are core features of PD, such as limb bradykinesia and gait (Louis et al., 2003). Considering specific domains permits comparisons with studies that may have measured some but not all domains included in the UPDRS.
Our findings suggested that higher levels of purpose in life are associated with lower incidence of parkinsonism over time. Furthermore, although we found associations of purpose with the global parkinsonian summary score and the domain-specific scores at baseline (i.e., those with higher purpose had healthier global summary and domain scores), we did not find evidence that purpose is associated with rate of change in these scores. This could suggest that purpose in life plays a more significant role in preventing the more extreme end of the distribution of parkinsonian signs, rather than providing benefits across the entire distribution. These findings are also consistent with the possibility that the association between purpose in life and parkinsonism is also bidirectional where parkinsonism may in turn influence one’s sense of purpose in life. Future research should investigate this further to understand the role of purpose in life on the progression and manifestation of parkinsonism.
The etiology of parkinsonism is heterogeneous, suggesting that the mechanisms underlying the link between purpose in life and parkinsonism may vary depending on the etiology of parkinsonism. However, as many of the risk factors and pathologies of diseases causing parkinsonism are shared, the mechanisms proposed to underly the link between psychological well-being and various health outcomes may apply to parkinsonism as well. These include pathways through health behaviors, neurobiological processes, and psychosocial resources (Kubzansky et al., 2018). Evidence from longitudinal studies suggest that those with higher sense of purpose in life are more likely to engage in healthier behaviors like staying more physically active (Kim et al., 2020) and having better sleep (Kim et al., 2015; Steptoe et al., 2008). Healthy levels of physical activity, diet, and sleep have also been associated with lower levels of parkinsonism (Agarwal et al., 2018, 2022; Kishi et al., 2020; Oveisgharan et al., 2020; Santos et al., 2018; Uemura et al., 2011). Therefore, having a higher sense of purpose in life may increase the likelihood of engaging in healthier behaviors that reduce the risk and progression of parkinsonism. Neurobiological processes may include atherosclerotic or metabolic changes. For example, a higher sense of purpose in life has been associated with better cardiovascular health (Cohen et al., 2016). Given prior studies suggest that vascular risk factors including diabetes, heart disease, higher BMI, and stroke are associated with parkinsonism (Buchanan et al., 2021), it is possible that these conditions could lie on the pathway linking purpose to risk of parkinsonism. Studies also suggest purpose in life may modify the effect of brain pathologies, including Alzheimer’s disease (AD) pathologic changes (e.g., tau tangles in nerve cells; Boyle et al., 2012). In these studies, individuals with higher versus lower purpose levels showed better cognitive function despite the existence of AD pathologic changes. Such modifying effects of purpose may also be relevant for pathologies related to parkinsonism. Prior work has also identified genes and proteins as resilience factors for parkinsonism (Buchman et al., 2023). Future work should investigate these factors further to explore biological mechanisms linking purpose in life and parkinsonism.
This study has several limitations. As the MAP and MARS cohorts had different age distributions, we were not able to test formally for interaction by race. However, the sample had a good representation of Black individuals with a larger proportion of Black individuals compared to other epidemiologic cohorts (32% of the sample were Black men and women). We were unable to assess the associations for purpose and parkinsonism separated by the different etiologies for parkinsonism. Future studies can investigate if differences are seen depending on the etiology of parkinsonism. This study also has several strengths. Parkinsonism was assessed repeatedly over time by trained nurse clinicians using a measure that closely correspond to evaluations by neurologists with expertise in movement disorders (Bennett et al., 1997). This allowed for a longitudinal assessment of parkinsonism over time with high reliability and validity. Also, we considered a broad range of covariates including depressive symptoms and health conditions at baseline that could be confounders for the association between sense of purpose in life and parkinsonism.
In conclusion, we found that higher sense of purpose in life was associated with lower parkinsonian scores at baseline and longer time free of developing parkinsonism in older individuals. Although more work is needed to investigate whether purpose causally contributes to parkinsonism, the associations observed in this study were present even after adjusting for a wide range of potential confounders (Breitbart et al., 2015). Evidence from randomized controlled trials suggests the modifiability of purpose and meaning in life (van der Spek et al., 2017). Future research can investigate whether modifying levels of purpose in life will directly translate to changes in parkinsonism. As parkinsonism is highly prevalent and is associated with a wide range of health outcomes, investigating its association with modifiable factors like purpose in life may help inform future interventions for healthy aging.
Funding
This work was supported by the Lee Kum Sheung Center for Health and Happiness Dissertation Research Award to H. K. Koga. The funding sources did not play directive roles in the study design, conduct, and reporting.
Conflict of Interest
None.
Data Availability
Data used in this study are available upon request via the RADC research resource sharing hub (https://www.radc.rush.edu/). R code used in the analysis is available from H. K. Koga upon request. This study was not preregistered.
Author Contributions
All authors contributed to the conceptualization and design of the study. H. K. Koga and L. D. Kubzansky led the data analyses and the drafting of the manuscript. All authors provided feedback and revised the manuscript.
Acknowledgments
We thank all the participants in the Rush Memory and Aging Project and Minority Aging Research Study, as well as the staff of the Rush Alzheimer’s Disease Center.

