


Abstract
Participation in the Supplemental Nutrition Assistance Program (SNAP) among eligible adults aged 60 and older is much lower than among the younger population, and rates continue to decline throughout the life course while at the same time the risk of cognitive impairment increases. Due to the high administrative burden associated with SNAP application processes, cognitive impairment may be associated with low uptake of SNAP among the low-income older adult population, particularly among more socially disadvantaged groups (females, Blacks, and those living alone). We provide new evidence that changes in cognitive functioning are associated with reductions in the probability of SNAP take-up among eligible older adults.
Using panel data from the Health and Retirement Study, we estimate linear probability fixed-effects models to assess the effect of cognitive decline on the likelihood of SNAP participation among eligible adults aged 60 and older, controlling for observed characteristics that change over time as well as individual, time, and state fixed effects.
Reduced levels of cognitive functioning that rise to the classification of dementia were strongly associated with reductions in the probability of SNAP take-up among eligible older adults. Results were particularly salient for females and those living alone.
One barrier to SNAP take-up among older adults may be cognitive impairment with the size of effect differing by gender and living arrangement. Policymakers may want to consider initiatives to increase SNAP participation among older adults, including a focus on further simplification of eligibility and recertification processes that reduce administrative burden.
Due to limited financial resources and declining health and mobility, food insecurity for older adults is a significant social problem (Ziliak & Gundersen, 2021) with a wide array of adverse health outcomes (Afulani et al., 2015; Gundersen & Ziliak, 2021; Heflin, Altman, et al., 2019). The Supplemental Nutrition Assistance Program (SNAP), the nation’s largest domestic food and nutrition assistance program, provides monthly benefits to eligible low-income households to purchase food items at authorized retailers. However, the take-up rate in SNAP among eligible adults aged 60 and older is much lower than that of the general population: 48% compared to 86% overall in 2018 (Lauffer & Vigil, 2021). Furthermore, SNAP take-up among older adults continues to decline as age increases (Braun et al., 2017). One potential factor that has remained largely unexplored to date is the role that cognitive decline may play in low SNAP take-up.
Nonparticipation in SNAP among older adults is often attributed to the difficulty experienced complying with the application processes, termed administrative burden, although some authors also suggest that attitudes related to one’s independence, social stigma, and the perceived low value of the benefits may also play a factor (Alba, 2018; Haider et al., 2003; Meyer & Abdul-Malak, 2020; Pinard et al., 2017). Generally, means-tested programs (those whose eligibility is limited by household income), such as SNAP, have more complicated application processes and frequent recertification periods required for participation relative to programs that are universally available, such as the Social Security Program (Herd, 2015). Older adults with cognitive limitations may find it particularly difficult to comply with the administrative requirements within the short time frames necessary to remain on the program.
In this study, we focus on SNAP participation of low-income older adults aged 60 and older and the role of cognitive impairment among different groups. Specifically, we explore the hypothesis that cognitive impairment may decrease SNAP participation among eligible older adults, both with and without controlling for household-level food security status. We also explore the extent to which cognitive ability may differentially be associated with SNAP participation for individuals based on gender, race, and household living arrangement.
Among the full population, receipt of SNAP benefits reduced the likelihood of being classified as food insecure (Hoynes et al., 2016) or poor (Meyer & Wu, 2018), while improving health status (Gregory & Deb, 2015; Heflin, Ingram, et al., 2019; Miller & Morrissey, 2017) and increasing food expenditures (Hoynes & Schanzenbach, 2016; Hoynes et al., 2016). Improved SNAP participation rates are especially important for low-income older adults facing cognitive decline given the strong association between food insecurity and cognitive functioning among older adults (Frith & Loprinzi, 2018; Gundersen & Ziliak, 2021; Portela-Parra & Leung, 2019). For example, Gundersen and Ziliak (2021) report that the prevalence of dementia is 14 percentage points (or 227%) higher among food insecure older adults (25%) than among their food secure counterparts (11%; Gundersen & Ziliak, 2021). Food insecurity is also associated with a wide range of modifiable risk factors for cognitive decline, such as diabetes, depression, functional limitation, hypertension, congestive heart failure, and lack of social support (Afulani et al., 2015; Gundersen & Ziliak, 2021). However, SNAP cannot adequately address food insecurity among the older population if barriers exist to program enrollment. Further, if low take-up of SNAP among older adults is partially related to the cognitive abilities of those eligible, typical outreach efforts used for other populations may be insufficient to effectively extend the program’s benefits to this vulnerable group.
Cognitive Impairment and SNAP Administrative Burdens
Cognitive impairment, which is also called “cognitive decline,” is a broad term that refers to a problem or difficulty with one’s memory, thinking, and other functions of the conscious brain, beyond what might be expected due to normal “cognitive aging.” Though the greatest known risk factor for dementia is increasing age, it is not a normal part of aging (Alzheimer’s Association, 2022). Dementia is a general term for a decline in mental ability severe enough to interfere with daily life, with Alzheimer’s disease (AD) as the most common cause (Alzheimer’s Association, 2022). Dementia is characterized by a noticeable decline in memory, language, and thinking capacity that impairs a person’s ability to perform daily tasks and interpersonal interactions. People with dementia often lose their ability for problem-solving and emotional control and may go through personality changes and have behavioral issues, such as agitation, delusions, and hallucinations (Dementia Society of America, 2022).
About 6.07 million American adults aged 65 years and older had dementia in 2020 and this number is estimated to grow to 13.85 million in 2060 (Rajan et al., 2021). Almost two-thirds of Americans with dementia are women (Rajan et al., 2021). Non-White older adults and those with the most unfavorable socioeconomic conditions face a higher risk of both cognitive impairment and food insecurity relative to their White, more education, and higher-income peers (Casanova et al., 2020; Farina et al., 2020; Heflin, Altman, et al., 2019). For example, Garcia et al. (2019) reported that the number of years spent living with dementia for White and Black women was 1.6 and 3.9 years, respectively, while White men lived 1.1 years with dementia compared to 3.1 years for Black men. Further, Garcia et al. (2021) found that White respondents lived a greater percentage of their remaining lives cognitively healthy than their minority Black or Hispanic counterparts, regardless of the level of education.
In terms of living arrangements, individuals with dementia living in the community are more likely than older adults without dementia to rely on multiple unpaid caregivers, such as family members. In 2018, among those with dementia who live in the community, 74% live with someone and the remaining 26% live alone (Alzheimer’s Association, 2022). Living alone, perceived social support, and loneliness were associated with a greater risk of cognitive difficulty (Judith et al., 2017).
In this study, we view SNAP participation through a public management administrative burden theoretical lens to guide our understanding of individuals’ experiences in accessing SNAP benefits (Herd, 2015; Herd & Moynihan, 2018). Applying for SNAP benefits either requires submitting a paper application by mail or in-person, or in states with more modernized application systems, using a computerized interface to apply online. Many cognitively normal adults find paper applications confusing and applying in-person requires transportation and good enough health to last through what might be a long day, as well as the cognitive ability to quickly respond to complicated, detailed, and personal questions about household income and expenses. Applying online requires access to a computerized device and knowledge about how to navigate the SNAP website to access the necessary program information, no small task for someone with cognitive decline. The administrative burden associated with receiving SNAP benefits is likely to pose a barrier to older adults with cognitive limitations due to the reduced capacity associated with the condition in the areas of memory, language, and interpersonal skills. Thus, we hypothesize (H1) that among adults aged 60 and older who are eligible for SNAP, those with cognitive impairment are significantly less likely to participate in SNAP than their cognitively normal counterparts, even after accounting for food insecurity status.
Disparity in Needs for Food Assistance Among Older Adults
Another guiding theoretical perspective of this study is the social positioning of material hardship, which suggests that the risk of material hardship, including food insecurity, is related to the demographic and social position (Heflin, 2016, 2017). Patterns found among the general population are also present among older adults: the risk of food insecurity is higher for women than men, for racial minorities than for Whites, and varies substantially by household living arrangement (Coleman-Jensen et al., 2021; Ziliak & Gundersen, 2021). In 2019, about 62% of SNAP participants aged 60 and older were female. Further, among female participants, 72% of those between the ages of 51 and 70 live alone, and 84% over the age of 70 live alone (Cronquist, 2021). While SNAP participation rates tend to be higher among older adults who are Black, and living alone, take-up rates for these groups still lag those of younger populations and administrative burden is thought to have differential impacts by race, and gender in social programs enrollment (Herd & Moynihan, 2018).
We conceptualized the gender and race differences in the impact of administrative burden as well as the risk of cognitive decline as potentially leading to more difficulty navigating the SNAP application process. Those female, minorities, and poor older adults who have cognitive impairments are the least advantaged and have more needs for SNAP benefits. However, these groups may have more difficulty completing the SNAP application process due to their fewer resources to manage and overcome the administrative burden. Thus, we expect that gender and race moderate the association between cognitive impairment and SNAP enrollment. We hypothesize (H2) that among eligible older adults, the probability of SNAP take-up will be more negatively affected by cognitive impairment for females than males. We further hypothesize (H3) that among those eligible for SNAP, the probability of SNAP take-up will be more negatively affected by cognitive impairments for Black older adults than White older adults.
Finally, to the extent that older adults must navigate the SNAP application process without the assistance of companions, family, or a social support network, social isolation can limit older adults’ access to social programs and services, such as SNAP. Studies show that living alone is associated with higher levels of food insecurity among older adults (Burris et al., 2019; Vilar-Compte et al., 2017); thus, the need for SNAP benefits for older adults living alone may be higher than those living with others. However, given the gap in SNAP participation among eligible older adults, it is possible that cognitive impairment poses a more significant barrier to overcoming the administrative burden associated with the SNAP application process for those living alone, given their lower levels of social support resources. Thus, we hypothesize (H4) that relative to their counterparts living with others, the presence of cognitive impairment is associated with lower odds of participation among the SNAP-eligible older adults who live alone.
Method
Sample
We use eight waves of nationally representative and longitudinal survey data between 2002 and 2016 from the Health and Retirement Study (HRS), which surveys Americans over the age of 50 every 2 years. Given that state policies and economic conditions can lead to changes in the likelihood of SNAP take-up (Eslami, 2015), we link the HRS public-use data with the restricted-access geographic identifier file, which allows the use of state information to estimate SNAP eligibility status and the inclusion of state fixed effects in our models (Health and Retirement Study, 2019).
Analytic Sample
The evolution of the analytic sample began with 10,945 survey respondents who were 60 years or older, who were estimated to be eligible for SNAP, were not institutionalized, and for whom we have a measure of cognitive ability through self-rating or proxy rating. Then we delete 149 respondents (1.4%) who have missing values on food insecurity or race. To use the individual-level fixed-effects model, the same individual must be observed multiple times across the panels. Thus, we furtherly omitted 4,302 respondents (39.8%) who contributed to the observations only once across the 2002, 2004, 2006, 2008, 2010, 2012, 2014, and 2016 surveys. These restrictions result in a sample of 6,494 unique individuals and 23,121 person-year observations for the fixed-effect analysis. We limit our sample to those 60 years and older because the federal SNAP program has special and more generous rules for households with older or disabled members. Among the analytic samples, the estimated SNAP eligibility rates are much higher within cognitively impaired subgroups (42.3% among cognitive impairment but no dementia subgroup, i.e., CIND, and 55.7% among dementia subgroup) than in their cognitively normal counterparts (19.1%).
Measures
The dependent variable is dichotomous and has a value of 1 if a person received SNAP benefits at any time in the past 2 years and a value of 0 otherwise. SNAP take-up means SNAP participation among those estimated to be eligible. By linking the HRS Geographic State Restricted data with public HRS data, we estimate SNAP eligibility at the household level by using detailed individual and family information in addition to state of residence. Our calculation of each household’s estimated eligibility in each state and year is based on both federal rules and state policy options related to eligibility. In estimating SNAP eligibility, we account for net household income tests, assets tests, and categorical eligibility and incorporate time-variant state-level policies. A full account of this estimation process can be found in Supplementary A.
Our focal independent variable cognitive impairment has three levels and is categorized as cognitively normal, CIND, or dementia based on the Weir–Langa Classifications with cognitive normal as reference (Crimmins et al., 2011). The Weir–Langa Classifications employs a 27-point Telephone Interview for Cognitive Status (TICS) scale by summing immediate and delayed word recall, a serial subtraction test, and a backward counting test. On the basis of the clinically estimated prevalence of these statuses, three cut points were established for respondents: dementia (score of 0–6), CIND (score of 7–11), and normal (score of 12–27; Crimmins et al., 2011). Respondents who were unable to take part in the TICS tests due to health reasons had their cognitive status assessed via three proxy assessment questions on proxy assessment of memory (0–4 points), sum of five instrumental activities of daily living (IADL) limitations (0–5 points), and the interviewer assessment of cognitive impairment (0–2). Using this 11-point scale, the Weir–Langa Classifications determines three cognitive statuses for proxied respondents: dementia (score of 6–11), CIND (score of 3–5), and normal (score of 0–2; Crimmins et al., 2011). Two important features of the Weir–Langa Classifications are that it includes proxy respondents, and it makes use of imputed information for the HRS cognitive measures. The HRS makes use of proxy respondents to reduce sample attrition in cases where the respondent is unavailable, unable, or unwilling to do the interview. The lack of inclusion of HRS proxy respondents has been identified as an important source of bias in assessing secular trends in cognitive functioning. The two features are essential to ensure coverage of those with cognitive impairments (Kenneth et al., 2008).
Covariates
Demographic covariates included in our analysis are age, gender (male or female), race, family size (range 1–15), and marital status (0 = unmarried, 1 = married). Age is measured as two dichotomous variables indicating whether respondents are aged 70–79, or aged 80 and up, with 60–69 years old as reference. Race corresponds to whether the respondent is identified as a White, Black, or other race. The dichotomous variable food insecurity has a value of 1 if a respondent reported a negative response to the question of whether they have always had enough money to buy the food they need over the past 2 years. Living alone is defined based on the number of residents in the household (1 = one resident; 0 = otherwise). Activities of daily living (ADL) is calculated as the sum of five items reflecting difficulties in bathing, dressing, eating, in or out of bed, and walking across room. Instrumental activities of daily living (IADL) is calculated as the sum of five items reflecting difficulties in making phone calls, managing money, taking medications, shopping, and cooking meals. Family income, assets, and individual’s annual out-of-pocket medical expenses are all measured using the natural log values. Moreover, we controlled for important individual characteristics of insurance and program coverage and social assistance receipt status, which may influence individuals’ chances of SNAP enrollment. These variables include Supplemental Security Income (SSI) or Social Security Disability Insurance (SSDI) receipt (0 = no, 1 = yes), Social Security receipt (0 = no, 1 = yes), and Meals-on-wheels availability (0 = no, 1 = yes). Health insurance coverage is also measured dichotomously indicating if the respondents are covered by any health insurance programs including Medicare, Medicaid, Veterans Affairs health insurance, private health insurance, long-term insurance, or other health insurance. Proxy status is measured as a dummy variable with 1 meaning the survey was answered by a proxy, and 0 meaning self-report. We used the 2003 Beale Rural–Urban Continuum Codes to categorize HRS respondents as living in an urban or rural area (Health and Retirement Study, 2019). Because we use individual fixed-effects models in this study (which eliminates individual-level time-invariant covariates), all individual-level covariates included in our model are time-varying. We split the sample by race, gender, and living arrangement to incorporate these indicators into our analysis.
Statistical Analysis
We exploit the longitudinal nature of the data set and estimate linear probability fixed-effects models to estimate the effect of a change in cognitive impairment overtime on the likelihood of SNAP take-up among eligible individuals. We include individual fixed effects using our panel data to control for individual differences in the underlying probability of SNAP take-up that remain constant over time, such as feelings of stigma regarding receipt of social welfare programs or general attitudes toward the welfare state. We include state and year fixed effects to control for unmeasured aspects of the state that might impede or support SNAP participation (such as specific state policies governing eligibility and application requirements), as well as differences in those factors that might change over time.
We firstly estimate the main effects of cognitive impairment on SNAP take-up and then assess subgroup differences of these models by gender, race, and living arrangement separately.
where SNAPist (SNAP take-up), CINDist, Dementiaist, and FoodInsecist (food insecurity) are all dichotomous variables. Xist are time-varying covariates. θ s, δ i, and µ t are fixed effects for states, respondents, and time, respectively. Standard errors are clustered at the individual level. Given the endogeneity between food insecurity status and SNAP take-up, we estimate models both with and without controlling for food insecurity and present results for both models; results are robust to the inclusion of food security status. In results not shown, we further tested the hypothesis that food insecurity moderated the effects of cognitive impairment by including interaction terms between food insecurity and our two levels of impaired cognitive function. However, the interaction terms were not statistically significant in six out of the seven models that we estimated. We did find marginally significant results of a moderating effect of food insecurity on cognitive decline (both CIND and dementia) among males at the p < .10 level. Results are available upon request.
Results
Table 1 displays descriptive statistics for the full analytic sample (n = 23,121) and stratified by three levels of cognitive status (cognitively normal, CIND, and dementia). The analytic sample is limited to individuals aged 60 and older who are estimated to be eligible for SNAP. The SNAP take-up rate and food insecurity rate among the analytic sample are 28.1% and 17.4%, respectively. The majority of the analytic sample is aged 60–69, female, unmarried, residing with others, White, does not respond via proxy to the survey, does not receive SSI or SSDI benefits, lacks access to Meals-on-wheels, receives Social Security benefits, has health insurance coverage, and resides in a county classified as urban.
Descriptive Statistics of the Analytic Sample by Cognitive Status Using HRS Data Between 2002 and 2016
| All | Cognitively normal | CIND | Dementia | p Value | |
|---|---|---|---|---|---|
| SNAP and food insecurity | |||||
| SNAP take-up, % | 28.1 | 28.7 | 28.3 | 25.7 | .046 |
| Food insecurity, % | 17.4 | 16.7 | 18.7 | 17.2 | .000 |
| Individual characteristics | |||||
| Aged 60–69, % | 39.9 | 48.0 | 35.6 | 20.8 | .000 |
| Aged 70–79, % | 36.2 | 36.0 | 37.6 | 33.8 | .266 |
| Aged 80 and older, % | 24.0 | 16.0 | 26.8 | 45.3 | .000 |
| Female, % | 68.9 | 70.9 | 67.5 | 65.2 | .000 |
| Married, % | 30.8 | 31.8 | 31.2 | 26.5 | .000 |
| Living alone, % | 34.3 | 35.4 | 34.6 | 30.0 | .008 |
| Annual out-of-pocket medical expenses, $a | 1,654.1 | 1,723.7 | 1,577.8 | 1,575.4 | .000 |
| Race | |||||
| White, % | 60.7 | 68.1 | 54.3 | 48.7 | .000 |
| Black, % | 30.2 | 23.8 | 35.4 | 41.0 | .000 |
| Other, % | 9.1 | 8.1 | 10.3 | 10.3 | .000 |
| Physical functional limitations | |||||
| ADL, no. | 0.7 | 0.5 | 0.7 | 1.4 | .000 |
| IADL, no. | 0.6 | 0.3 | 0.6 | 1.8 | .000 |
| Proxy respondents, % | 7.4 | 3.1 | 6.3 | 24.8 | .000 |
| Household characteristics | |||||
| Family size, no. | 2.4 | 2.3 | 2.4 | 2.5 | .911 |
| Household income ($)b | 25,909.0 | 27,837.3 | 23,169.7 | 25,048.4 | .000 |
| Household total assets ($) | 85,115.3 | 109,556.6 | 61,833.5 | 50,096.8 | .000 |
| SSI or SSDI receipt, % | 17.5 | 14.7 | 19.4 | 23.0 | .000 |
| Social Security receipt, % | 75.2 | 72.4 | 76.8 | 81.6 | .000 |
| Any health insurance coverage, % | 93.2 | 92.1 | 93.9 | 95.7 | .000 |
| Meals-on-wheels available, % | 6.0 | 4.0 | 7.3 | 10.1 | .000 |
| Rural, % | 19.9 | 17.9 | 20.8 | 24.8 | .000 |
| Number of individual observations | 23,121 | 12,148 | 7,442 | 3,531 | |
| Number of unique respondents | 6,494 | 3,991 | 1,887 | 616 |
Notes: ADL = activities of daily living; IADL = instrumental activities of daily living; HRS = Health and Retirement Study; SNAP = Supplemental Nutrition Assistance Program; SSDI = Social Security Disability Insurance; SSI = Supplemental Security Income. Standard deviations are reported in parentheses. The analytic sample consists of survey respondents who are aged 60 or older, who were eligible for SNAP and were not institutionalized at the time of the survey, and for whom we have cognitive ability test scores through self-rating or proxy rating. Chi-square tests were used to compare distributions across three cognitive statuses. CIND indicates cognitive impairment but no dementia.
aOut-of-pocket medical expenses is the annual individual-level value indexed by the Consumer Price Index (CPI) to 2019.
bHousehold income is the annual value indexed by CPI to 2019.
Table 1 (columns 2–4) shows that relative to their cognitively normal counterparts, individuals who are classified as with CIND or with dementia are less likely to take up SNAP, be food insecure, older (aged 80 and older), males, unmarried, Black or of other race, recipients of SSI or SSDI, collecting Social Security benefits, covered by health insurance, Meals-on-wheels available, and rural residents. Nearly one-fourth (24.8%) of the sample with dementia used proxy respondents. On average, household income, liquid assets, and maximum out-of-pocket medical expenses (MOOP) are lower among those with either level of cognitive impairment than those categorized as cognitively normal. Sample members who had developed cognitive challenges reported more ADL and IADL.
Main Analyses
Panel A of Table 2 presents results from individual fixed-effects models for the full analytic sample in Model 1 unconditional on food security status. Models 2–7 separately assess subgroup differences by gender, race, and living arrangement. For each model, the reference category is cognitively normal. In the full sample shown in Model 1, among eligible SNAP respondents, a within-individual change in meeting the criteria for dementia is associated with a 3.3 percentage point reduction in SNAP take-up (p = .005). This finding confirms Hypothesis 1 that a change in cognitive status, particularly a classification of dementia status, is associated with a substantial reduction in SNAP take-up.
Estimated Effects of Cognitive Impairments on SNAP Take-Up Among Eligible Respondents Aged 60 and Older to the HRS Between 2002 and 2016
| All | Female | Male | White | Black | Live alone | Not live alone | |
|---|---|---|---|---|---|---|---|
| (1) | (2) | (3) | (4) | (5) | (6) | (7) | |
| A: Fixed-effects models—effects of cognitive impairments | |||||||
| CIND | −0.0001 (0.007) | −0.001 (0.009) | 0.008 (0.013) | −0.002 (0.009) | −0.010 (0.014) | −0.009 (0.012) | 0.004 (0.009) |
| Dementia | −0.033** (0.011) | −0.043**a (0.014) | −0.003a (0.020) | −0.039* (0.015) | −0.036 (0.019) | −0.063**a (0.020) | −0.012a (0.015) |
| Adjusted R2 | 0.494 | 0.504 | 0.474 | 0.534 | 0.436 | 0.563 | 0.477 |
| B: Fixed-effects models—effects of cognitive impairments controlling for food insecurity | |||||||
| CIND | −0.001 (0.007) | −0.002 (0.009) | 0.007 (0.013) | −0.002 (0.009) | −0.010 (0.014) | −0.010 (0.012) | 0.003 (0.009) |
| Dementia | −0.033** (0.011) | −0.043***a (0.014) | −0.004a (0.020) | −0.040* (0.015) | −0.035 (0.019) | −0.065***a (0.020) | −0.012a (0.015) |
| Food insecurity | 0.063*** (0.009) | 0.062*** (0.011) | 0.061*** (0.017) | 0.062*** (0.013) | 0.067*** (0.016) | 0.054** (0.018) | 0.071*** (0.012) |
| Adjusted R2 | 0.494 | 0.505 | 0.475 | 0.534 | 0.436 | 0.564 | 0.478 |
| State fixed effects | Y | Y | Y | Y | Y | Y | Y |
| Year fixed effects | Y | Y | Y | Y | Y | Y | Y |
| Number of observations | 23,121 | 15,939 | 7,182 | 14,035 | 6,974 | 7,237 | 14,543 |
| Number of respondents | 6,494 | 4,300 | 2,194 | 4,024 | 1,873 | 2,230 | 4,330 |
Notes: ADL = activities of daily living; IADL = instrumental activities of daily living; HRS = Health and Retirement Study; SNAP = Supplemental Nutrition Assistance Program; SSDI = Social Security Disability Insurance; SSI = Supplemental Security Income. CIND indicates cognitive impairment but no dementia. The reference category of cognitive status is cognitively normal. The table shows results based on individual fixed-effects models. Standard errors, clustered at the individual level, are provided in parentheses. All models included state and year fixed effects and controlled for age, marital status, rural or urban residence, household size, ADL, IADL, the natural log of income, the natural log of assets, the natural log of out-of-pocket medical expense, health insurance coverage, receipt of SSI or SSDI receipt, receipt of Social Security, Meals-on-wheels availability, and proxy status.
aThe coefficients between the corresponding two subgroups are significantly different at the p = .1 level. Full parameter estimates from the Panel A and B models are presented in Supplementary Tables 1 and 2, respectively.
*p < .05. **p < .01. ***p < .001.
In Panel A of Table 2, the coefficient on cognitive status and SNAP take-up differs by gender and living arrangement. The negative effects of dementia on SNAP take-up are statistically significant among subsamples of those eligible for SNAP who are female (−4.3 percentage points, p = .002) but are statistically zero for males (coefficients are statistically significant at the p < .10 level). This finding is consistent with Hypothesis 2 that females who face cognitive decline experienced greater reductions in SNAP participation relative to their male counterparts.
Among Whites, a within-person change in dementia status is associated with a reduction in SNAP take-up by 3.9 percentage points (p = .012). While this coefficient is statistically insignificant among Blacks, the magnitude of the coefficients on dementia is not significantly different between Whites and Blacks (based on an F-test) and so we cannot conclude that there are racial differences in the effects of dementia on SNAP take-up (the coefficients between the two groups are similar in size but the standard errors for the Black sample are larger, possibly as a result of the smaller sample size). This finding is inconsistent with our third hypothesis which suggested that Black older adults who experienced cognitive decline would face greater barriers to SNAP participation than their White counterparts.
In terms of living situation, a within-person change in dementia status has a large negative effect on SNAP take-up among those living alone (−6.3 percentage points; p = .001). This finding is consistent with our fourth hypothesis that cognitive decline would present a larger barrier to SNAP participation among those living alone relative to their older adult counterparts living in household arrangements that include other adults.
In all cases, we find a negative effect on SNAP take-up for dementia but not for lower levels of cognitive impairment (i.e., CIND), controlling for observed time-varying individual characteristics, state and year fixed effects, and unobserved time-invariant individual characteristics, such as previous connection to SNAP, stigma, or program knowledge. Overall, a change in dementia status among eligible older adults corresponds to a 12% decline in SNAP take-up for the full sample, a 15% reduction for females, and a 22% reduction for those living alone.
Next, we explore the sensitivity of our results to the inclusion of food insecurity directly in the model to examine the extent to which the relationship between dementia and SNAP take-up is being mediated by food insecurity (Panel B of Table 2). We find that the effects of cognitive impairments on SNAP take-up do not change. We interpret this pattern of results as indicating that the relationship between dementia and SNAP take-up observed in Panel A of Table 2 is consistent conditional on food insecurity. Full parameter estimates of the models in Panel A and Panel B of Table 2 are presented in Supplementary Tables 1 and 2.
In Figure 1, we illustrate the predicted probability of SNAP take-up from the Panel B models of Table 2 associated with a change in cognitive ability status. The figures indicate that among older adults, reductions in cognitive ability, particularly to the lowest level, are associated with reductions in SNAP take-up among those eligible, even after controlling for food security status, individual characteristics, and household characteristics. Figure 1 indicates that the predicted probability of SNAP take-up is lowest among the subgroup of older adults who have experienced the most cognitive decline across all groups. Further, the groups with the lowest predicted probability of SNAP take-up are older adults with a change in cognition functioning who are in the lowest cognition group and are female or living alone. This finding is consistent with our theoretical frame that cognitive decline may be a barrier to SNAP take-up due to the administrative burden associated with the application process and that there are differential effects by social position.
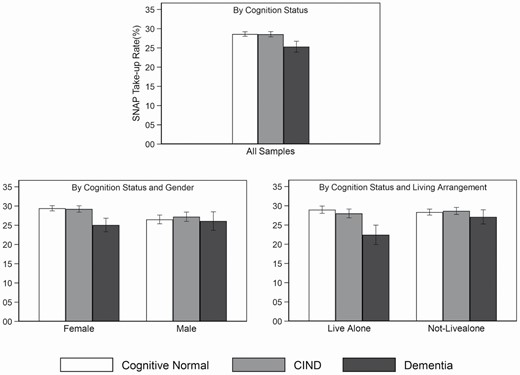
Predicted probability of SNAP take-up by cognition status, gender, and living arrangement among eligible older adults. Notes: The figure illustrates the predicted probability of SNAP participation from the fixed-effects models shown in Panel B of Table 2. CIND = cognitive impairment but no dementia; SNAP = Supplemental Nutrition Assistance Program.
Discussion
This study provides the first empirical evidence that cognitive decline is associated with lower SNAP take-up among older adults and that the effects differ by gender and living arrangement. Understanding how cognitive status affects SNAP take-up among eligible older adults contributes to evidence regarding the need for the development of appropriate interventions for addressing their food needs. Our estimation of SNAP take-up is based on the calculation of SNAP eligibility in which we consider both federal eligibility rules and state-level SNAP eligibility expansion rules. Thus, we contribute a more precise and reliable understanding of SNAP take-up.
The first hypothesis (H1) is supported. The effect of dementia is statistically significant and associated with a substantive difference in access to SNAP benefits among eligible older adults. As such, cognitive impairment may be an important explanation for the low participation rate of SNAP among older adults. We find that only a fraction of eligible older adults with dementia participated in SNAP (25.7% from Table 1), suggesting that administrative barriers may pose a barrier. Further, our findings align with past evidence that SNAP nonparticipation among adults of all ages is attributable to health characteristics and administrative hassles (Geiger et al., 2014; Meyerhoefer & Pylypchuk, 2014). Importantly, previous studies have also found that low cognition functioning is a consistent predictor of failure to take up Medicare supplemental coverage, Medicare Part D, and fully subsidized drug benefits among older Americans (Chan & Elbel, 2012; Kuye et al., 2016; McWilliams et al., 2011).
Our second hypothesis (H2) is also supported. After controlling for broad demographic, economic, and health characteristics such as marital status, household size, physical functional limitations, and income, we found that, among eligible older adults, dementia significantly affected SNAP take-up for females but not males. One possible explanation for this finding is that older aged women living in the community, especially those in lower socioeconomic groups, lack adequate care and social resources due to a lifetime accumulation of disadvantages (Goldberg, 2010). Women represent 70% of older adults living alone. Moreover, with longer life expectancies and typically married to older men, women often care for their husbands but, as widows, lack caregivers for themselves (Jung et al., 2017).
Our third hypothesis (H3) is that among eligible older adults, Black adults’ chance of SNAP participation will be more negatively affected by cognitive impairments than White adults. As seen in Panel B of Table 2, contrary to the third hypothesis, the coefficient of dementia on SNAP take-up is significant and negative among White adults but not among Black adults, although the size of the coefficient is very similar for both groups. Consequently, this finding may be a result of the lack of precision for the Black subgroup due to the smaller sample size. An alternative substantive explanation is that relative to Black older adults who may have faced cumulative disadvantage throughout the life course, White older adults may have experienced less need for SNAP benefits over their lifetimes and may be more easily discouraged from applying for SNAP benefits. This explanation is consistent with the literature that those potential welfare program beneficiaries who have less need place more weight on personal transaction costs (Alba, 2018). However, F-tests indicate that the difference in coefficients between Whites and Blacks are not statistically significant, so the existence of heterogeneity by race in the association between dementia and SNAP take-up is rejected.
In both Panels A and B in Table 2, the coefficients on dementia are significantly negative and statistically significant among those living alone but not among those living with others. Thus, the living arrangement hypothesis (H4) is supported, suggesting that barriers to SNAP may exist among eligible older adults with less social networks and with dementia. The result is consistent with the literature that older adults’ coping strategies for food insecurity were related to family networks and that having a partner in older adulthood can protect against food insecurity (Edin et al., 2013; Heflin, 2017).
Implications
For many years, the United States Department of Agriculture’s (USDA) Food and Nutrition Service has focused on simplifying administrative procedures, maintaining state flexibility, and expanding eligibility for federal food and nutrition programs (USDA, 2014). Among the general population, outreach efforts, clarity of information, and application assistance have been shown to lead to an almost 80% increase in SNAP applications relative to those who were informed they were eligible but given no special assistance (Herd & Moynihan, 2018). In USDA’s annual budget summary for the fiscal year 2017, administrative complexities associated with applying and recertifying for SNAP were indicated as an important factor causing lower participation rates among older individuals (USDA, 2016). Based on the success of several state demonstration projects, the budget proposed creating a state option to improve SNAP access for low-income older adults, with a $10 million funding increase in 2017 for the first year of implementation (USDA, 2016). Currently, at least six states are participating in the Elderly Simplified Application Projects, a USDA-sponsored demonstration project to offer a streamlined eligibility and application process for those aged 60 and older with no earned income. There is strong empirical evidence indicating that efforts to reduce learning and compliance costs associated with SNAP enrollment increase SNAP take-up (Levin et al., 2020). While this is a meaningful start, more action is needed. For example, Jones (2014) observed the difficulty older adults face in keeping track of and claiming the full amount of maximum out-of-pocket medical expenses (MOOP), which involves a high administrative burden and impedes SNAP accessibility for older adults. Under federal law, adults aged 60 and older (and those with disabilities) can deduct the out-of-pocket medical cost from total gross household income in the SNAP eligibility determination process. However, to do so, applicants must provide bills, receipts, and provider statements. The federal government allows states to adopt the Standard Medical Deduction, which allows states to use a standard medical deduction amount in the determination process for those able to show at least $35 per month of medical expenses. However, currently, only 21 states adopt this provision.
Our results are consistent with previous literature in that the administrative burdens are not distributed evenly throughout society (Christensen et al., 2020) and that people’s experience of administrative burdens (Chudnovsky & Peeters, 2021) vary in the case of SNAP enrollment. Our results suggest a priority focus for intervention among low-income older adults with dementia is on females and those living alone. Currently, about 29% of older adults live alone, with about twice as many older women living alone as men (Lloyd, 2017). In 2019, 83% of all SNAP households with older individuals were single-person households (Cronquist, 2021); SNAP application processes cannot assume that there are other adults around to help those facing cognitive decline navigate the application process.
As a community-based solution, health services and social workers provide an opportunity to link to other supportive in-home and community-based supports due to the potential that providers have in identifying older adults with cognitive decline or at risk of being food insecure (Vilar-Compte et al., 2017). For example, health care providers, Medicaid case workers, and social workers could be educated on the issue of cognitive impairment and SNAP eligibility processes for older adults and incorporate assessments of food insecurity and social support during their home visits.
Limitations
There are a number of limitations to this study. One drawback of the HRS is that household income is only available on an annual basis instead of the monthly measure that would be used at application. Because our analyses of SNAP take-up among eligible households relied upon an annual measure of eligibility and take-up, our analysis likely underestimates the number of respondents eligible due to within-year fluctuations in income.
Second, our SNAP eligibility classification status is prone to error because the calculation is based on the accuracy and availability of income, earnings, assets, and other related information. However, the rich financial information in the HRS allows us to assess eligibility more accurately than other commonly used data sets, such as the Current Population Survey, by accounting for specific deductions and the asset limit that are part of the SNAP eligibility guidelines.
Third, the HRS relies on self-reports of SNAP participation. Measurement error may occur if respondents underreport their participation and this may partially explain the relatively low SNAP take-up rate among older adults. Unfortunately, underreporting of SNAP receipts is a common problem in survey data. However, previous research has documented that the SNAP participation rates recorded by HRS match administrative records better than the rates reported by the Survey of Income and Program Participation and the Current Population Survey (Haider et al., 2003; Nicholas, 2011).
Conclusion
Our results suggest that cognitive decline may be a barrier to SNAP take-up among older adults, particularly for those who meet the criteria for dementia. Those older adults who are female and living alone are priority subgroups in need of intervention to reduce the administrative burden associated with the SNAP application process. Additional research is needed regarding the incidence of cognitive limitations and the administrative burden in the SNAP older population. A growing understanding of this challenge might focus on the role of cognitive biases taking advantage of the behavioral science approach. The advent of behavioral economics and specifically its translation into SNAP policy nudges has encouraged experimentation with tailored techniques to reduce those burdens (Levin et al., 2020; Lopoo et al., 2020), but much more remains to be done.
Acknowledgments
The reported study was not preregistered.
Funding
The development of the manuscript was partially supported by a grant from the Russell Sage Foundation (grant number 1905-15081) and by the Center for Aging and Policy Studies, funded by the National Institutes of Health NIA Center (grant number P30AG066583).
Conflict of Interest
None declared.
Author Contributions
D. Zuo proposed the project, analyzed the data, and drafted the manuscript. C. M. Heflin provided critical input to analytic approach, assisted with the interpretation of results, and critically reviewed and revised the manuscript. Both authors provided revisions and approved the final version of manuscript.
References

