


Abstract
We investigated whether there was a “high outmigration penalty” for psychological health among older adults in rural China by assessing 2 potential community stressors associated with major sociodemographic changes in the community—increased outmigration and older adult density. We also investigated whether disparities in community economic conditions moderated the association between community stressors and depressive symptoms.
We employed 3 waves of data from the China Health and Retirement Longitudinal Study (2011–2015), using multilevel negative binomial models to address our research questions.
Our results supported the “high outmigration penalty” hypothesis. Older adults living in low-income rural communities may experience an aggravated mental health penalty compared to those living in high-income rural communities. Higher older adult density was also associated with more depressive symptoms but only in less wealthy communities. Community differences in economic conditions were key factors buffering the high outmigration disadvantage associated with the psychological health of older Chinese adults.
Rural outmigration may have deepened existing intercommunity health disparities among older adults. Policies should be developed to address community-level factors negatively associated with the well-being of older Chinese adults living in high outmigration and less wealthy rural communities.
Massive rural–urban migration in China profoundly challenged the well-being of older adults who remained in rural areas. By 2018, there were 135 million rural–urban migrants in China, accounting for 17% of the labor force (China Census Bureau, 2020). An emerging literature examined the health implications of outmigration among younger adults for the well-being of rural older adults. For many rural older persons, assistance from adult children remains a primary source of old-age support. Older parents of young adult migrants who remained in rural areas are referred to in the scholarly literature as the “left-behind” older adults. The health of these “left-behind” older adults received considerable attention from researchers, as many experienced both a reduction in social support on the one hand and an increase in financial transfers from migrant children on the other hand (Cong & Silverstein, 2008; Song, 2017). Thus, both negative and positive consequences of adult children’s outmigration for rural older adults are documented (Ao et al., 2016; He et al., 2016; Wang et al., 2017).
Most published research about these issues is limited to investigating the consequences of population mobility from a family perspective, where migration is conceptualized as family behavior with health consequences for older adults. This family-based approach does not inform us about how individual-level migration behavior is related to the economic, structural, and compositional context of migrant sending communities. Older adults are particularly sensitive to the communities in which they live because they often have declining physical and cognitive capacities, tend to be less mobile, and are more dependent on local services, amenities, and community-based social support than younger persons (Kubzansky et al., 2005).
Depression in China has been rising and is currently at high levels among rural older adults. According to data from the 2011 China Health and Retirement Longitudinal Study (CHARLS), 46.9% of rural older adults were depressed, when compared with 40.9% of urban older adults. These rates are higher than depression rates in the United States (22.1%), England (19.4%), Japan (34.8%), Mexico (24.2%), and Indonesia (7.2%; Bojorquez-Chapela et al., 2012; Mahwati, 2017).
Large-scale outmigration from China’s rural communities changed the long-established sociodemographic landscape of these communities, altering the ways in which older adults experienced everyday life and engaged in social relationships. The purpose of this study was to investigate whether there was a “high outmigration penalty” associated with two types of community-level stressors related to older Chinese adults’ risk for depression—outmigration prevalence and older adult density.
Rural Communities in China
For many generations in rural China, extended family members lived near one another in the same village, where social networks and social support were based on family and local kinship ties (Hou, 2011). Historically, the departure of neighbors and extended family members in these close-knit communities was unprecedented. As these migrants were mostly young working-age adults, rural communities experienced a surge in the proportion of the local population that was aged. From 2000 to 2010, the proportion of persons 60 years and older in China’s rural communities rose from 11% to 15%, exceeding the change in the relative size of the age structure of China’s urban communities (9.7%–11.7%; Population Census Office under the State Council [PCOSC] and National Bureau of Statistics of China [NBSC], 2002, 2012). Rural older adults now live in communities with a greater density of people of their own age.
Migration-induced community transformations not only alter the community environment, but these factors also change the nature of social interactions, resulting in new community stressors. Community-level stressors represent a major risk factor for older adult depression (Moorman et al., 2017). Research is needed to help us better understand how community factors are related to depression among older adults in developing contexts, such as rural China. Older adults in Chinese rural communities have limited human capital and access to resources and support services. At the same time, they have a strong sense of attachment to the land and a cultural preference for residential stability. Chinese villages have traditionally been especially close-knit communities. Villages are the smallest administrative units in rural China and often function like an extended family. Historically, villagers were dependent on collectively owned land, and they developed a village-based group identity (Hou, 2011). Villages play a central role in the delivery of essential public services, such as schools, health care, and space for social interaction (Smith et al., 2013). Migration networks operate at the village level as well (Liang & Chunyu, 2013). Older rural Chinese adults are more immobile and often possess a greater sense of community than their urban counterparts, and thus, their well-being is strongly associated with sociodemographic changes related to high levels of outmigration.
The ambient stressors generated by high outmigration are not equally distributed across all rural communities. Economically advantaged rural communities provide more supportive services and facilities, fostering social cohesion, buffering negative effects of stressors, increasing resilience, and lowering the risk for depression (Li et al., 2016). Intervillage economic disparities increased at unprecedented levels over the past few decades (Zhang & Kanbur, 2009). In 2000, the Gini coefficient in rural China reached 0.50, higher than urban China at 0.32 (Liang, 2006). Intervillage disparities contributed to around 40% of this inequality (Wan & Zhou, 2005). Variability in a community’s capacity to buffer stressors resulting from high outmigration may further stratify the well-being of rural older Chinese adults.
The current study contributed to the scientific literature by providing insight into how social change brought about by rapid and persistent outmigration is associated with depression risk among rural older Chinese adults. We addressed three questions regarding depression among rural older Chinese: (a) Is community high outmigration associated with an increased number of depressive symptoms? (b) Is high older adult density associated with more depressive symptoms?, and (c) Do community economic conditions moderate the relationship between community-level outmigration and the number of depressive symptoms? We sought to understand if there is a “community disadvantage” for older Chinese adults living in poorer communities compared to those living in wealthier communities with respect to high outmigration and depression.
Outmigration and Depressive Symptoms
Research focusing on offspring outmigration and depression among older adults in rural China is typically limited to the family, yielding equivocal results. Some research shows the migration of offspring was related to reduced levels of intergenerational coresidence and reduced social and instrumental support from migrant children (Song & Chen, 2020). Household member’s outmigration was related to loneliness and less emotional cohesion between migrant and nonmigrant parents, leading to lower psychological well-being (Wang et al., 2017). Other research showed that older adults received more financial support from their migrant offspring, especially when they provided full-time care for the children of their migrant offspring. The intergenerational “time-for-money” exchange led to fewer depressive symptoms (Cong & Silverstein, 2008). Other researchers found that although intergenerational financial transfers may matter, family migration may not, as depression among rural Chinese older adults was associated with other factors, such as emotional closeness with children residing close to them (Lin & Chen, 2018). Nevertheless, we have little knowledge as to how community stressors associated with outmigration may matter to rural older adults.
Chinese rural villages are usually organized around lineage solidarity, sometimes called family clans, which are based on shared patrilineal ancestors and closely bonded groups (Tsai, 2007; Watson, 1982). Individuals within family clans usually reside within close geographic proximity to one another. Economic and political cooperation and social interactions frequently occur within these family clans (Xu &Yao, 2015). Social activities organized around village temples and churches also promoted community solidarity (Tsai, 2007). A large flow of outmigration may interfere with such solidarity, disrupting social bonds and support systems. In turn, this may create chronic stress for older adults. The reduction of social cohesion and social capital in rural communities increases the risk of depression for older adults living in rural China (Lu et al., 2019; Yip et al., 2007). The disruption of village solidarity may also reduce local official’s accountability and decrease the provision of public goods (Tsai, 2007), having repercussions for mental health.
Specifically, many rural young people regarded outmigration as a “rite of passage” (Hao, 2012). Consequently, a phenomenon known as “rural hollowing” has emerged—with younger migrants leaving villages, changing the age composition and physical environment, including increasing the number of dwellings neglected, damaged, or abandoned (Liu et al., 2010). This may be a factor that increases the risk of depression for rural older Chinese adults, who have been living in these communities for most, if not all, of their lives, having developed identities around and pride in their village communities. We hypothesize that:
Older Chinese adults living in rural communities where outmigration is higher have more depressive symptoms than older Chinese adults living in rural areas where outmigration is lower (H1).
Older Adult Density and Depressive Symptoms
Although there is little research about the relationship between older adult density and depression in rural communities, research based on urban areas shows neighborhood age composition may work in both positive and negative ways in terms of the risk of depressive symptoms for older adults. Socializing among older adults themselves may result in less ageism and better social cohesion (Hand & Howrey, 2019; Moorman et al., 2017). Conversely, communities with a higher concentration of young people provide opportunities for “generativity” among older adults. Generativity refers to concerns for and commitment to future generations, with the goal of improving the development and well-being of younger persons (McAdams & de St. Aubin, 1992). Communities with higher older adult density may experience reduced generativity, leading to deleterious effects on the emotional well-being of older adults.
Similar countervailing factors may apply in rural communities in China. For instance, ageism and age-related stereotypes in China, such as viewing older people as a burden to their families and society, may jeopardize older adult’s self-esteem and self-efficacy, leading to more depressive symptoms (Bai et al., 2016). Research based on qualitative interviews revealed that socializing with other older adults is an important factor for increasing resilience in old age in the Chinese culture (Lou & Ng, 2012). Moreover, having a greater concentration of older adults may encourage local leaders to distribute more resources geared toward the needs of older adults. Greater access to village amenities and health centers is associated with the improved psychological well-being of rural older Chinese adults (Li et al., 2015).
However, farming may be a major source of stress for some rural older adults (Ye et al., 2017). Shortages of farm labor attributed to outmigration and higher older adult density may further reduce older adults’ accessibility to needed local labor, introducing greater farming-related stress. Although the recent trend of land leasing may increase access to labor from outside the community (Zou et al., 2018), older adults’ land rental participation is conditioned by household resources and local nonfarm labor market development (Yao, 2000). Generativity toward younger generations was also found to be associated with meaning in life and helps improve old age quality of life in the Chinese culture (Hofer et al., 2014). Given the arguments for and against these effects and because the empirical findings regarding older adult density and older adult well-being are inconsistent, we do not offer a hypothesis.
The Buffering Effect of Community Economic Conditions
Community economic conditions are viewed as an important buffer for stressors emanating from individual and community-level factors. Compared to economically disadvantaged communities, wealthier communities provide resources, such as supportive services and opportunities for self-care. Wealthier communities also foster positive social ties and social cohesion, which help residents cope with stressors (Beard et al., 2009). By contrast, economically disadvantaged communities lack the resources necessary to form and maintain shared values, which may further deteriorate the capacity of residents to cope with ambient stressors (Kim, 2010).
In rural China, community economic infrastructure and resource provision play an important role in promoting psychological well-being among older adults (Li et al., 2016). Qualitative research reveals that rural older adults without a secure source of income and who experience little improvement in economic status over time report a greater sense of abandonment associated with cultural and social changes attributed to modernity. This has implications for older adults’ self-concept and general well-being (Chow & Bai, 2011). We expect lower self-concepts and more depressive symptoms are more common in economically disadvantaged communities. Because wealthier communities may have more developed nonfarm labor markets, households in these areas are more likely to lease their farmlands for agricultural production (Yao, 2000). Land leasing helps address on-farm labor shortages derived from outmigration and is related to increases in old age security among rural older Chinese adults (Zou et al., 2018). Living in a wealthier community, therefore, may help reduce older adults’ stress levels associated with outmigration through increased participation in land rental activities. Finally, village infrastructure improvements, such as the presence of waste management programs, access to tap water and indoor toilets, natural gas availability, and outdoor exercise facilities, help ameliorate the risk of depression (Li et al., 2015; Smith et al., 2013; Yeatts et al., 2014). In summary, better community economic conditions may buffer the negative effects of outmigration-induced community stressors that exacerbate the risk for depressive symptoms. Thus, we hypothesize that:
Higher outmigration is more detrimental for depressive symptoms for older Chinese adults residing in poorer rural communities than for their counterparts living in wealthier rural communities (H2).
Higher older adult density is more detrimental for depressive symptoms for older Chinese adults residing in poorer rural communities than for their counterparts living in wealthier rural communities (H3).
Method
Data Source
We utilized three waves of data from the CHARLS (2011, 2013, and 2015). The CHARLS was a large, nationally representative survey of Chinese adults aged 45 and older (Zhao et al., 2014). The CHARLS 2011 wave included a separate questionnaire for collecting information about communities. Representatives from village committee offices, usually local cadres, responded to this questionnaire. This questionnaire contained items about community characteristics, including demographic structure and composition, economic factors, local industries, community facilities, and community history. Individual and household characteristics, including household economic characteristics, household and family structure, and individual demographic characteristics along with health status, were collected in each wave. Some variables (e.g., depressive symptoms and household expenditures) were taken from the harmonized CHARLS data files (Beaumaster et al., 2018).
Response rates were high, especially among respondents living in rural communities, ranging from 91% to 94% across the waves (Song & Smith, 2019). We limited our sample to those aged 60 and older who were residing in rural communities at the time of the survey. Attrition in our study sample was 5.67% and 3.48% across waves. We excluded those who changed their address between waves (n = 325 and n = 254, respectively). The final study sample included 10,147 person-year observations with respondents residing in 235 rural communities (see Supplementary Figure 1 for a description of the sampling process).
Measures
Dependent variable
The CHARLS adopted a short version of the Center for Epidemiologic Studies—Depression scale (CES-D-10), modified for the Chinese context (Chen & Mui, 2014). Respondents were asked questions about how they felt and behaved during the previous week, including “I felt everything I did was an effort,” “I felt fearful,” and “My sleep was restless.” We assessed depressive symptoms by summing scores for the 10 items rated from 0 (rarely or none of the time) to 3 (most or all of the time; two positive items about feeling hopeful and happy were reverse coded). Higher scores indicated more depressive symptoms (range = 0–30).
Key independent variables
The number of outmigrants in each community was based on the following question: “What is the total number of people working outside of the village for more than 3 months in 2010?” A community outmigration ratio was calculated by dividing the number of outmigrants by the number of persons living in the community for more than 6 months. This measure was grouped into quartiles to capture potential nonlinearity.
Older adult density was obtained by dividing the number of adults aged 65 and older by the community population size. Community economic condition was a moderator, measured by per capita net income in 2010. Median community per capita net income was the threshold for defining low- and high-income communities. All variables were time-varying across the three waves except community characteristics, which were only available in 2011. We discuss and gauge the magnitude of possible biases derived from this data limitation in the Discussion section.
Control variables
Community-level variables included total population size (range = 60–9,650), whether the village experienced a natural disaster in the past 5 years (1 = yes), number of households engaged in nonagricultural work (per 1,000 households), and number of public facilities (1 = zero facilities, 2 = one to four facilities, and 3 = five or more facilities). Public facilities included a list of 13 types of amenities, such as basketball courts, swimming pools, outdoor exercise facilities, and table tennis tables, as well as community associations, such as dancing teams and activity centers for older adults. Respondent characteristics included age (range = 60–101), gender (1 = female and 0 = male), and education (1 = no formal education, 2 = some education to completed elementary school, and 3 = middle school and above). The number of activities of daily living limitations was a summation score regarding respondents’ difficulty with eating, bathing, dressing, and getting in and out of bed, where 1 = had difficulty or could not do the activity (range = 0–4). Chronic conditions included 14 health problems, such as hypertension, diabetes, cancer, and memory-related diseases. Social activities included whether in the previous month respondents participated in social clubs and other group activities (1 = yes), and whether respondents engaged in social activities on a daily basis (1 = yes).
Household characteristics included annual household expenditures (in yuan and recoded into quartiles), net intergenerational financial transfers (in yuan and transformed by the natural log), and family living arrangements. To account for the intersection of living arrangements and adult offspring’s migration status, we developed a mutually exclusive six-category family living arrangements–migrant status variable, where 1= lived alone with migrant children (reference group), 2 = lived alone without migrant children, 3 = lived with spouse and migrant children, 4 = lived with spouse without migrant children, 5 = lived in a two- or more-generation household with migrant children, and 6 = lived in a two- or more-generation household without migrant children. Finally, geographic region (1 = west [reference], 2 = east, and 3 = central) was included.
Analytic Strategy
Community outmigration ratios and older adult density were included in separate models. We employed three-level negative binomial regression models (Level 1 = survey year, Level 2 = respondents, and Level 3 = communities) to assess the main effects using Stata 16 (StataCorp). We estimated the potential moderating effects of community economic conditions by creating interaction terms with the community outmigration ratio and older adult density, respectively. We could not assume a normal distribution of error terms for a number of depressive symptoms because this was a count data variable with a negative binomial distribution (Hilbe, 2011). Thus, we employed negative binomial models. For the supplementary mediation analyses, we estimated models without and with mediators, comparing the coefficients across models. To take into account the potential bias associated with sample attrition, we used an inverse-weighted probability technique.
Results
Descriptive statistics are presented in Table 1. For the full sample, the prevalence of outmigration varied widely; the mean first quartile outmigration ratio was 0.04, whereas, in the last quartile, the ratio was 0.77. Furthermore, older adult density was higher in low-income communities (17.0%) than in high-income communities (16.0%). The mean per capita income for high-income communities was almost 4 times that of low-income communities (1,748 yuan vs. 6,700 yuan). High-income communities had more public facilities, with 25.0% having five or more of these amenities, whereas only 7.2% of the low-income communities had the same amount of amenities.
Descriptive Characteristics of Chinese Rural Older Adults, CHARLS 2011
| Full sample | High-income communities | Low-income communities | ||
|---|---|---|---|---|
| M/% (SD) | M/% (SD) | M/% (SD) | t or χ2 | |
| Community characteristics | N = 235 | n = 96 | n = 139 | |
| Outmigration prevalence ratioa | ||||
| First quartile | 0.04 (0.02) | 0.03 (0.02) | 0.03 (0.02) | |
| Second quartile | 0.13 (0.03) | 0.13 (0.03) | 0.13 (0.03) | |
| Third quartile | 0.27 (0.06) | 0.29 (0.07) | 0.29 (0.07) | |
| Fourth quartile | 0.76 (0.44) | 0.79 (0.52) | 0.79 (0.52) | |
| Older adults, % | 16.6 | 16.0 | 17.0 | |
| Community per capita income, ¥ | 3,839 (4,620) | 6,671 (5,939) | 1,748 (941) | *** |
| Total population | 2,048 (1,558) | 2,204 (1,536) | 1,941 (1,570) | |
| Number of public facilities, % | ||||
| 0 | 37.5 | 26.0 | 45.3 | ** |
| 1–4 | 48.12 | 49.0 | 47.5 | |
| ≥5 | 14.5 | 25.0 | 7.2 | *** |
| Natural disaster, % | 44.6 | 39.6 | 48.2 | |
| Households nonagricultural work | 114.87 (264.61) | 180.4 (345.06) | 68.9 (176.40) | ** |
| Region, % | ||||
| West | 63.8 | 69.7 | 59.7 | |
| East | 16.2 | 17.8 | 15.1 | |
| Central | 20.0 | 12.5 | 25.2 | * |
| Individual characteristics | N = 4,437 | n = 1,679 | n = 2,758 | |
| Depressive symptomsb | 9.97 (6.64) | 9.19 (6.17) | 10.50 (6.89) | *** |
| Age (in years) | 68.12 (6.73) | 68.34 (6.85) | 68.02 (6.66) | |
| Female, % | 48.5 | 48.6 | 48.6 | |
| Education,% | ||||
| No formal education | 43.7 | 41.6 | 45.0 | * |
| Some/elementary school | 46.0 | 48.8 | 44.2 | ** |
| Middle school and above | 10.3 | 9.6 | 10.8 | |
| ADL limitations | 0.33 (0.89) | 0.28 (0.79) | 0.40 (0.95) | *** |
| Chronic health conditionsc | 1.67 (1.47) | 1.64 (1.43) | 1.68 (1.50) | |
| Social participation, % | 14.7 | 18.5 | 12.3 | *** |
| Daily social interactions, % | 21.8 | 26.0 | 19.1 | *** |
| Household expenditures (¥) | 15,860 (17,944) | 16,788 (20,525) | 15,358 (16,330) | * |
| Net intergenerational transfers (¥) | 1,414 (8,502) | 1,755 (11,350) | 1,196 (5,999) | |
| Living arrangements, % | ||||
| Alone with MC | 4.1 | 4.4 | 4.5 | |
| Alone without MC | 6.0 | 6.7 | 5.5 | |
| With spouse with MC | 22.7 | 23.5 | 22.1 | |
| With spouse without MC | 18.7 | 21.8 | 16.8 | *** |
| Two- or multigeneration with MC | 25.1 | 19.6 | 28.7 | *** |
| Two- or multigeneration without MC | 23.2 | 24.1 | 22.6 |
Note: CHARLS = China Health and Retirement Longitudinal Study; ADL = activity of daily living, a sum score of four items coded as 0 = no problem with the activity and 1 = having difficulty with the activity or could not do the activity. MC = migrant child(ren).
aThe ratio of total outmigrants/total regular residential population in the community.
bSum score of 10 items rated at 0 = rarely or none of the time to 3 = most or all of the time.
cSum score of 14 physician-diagnosed diseases.
*p < .05, **p < .01, ***p < .001.
Compared to their counterparts in high-income rural communities, older Chinese adults living in low-income rural communities had more depressive symptoms, lower education, more physical limitations, and lower household expenditures. These respondents were less likely to participate in social clubs and other community amenities and less likely to engage in daily social interactions and activities than older adults in high-income communities. Older adults in high-income communities were more likely to live alone or with spouse only, without coresiding migrant offspring. Their counterparts in low-income communities were more likely to live in two-generation or multigeneration households with migrant children present.
The results for the association between outmigration prevalence and depressive symptoms and the moderation effects of community economic conditions are presented in Table 2 (see Supplementary Table 1 for a display of full model results). The results from Model 1 showed that respondents residing in high outmigration communities (fourth quartile) had more depressive symptoms (B = 0.12, p < .01) compared to respondents residing in low outmigration communities, confirming our first hypothesis.
Multilevel Negative Binomial Models for Community Outmigration Ratio for Depressive Symptoms Among Chinese Older Adults Living in Rural Communities
| Model 1 | Model 2 | Model 3 | Model 4 | |
|---|---|---|---|---|
| Full sample: Main effect model | Full sample: Interaction model | Low-income communities | High-income communities | |
| Variables | B (SE) | B (SE) | B (SE) | B (SE) |
| Fixed effects | ||||
| Intercept | 2.61*** (0.16) | 2.44*** (0.13) | 2.69*** (0.22) | 2.17*** (0.53) |
| Community characteristics | ||||
| Outmigration ratio | ||||
| First quartile | (ref) | (ref) | (ref) | (ref) |
| Second quartile | 0.03 (0.04) | 0.01 (0.05) | 0.02 (0.06) | 0.06 (0.05) |
| Third quartile | 0.04 (0.04) | 0.07 (0.05) | 0.08(0.05) | 0.01(0.06) |
| Fourth quartile | 0.12** (0.04) | 0.18*** (0.04) | 0.19*** (0.05) | 0.05 (0.06) |
| Community per capita income | −0.02 (0.01) | — | −0.02 (0.02) | 0.01 (0.05) |
| Low-income community | — | (ref) | — | — |
| High-income community | — | −0.01 (0.06) | — | — |
| Interactions | ||||
| High-income community × First quartile | — | (ref) | ||
| High-income community × Second quartile | — | 0.04 (0.08) | — | — |
| High-income community × Third quartile | — | −0.06 (0.08) | — | — |
| High-income community × Fourth quartile | — | −0.15* (0.08) | — | — |
| Total population | 0.01 (0.02) | 0.00 (0.01) | −0.00 (0.02) | 0.02 (0.02) |
| Number of public facilities | ||||
| 0 | (ref) | (ref) | (ref) | (ref) |
| 1–4 | −0.07* (0.03) | −0.05 (0.03) | −0.04 (0.04) | −0.09* (0.05) |
| ≥5 | −0.05 (0.04) | −0.04 (0.04) | −0.09 (0.07) | −0.04 (0.06) |
| Natural disaster | 0.06* (0.03) | 0.05 (0.03) | 0.03 (0.04) | 0.08* (0.04) |
| Households engaged in nonagricultural work | −0.04 (0.06) | −0.03 (0.05) | 0.01 (0.07) | −0.07 (0.07) |
| Region | ||||
| West | (ref) | (ref) | (ref) | (ref) |
| East | 0.04 (0.04) | 0.05 (0.04) | 0.05 (0.05) | 0.05 (0.05) |
| Central | 0.19*** (0.04) | 0.20*** (0.04) | 0.19*** (0.05) | 0.21*** (0.05) |
| Random effects | ||||
| Level 2 variance (participants) | 0.02*** (0.00) | 0.02*** (0.00) | 0.02*** (0.00) | 0.01*** (0.00) |
| Level 3 variance (communities) | 0.11*** (0.01) | 0.12*** (0.01) | 0.11*** (0.02) | 0.11*** (0.02) |
Notes: Person-years N = 10,147; community N = 235. Models controlled for individual characteristics are not shown in the table.
*p < .05, **p < .01, ***p < .001.
We conducted additional analyses to assess whether changes in income at the community or household level and changes in social participation and social interaction mediated the association between high outmigration and older adult depressive symptoms. A comparison of the results from these models (not shown) indicated that social interaction explained a small amount (2%) of the variation in depressive symptoms among respondents who lived in high outmigration communities.
The results from Model 2 showed a higher community outmigration disadvantage for older adults residing in poorer rural communities compared to their counterparts living in wealthier communities, supporting the second hypothesis. Figure 1 (based on results from Models 3 and 4) presented the predicted number of depressive symptoms by community outmigration quartile, stratified by community economic conditions. For respondents who lived in high-income communities, the number of depressive symptoms remained relatively stable across levels of outmigration; however, for respondents living in low-income communities, the number of depressive symptoms was greater in the highest community outmigration quartile.
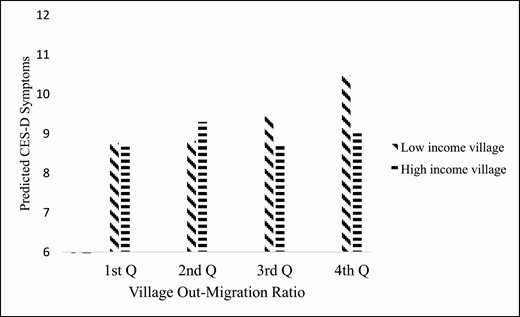
A predicted number of depressive symptoms of older adults by community outmigration prevalence ratio and community economic conditions in rural China, CHARLS 2011–2015. Note: Multilevel negative binomial model was adjusted for community-level characteristics (i.e., total population, natural disaster, households engaged in nonagricultural work, public facilities, and region) and individual-level characteristics (i.e., age, gender, education, ADL limitations, social club or community participation, daily social interactions, household expenditures, net intergenerational financial transfers, and living arrangements). CHARLS = China Health and Retirement Longitudinal Study; ADL = activity of daily living; CES-D = Center for Epidemiologic Studies—Depression scale.
The results for models examining whether community economic conditions moderated the relationship between older adult density and depressive symptoms are presented in Table 3 (see Supplementary Table 2 for a display of full model results). Results from the main effects model (Model 1) showed that older adult density was significantly related to more depressive symptoms (B = 0.20, p < .05). Furthermore, significant differences were discovered for high- and low-income communities. In low-income communities, an increase in older adult density was related to an increase in the number of depressive symptoms (B = 0.44, p = .004, Model 3), while in high-income communities, older adult density was not related to depressive symptoms (B = −0.02, p = .820, Model 4), providing support for the third hypothesis. Figure 2 (based on results from Models 3 and 4) showed that a number of predicted depressive symptoms for respondents living in high-income communities remained insensitive to older adult density. However, in low-income communities, the number of depressive symptoms increased as older adult density increased.
Multilevel Negative Binomial Models for Community Older Adult Density Predicting Depressive Symptoms Among Chinese Rural Older Adults
| Model 1 | Model 2 | Model 3 | Model 4 | |
|---|---|---|---|---|
| Full sample: Main effect model | Full sample: Interaction model | Low-income communities | High-income communities | |
| Variables | B (SE) | B (SE) | B (SE) | B (SE) |
| Fixed effects | ||||
| Intercept | 2.63*** (0.16) | 3.19*** (0.45) | 2.60*** (0.21) | 2.83*** (0.56) |
| Community characteristics | ||||
| Older adults (%) | 0.20* (0.10) | 0.44** (0.13) | 0.42** (0.14) | −0.02 (0.11) |
| Community per capita income | −0.02 (0.01) | −0.01 (0.02) | −0.00 (0.05) | |
| Low-income community | — | (ref) | — | — |
| High-income community | — | 0.02 (0.04) | — | — |
| Interaction | ||||
| High-income community × % older adults | — | −0.49** (0.16) | — | — |
| Total population | 0.01 (0.02) | 0.01 (0.02) | 0.00 (0.02) | 0.02 (0.02) |
| Number of public facilities | ||||
| 0 | (ref) | (ref) | (ref) | (ref) |
| 1–4 | −0.06 (0.03) | −0.05 (0.03) | −0.03 (0.04) | −0.09 (0.05) |
| ≥5 | −0.06 (0.04) | −0.05 (0.04) | −0.11 (0.07) | −0.03 (0.06) |
| Natural disaster | 0.06* (0.03) | 0.05* (0.03) | 0.04 (0.04) | 0.08 (0.05) |
| Households engaged in nonagricultural work | −0.05 (0.06) | −0.04 (0.04) | 0.05 (0.08) | −0.07 (0.06) |
| Region | ||||
| West | (ref) | (ref) | (ref) | (ref) |
| East | 0.03 (0.04) | 0.03 (0.04) | 0.01 (0.05) | 0.05 (0.05) |
| Central | 0.17*** (0.03) | 0.17*** (0.03) | 0.16*** (0.04) | 0.20*** (0.05) |
| Random effects | ||||
| Level 2 variance (participants) | 0.02*** (0.00) | 0.02*** (0.00) | 0.02*** (0.00) | 0.01*** (0.01) |
| Level 3 variance (communities) | 0.11*** (0.01) | 0.12*** (0.01) | 0.11*** (0.02) | 0.11*** (0.02) |
Notes: Person-years = 10,147; community N = 235. Models controlled for individual characteristics not shown in the table.
*p < .05, **p < .01, ***p < .001.
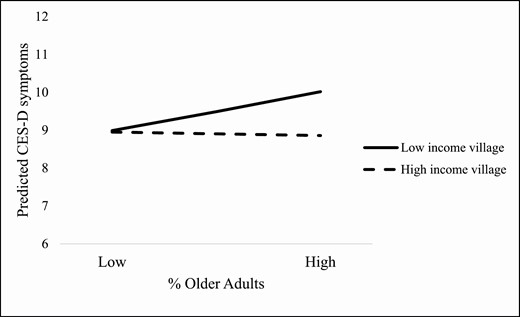
A predicted number of depressive symptoms of older adults by community older adult density and community economic conditions in rural China, CHARLS 2011–2015. Note: Multilevel negative binomial model was adjusted for community-level characteristics (i.e., total population, natural disaster, households engaged in nonagricultural work, public facilities, and region) and individual-level characteristics (i.e., age, gender, education, ADL limitations, social club or community participation, daily social interactions, household expenditures, net intergenerational financial transfers, and living arrangements). CHARLS = China Health and Retirement Longitudinal Study; ADL = activity of daily living; CES-D = Center for Epidemiologic Studies—Depression scale.
We explored whether additional community and respondent characteristics—community facilities and individual social interactions—accounted for the potential “community advantage” among respondents who lived in high-income communities when compared with their counterparts who lived in low-income communities. The results showed that disparities in community facility access accounted for 4% of the community advantage. However, there was almost no change in the coefficients for the interaction terms after excluding individual social interaction variables. This suggested that community public services and facilities may play a modest role in shaping community differences with respect to the high outmigration health disadvantages.
Discussion
This study provided support for a “high outmigration penalty” hypothesis in the rural Chinese context, calling attention to the potential consequences of community context for the well-being of older adults. The health consequences of being a “left-behind” older adult may be community-specific; these possible consequences may be particularly relevant to older adults living in high-outmigration rural communities, especially in less wealthy communities. Our analyses also showed that social support at individual and household levels did not result in a reduction of the association between community factors and depressive symptoms.
Our results supported theories that hypothesize detrimental effects of residential instability for older adults in rural areas of developing countries, where residential stability was the norm and where social networks were based on kinship structures and residential proximity. Specifically, we found older adults living in communities with the highest outmigration prevalence reported more depressive symptoms; we speculate these communities were likely to have a mature migration network in place, where young adults regarded outmigration as a “rite of passage” (Hao, 2012). The “hollowing” of high outmigration villages, characterized by reduced social cohesion and fewer young people, has become more prevalent in some Chinese rural communities (Liu et al., 2010). The sight of abandoned dwellings and the prospect of a village experiencing less social cohesion may be associated with more depressive symptoms among rural older Chinese adults, who often have a high commitment to the land and their home community. The reduction in the proportion of younger adults in the community may be especially detrimental for older adults who live in less wealthy rural communities, as the displacement of farm labor combined with underdeveloped land rental markets may elevate farming-related stress for older adults. In addition, older adults living in communities with an older age composition may lack opportunities for generativity, which in turn may introduce another layer of hopelessness and a sense of loss regarding their economically disadvantaged communities.
Our results suggested a potential role for intercommunity economic disparities in rural areas that buffered the high outmigration penalty shaping mental health stratification among rural older Chinese adults. In previous research (Liu et al., 2007), rural communities were treated as a homogeneous group that was economically disadvantaged and deprived in terms of access to health care, with limited resources needed to support an aging population. Scholarship regarding intercommunity differences in rural areas has mostly been restricted to investigating income inequality (Wan & Zhou, 2005). Results from our study showed that rural intercommunity differences included, but also transcended, community economic disparities. Wealthier communities not only provided more public facilities and services, but older Chinese adults who resided in these communities also had higher levels of social participation and more frequent social interactions with other residents. Importantly, in the face of migration-induced community instability and increased older adult density in the rural context, there may be a “wealthy community advantage” in that older adults living in wealthier communities may have been protected from psychological distress related to a high outmigration penalty.
Finally, this study joins a growing body of scientific literature, extending our knowledge about how migration is associated with the well-being of individuals, families, and households who reside in sending areas. Extant research focused on the economic impacts of outmigration on sending households, such as increasing local agricultural investment and enriching rural households (Zhu & Luo, 2010). An emerging literature regarding rural China investigated outmigration-induced changes in community public infrastructure and occupation structure (e.g., closing local schools, teacher displacement; Xiang, 2007). Our sensitivity analyses excluding both household- and community-level economic variables did not change these conclusions, suggesting that migration-induced economic factors at the household and community levels may not have played a significant role in our observed association. Rather, this high outmigration health penalty was likely derived from ambient social and psychological stressors associated with community residential instability; exposure to these stressors may have resulted in reduced social bonding.
Our results had implications for policies that may improve the lives of older Chinese living in rural areas. While rural–urban migration in China continues, beyond paying special attention to older adults who live alone and have migrant children, policymakers are encouraged to take a community-based approach. Policies that increase resources targeted to high outmigration and low-income communities might help offset the high outmigration health penalty. These resources could be used to build public facilities, help create community associations, and increase local social and medical services important for improving older Chinese adults’ well-being.
Limitations
This study had limitations. First, because community-level variables were only available in the first wave, we could not investigate the role of changes in community characteristics. However, since 2010, migration flows stabilized; for example, from 2014 to 2015, the number of outmigrants nationally increased from 168.2 million to 168.8 million, an increase of 0.4% (China National Bureau of Statistics, 2015). As individuals primarily rely on existing migration networks in their village to learn about migration opportunities (Liang & Chunyu, 2013), it is unlikely that villages experienced sudden disruptions in their outmigration trends.
Second, we did not have specific measures of community social cohesion or information about with whom older adults interacted and the quality of those interactions, which may be important mediators. Also, we were not able to make causal statements about the observed relationships due to possible selection bias and omitted variable bias. An example of omitted variable bias is the ongoing urbanization process and land expropriation (Zhan, 2019). Sensitivity analyses showed that community-level land expropriation and compensation in the past were not associated with depressive symptoms. Future research should examine whether more recent land expropriation had implications for older Chinese adults’ well-being. Regarding possible selection bias, data from the CHARLS 2011 wave showed that rural older Chinese adults were largely immobile; 57% of rural older adults lived in the village in which they were born, among movers, 84% lived in another village in the same county. Among these, the vast majority (87%) were women, suggesting such migrations were likely due to establishing households with their husbands. Therefore, selection bias due to rural older adults’ migration was likely minimal with respect to these factors.
In conclusion, this study contributed to the best of our knowledge about the potential effects of outmigration on the well-being of left-behind older adults through the examination of community risk factors for depressive symptoms. Specifically, we tested our hypotheses about the “high outmigration penalty” for psychological health in the Chinese context, a society that has witnessed high and sustained migration from rural to urban areas. Moreover, we used nationally representative longitudinal data in a multilevel modeling framework to address our research questions. Future research may build on our findings by investigating whether the potential high outmigration penalty is associated with other health and well-being indicators and whether the findings reported here are supported in other rural developing country contexts.
Funding
None declared.
Conflict of Interest
None declared.
Author Contributions
Q. Song planned the study, supervised and performed part of the data analyses, and wrote the article. H. Wang performed the majority of statistical analyses and contributed to revising the article. J. A. Burr helped with planning data analysis and revised the article.

