


Abstract
A growing body of research has investigated psychosocial predictors of subjective well-being (SWB), a key component of healthy aging, which comprises life satisfaction and affective well-being. However, few studies have examined how executive function (EF)—a collection of adaptive, goal-directed control processes—could affect SWB in middle and late adulthood.
By analyzing a nationally representative adult cohort ranging from the early 30s to early 80s from the Midlife Development in the United States 2 study, we examined two potential mediators (i.e., sense of control vs positive reappraisal) that could underlie the relation between EF and SWB. Further, we assessed how these mediational pathways would differ across midlife and older adulthood.
Our results revealed that sense of control, but not positive reappraisal, significantly mediated the relation between EF and life satisfaction and affective well-being. Moreover, these mediation effects were significantly moderated by age, with more pronounced effects among older adults.
We found that EF in later adulthood facilitates a sense of control over obstacles that interfere with the attainment of goals, which in turn is associated with greater life satisfaction and positive affect. This underscores the role of EF as an increasingly valuable resource that buffers against declines in sense of control and SWB in late adulthood.
A growing body of research has investigated psychosocial predictors of subjective well-being (SWB)—a key component of healthy ageing (e.g., Joshanloo, Sirgy, & Park, 2018; Staudinger, Fleeson, & Baltes, 1999)—that is defined as (a) affective evaluations of one’s positive or negative emotions and (b) cognitive judgments of life satisfaction (Diener, Oishi, & Tay, 2018). Because life satisfaction deeply implicates cognitive evaluations (Diener, 1984), it is essential to identify cognitive factors that affect overall life satisfaction judgments and to unravel potential mechanisms underlying their relations. Despite the presumed importance of this subject, however, relatively little is known regarding the cognitive underpinnings of SWB. Hence, we focused on executive function (EF), a crucial predictor of functional decline in late adulthood (Johnson, Lui, & Yaffe, 2007), which refers to a set of cognitive control processes necessary for independent, adaptive, and goal-directed behaviors (Miyake & Friedman, 2012).
Past work has hinted at the link between EF and SWB. For instance, self-regulatory behaviors (e.g., self-control in overriding undesired impulses)—which implicate EF (Hofmann, Schmeichel, & Baddeley, 2012)—have been shown to positively predict SWB (e.g., Bernecker, Herrmann, Brandstätter, & Job, 2017; Hofmann, Luhmann, Fisher, Vohs, & Baumeister, 2014). Further, EF and SWB appear to be subserved by similar brain regions. Specifically, impairments in the orbitofrontal cortex have been associated with poorer impulse control and lower affective well-being (Berlin, Rolls, & Kischka, 2004). Moreover, given that EF is a multifaceted construct that consists of updating (manipulation of information in working memory), shifting (switching back and forth between multiple tasks), and inhibition processes (intentional suppression of irrelevant goals or stimuli; Miyake & Friedman, 2012), Pe, Koval, and Kuppens (2013) found a positive relation between updating of positively valenced information in working memory and SWB; however, McRae, Jacobs, Ray, John, and Gross (2012) did not find significant correlations between SWB and any of the three EF components. Notably, although considerable efforts have been directed toward understanding the link between EF and SWB, most of them have focused on young adults, and little is known about the role of developmental aspects of EF in lifelong SWB in middle and late adulthood. Given the empirical evidence that (a) older adults show poorer performance on EF tasks than young adults (Kray & Lindenberger, 2000; Rey-Mermet & Gade, 2017) and (b) the relations between cognitive functioning and outcome variables (e.g., sense of control) amplify with advancing age (e.g., Lachman & Andreoletti, 2006; Soederberg Miller & Lachman, 2000), there exists the possibility that the contribution of EF to SWB might be more salient for older, relative to younger, adults.
Our research goals are threefold. First, we sought to determine whether EF would predict SWB during middle and late adulthood. Satisfaction-of-goals theories posit that individuals’ life satisfaction is contingent on the extent to which their needs, desires, and goals are fulfilled (Diener et al., 2018). In accordance, psychological resources that facilitate the attainment of important goals should contribute toward SWB (Diener et al., 1999). Given that EF has been recognized as a critical cognitive resource that aids goal progression and achievements, such as occupational success, mental and physical health, and marital harmony (Diamond, 2013), all of which have been shown to predict SWB (Diener et al., 2018), EF would likely serve as an important cognitive factor that influences SWB.
Second, we aimed to examine whether theoretically driven mediators—sense of control and positive reappraisal—could account for the relation between EF and SWB. EF has been suggested to be essential in goal setting and advancement, such as strategic formulation of plans that enable goal fulfillment (Anderson, 2002) and resolving motivational conflicts between competing goals (e.g., overcoming short-term distractions and impulses in service of long-term goals; Hofmann et al., 2014). Therefore, it is plausible that EF confers a personal sense of control in effectively implementing goals and overcoming barriers that thwart goal accomplishment (Lachman & Weaver, 1998), which in turn promotes SWB. This potential mediating link between EF, sense of control, and SWB has partially received empirical support from previous studies. Specifically, sense of control has been found to be positively associated with EF (assessed using digit backward span) and life satisfaction, and negatively related with depressive symptoms (Lachman & Weaver, 1998; Soederberg Miller & Lachman, 2000). Thus, if EF promotes sense of control in carrying out personally important goals and overcoming constraints that interfere with goal accomplishment, then it seems reasonable to hypothesize that sense of control would be one mechanism that underlies the link between EF and SWB.
Another possible causal pathway between EF and SWB is through positive reappraisal. Notably, individuals with greater EF may rely on positive reappraisal as a coping strategy to modulate momentary negative affect, which consequently promotes SWB. Extant findings lend support to these predictions. For instance, EF has been shown to be positively associated with the ability to reappraise and identify positive aspects of negative emotional information or situations (Schmeichel & Tang, 2015). Specifically, updating abilities are essential for the efficient control of emotional thoughts in working memory during reappraisal processes (Schmeichel, Volokhov, & Demaree, 2008). Relatedly, inhibition and shifting are likely required in suppressing undesired appraisals and switching from negative to positive appraisals, respectively (McRae et al., 2012). Further, positive reappraisal has been found to be concomitant with SWB. Individuals who more frequently use positive reappraisal have higher self-esteem, closer relationships with friends, and experience fewer depressive symptoms, all of which contribute toward greater life satisfaction and affective regulation, particularly in midlife and older age (Gross & John, 2003; Wrosch, Heckhausen, & Lachman, 2000). Taken together, it is plausible that positive reappraisal, which augments positive affect and ameliorates negative affect in the face of adversity, would mediate the relation between EF and SWB.
Third, we sought to investigate whether the earlier-mentioned causal pathways would be qualified by the developmental time course from midlife to late adulthood. Owing to geriatric changes in frontal lobe regions, EF has been documented to decline with advancing age, as reflected by older adults’ poorer performance on EF tasks (e.g., Kray & Lindenberger, 2000; Rey-Mermet & Gade, 2017). Therefore, EF may become increasingly crucial resources for SWB, especially for older adults. Similarly, previous studies suggest that the relations between cognitive abilities and psychological variables are stronger for older, than for younger, adults. For instance, performance on memory tasks (e.g., word list recall, forward and backward digit span) that are pertinent to EF was significantly associated with control beliefs for middle-aged and older adults, but not for younger adults (Lachman, 1986; Lachman & Andreoletti, 2006; Soederberg Miller & Lachman, 2000). Together, these findings suggest that the hypothesized mediational pathways of EF to SWB through either sense of control or positive reappraisal may be more pronounced for older, but not younger, adults.
To address these questions, we analyzed a large-scale dataset that comprised a diverse, nationally representative adult cohort ranging from early 30s to early 80s from the Midlife Development in the United States 2 (MIDUS 2) study conducted from 2004 to 2006 (Brim, Ryff, & Kessler, 2004). We tested our hypothesized moderated mediation model while controlling for common covariates (i.e., age, gender, education, depression, health status, and personality traits).
Method
Participants
The MIDUS 2 study sampled over 5,000 American adults across 48 states using random-digit dialing (Brim et al., 2004). Respondents first completed a 30-min phone interview during which EF tasks were verbally administered. Subsequently, two sets of self-administered questionnaires were mailed to be completed. Following Tun and Lachman (2008), we adopted the following criteria for the EF tasks for cleaner analyses: (a) complete responses; (b) trials without technical malfunctions, no difficulty in following instructions, and no distraction from external events; and (c) more than 75% accuracy in each task to ascertain participants’ correct understanding of the tasks. Of the original sample, 3,267 participants (ages 32–84 years; M = 55.90), who met the aforementioned criteria and provided complete data for crucial variables in this study (see Measures), were included for our analyses. The majority of the participants was white (93.20%), completed high school (24.83%) or university (20.17%) education, and experienced no (23.20%) or one (19.89%) to two (19.13%) recent chronic health conditions (Table 1).
Descriptive Statistics of Predictors, Covariates, Mediator, and Criterion Variables
| Reliabilitya | ||||||||
|---|---|---|---|---|---|---|---|---|
| M | SD | Min | Max | Skewness | Kurtosis | 32–55 years | 56–84 years | |
| Covariates | ||||||||
| Age (years) | 55.90 | 12.12 | 32.00 | 84.00 | 0.21 | –0.80 | — | — |
| Gender (% female) | 54.51 | — | — | — | — | — | — | — |
| Educationb | 7.39 | 2.53 | 1.00 | 12.00 | 0.17 | –0.99 | — | — |
| Health statusc | 2.36 | 2.42 | 0.00 | 30.00 | 2.27 | 12.31 | — | — |
| Depression (%)d | 10.22 | — | — | — | — | — | — | — |
| Personality traitse | ||||||||
| Neuroticism | 2.04 | 0.62 | 1.00 | 4.00 | 0.47 | 0.06 | .75 | .72 |
| Extraversion | 3.10 | 0.57 | 1.00 | 4.00 | –0.38 | –0.29 | .77 | .76 |
| Openness | 2.91 | 0.53 | 1.00 | 4.00 | –0.19 | –0.21 | .77 | .78 |
| Conscientiousness | 3.45 | 0.44 | 1.00 | 4.00 | –0.85 | 0.61 | .57 | .59 |
| Agreeableness | 3.44 | 0.50 | 1.00 | 4.00 | –0.78 | 0.09 | .80 | .80 |
| Focal predictor | ||||||||
| EF | 0.16 | 0.91 | –2.79 | 3.36 | –0.01 | –0.15 | — | — |
| Mediators | ||||||||
| Sense of control | 5.56 | 0.98 | 1.08 | 7.00 | –0.69 | 0.11 | .88 | .86 |
| Personal mastery | 5.75 | 1.01 | 1.25 | 7.00 | –1.00 | 0.99 | .75 | .72 |
| Perceived constraintsf | 2.53 | 1.14 | 1.00 | 7.00 | 0.77 | 0.08 | .86 | .85 |
| Positive reappraisal | 3.05 | 0.60 | 1.00 | 4.00 | –0.23 | –0.48 | .80 | .77 |
| Criteria | ||||||||
| Life satisfaction | 7.54 | 1.23 | 2.25 | 10.00 | –0.94 | 1.45 | .71 | .69 |
| Affective balanceg | 2.06 | 1.08 | –4.00 | 4.00 | –0.91 | 1.52 | — | — |
| Positive affect | 3.58 | 0.75 | 1.00 | 5.00 | –0.53 | 0.39 | .85 | .85 |
| Negative affect | 1.53 | 0.51 | 1.00 | 5.00 | 1.77 | 5.14 | .80 | .77 |
Note. EF = executive function; SD = standard deviation.
Reliability estimates were calculated using Cronbach’s alpha.
Education was reported on a scale of 1 (no school) to 12 (PhD, EDD, MD, DDS, LLB, LLD, JD, or other professional doctorate).
Health status was indexed by the total number of chronic health problems experienced in the past 12 months. Higher number of chronic problems denote poorer health status.
The classification of major depression was based on the Diagnostic and Statistical Manual of Mental Disorders (DSM-III-R; American Psychiatric Association, 1987).
Personality traits, based on the five-factor model, were based on respondents’ rating of the extent to which 31 personality-related adjectives best described them on a 4-point scale (1 = a lot, 4 = not at all; Rossi, 2001).
Responses were recoded such that higher values reflect higher perceived constraints.
Affective balance was computed by the difference between mean scores of positive affect and negative affect.
Measures
Executive function
The six subtests of the Brief Test of Adult Cognition by Telephone and the Stop and Go Switch Task (SGST) were used to assess various cognitive abilities. Exploratory and confirmatory factor analyses of the cognitive battery revealed two factors representing episodic memory and executive functioning (Lachman, Agrigoroaei, Murphy, & Tun, 2010). The mean z score of the five tasks that loaded onto executive functioning was used as an index of EF. The EF tasks are described next.
The digit backward span indexed working memory. Participants were given a series of numbers and asked to repeat them backward. The maximum number of digits recalled up to eight was recorded. The category fluency task measured verbal ability and speed (Drachman & Leavitt, 1972) by asking participants to produce as many words as possible within 60 s from each given category. The number of unique responses generated was recorded. In the number series task, which evaluated fluid intelligence and reasoning (Salthouse & Prill, 1987), participants were given strings of numbers (e.g., 2, 4, 6, and 8) and were asked to deduce the next number in the series (i.e., 10). The total number of correct answers was recorded. The backward counting task tested speed of processing by asking participants to count backward from 100. The total number of items correctly reported was recorded. The SGST assessed inhibitory control and task-switching, in which participants underwent two single-task blocks and a mixed-task block. The first block comprised congruent trials, whereby participants replied “stop” and “go” when they heard the words “red” and “green,” respectively. The second block consisted of incongruent trials, wherein participants answered “go” and “stop” when they heard “red” and “green,” respectively. In the final mixed-task block, participants switched between congruent and incongruent rules based on the cue presented (i.e., “normal” and “reverse”) by the experimenter. Inhibitory control was indexed by the difference in reaction time on the incongruent, relative to the congruent, trials. Task-switching ability was indexed by the difference in reaction time between switch trials (e.g., a congruent trial followed by an incongruent trial) and nonswitch trials (e.g., a congruent trial followed by another congruent trial).
Sense of control
Sense of control was assessed using a 7-point scale (1 = strongly agree, 7 = strongly disagree; Lachman & Weaver, 1998). The measure comprised two subscales: personal mastery (four items), which assessed one’s efficacy in carrying out personally important goals (e.g., “When I really want to do something, I usually find a way to succeed at it”), and perceived constraints (eight items), which assessed one’s perception of obstacles beyond one’s control that interfere with reaching personally pertinent goals (e.g., “There is little I can do to change the important things in my life”). After the subscale scores for personal mastery were reverse-coded, item scores from both subscales were averaged such that higher mean values represent higher sense of control (i.e., higher personal mastery and lower perceived constraints).
Positive reappraisal
A four-item positive reappraisal subscale from a larger inventory of coping strategies (Wrosch et al., 2000) was used to assess the frequency to which one perceives the good in bad situations (e.g., “I can find something positive even in the worst situations”) based on a 4-point scale (1 = a lot, 4 = not at all). Reverse-coded item scores were averaged to form an overall score of positive reappraisal.
Life satisfaction
A six-item scale (Prenda & Lachman, 2001) was used to measure life satisfaction. For each item, participants were asked to rate how satisfied they were with their life overall, work, health, finances, relationship with spouse/partner, and relationship with children on an 11-point scale (0 = the worse possible, 10 = the best possible). Higher mean scores denote higher levels of overall life satisfaction.
Positive and Negative Affect Schedule
A 9-item variant of the Positive and Negative Affect Schedule (Mroczek & Kolarz, 1998) was used to evaluate the extent to which participants experienced positive (e.g., enthusiastic and proud) and negative (e.g., ashamed and upset) emotions in the past 30 days (1 = all of the time, 5 = none of the time). After reverse-coding, higher scores reflected higher levels of positive/negative affect. Each participant’s affective balance score, which indexed affective well-being, was computed by the difference between mean scores of positive and negative affect.
Results
Ordinary least squares regression analyses were performed separately for the SWB indices of life satisfaction and affective balance, with EF as the focal predictor and sense of control and positive reappraisal as the mediators. We included covariates―specifically, age, gender, depression, health status, education, and personality traits―which have been shown to affect EF and SWB (Diener et al., 1999; Diener et al., 2018; MacPherson et al., 2002). Missing values for covariates were imputed using the expectation–maximization algorithm. We entered the focal predictor and covariates in Step 1, followed by the mediators in Step 2. Parallel mediation and moderated mediation analyses (with age as the moderator) were carried out using the PROCESS macro (Hayes, 2018), which estimated 95% percentile bootstrap confidence intervals (CI) for indirect effects based on 5,000 bootstrap samples. Further mediation and moderated mediation analyses were conducted separately with the two subscales of sense of control (i.e., personal mastery and perceived constraints) to assess if they would differentially affect SWB. Inspection of collinearity statistics did not reveal any evidence of multicollinearity (for zero-order correlations, see Supplementary Appendix A).
Life satisfaction
We found that EF significantly predicted life satisfaction when other covariates were controlled for (B = .06, 95% CI [0.01, 0.11], p = .01). In Step 2, sense of control (B = .40, 95% CI [0.36, 0.44], p < .001) and positive reappraisal (B = .07, 95% CI [0.002, 0.14], p = .04) significantly predicted life satisfaction (Table 2).
Regression Coefficients for Life Satisfaction and Affective Balance
| Life satisfaction | Affective balance | |||||||
|---|---|---|---|---|---|---|---|---|
| Step 1 | Step 2 | Step 1 | Step 2 | |||||
| B (SE) | β | B (SE) | β | B (SE) | β | B (SE) | β | |
| Predictor | ||||||||
| EF | .062 (.024) | .045 | .042 (.023) | .031 | .006 (.018) | .005 | –.006 (.017) | –.005 |
| Covariates | ||||||||
| Age | .021 (.002) | .204 | .023 (.002) | .224 | .012 (.001) | .133 | .013 (.001) | .150 |
| Gender | .077 (.039) | .031 | .099 (.038) | .040 | .009 (.029) | .004 | .017 (.028) | .008 |
| Education | .040 (.008) | .082 | .035 (.008) | .072 | –.002 (.006) | –.004 | –.004 (.006) | –.010 |
| Health status | –.096 (.008) | –.190 | –.081 (.008) | –.159 | –.088 (.006) | –.196 | –.078 (.006) | –.175 |
| Depression | –.491 (.064) | –.121 | –.335 (.061) | –.077 | –.678 (.047) | –.189 | –.575 (.045) | –.161 |
| Neuroticism | –.325 (.033) | –.163 | –.154 (.033) | –.077 | –.590 (.024) | –.335 | –.471 (.024) | –.267 |
| Extraversion | .391 (.041) | .180 | .241 (.040) | .111 | .482 (.030) | .252 | .377 (.030) | .197 |
| Openness | –.046 (.042) | –.020 | –.177 (.041) | –.076 | .077 (.031) | .038 | –.023 (.031) | –.011 |
| Conscientiousness | .524 (.045) | .187 | .343 (.043) | .122 | .386 (.033) | .156 | .269 (.032) | .109 |
| Agreeableness | .025 (.045) | .010 | .042 (.044) | .017 | .012 (.033) | .006 | .001 (.032) | .005 |
| Mediators | ||||||||
| Sense of control | — | — | .400 (.023) | .318 | — | — | .246 (.017) | .222 |
| Positive reappraisal | — | — | .071 (.035) | .035 | — | — | .114 (.026) | .064 |
Note. SEs are shown in parentheses. Significant results are marked in boldface, p < .05. EF = executive function; SE = standard error.
The parallel mediation analysis revealed a significant indirect effect for sense of control (B = .02, 95% CI [0.01, 0.04]; Figure 1). Further, there was a significant indirect effect for perceived constraints (B = .03, 95% CI [0.01, 0.04]), but not for personal mastery (B = –.002, 95% CI [–0.01, 0.003]), thereby showing that sense of control in overcoming life constraints that interfere with one’s goal attainment drove the relation between EF and life satisfaction (Figure 2). However, positive reappraisal did not significantly mediate the association between EF and life satisfaction (B = –.001, 95% CI [–0.004, 0.0004], Figure 1). These results indicate that the relation between EF and life satisfaction was mediated by sense of control—especially via perceived constraints—but not by positive reappraisal.
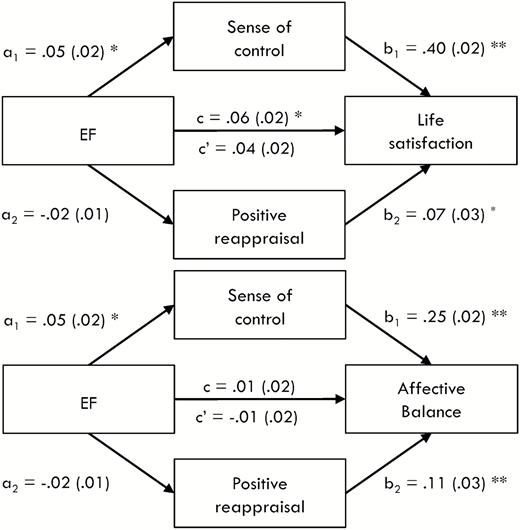
Parallel mediation models with sense of control and positive reappraisal as mediators for life satisfaction (top panel) and affective balance (bottom panel). a1 and b1 signify indirect effects for sense of control, whereas a2 and b2 denote indirect effects for positive reappraisal; c and c′ reflect total and direct effects, respectively. All values represent unstandardized regression coefficients with standard errors in parentheses. *p < .05; **p < .001.
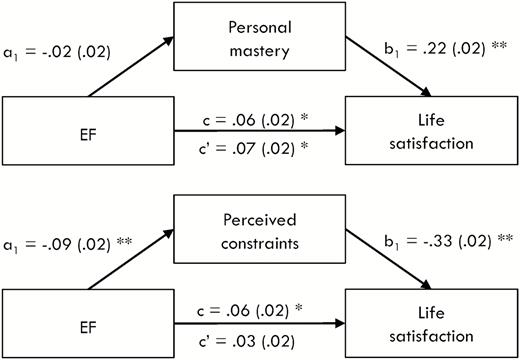
Mediation models with personal mastery (top panel) and perceived constraints (bottom panel) as mediators for life satisfaction. a1 and b1 signify indirect effects, whereas c and c′ reflect total and direct effects, respectively. All values represent unstandardized regression coefficients with standard errors in parentheses. *p < .05; **p < .001.
Our moderated mediation analysis revealed that the age × EF interaction term (B = .003, 95% CI [0.001, 0.01]) and the index of moderated mediation (B = .001, 95% CI [0.0002, 0.002]) for sense of control were significant, indicating that the indirect effect of EF on life satisfaction through sense of control was moderated by age. Specifically, sense of control significantly mediated the relation between EF and SWB for older participants at ages 55 and 69, but not for younger participants at age 43 (Table 3). Further, the moderated mediation results for perceived constraints (B = .002, 95% CI [0.001, 0.003]), but not personal mastery (B = –.0003, 95% CI [–0.001, 0.0002]), mirrored those found for sense of control; in particular, the effect of EF on life satisfaction through perceived constraints was significant for older, but not younger, adults (Table 3). In contrast, the moderated mediation analysis for positive reappraisal showed that the age × EF interaction term (B = .001, 95% CI [–0.001, 0.003]) and the index of moderated mediation (B = .0002, 95% CI [–0.0001, 0.001]) were not significant. These results indicate the effect of EF on life satisfaction through sense of control (in particular, perceived constraints), but not through positive reappraisal, becomes more pronounced with age.
Results for First-Stage Moderated Mediation Analyses for Executive Function and Subjective Well-being (Life Satisfaction and Affective Balance) via Sense of Control and Positive Reappraisal
| Age | ||||||
|---|---|---|---|---|---|---|
| 43 years(16th percentile) | 55 years(50th percentile) | 69 years(84th percentile) | ||||
| Conditional indirect effect | 95% CI | Conditional indirect effect | 95% CI | Conditional indirect effect | 95% CI | |
| Life satisfaction | ||||||
| Sense of control | .0057 (.0098) | [–0.0136, 0.0245] | .0203 (.0077) | [0.0054, 0.0354] | .0375 (.0106) | [0.0174, 0.0587] |
| Personal mastery | .0008 (.0056) | [–0.0100, 0.0121] | –.0030 (.0043) | [–0.0115, 0.0055] | –.0076 (.0058) | [–0.0189, 0.0041] |
| Perceived constraints | .0064 (.0097) | [–0.0125, 0.0258] | .0277 (.0080) | [0.0121, 0.0436] | .0526 (.0113) | [0.0312, 0.0754] |
| Positive reappraisal | –.0049 (.0027) | [–0.0106, –0.0002] | –.0030 (.0019) | [–0.0070, 0.0007] | –.0007 (.0025) | [–0.0057, 0.0046] |
| Affective balance | ||||||
| Sense of control | .0036 (.0062) | [–0.0089, 0.0158] | .0130 (.0050) | [0.0037, 0.0230] | .0240 (.0068) | [0.0111, 0.0381] |
| Personal mastery | .0006 (.0040) | [–0.0073, 0.0086] | –.0022 (.0031) | [–0.0084, 0.0040] | –.0054 (.0043) | [–0.0139, 0.0028] |
| Perceived constraints | .0039 (.0060) | [–0.0077, 0.0158] | .0172 (.0048) | [0.0082, 0.0272] | .0326 (.0070) | [0.0199, 0.0474] |
| Positive reappraisal | –.0053 (.0028) | [–0.0112, 0.0001] | –.0032 (.0021) | [–0.0075, 0.0007] | –.0007 (.0028) | [–0.0063, 0.0046] |
Note. Values represent unstandardized coefficient estimates with standard errors in parentheses for conditional indirect effects. Significant results marked in boldface, p < .05. CI = confidence interval.
Affective balance
EF did not significantly predict affective balance when other covariates were controlled for (B = .01, 95% CI [–0.03, 0.04], p = .76). In Step 2, both sense of control (B = .25, 95% CI [0.21, 0.28], p < .001) and positive reappraisal (B = .11, 95% CI [0.06, 0.17], p < .001) significantly predicted affective balance (Table 2).
The parallel mediation analysis showed a significant indirect effect for sense of control (B = .01, 95% CI [0.004, 0.02]), but not for positive reappraisal (B = –.002, 95% CI [–0.01, 0.001]; Figure 1). Moreover, the indirect effect for perceived constraints (B = .02, 95% CI [0.01, 0.02]), but not personal mastery (B = –.001, 95% CI [–0.01, 0.002]), was significant (Figure 3). These findings demonstrate that sense of control—especially via perceived constraints—but not positive reappraisal, undergirds the association between EF and affective balance.
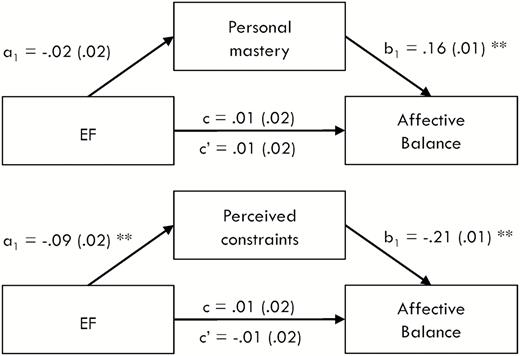
Mediation models with personal mastery (top panel) and perceived constraints (bottom panel) as mediators for affective balance. a1 and b1 signify indirect effects, whereas c and c′ reflect total and direct effects, respectively. All values represent unstandardized regression coefficients with standard errors in parentheses. *p < .05; **p < .001
In the moderated mediation analysis, the age × EF interaction term (B = .003, 95% CI [0.001, 0.01]) and the index of moderated mediation (B = .001, 95% CI [0.0002, 0.002]) were significant for sense of control, highlighting that the indirect effect of EF on SWB through sense of control was moderated by age. In particular, the indirect effects for sense of control were significant at ages 55 and 69, but not at age 43. Further, the moderated mediation results for sense of control appear to be driven by perceived constraints (B = .001, 95% CI [0.001, 0.002]) but not by personal mastery (B = –.0002, 95% CI [–0.001, 0.0002]; Table 3). In contrast, the age × EF interaction term (B = .001, 95% CI [–0.001, 0.003]) and the index of moderated mediation (B = .0002, 95% CI [–0.0001, 0.001]) were not significant for positive reappraisal. These findings indicate that increasing age moderated the mediational pathway of EF to affective balance through sense of control (in particular, perceived constraints), but not positive reappraisal.
Discussion
We found that EF in later life facilitates a sense of control over obstacles that interfere with the attainment of goals (i.e., perceived constraints), which in turn engenders greater life satisfaction and positive affect. These findings are consistent with the satisfaction-of-goals account of SWB (Diener et al., 1999; Diener et al., 2018) and extant research that has demonstrated the relations of sense of control to EF (Soederberg Miller & Lachman, 2000) and SWB (Lachman & Weaver, 1998). Using a large sample size and a comprehensive battery of EF measures, our results corroborate the previously hinted association between EF and SWB (e.g., Berlin et al., 2004; Pe et al., 2013) and illuminate one mechanism through sense of control. Further, our finding of the moderated mediational pathway of EF to sense of control (especially lower perceived constraints) and SWB as a function of age emphasizes the crucial role of EF as increasingly valuable resources that contribute toward the SWB of older adults who experience apparent losses in cognitive functioning (e.g., Kray & Lindenberger, 2000) and sense of control (e.g., Lachman, 2006). Our results reconcile the mixed findings for EF and SWB in young adults (McRae et al., 2012; Pe et al., 2013) by showing that these relations may be more salient for middle and late, rather than early, adulthood. In addition, these results are consistent in part with previous studies that have demonstrated that the association between cognitive abilities and sense of control strengthens from middle to late adulthood (Lachman, 1986; Lachman & Andreoletti, 2006; Soederberg Miller & Lachman, 2000). Our study implies that EF may serve as a buffer against declines in sense of control and SWB that accompany old age.
In contrast, the competing hypothesis that positive reappraisal would mediate the relation between EF and SWB was not supported regardless of differing age groups. The finding that EF did not predict positive reappraisal departs from extant research that has found a positive link between EF and reappraisal (e.g., Schmeichel et al., 2008; Schmeichel & Tang, 2015). This could be because of different methods used to assess positive reappraisal. Specifically, previous studies evaluated reappraisal ability, whereas self-reported measures used in the MIDUS 2 study indexed the tendency to use reappraisal in daily functioning. Therefore, although EF may be concomitant with reappraisal ability, our results suggest that individuals with higher EF do not necessarily use reappraisal frequently. It is possible that the habitual employment of a particular emotion regulation strategy might depend on other factors, such as culture (Butler, Lee, & Gross, 2007) or personality (Gross & John, 2003), instead of one’s competence in executing the strategy. This is an avenue that future research should pursue.
Nevertheless, we found that positive reappraisal predicted life satisfaction and affective balance. This is consistent with past findings which demonstrated that higher self-reported positive reappraisal was linked to greater SWB (Gross & John, 2003; Wrosch et al., 2000). Interestingly, our findings show that positive reappraisal was more strongly associated with affective balance than with life satisfaction. This could be because positive reappraisal is an emotion regulatory strategy that serves to increase the preponderance of positive affect over negative affect (i.e., affective balance) rather than life satisfaction. On the other hand, sense of control was more closely associated with life satisfaction than with affective balance. This could be attributed to the fact that sense of control over obstacles that impede the attainment of personally important goals is more aligned with the central notion of goal progression and fulfillment in life satisfaction (Diener et al., 1999). These findings highlight that positive reappraisal and sense of control differ in their relative contributions toward the affective and cognitive components of SWB, respectively.
Several limitations of our study deserve further discussion. First, the lack of controlled experiments limits causal inferences. Although we posit that individuals with better EF have higher levels of SWB, individuals with greater SWB may be more open to activities that facilitate the development of EF (e.g., music training and video gaming). Likewise, consistent with previous findings that cognitive performance influences control beliefs (Grover & Hertzog, 1991), our model assumes that EF contributes to sense of control. However, it is also possible that sense of control allows one to achieve higher levels of cognitive performance (Riggs, Lachman, & Wingfield, 1997). Given the potential bidirectional relations between EF and sense of control, future work should ascertain the directionality of association between EF and SWB. Second, although our findings support sense of control as a crucial mechanism underlying the link between EF and SWB, the direct effects were not reduced to zero, suggesting that other mediators may exist. Therefore, future research should explore other possible mediators. Third, given that inhibitory control and shifting, which are dissociable EF components, were measured using the same task (i.e., SGST), future studies should use separate tasks to circumvent the task impurity problem (Miyake & Friedman, 2012). Fourth, given that the MIDUS 2 sample consisted of predominantly white Americans aged between 32 and 84 years, our findings may be limited in its generalizability. Therefore, further research should be undertaken to replicate our findings with more ethnically and racially diverse samples as well as with other age groups (e.g., mid-80s).
Our findings hold practical implications for public health policies and intervention programs targeted at improving SWB in aging populations. Crucially, given that EF has been shown to be trainable through practice (e.g., Diamond, 2013), improving EF may constitute one way to improve critical cognitive factors, which in turn augment SWB in middle and late adulthood.
Funding
None reported.
Conflict of Interest
None reported.

