


Abstract
Tissue-resident stem cells are essential for development and repair, and in the skeleton, this function is fulfilled by recently identified skeletal stem cells (SSCs). However, recent work has identified that SSCs are not monolithic, with long bones, craniofacial sites, and the spine being formed by distinct stem cells. Recent studies have utilized techniques such as fluorescence-activated cell sorting, lineage tracing, and single-cell sequencing to investigate the involvement of SSCs in bone development, homeostasis, and disease. These investigations have allowed researchers to map the lineage commitment trajectory of SSCs in different parts of the body and at different time points. Furthermore, recent studies have shed light on the characteristics of SSCs in both physiological and pathological conditions. This review focuses on discussing the spatiotemporal distribution of SSCs and enhancing our understanding of the diversity and plasticity of SSCs by summarizing recent discoveries.
Introduction
Bone homeostasis is primarily regulated by the balance between osteoblastic bone formation and osteoclastic bone resorption (Compston et al., 2019; Méndez-Ferrer et al., 2010). While bone-resorbing osteoclasts originate from hematopoietic stem cells (HSCs) or yolk sac progenitors, bone-forming osteoblasts were traditionally viewed as derived from a group of cells termed mesenchymal stem cells (MSCs) (Bianco, 2014; Eggenhofer et al., 2014; Jacome-Galarza et al., 2019; Yahara et al., 2020). However, MSCs exhibit significant heterogeneity, being comprised of multiple cell types in unfractionated cultures (McLeod and Mauck, 2017; Tikhonova et al., 2019). Additionally, MSCs have yet to be fractionated to identify a subpopulation displaying formal stemness characteristics such as self-renewal or in vivo multipotency. Over the last few years, the concept of MSCs has been supplanted by better-defined cellular populations that indeed display formal stemness characteristics, frequently termed skeletal stem cells (SSCs), to distinguish these cells from prior work on MSCs (Chan et al., 2015, 2018). Furthermore, very recent work has found that SSCs are not a monolithic population, but instead are comprised of a series of related but distinct cell types that serve as stem cells at different skeletal sites or at different stages of bone development (Ambrosi et al., 2021b; Bok et al., 2023; Mizuhashi et al., 2018; Sun et al., 2023). This diversity of SSC types contributes to the distinct characteristics observed during bone development. Previously, it was known for over 300 years since the early anatomic studies of two main ways of bone formation, endochondral ossification, and intramembranous ossification (Newton et al., 2019). The process of endochondral ossification of SSCs differentiate into bone varies at different stages of bone development (Li et al., 2022; Mizuhashi et al., 2018). SSCs involved in intramembranous ossification also possess unique characteristics (Debnath et al., 2018). Recently, vertebral SSCs (vSSCs) have been identified and found to exhibit distinct characteristics compared to SSCs found in long bones and calvaria (Sun et al., 2023). This review summarizes the characteristics of SSCs in different skeletal regions and at various stages of bone development, while also exploring the overall role of SSCs in bone repair and diseases.
Current identification and isolation methods for SSC research
While the methods to identify SSCs have a longer history in skeletal biology research, the work of Chan and colleagues to define murine and human SSCs has crystallized these methods into a key template for contemporary SSC research (Chan et al., 2015, 2018). Central to SSC research is determining the identity and differentiation trajectory of SSCs. This information is then integrated to understand the changes that occur in SSCs during bone development and with skeletal disease processes and to identify the key factors that influence the differentiation and self-renewal of these SSCs.
The isolation of SSCs primarily relies on cell surface markers (Gulati et al., 2018). Currently, the main approach to define SSCs and the downstream cellular populations they produce is fluorescence-activated cell sorting (FACS), often used in combination with a Cre-loxP-driven lineage tracing strategy (Gulati et al., 2018; Kretzschmar and Watt, 2012) (Fig. 1A and Table 1). FACS combined with in vivo transplantation serves as the current gold standard for evaluating the differentiation potential of SSCs (Gulati et al., 2018). In this method, a small number (103–105) of cells or ex vivo cultured cells are obtained by FACS and mixed with a small amount of Matrigel (2–10 μL) and then transplanted into the renal subcapsular space (Gulati et al., 2018). Alternatively, similar grafts can also be implanted into intramuscular sites or the inguinal fat pad (Bok et al., 2023; Sun et al., 2023). After 2–8 weeks, ectopic bones that are often termed in vivo bone organoids or spicules are formed that can be analyzed by either histology or sorted by FACS (Gulati et al., 2018). The purpose of the FACS analysis is two-fold. First, it allows for the determination of which populations as defined by cell surface markers are produced by each input population. In this manner, a differentiation hierarchy can be constructed to determine which cell types each of the FACS-defined populations are able to produce, especially if the downstream non-stem populations are also transplanted to demonstrate that they produce a progressively more restricted subset of cells within the overall lineage. This analysis allows ordering of surface marker-defined cell types from those at the apex (typically the stem cell) to those at the base (typically mature populations such as osteoblasts) in the differentiation hierarchy. In addition to this analysis, these organoid assays are also used to demonstrate SSC self-renewal by demonstrating that cells with the same surface immunophenotype as the input population remain in the organoid. Ideally, this analysis is coupled with a dye dilution proliferation method, which allows the determination that the input populations persisting at the assay endpoint underwent proliferation and therefore self-renewal.
Methods for identification and isolation of SSCs.
| Methods | Application | Features | References |
|---|---|---|---|
| Fluorescence-activated cell sorting (FACS) | Isolation and collection of SSCs | Differentiation hierarchy can be constructed to determine which cell type is stem cell | (Gulati et al., 2018) |
| Methods of cultured SSCs in vitro | Colony-forming unit-fibroblast (CFU-F) method | Assess CFU-F activity, as a secondary method for identifying SSCs | (Bianco and Robey, 2015) |
| In vitro tri-lineage differentiation assays | Assess the multilineage differentiation potential of SSCs | (Gulati et al., 2018) | |
| In vivo transplantation | Transplanted into the renal subcapsular space, intramuscular sites or the inguinal fat pad | FACS combined with in vivo transplantation serves as the current gold standard for evaluating the differentiation potential of SSCs | (Bok et al., 2023; Sun et al., 2023) |
| Lineage tracing | Cre-loxP systems | Tracking the fate of SSCs; labeling multiple cell states within a lineage | (Mizuhashi et al., 2018) |
| Dre-rox and Flp-frt systems | |||
| DeaLT systems | |||
| Single-cell RNA sequencing (ScRNA-seq) | To study the cell heterogeneity and development process | To study cellular composition; cell heterogeneity and cell transcriptome analysis | (Debnath et al., 2018; Greenblatt et al., 2019) |
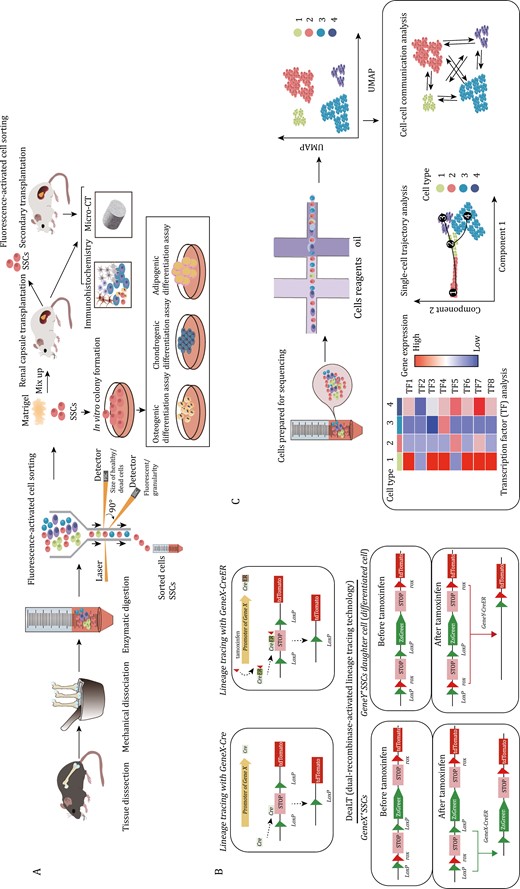
Current research methods and verification strategies on SSCs. (A) Isolation and functional assessment of SSCs: SSCs are isolated from bone tissue through mechanical grinding and enzymatic digestion, followed by sorting using FACS. The stemness and differentiation potential of SSCs are verified through in vivo dissimilation osteogenesis. Three-lineage differentiation experiments are conducted to confirm their differentiation ability. (B) Lineage tracing experiment: Cre recombinase is used to express the reporter gene (e.g., tdTomato). This allows permanent marking of cells expressing target gene and their progeny cells. In the CreER system, tdTomato expression is induced only when tamoxifen is administered. By giving tamoxifen at different time points, cre-expressing cells and their progeny can be permanently labeled. The DeaLT tracking system enables labeling of two different types of cells simultaneously. After tamoxifen induction, lineages can be distinguished by being labeled with different fluorescence by different genes. (C) Flow chart of single-cell sequencing and data analysis involves various analyses such as cell subtype classification, transcription factor analysis, single-cell trajectory analysis, and cell–cell communication.
Generally in vitro methods are best considered as secondary supporting methods in studying or defining SSC populations. SSC proliferative capacity can be assessed in vitro using the colony-forming unit-fibroblast (CFU-F) method (Bianco and Robey, 2015). However, CFU-F activity is widely distributed among both stem and non-stem populations and is, therefore, of questionable utility in defining SSCs outside of use as a secondary supporting methodology. Serial mesensphere formation capacity under ultra-low adherence conditions may be a more reliable correlate of stemness, but even then should only be considered a secondary supporting method (Bok et al., 2023; Chan et al., 2018; Gulati et al., 2018; Sun et al., 2023). In vitro tri-lineage differentiation assays assess the multilineage differentiation potential of SSCs under different culture and induction conditions, including differentiation into osteoblasts, chondrocytes, and adipocytes, however many non-stem skeletal cell types show in vitro tri-lineage differentiation potential (Gulati et al., 2018; Pittenger et al., 1999).
While it is crucial to assess the stemness and viability of SSCs through in vivo transplantation and in vitro cell culture, these approaches cannot replace the assessment of SSC activity in the native skeletal environment (Gulati et al., 2018). As a result, lineage tracing has become a core approach for studying SSCs, particularly in tracking the fate of these cells (Kretzschmar and Watt, 2012; Newton et al., 2019; Worthley et al., 2015). The most commonly used system for lineage tracing is Cre-loxP (Feil et al., 2009) (Fig. 1B). This system relies on the use of Cre or CreER recombinase. CreER recombinase can be induced by tamoxifen administration, which activates the expression of a specific target gene. The tamoxifen-induced CreER expression system allows for pulse labeling one or more lineages of cells (Mizuhashi et al., 2018). However, it should be noted that, with a few exceptions, often CreER expression is not restricted to a single-cell state or cell type, imposing a strong limitation in CreER-based approaches that necessitate the use of transplantation-based systems that are capable of resolving the functions and differentiation potential of specific cell types within a lineage. In addition to labeling multiple cell states within a lineage, many skeleton-relevant cre lines may further co-label multiple independent lineages of skeletal cells, which is a further limitation (Bok et al., 2023).
The Dre-rox and Flp-frt systems are additional methods utilized for lineage tracing in mouse models (Kretzschmar and Watt, 2012). Dre-rox system exhibits high recombination efficiency and does not cross-react with Cre recombinase. These two systems can be combined to achieve dual genetic manipulation (He et al., 2018). Lineage tracing often involves the use of fluorescence reporter mice. The Rosa26 site is currently one of the most commonly employed sites for site-directed integration of fluorescent reporters (Soriano, 1999). By crossbreeding Rosa26 site-integrated fluorescence reporter mice with different Cre recombinase-expressing strains, researchers can conduct tissue-specific cell lineage tracing (Feil et al., 2009; McLellan et al., 2017). Many well-known SSC markers are not fully specific to only a particular SSC type and are often co-expressed by multiple lineages of cells. This poses a challenge in tracking the fate and origin of SSCs. To address this problem, DeaLT (dual-recombinase-activated lineage tracing technology) incorporates the Dre-rox recombination system into the traditional Cre-loxP recombination system and can be a effective solution (He et al., 2018). By utilizing one recombination system (Dre-rox) to control another system (Cre-loxP), the Dre-rox-mediated recombination reaction removes the loxP site in cells that may cause ectopic expression of Cre (He et al., 2018). This effectively prevents ectopic recombination of Cre-loxP and enhances the accuracy of Cre-loxP-mediated lineage tracing results (He et al., 2018). DeaLT also offers a method to track two different cell populations simultaneously (He et al., 2018).
Single-cell RNA sequencing (ScRNA-seq) can be used to study cellular composition, though the sparse transcriptional sampling inherent in the technique, often termed “dropout,” is likely to lead to an inability to resolve the full set of biologically distinct cell states present unless specialized techniques are utilized (Greenblatt et al., 2019; Jin et al., 2023). ScRNA-seq has also contributed to the understanding of SSCs, such as sorting SSCs and other skeletal lineage cells, and analyzing the signaling pathways that may regulate the activity of SSC and its progeny (Chan et al., 2015). Lineage tracing technology, when combined with single-cell sequencing, can be utilized to analyze the heterogeneity of cells derived from target gene-marked lineages (Debnath et al., 2018; Kretzschmar and Watt, 2012). For instance, CTSK-lineage cells were sorted for single-cell sequencing, revealing the presence of four subpopulations, including PSCs (Debnath et al., 2018). Additionally, single-cell trajectory analysis can provide evidence for the differentiation trajectory of SSCs, though it is considered essential that any computationally inferred differentiation trajectories be supported by direct experimental studies. By enabling the discovery of key regulatory factors and cellular interactions, ScRNA-seq technology has greatly advanced SSC research (Chan et al., 2015; Debnath et al., 2018) (Fig. 1C).
SSCs in long bone at different bone development stages
Emergence of embryonic skeletal progenitors and formation of primary ossification center
The limb bud starts to develop around embryonic day (E) 9.5 (forelimb) or E10.5 (hindlimb). By E15.5, hypertrophic chondrocytes release vascular endothelial growth factor A (VEGFA) to facilitate vascular invasion, leading to the formation of the primary ossification center (Gerber et al., 1999) (Fig. 2A and Table 2). As fetal development progresses, the cartilage template is gradually replaced by bone (Zeller et al., 2009). It is believed that the early osteoblasts originate from fetal cartilage and fetal perichondrium (Arostegui et al., 2022). Recent studies have revealed that chondrocytes do not uniformly undergo programmed cell death, but instead, a subset may transform into osteoblast lineage cells and contribute to the formation of the primary ossification center (Yang et al., 2014; Zhou et al., 2014b). Fetal cartilage expresses chondrocyte-specific marker genes, such as Type II collagen alpha 1 chain (Col2a1), collagen, type XI, alpha 2 (Col11a2), and Aggrecan (Acan), as well as SRY-box transcription factor 9 (Sox9) (Ng et al., 1997; Zhao et al., 1997). Sox9 is expressed in chondrocytes, except for hypertrophic chondrocytes (Zhao et al., 1997). Cell fate mapping of Sox9+ cells in early limb development from E 8.0 to E17.0 suggests that all osteo-chondroprogenitor cells are derived from Sox9-expressing precursors (Akiyama et al., 2005). In vivo lineage tracing studies using Acan-creER and Col2a1-creER mice similarly indicate that long-lived, likely multipotent, progenitor populations are marked by these traditionally chondrocyte-associated genes (Ono et al., 2014; Zhou et al., 2014b).
SSCs and skeletal progenitors labeled by lineages.
| Gene | Transgenes | Location | Features | References |
|---|---|---|---|---|
| Col2a1 | Col2a1-Cre | Fetal cartilage, long bone | Multipotent, progenitor populations | (Zhao et al., 1997) |
| Acan | Acan -Cre | Fetal cartilage; long bone growth plate | Primary source of osteoblasts during adolescence | (Shu et al., 2021) |
| Sox9 | Sox9-Cre Sox9-CreERT | Fetal cartilage | All osteo-chondroprogenitor cells | (Shu et al., 2021) |
| Dlx5 | Dlx5-CreER | Perichondrium | Early marker for the perichondrium | (Matsushita et al., 2022) |
| Osx | Osx-Cre Osx-CreER | Fetal perichondrium, growth cartilage | Osx labeled cells are transient | (Mizoguchi et al., 2014) |
| Ctsk | CTSK-mGFP Ctsk-Cre | Long bone and calvarial Periosteum | Label pscs | (Bok et al., 2023; Debnath et al., 2018) |
| PTHrP | PTHrP-mCherry PTHrP-CreER | Long bone growth plate | Located in the resting zone of the postnatal growth plate | (Mizuhashi et al., 2018) |
| LepR | LepR-Cre LepR-CreER | Bone marrow | Primary source of cxcl12 | (Zhou et al. 2014a) |
| Zic1 | Zic1- Cre | Vertebra | Label vsscs | (Sun et al., 2023) |
| Pax1 | Pax1-creERT2 | Vertebra | Label vsscs | (Sun et al., 2023) |
| Gli1 | Gli1-CreERT | Growth plate; craniofacial bones | Widespread and encompass numerous non-ssc populations | (Shi et al., 2017) |
| Prrx1 | Prx1-Cre | Long bones | Labeling almost all skeletal lineage cells in long bones | (Liu et al., 2022) |
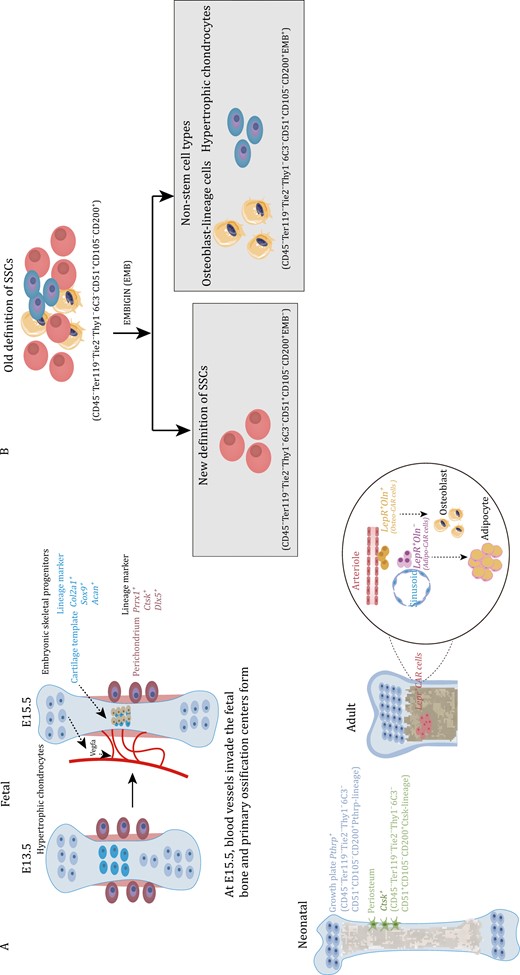
Marker genes of embryonic skeletal progenitors and SSCs at different time points in long bones and the current definition of SSCs immunophenotype. (A) At E15.5, hypertrophic chondrocytes secrete Vegfa to induce blood vessel invasion and form the primary ossification center. Embryonic cartilage templates are labeled by Col2a1, Sox9, and Acan. Perichondrium is labeled by Prrx1, Hox11, Ctsk, and Dlx5. Postnatal SSCs in the growth plate are labeled by Pthrp. Periosteal SSCs are labeled by Ctsk. Lepr+ CAR cells can be distinguished into osteogenic Oln+ cells next to the arteriole and adipogenic Oln− cells next to the sinusoid. (B) The previous immunophenotype of SSCs was defined as Lin−CD200+CD105−THY1−6C3−, which included osteoblasts and hypertrophic chondrocytes. The EMB marker can distinguish the osteoblasts and hypertrophic chondrocytes mixed into SSCs, and the updated immunophenotype of SSCs is now defined as Lin−CD200+CD105−THY1−6C3−EMB−.
The fetal perichondrium surrounds fetal cartilage templates and consists of several layers of elongated fibroblasts (Matsushita et al., 2022). Osterix (Osx)-expressing cells are found in the innermost layer of the perichondrium and were labeled in the perichondrium before the formation of the medullary cavity at E13.5 (Maes et al., 2010; Ono et al., 2014). Upon invasion of blood vessels, the Osx-expressing cells rapidly expand and enter the developing marrow space (Maes et al., 2010; Mizoguchi et al., 2014; Ono et al., 2014). Over time, these cell groups and their descendants gradually differentiate into osteoblasts, leading to the formation of the primary ossification center (Mizoguchi et al., 2014). Ono et al. (2014) conducted a study in which they mapped the fates of Osx+ cell and Col2+ cells, finding that that Osx+ cells in the perichondrium and the marrow space originate from Col2+ cells. This Col2a1, Acan, Sox9, and other chondrocyte markers are likely to broadly label SSCs in addition to labeling chondrocytes, though at least certain SSC populations, such as growth plate resident PTHrP+ cells may have a chondrocytes identity themselves (Mizuhashi et al., 2018). Previous reports have shown that Prrx1-Cre marks all mesenchymal cells at E9.5, and these Prrx1+ cells possess the potential to differentiate into chondrocytes, perichondrial cells, periosteal cells, osteoblasts, and stromal cells, excluding muscle cells (Logan et al., 2002). Hox11 is tightly expressed in the zeugopod perichondrium in Sox9-positive chondrocytes, as well as in Osx-expressing cells (Pineault et al., 2019). Additionally, Cathepsin K (Ctsk), previously known as a mature osteoclast marker, has been found to label a periosteal SSC lineage (PSCs). Ctsk+ periosteal cells were first observed on the perichondrium at E14.5 (Debnath et al., 2018). Although Prrx1-creER, Hoxa11-creER, Sox9-creER, and Axin2-creER have been used to track cell populations on cartilage templates or perichondrium during embryonic stages, it remains uncertain whether these cell populations overlap SSCs (Xie et al., 2022). Matsushita et al. (2022) utilized FACS to sort Col2a1+ cells for scRNA-seq analysis and discovered that Dlx5 can serve as an early marker for the perichondrium. Dlx5-lineage cells primarily contribute to the cortical bone and marrow stromal compartments instead of generating cartilage (Matsushita et al., 2022).
The transcriptional landscape of human limb bud and embryonic long bone was mapped using single-cell sequencing at 5 weeks and 8 weeks post conception (He et al., 2021). The study reveals a specific group of perichondrial progenitors which exhibit strong expression of the adhesion molecule CADM1 and are enriched for the FOXP1/2 transcriptional network (He et al., 2021). Notably, FOXP1/2+ perichondrial progenitors possess the ability to coordinate both endochondral and intramembranous ossification processes, making them pivotal in embryonic development (He et al., 2021). Similar to the fetal cartilage template, the early perichondrial cells have been shown to contribute to the generation of osteoblasts. Although current evidence suggests that fetal cartilage template and perichondrial cells are important sources of osteoblasts, it is still unclear whether there are unique cell populations of embryonic SSCs. Some genes, such as Col2a1, have been confirmed to broadly label SSCs. Additionally, the cartilage template is gradually replaced, but the articular cartilage is not. This raises the question of whether fetal chondrocytes located at a specific location have different SSCs. However, further confirmation regarding this question is still required. Further confirmation is necessary to determine the exact source of the embryonic skeletal progenitors’ group that contributes to early bone formation.
Neonatal SSCs during long bone growth
Following birth, bone undergo a phase of rapid growth, coinciding with the activation of SSCs. Fate-tracing experiments have demonstrated that certain cell types primarily contribute to the process of osteogenesis. Tracing the fate of skeletal progenitor cells using Col2-CreER; R26R-tdTomato mice, who received tamoxifen injection at P3, reveals that Col2-lineage cells harbor the ability to generate metaphyseal and epiphyseal osteoblasts and stromal cells (Ono et al., 2014). Similarly, populations of osteoblasts and stromal cells are also derived from Sox9-CreER and Acan-CreER (Shu et al., 2021). Acan+ cells in the growth plate serve as the primary source of osteoblasts during adolescence, and some of these cells also transit into Leptin receptor (Lepr)+ cells, contributing to the pool of osteoblasts (Shu et al., 2021). Osx+ cells are capable of labeling some skeletal progenitor cells after birth, but Osx labeled cells are transient (Mizoguchi et al., 2014). In Osx-CreERT2; R26R-tdTomato mice, Tomato+ cells labeled at P5 can continue to contribute to marrow stromal cells until 32 weeks (Mizoguchi et al., 2014). Lineage tracing experiments on postnatal skeletal progenitor cells have confirmed their contribution to the pool of osteoblasts. However, it is important to note that these cells not only contain SSCs but also non-stem populations. Therefore, defining the immunotype of SSCs using cell surface markers can help reduce this heterogeneity. Chan et al. conducted a systematic study of postnatal SSCs. They defined SSCs based on surface markers (CD45−Ter119−Tie2−Thy1−6C3−CD51+CD105−CD200+) through FACS and renal capsule transplantation (Chan et al., 2015). The research conducted by Chan and colleagues offers valuable insights into the field of SSC research. Their work systematically explores the immune phenotype of SSCs and effectively illustrates the characteristics and differentiation trajectories of cell populations at different stages, including SSCs and their progeny (Chan et al., 2015). However, the specific anatomical location of this group of FACS-purified SSCs is currently unclear. Ono et al. conducted a study using the knock-in Pthrp-mCherry reporter mice to demonstrate the formation of PTHrP+ chondrocytes (Mizuhashi et al., 2018). PTHrP+ chondrocytes were mainly located in the resting zone of the postnatal growth plate, with a significant increase in their numbers at postnatal time points P6 and P9 (Mizuhashi et al., 2018). These PTHrP-lineage chondrocytes also expressed specific markers for SSCs (Mizuhashi et al., 2018). One notable feature of long bone development after birth is the formation of a secondary ossification center (SOC) (Newton et al., 2019). SSCs also contribute to the formation of a stem cell niche after the SOC is established, allowing for self-renewal of SSCs without depletion (Newton et al., 2019). A specific group of SSCs marked by Ctsk, also characterized by CD45−Ter119−Tie2−Thy1−6C3−CD51+CD105−CD200+ and found in the periosteum, has been confirmed as periosteal stem cells (PSCs) (Debnath et al., 2018). Immunofluorescence imaging has shown that Ctsk+ cells, which include mature osteoclasts, also encompass SSCs, pre-bone, cartilage, and stromal progenitor cells (pre-BCSPs) and bone, cartilage, and stromal progenitor cells (BCSPs) (Debnath et al., 2018). Furthermore, it has been observed that PSCs are highly concentrated in chimeric areas within the neonatal mouse skull (Debnath et al., 2018). This indicates that their primary role is intramembranous ossification rather than endochondral ossification. Additionally, the growth plates and periosteum seem to possess a common set of surface markers of SSCs (Lin−THY1−6C3−CD51+CD200+CD105−) (Mizuhashi et al., 2018). Recent research has also provided evidence of the existence of CD200+CD105−SSCs in vertebral tissues (Sun et al., 2023). Although CD200+CD105− SSCs have been confirmed to be at the top of differentiation in serial transplantation experiments, this population has been shown to express osteocalcin (Ocn), which is a signature marker of the osteoblastic lineage (Matthews et al., 2021). Another study has also confirmed that osteoblast lineage cells express CD200 (Takahashi et al., 2019). In order to update the current SSC definitions, a research for surface markers has confirmed that embigin (EMB) can be used as a marker to distinguish osteoblasts from CD200+CD105−SSCs (Sun et al., 2023) (Fig. 2B). EMB effectively distinguishes SSCs into two groups of cells: EMB− cells and EMB+ cells (Sun et al., 2023). EMB+ cells strongly express osteoblast marker genes, including Alpl, Spp1, and Sp7 (Sun et al., 2023). In vitro mammary fat pad transplantation experiments have confirmed that EMB− cells can generate EMB+ cells, but EMB+ cells cannot generate EMB− cells (Sun et al., 2023). Thus, EMB identifies mature cell types, such as osteoblasts and hypertrophic chondrocytes, that help refine the current stem cell immunophenotypic definitions. Therefore, the immunotype of SSCs has also been updated to Lin−THY1−6C3−CD51+CD200+CD105−EMB− (Sun et al., 2023) (Fig. 2B).
Adult SSCs in long bone maintenance and bone marrow niche
The transition of long bones from birth to adulthood primarily involves a shift from rapid bone growth to the maintenance of bone homeostasis (Clarke, 2008). LepR+ cells, which constitute approximately 0.3% of bone marrow cells, are responsible for the formation of almost all CFU-Fs in the bone marrow (Zhou et al., 2014a). LepR+ cells are the primary source of Cxcl12 (CAR cells), and these stromal cells have also been validated to originate from SSCs in an organoid assay (Bok et al., 2023; Kara et al., 2023). After adolescence, Lepr+ cells become the predominant source of osteoblasts (Shu et al., 2021). Adult long bones mainly consist of Prrx1+ cells, which encompass nearly all skeletal lineages (Yue et al., 2016). When comparing Prrx1-Cre and Lepr-Cre-traced cells in adult long bones through single-cell sequencing, the cells derived from Lepr or Prrx1 can be categorized into nine subsets, which include bone marrow stromal cells (BMSCs), pre-osteoblasts (pre-OBs), osteoblasts (OBs), chondrocytes, αSMA+ cells, and periosteal cells. Both traced cells marked similar numbers of BMSCs, while Prrx1-Cre primarily marks pre-OBs and chondrocytes (Mo et al., 2022; Yue et al., 2016). Additionally, apart from CAR cells found in the bone marrow cavity, there are a subpopulation of CAR cells located in the periosteal membrane that exhibit robust clonogenic and adipogenic differentiation capabilities (Jeffery et al., 2022; Mo et al., 2022). Subpopulations of CAR cells, namely Adipo-CAR cells and Osteo-CAR cells, exhibit distinct localization on the surface of sinusoids or arterioles. These cells function as specialized cytokine-secreting cells within their respective perivascular niches (Baccin et al., 2020). CAR cells in the bone marrow can be categorized into two groups based on Osteolectin (Oln) expression (Shen et al., 2021). The first group consists of periarteriolar Oln+ cells, which differentiate into osteoblasts (Shen et al., 2021). The other group comprises perisinusoidal Oln− cells, which differentiate into adipocytes in homeostasis (Shen et al., 2021) (Fig. 2A). However, it is important to note that this second group of cells also plays a significant role in bone injuries and can later undergo osteogenic transition (Shen et al., 2021). In addition to their role in osteogenesis and adipogenesis, CAR cells in the bone marrow are responsible for maintaining the homeostasis of the bone marrow niche. Deletion of the periarteriolar Oln+ cells leads to a decrease in common lymphoid progenitors and subsequently impairs the immune response in mice (Shen et al., 2021).
Confirmation of vSSCs and induction of spinal metastases
Prrx1-cre is capable of labeling almost all skeletal lineage cells in long bones, but it does not label any skeletal lineage cells in the spine (Liu et al., 2022; Sun et al., 2023). This phenomenon suggests the possible presence of a unique SSCs in the vertebral region. In a recent study, Sun et al. utilized an immunophenotype (Lin−CD200+CD105−THY1−6C3−EMB− cells) to analyze SSCs in the vertebra (vSSCs) (Sun et al., 2023). They found that Zic1 and Pax1 are highly expressed in these vSSCs (Sun et al., 2023) (Fig. 3 and Table 2). Zic1 and Pax1 cells can specifically label vSSCs, but not SSCs in long bones. Importantly, this group of vSSCs demonstrates the ability for in vivo self-renewal and the potential to differentiate into multiple cell lineages (Sun et al., 2023). Knockout of Osx in Zic1+ cells lead to a severe spinal instability, while long bone phenotype remains normal (Sun et al., 2023). Knocking out the osteogenic positive regulatory signal transducer and activator of transcription (STAT3) in Zic1+ cells resulted in bone mass loss, whereas knocking out the negative regulatory factor Schnurri-3 in Zic1+ cells leads to increase of bone mass (Jones et al., 2007; Sun et al., 2023; Zhou et al., 2021). It is worth mentioning that the observed mouse bone phenotypes caused by both knockout experiments were specifically observed in the vertebral body (Jones et al., 2007; Sun et al., 2023; Zhou et al., 2021). It is important to note that vSSCs not only contribute to bone formation but also play a role in tumor metastasis to the spine. Upon injection of breast cancer cells into the circulation, it was observed that more tumor cells metastasized and seeded into the spine compared to the long bones (Sun et al., 2023). This difference cannot be attributed to specific features of blood vessels or the rate of blood flow but is caused by differences between SSCs in long bones and the spine (Sun et al., 2023). The ability of vSSCs to drive tumor cell metastasis has also been demonstrated using bone organoids—3D structures grown in vitro. This difference is also attributed to the fact that vSSCs produce high levels of the protein milk fat globule EGF (Mfge8), which effectively stimulates the migration ability of tumor cells (Sun et al., 2023). Deletion of Mfge8 can significantly reduce the tendency of tumor cells to metastasize to the spine (Sun et al., 2023). The confirmation of vSSCs may not only explain the ease of tumor metastasis, but it may also provide insight into the potential clinical correlation between other spine-related diseases and vSSCs in the future. Furthermore, future research could focus on reducing the risk of spinal cancer metastasis by blocking Mfge8.
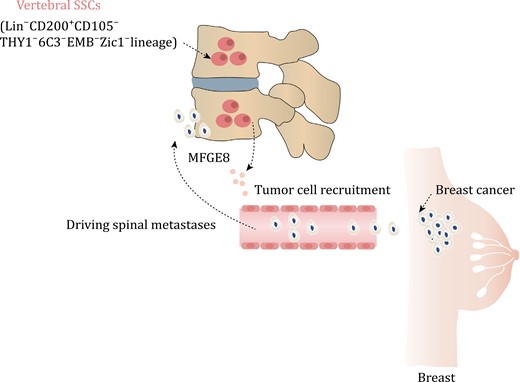
vSSCs driving spinal metastases in breast cancer. The vSSCs, which are characterized by the presence of Zic1, exhibit an immunophenotype of Lin−CD200+CD105−THY1−6C3−EMB−. These vSSCs secrete MFDE8, a molecule that plays a crucial role in attracting breast cancer cells and facilitating their metastasis to the spine.
SSCs in calvarial mineralization and craniosynostosis
The bone formation mode of the calvaria differs significantly from long bones (Maruyama, 2019; Maruyama et al., 2021). The skull primarily relies on intramembranous ossification (He et al., 2021; Wilk et al., 2017). Additionally, the calvaria has a distinct population of SSCs different from long bones and spine (Maruyama, 2019). In long bones, Gli1+ cells mainly label growth plate SSCs after birth and PSCs in adulthood (Shi et al., 2017). However, Gli1+ cells are also expressed in the suture mesenchyme of craniofacial bones postnatally, and they contribute to craniofacial bone turnover in adulthood (Jing et al., 2022; Men et al., 2020; Zhao et al., 2015). The absence of Gli1+ cells results in craniosynostosis and stunted skull growth, highlighting their importance in skull development (Zhao et al., 2015). Combining Gli1+ cells with biodegradable materials can regenerate functional skull sutures and correct deformities (Yu et al., 2021). Gli1+ cells secrete vascular endothelial growth factor-C, which promotes lymphatic endothelial cell proliferation and migration (Ma et al., 2023).
However, Gli1+ cells are widespread and encompass numerous non-SSC populations (Shi et al., 2017). On the other hand, Prrx1 is present in almost all skeletal lineage cells in the long bone marrow, but it is limited to the calvarial suture niche in the skull and decreases with age (Wilk et al., 2017). However, the loss of this population of Prrx1+ cells does not impact skull development. Therefore, unlike long bones, the population of Prrx1-labeled cells in the skull is restricted (Wilk et al., 2017). In long bones, Ctsk+ cells are primarily located in the periosteum and play a crucial role in driving intramembranous ossification (Debnath et al., 2018). These cells are also found enriched in the sagittal suture and skull periosteum (Bok et al., 2023; Debnath et al., 2018). When the gene Twist1 that is mutated in Saethre-Chotzen syndrome is knocked out in Ctsk-lineage cells, it recapitulates the signature craniosynostoiss phenotype associated with Twist1 loss (Bok et al., 2023; Maruyama, 2019; Yu et al., 2021). Interestingly, contrary to expectations, the premature fusion of the skull did not lead to an expansion of Ctsk-lineage cells. Instead, the Ctsk-lineage cells were depleted and replaced by DDR2 (discoidin domain-containing receptor 2) lineage cells (Bok et al., 2023) (Fig. 4 and Table 2). Twist1fl/fl Ctsk-cre mice demonstrate ectopic endochondral ossification in the cranial sutures and the ectopic bone is enriched in DDR2+ cells (Bok et al., 2023). Renal capsule transplantation showed that this group of DDR2+ cells also displayed unique osteogenesis characteristics, with no formation of a bone marrow cavity (Bok et al., 2023). Therefore, under physiological conditions, Ctsk+ cells are responsible for the mineralization and fusion of the skull. In the absence of Ctsk+ SSCs, DDR2+ SSCs differentiate into chondrocytes, contributing to the observed suture fusion (Bok et al., 2023). Both Ctsk+ cells and DDR2+ cells express Gli1, Axin2, and Prrx1, suggesting a partial overlap between Gli1, Axin2, and Prrx1-positive SSCs and Ctsk+ cells and DDR2+ cells (Bok et al., 2023; Maruyama, 2019; Wang et al., 2022; Wilk et al., 2017; Yu et al., 2021). Ctsk+ SSCs can produce insulin-like growth factor-1 (IGF1) to regulate DDR2+ SSCs (Bok et al., 2023). Injection of recombinant IGF1 into TWIST1 knockout mice effectively prevents premature skull fusion (Bok et al., 2023). Therefore, SSCs are more complex than previously thought, and skull SSCs exhibit significant differences under physiological and pathological conditions. This suggests that SSCs in other bones may also exhibit substantial differences under different conditions.
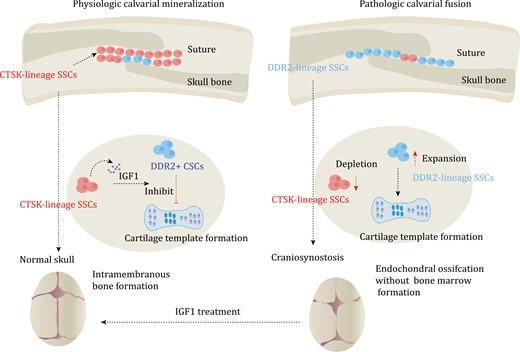
SSCs in calvarial mineralization and craniosynostosis. Calvaria SSCs are labeled by Ctsk. Under normal conditions, Ctsk+ SSCs secrete IGF1 to inhibit endochondral ossification process of DDR2+ SSCs. The process mainly relies on intramembranous ossification, which is dominated by Ctsk+ SSCs. However, in pathologic calvarial fusion, Ctsk+ SSCs become depleted. This depletion leads to the activation of the endochondral ossification process of DDR2+ SSCs, resulting in the occurrence of craniosynostosis. In mice, the administration of IGF1 has been shown to rescue the occurrence of craniosynostosis.
Features of aging SSCs
The occurrence of bone diseases is closely related to aging, but the aging mechanism of SSCs is still unclear. Compared to young SSCs, aging SSCs display reduced activity and loss of SSC diversity (Ambrosi et al., 2021a; Josephson et al., 2019; Murphy et al., 2020). Exposure of aged mice to young circulation through heterochronic parabiosis or systemic reconstitution with young HSCs does not reverse the reduction of osteochondrogenic activity of aged SSCs or improve bone mass and bone healing parameters (Ambrosi et al., 2021a). This suggests that the intrinsic senescence of SSCs is the underlying cause of their reduced activity (Ambrosi et al., 2021a). Furthermore, aging SSCs contribute to creating a pro-inflammatory niche in the bone marrow cavity, leading to aging-related myeloid deviation in HSCs, and promoting osteoclast activation (Ambrosi et al., 2021a). The aging of SSCs leads to a shift in lineage differentiation, which further skews the HSC and results in an increased number of myeloid cell lineages (Ambrosi et al., 2021a). There is also evidence that this aging associated SSC dysfunction may be reversible, as treatment with Bone Morphogenetic Protein-2 (BMP2) and a low-dose CSF1 antagonist restores the fracture healing capacity and mechanical strength of 24-month-old mice, and significantly enhances the osteogenic and clone-forming abilities of SSCs (Ambrosi et al., 2021a) (Fig. 5A). Changes in the bone marrow niche due to aging result in the loss of HSCs and SSCs and the alteration of the differentiation fate of stem cells (Ambrosi et al., 2021a; Mitchell et al., 2023). The aging of bone marrow is a complex process that involves the interaction between aging SSCs and HSCs (Mitchell et al., 2023). The bone marrow niche, consisting of immune cells and endothelial cells, plays a crucial role in maintaining stem cells in inflammatory degenerative environment (Ambrosi and Chan, 2023; Mitchell et al., 2023). However, current research on the niche of SSCs is not fully understood. Therefore, regulation of the SSCs niche and restoring the optimal state of SSCs is a significant area for future research.
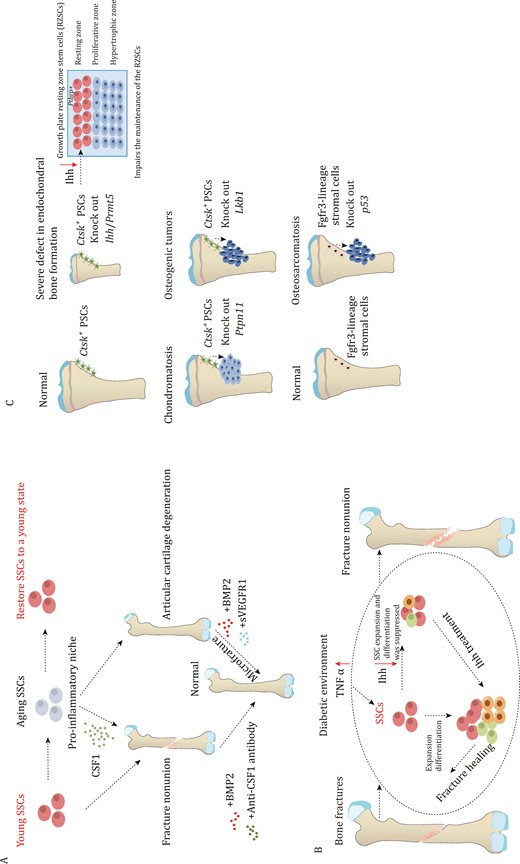
The role of SSCs in bone fracture and bone disease. (A) Aging SSCs can cause a pro-inflammatory niche through secreting CSF1, which leads to poor fracture healing. However, administration of BMP2 and anti-CSF1 antibody improves the healing process. Aging SSCs also lead to articular cartilage degeneration, but administration of BMP2 and sVEGFR1 can help improve this condition. (B) during bone fracture healing, SSCs undergo expansion and enhance their ability to differentiate in order to facilitate the repair process. However, in a diabetic environment, inflammatory signaling pathways are activated, leading to increased secretion of TNFα. This excessive TNFα inhibits Ihh, which, in turn, affects the expansion and differentiation capability of SSCs. Ihh treatment is administered to enhance the vitality of SSCs and improve their ability to repair fractures in the diabetic environment. (C) Mice with Prmt5 knockout in Ctsk+ PSCs display gradual impairments in both intramembranous and endochondral bone formation. The deficiency of Ihh derived from PSCs is responsible for the latter. The deletion of Ctsk+ PSCs-specific Ihh hampers the maintenance of resting zone stem cells, leading to significant abnormalities in postnatal endochondral bone formation. Knocking out Ptpn11 in Ctsk+ PSCs leads to chondromatosis, while lack of Lkb1 leads to osteosarcoma. Additionally, loss p53 in endosteal Fgfr3-lineage stromal cells leads to osteosarcoma.
Role of SSCs in skeletal repair and disease processes
Similar to the bone development process, the fracture repair process also involves both endochondral and intramembranous ossification (Allen et al., 2004; He et al., 2017). The number of SSCs significantly increases after bone fracture, and SSCs that are isolated from fracture callus also show an enhanced capacity for bone formation (Chan et al., 2015) (Fig. 5B). The periosteum plays a crucial role in fracture healing, for instance, osteoblasts derived from PSCs expand in response to the injury and are essential for the healing process. This was supported by the findings from Osxfl/fl; Ctsk-cre mice, which showed significantly impaired fracture healing, indicating the indispensable role of PSC-derived osteoblasts in the healing process (Debnath et al., 2018). Furthermore, it has been observed that obesity and type 2 diabetes significantly hinder the fracture healing ability (Khosla et al., 2020; Tevlin et al., 2017). It was found that compared to non-diabetes mellitus mice, the ability of fracture healing was reduced in the Diabetes mellitus mice. The impaired fracture healing ability is due to a significant reduction in the expansion of SSCs and BCSPs at the fracture sites (Tevlin et al., 2017). Additionally, the elevated level of TNFα caused by Diabetes mellitus systemically inhibits the expression of Indian hedgehog (Ihh) signaling, which suppresses the injury-induced expansion of mSSCs during fracture repair, leading to impaired healing (Tevlin et al., 2017). In contrast to the strong regenerative ability of bone, articular cartilage damage is often considered irreversible (Armiento et al., 2019). Nevertheless, in the microfracture model, SSCs have demonstrated the potential to regenerate articular cartilage with BMP2 application, replacing it with functional cartilage rather than fibrocartilage (Murphy et al., 2020). This restoration of cartilage has the potential to improve the mobility of osteoarthritis mice (Murphy et al., 2020). PSCs play a crucial role not only in intramembranous osteogenesis but also in endochondral ossification (Tsukasaki et al., 2022). Prmt5fl/Δ; Ctsk-Cre mice show bone growth defects, and the absence of PSCs significantly impacts endochondral bone formation (Tsukasaki et al., 2022). This abnormal bone growth is primarily attributed to the deficient secretion of Ihh by PSCs (Tsukasaki et al., 2022). Ihh is essential for bone growth, as evident from the noticeable bone growth impairment observed in Ihhfl/fl; Ctsk-Cre mice (Tsukasaki et al., 2022). These findings underscore the importance of Ctsk+ PSCs in both intramembranous ossification and endochondral ossification (Fig. 5C). SSCs also play a significant role in bone tumorigenesis. Knockout of Ptpn11 in Ctsk-lineage cells leads to chondromatosis (Yang et al., 2013). Moreover, Ctsk-lineage cells with liver kinase b1(LKB1) deletion exhibit a substantial increase in cell numbers and an enhanced ability to differentiate into osteoblasts (Han et al., 2019). Knockout mice of LKB1 in Ctsk-lineage cells result in tumor formation in the periosteum, primarily due to the activation of the mTORC1 pathway (Han et al., 2019). Similarly, the knockout of p53 in endosteal Fgfr3-lineage stromal cells also leads to osteosarcoma with transcriptional features similar to that of human chondroosteosarcoma (Matsushita et al., 2023). A study aims to analyze osteosarcomas using immunohistochemistry to identify a specific subset of osteosarcoma expressing Lepr, indicating that CAR cells are the origin for this particular subset of osteoblastic osteosarcoma (Sosa et al., 2022). These findings suggest that PSCs and bone marrow SSCs serve as the cell of origin for primary skeletal. The occurrence of primary skeletal tumors is predominantly observed in children and adolescents, coinciding with the active period of SSC activity. There is a possibility that SSCs are the cell of origin for primary skeletal tumors, with different SSCs serving as the cell of origin for distinct subsets of primary skeletal tumors.
Conclusions and perspectives
With the identification of markers for SSCs, these pioneering studies have opened a window to understand SSCs, but many important issues remain unclear in this field: (i) the exact spaciotemporal features of SSCs require further research; (ii) the regulation of SSC fate by the niche remains unclear, including the interaction between SSCs and niche components such as endothelial cells, immune cells, and nerves; (iii) the role of SSCs in bone metastasis is still being explored. While it has been confirmed that Mfge8 secreted by a vSSC-lineage drives spinal metastasis in breast cancer, the role of SSCs in lung cancer and prostate cancer, which are also prone to bone metastasis, remains uncertain. Can small molecules targeting SSC-derived skeletal lineages be used to target cancer-driven bone metastasis in the future? (iv) It is still uncertain whether SSCs exhibit abnormalities in genetic bone diseases like osteogenesis imperfecta and Achondroplasia. To summarize, the research on SSCs has made noteworthy advancements in the last decade, shedding light on bone diseases and potentially leading to enhanced treatments.
Abbreviations
- αSMA
α-smooth muscle actin
- Acan
Aggrecan
- Alpl
alkaline phosphatase, biomineralization associated
- BCSPs
bone, cartilage, and stromal progenitor cells
- BMP2
bone morphogenetic protein-2
- BMSCs
bone marrow stromal cells
- CAR cells
Cxcl12-abundant reticular cells
- CFU-F
colony-forming unit-fibroblast
- CLPs
common lymphoid progenitors
- Col2a1
type II collagen alpha 1 chain
- Ctsk
cathepsin K
- Cxcl12
C-X-C motif chemokine ligand 12
- DDR2
discoidin domain-containing receptor 2
- DeaLT
dual-recombinase-activated lineage tracing
- EMB
embigin
- eSSCs
embryonic skeletal stem cells
- FACS
fluorescence-activated cell sorting
- Fgfr3
fibroblast growth factor receptor 3
- FoxA2
forkhead box A2
- Gli1
GLI family zinc finger 1
- HSCs
hematopoietic stem cells
- IGF1
insulin-like growth factor-1
- Ihh
Indian hedgehog
- LKB1
liver kinase b1
- Mfge8
protein milk fat globule EGF8
- MSCs
mesenchymal stem cells
- mTORC1
mechanistic target of rapamycin complex 1
- OBs
osteoblasts
- Ocn
osteocalcin
- OCR
osteochondroreticular
- ocSSCs
osteochondral SSCs
- Oln
, osteolectin
- Osx
oesterix
- pre-BCSPs
precursor bone, cartilage, and stromal progenitor cells
- pre-OBs
pre-osteoblasts
- PSCs
periosteal stem cells
- PTHrP
parathyroid hormone related peptide
- Ptpn11
protein tyrosine phosphatase non-receptor type 11
- pvSSCs
perivascular SSCs
- RanGAP1
Ran GTPase activating protein 1
- ScRNA-seq
single-cell RNA sequencing
- SOC
secondary ossification center
- SOX9
SRY-box transcription factor 9
- Sp7
transcription factor 7
- Spp1
secreted phosphoprotein 1
- SSCs
skeletal stem cells
- STAT3
signal transducer and activator of transcription 3
- TNFα
tumor necrosis factor alpha
- Twist1
twist family bHLH transcription factor 1
- VEGFA
vascular endothelial growth factor A
- vSSCs
vertebral SSCs
- Z24
Zmpste24x
Acknowledgements
This work was supported in part by National Natural Science Foundation of China (Grant nos. 82372362, 81972034, 92068104 to Ren Xu and 82002262 to Na Li), National Key R&D Program of China (2020YFA0112900 to Ren Xu), Natural Science Foundation of Fujian Province (2022J06003 to Ren Xu), and Project of Xiamen Cell Therapy Research, Xiamen, Fujian, China (3502Z20214001). M.B.G. is supported by a Pershing Square MIND Prize award, an Irma T. Hirschl Career Scientist Award, an NIH award R01AR075585, a Career Award for Medical Scientists from the Burroughs Welcome Foundation, a William Rhodes and Louise Tilzer-Rhodes Center for Glioblastoma research award, and a Weill Cornell Medicine Prostate Cancer SPORE Developmental Research Program Award.
Author contributions
R.X. and M.B.G. designed the review; G.Y. performed literature research and wrote the manuscript; X.L. and Y.L. revised and edited the manuscript. All authors approved the final version of this manuscript.
Conflict of interest
None declared.
Consent to participate
All authors were involved in the development of the manuscript’s concept and structure and contributed to editing the manuscript.
Consent for publication
All authors declare that they have no competing interests, and agree to publish this manuscript.
References
Author notes
Guixin Yuan, Xixi Lin and Ying Liu contributed equally to this work.
