


Abstract
Maize (Zea mays) production systems are heavily reliant on the provision of managed inputs such as fertilizers to maximize growth and yield. Hence, the effective use of nitrogen (N) fertilizer is crucial to minimize the associated financial and environmental costs, as well as maximize yield. However, how to effectively utilize N inputs for increased grain yields remains a substantial challenge for maize growers that requires a deeper understanding of the underlying physiological responses to N fertilizer application. We report a multiscale investigation of five field-grown maize hybrids under low or high N supplementation regimes that includes the quantification of phenolic and prenyl-lipid compounds, cellular ultrastructural features, and gene expression traits at three developmental stages of growth. Our results reveal that maize perceives the lack of supplemented N as a stress and, when provided with additional N, will prolong vegetative growth. However, the manifestation of the stress and responses to N supplementation are highly hybrid-specific. Eight genes were differentially expressed in leaves in response to N supplementation in all tested hybrids and at all developmental stages. These genes represent potential biomarkers of N status and include two isoforms of Thiamine Thiazole Synthase involved in vitamin B1 biosynthesis. Our results uncover a detailed view of the physiological responses of maize hybrids to N supplementation in field conditions that provides insight into the interactions between management practices and the genetic diversity within maize.
Introduction
Nitrogen (N) fertilizers are a staple of maize (Zea mays) production in much of the world. Nitrogen is essential to generate the protein machinery that drives all aspects of the growth and development of the maize plant. Hence, insufficient availability of N at any point during the field season interferes with maize productivity on numerous levels, leading to diminished yields or even crop failure. Growers will often provide an application of N fertilizer preplant or at-plant to support seed germination and seedling establishment. Additional applications are often made as either a side-dress application at early vegetative growth stages or as a top-dress application at later growth stages.
Nitrogen fertilizers can be applied in multiple forms, such as urea, ammonia, ammonium, or nitrate, or as a combination of urea and ammonium nitrate (UAN). The form and timing of applications is critical to maximize the benefits to the plant because both will impact the availability of N in the soil. However, even with optimal timing, it is estimated that 35% to 67% of applied N is lost to the plant through denitrification, leaching, and ammonia volatilization (Raun and Johnson 1999; Tilman et al. 2002; Kant et al. 2011).
Because of the large inefficiencies in plant uptake and use of N, there is a strong interest in identifying and developing strategies to enhance N uptake- and use-efficiency in maize (Goodroad and Jellum 1988; Han et al. 2015; Wang et al. 2021). The success of these attempts may depend on how deeply we understand physiological responses to N supplementation and the variability of these responses across germplasm, which can illuminate rationally designed strategies to improve plant physiology. A wealth of information is available regarding N metabolism and physiological responses of maize to N (recently reviewed in Urban et al. (2021), Wani et al. (2021), and Ciampitti and Lemaire (2022)).
The impact of N fertilizer application on grain yield is hybrid-dependent. Certain hybrids, such as B73×Mo17, display a high fertility phenotype in which yield increases continuously with increasing N fertilizer application rate, even up to >400 kg N/ha (Tsai et al. 1984; Albus and Moraghan 1995; Binder et al. 2000; Scharf et al. 2002). This contrasts with low fertility hybrids, such as Pioneer 3732, whose yield-gain plateaus at low N fertilizer rates of as little as 67 kg N/ha (Tsai et al. 1984). Reciprocal crossing experiments between the B73×Mo17 and Pioneer 3732 hybrids indicate that the primary driver of the N response is the rate and duration of grain fill, through effects on N sink strength. Hybrids that are able to maintain a longer duration of grain fill, for example through sustained rates of zein synthesis, can absorb larger amounts of soil N after the mid-silk stage (Tsai et al. 1984, 1992). However, this contrasts with the observation that breeding for improved nitrogen use efficiency and grain yield has led to a decline in grain N content (Haegele et al. 2013; DeBruin et al. 2017). Alternative mechanisms for differing N response have also been proposed, such as variation in maximal crop biomass (Ciampitti and Lemaire 2022).
Plants are exquisitely sensitive to the carbon–nitrogen (C/N) balance and major increases in the C/N ratio often result in a metabolic stress response that in many plants is associated with the induction of anthocyanins and other phenolic compounds (Coruzzi and Bush 2001; Coruzzi and Zhou 2001; Wan et al. 2015), and inhibition of photosynthesis (Stitt and Krapp 1999; Martin et al. 2002; Zheng 2009; Chen et al. 2015). A substantial portion of N in the plant is involved in synthesizing RuBisCO. Indeed, photosynthesis is one of the processes that is most immediately and dramatically affected upon N limitation. Prominent C metabolites include carbohydrates, including simple sugars and complex polymers, structural and storage lipids, and C-skeletons for amino acid biosynthesis. Prominent N metabolites include nitrate, ammonium, proteins, and amino acids that are synthesized by integrating ammonium into C-skeletons (Zheng 2009). One cellular hallmark of general plant stress is the increased size or number of plastoglobule lipid droplets within chloroplasts which represent a carbon sink for the plant (van Wijk and Kessler 2017; Zechmann 2019). Plastoglobules are lipid–protein droplets associated with the thylakoid membrane system, which harbor a distinct and dynamic set of proteins related to lipid metabolism and redox regulation (Vidi et al. 2006; Ytterberg et al. 2006; Lundquist et al. 2012; van Wijk and Kessler 2017; Espinoza-Corral et al. 2021). They also represent a rich store of prenyl-lipid compounds, photosynthetic pigments, and reactive oxygen species (ROS)—scavenging quinones and tocopherols (Lundquist et al. 2012, 2013, 2020). Their dynamic morphology under diverse stresses and their molecular composition suggests an important role in general stress tolerance.
Nitrogen fertilization will hold highly consequential effects on the C/N ratio, but how an optimal C/N ratio is maintained under N supplementation is poorly understood. We hypothesize that the metabolic stress responses are manifested differently at the cellular/molecular levels in different hybrid lines, and that these lines respond differently to N supplementation. Variation in response to N fertilizer among maize hybrids would strongly dictate the ideal rate and timing of N fertilizer application to maximize yield without over-fertilizing. Here, we report our results from a multilevel physiological analysis of five field-grown maize hybrid lines in the presence or absence of a side-dress N application. We identify numerous hybrid-specific effects of side-dress N on phenolic and prenyl-lipid compounds that, together with cellular ultrastructural features, support the hypothesized perception of low N treatment as a stress. Genome-wide transcriptomics identify shared and unique expression patterns among the hybrids, leading to potential transcript markers associated with leaf N status. We conclude that certain hybrids retain photosynthetically active source tissue later into development, which coincides with greater yield. Our results demonstrate numerous hybrid-specific effects on phenolics, prenyl-lipids, and gene expression that may account for the differing responses of ontogenic traits and yield when provided with side-dress N. We provide a broad view of the physiological differences between N response types used in US production agriculture and propose putative biomarkers of N status.
Results
Effects of nitrogen treatment on grain harvest traits differ in magnitude among five maize hybrid lines
To understand the response of maize hybrids to N supplementation, we tested five hybrids planted at the Michigan State University research fields in 2020 (i.e. B73×Mo17, B73×PHN82, B73×PHZ51, PHB47×PHN82, and LH195×PHN82), representing foundational maize breeding germplasm pools from both the public and private sectors (Fig. 1). B73 and Mo17 represent the stiff-stalk and nonstiff-stalk heterotic pools, respectively (Smith et al. 1985; Troyer 1999; Schnable et al. 2009; Bornowski et al. 2021), and the respective hybrid has been previously classified as highly responsive to N fertilizer application, for example as a side-dress application (Tsai et al. 1984). We chose the remaining as representative of the parents of current commercial agricultural hybrids. We sowed seeds with 26 pounds of N per acre applied at planting, and N-fertilized plants (high N) received an additional 122 pounds of N per acre 24 d after planting (DAP, V4-V5 developmental stage) as a side-dress application, while N-limited (low N) plants received no additional N application. The application rate of 148 pounds per acre, reflected in the high N treatment, represents an economically logical level seen across the upper midwest.
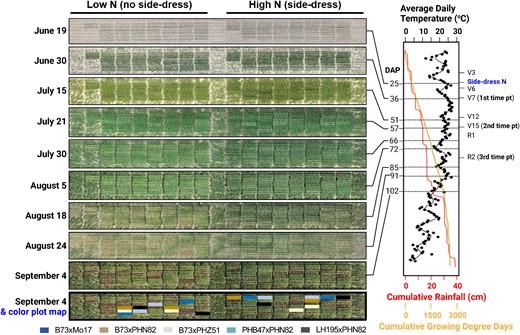
Plot design, timeline, and weather during 2020 field experiment. Each of the five tested hybrids were grown in four field plots at the Michigan State University research fields, in which two field plots received a side-dress N application (right) and two field plots did not receive a side-dress N application. The form and application rates of the side-dress N are described in Materials and methods. Aerial drone images of the field plots were collected on nine dates during the 2020 growing season, as indicated to the left of each image. The five hybrids described in this work were grown among a larger set of 21 hybrids, and their plot locations within the field are indicated with a map panel shown below the aerial images. To the right of the aerial drone images are graphs of daily temperature (black), cumulative growing degree days (orange), and cumulative rainfall patterns (red) during the growing season, which are aligned with the dates of each of the aerial drone images (left) and key developmental and sampling time points (right). DAP, days after planting. Planting occurred on May 25, 2020.
We measured multiple ontogenic and grain harvest traits during the course of the growing season, including the moisture-adjusted yield and anthesis-silking interval (ASI; Supplemental Table S1). As expected, grain yield responded positively to the side-dress N application (Fig. 2, Table 1; Supplemental Table S2), however the magnitude of the yield increase was highly dependent on the particular hybrid line; PHB47×PHN82 yield increased by over 100 bu/acre, representing a tripling of the yield, whereas B73×PHZ51 increased by only about 20 bu/acre (Table 1; Supplemental Table S2). Similarly, the response of grain moisture content and ASI were directionally consistent among the hybrids, although the magnitudes varied substantially. Moisture content of harvested grain also increased in response to high N among each hybrid, ranging from an increase of 5.4% to 13.9% (Table 1; Supplemental Table S2).
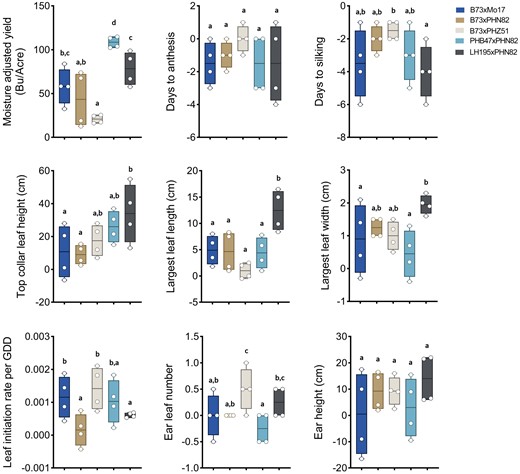
Response of agronomic traits to side-dress N application among each of the five selected maize hybrids. Nine traits are presented, each plotted as the response to side-dress N, i.e. the difference between maize grown in the presence and absence of the side-dress N application. An average measurement from four plants in each of two field plots was used to calculate the response to side-dress N by subtracting a measurement in the absence of side-dress N from a measurement in the presence of side-dress N, using each pairwise combination, for a total of four plotted values for each hybrid. Moisture adjusted yield was normalized to a 15.5% (w/w) moisture content. Individual data points, are displayed as open circles overlaid upon box and whisker plots that indicate the max, min, and 25th, 50th, and 75th percentiles. Statistically significant differences between hybrids were determined using Tukey's HSD test with 95% confidence interval using letter codes, n = 4 individual plants. GDD, growing degree days.
Effect of side-dress N treatment on selected agronomic traits
| Normalized yield | Anthesis-silking interval | Moisture | ||||||
|---|---|---|---|---|---|---|---|---|
| Pedigree | Plot | Treatment | (bu/acre)a | P-value | (d) | P-value | (%) | P-value |
| B73×Mo17 | 1 | Low | 58.2 | 0.085 | −4 | 0.184 | 4.9 | 0.183 |
| 2 | Low | 84.1 | −2 | 14.4 | ||||
| 3 | High | 142.1 | −1 | 28.7 | ||||
| 4 | High | 116.6 | −1 | 18.5 | ||||
| B73×PHN82 | 1 | Low | 98.2 | 0.258 | −2 | 0.423 | 15.4 | 0.310 |
| 2 | Low | 91.8 | −4 | 25.4 | ||||
| 3 | High | 165.8 | −2 | 27.1 | ||||
| 4 | High | 110.9 | −2 | 27.2 | ||||
| B73×PHZ51 | 1 | Low | 68.1 | 0.037 | −2 | 0.095 | 12.6 | 0.416 |
| 2 | Low | 76.3 | −1 | 13.0 | ||||
| 3 | High | 93.6 | 0 | 12.9 | ||||
| 4 | High | 92.5 | 0 | 23.4 | ||||
| LH195×PHN82 | 1 | Low | 68.7 | 0.042 | −4 | 0.155 | 26.8 | 0.303 |
| 2 | Low | 100.7 | −3 | 12.5 | ||||
| 3 | High | 167.6 | −2 | 29.0 | ||||
| 4 | High | 158.4 | 0 | 30.0 | ||||
| PHB47×PHN82 | 1 | Low | 60.0 | 0.003 | −3 | 0.312 | 13.3 | 0.000 |
| 2 | Low | 58.5 | −1 | 13.0 | ||||
| 3 | High | 162.3 | −1 | 25.9 | ||||
| 4 | High | 173.4 | 0 | 26.2 | ||||
aYield has been normalized to a 15.5% moisture content as is customary in the industry.
We interpreted moisture content as an indicator of grain maturity at the time of harvest. The increased moisture content that we observed in the lines (Table 1) is consistent with the plants going through an extended maturation period induced by the high N treatment. With the data available, it remains inconclusive whether this pattern is a consequence of an extended grain filling period, or a delay in dry-down of the grain. Based on subsequent results from the following year (see Variability between field seasons in maize hybrid responses to nitrogen supplementation, below) we find that moisture content is also highly dependent on environmental conditions and the timing of harvest. In contrast to grain moisture, the ASI decreased in response to high N in all hybrids (Table 1), indicating a smaller gap in time between tasseling and silking, beneficial for efficient pollination. Overall, our results indicate that the response of yield-related traits to side-dress N, while directionally consistent, varies substantially in magnitude among the five tested hybrid lines.
Morphological and developmental responses to nitrogen supplementation
To more fully establish the effects of N supplementation, we then calculated each ontogenic and agronomic trait as a response to side-dress N (Resp2N). The ear height Resp2N was generally consistent between the five hybrids, increasing an average of about 10 cm with the supplementation (Fig. 2). Likewise, the days to anthesis and days to silking were both shortened under N supplementation, though the effect on silking was greater than on anthesis, leading to a smaller ASI, beneficial for efficient pollination (Fig. 2; Table 1). In contrast, the Resp2N of the top collar leaf height (proxy for plant height) was dependent on the hybrid. While LH195×PHN82 gained the most height in response to side-dress N (30 to 40 cm), the B73×Mo17 hybrid gained only an average of about 10 cm. The length and width of the largest leaf was also particularly responsive to the side-dress N application, gaining 5 to 15 cm. Notably, the LH195×PHN82 hybrid was again the most responsive, as seen already for the top collar leaf height.
To identify possible traits that correlate with yield across all five hybrids, we calculated pairwise Pearson correlation coefficients (PCCs) between each trait and the moisture adjusted yield (Supplemental Fig. S1). A modest positive correlation with yield was found for total plant height (PCC of 0.50) and modest negative correlation for silking date (PCC of −0.53). The lack of a more dramatic correlation between our measured traits and grain yield may indicate that different hybrids use different growth strategies to maximize yield; however, this can be better explored in the future using a larger panel of genotypes.
Metabolic responses to side-dress N are likely to underlie these effects on growth and development. For example, chlorophyll content is strongly correlated to maize leaf N content and grain yield (Chapman and Barreto 1997). Consistent with this, the leaf tissue color seen in the aerial drone images (Fig. 1) and during on-site field visits indicated that chlorophyll is positively impacted by the provision of side-dress N, indicative of a N deficiency in the absence of side-dress N. Likewise, a number of phenolic acids are induced by increased N fertilization levels (Ganie et al. 2016), yet the effect of N side-dress on phenylpropanoids and flavonoids has not been fully evaluated.
Leaf phenolic and photosynthetic compounds are affected by N supplementation primarily in a hybrid-specific manner
We then investigated the impact of N supplementation on leaf biochemicals, focusing on phenolic compounds and chloroplast-resident prenyl-lipids. We profiled a total of 12 distinct prenyl-lipids, including photosynthetic pigments and redox-active electron carriers, and 29 phenolic compounds, including flavonoids, phenylpropanoids, and the phenylalanine pathway precursors in maize leaf tissue at V7, V15, and R2 developmental stages (Supplemental Tables S1, S3, S4, and S5). These stages were selected to capture a broad range of times in the growing season and a diversity of developmental stages representing vegetative or reproductive growth (V7 and R2, respectively), or near the transition point between vegetative and visible reproductive growth (V15). Compounds were extracted from the top-most collared leaf at the V7 stage, and from the top-most ear leaf at the V15 and R2 stages.
Principal component analysis (PCA) failed to segregate samples by N treatment or genotype, however a clear segregation was made when comparing the V7 with the V15 and R2 developmental stages among phenolic compounds (Supplemental Figs. S2 and S3). This indicates that changes to the phenolic and prenyl-lipid profiles during the transition from vegetative to reproductive growth are shared broadly among the five hybrids. Consistent with this notion, it was observed that multiple individual phenolic compounds declined substantially during plant development irrespective of the hybrid (Figs. 3 and 4; Supplemental Tables S1, S3, and S4). By plotting the log2-fold change of individual compounds in response to the side-dress N, it is clear that phenolics tended to be reduced in response to the N treatment, while changes to prenyl-lipid compounds were more muted and tended to increase under side-dress N (Fig. 3).
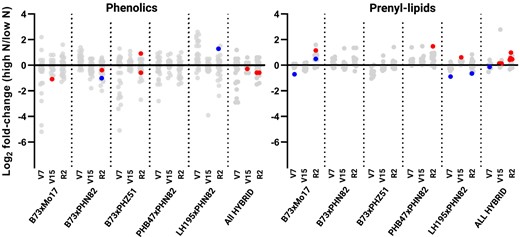
Change in prenyl-lipid and phenolic levels in leaves of five maize hybrids in response to side-dress N. The top collared leaf was sampled at V7 and the topmost ear leaf was sampled at V15 and R2 and 29 phenolic compounds and 12 prenyl-lipid compounds were extracted, identified and quantified. The log2 fold-change of the average values (n = 4 biological replicates) of each phenolic (left) and prenyl-lipid (right) in the presence or absence of a side-dress N application is presented. Each compound is represented by a single dot. Compounds with a statistically significant change determined by two-way ANOVA are marked with red dots (P < 0.01) or blue dots (P < 0.05).
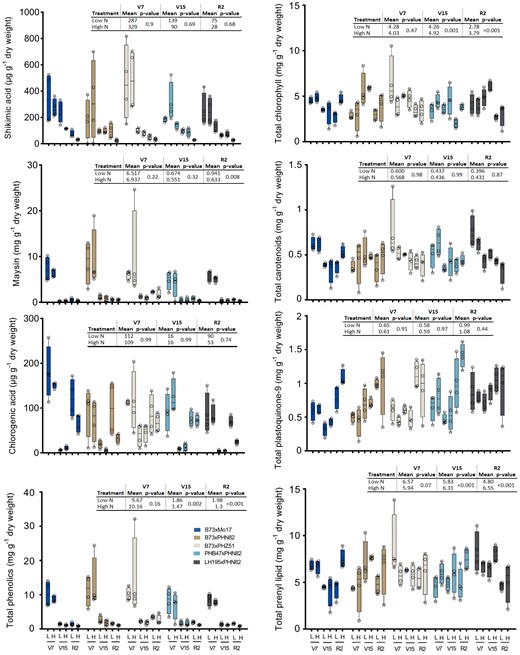
Selected metabolite levels in leaves of five maize hybrids. The top collared leaf was sampled at V7 and the topmost ear leaf was sampled at V15 and R2 and 29 phenolic compounds and 12 prenyl-lipid compounds were extracted, identified and quantified. Measured concentrations of shikimic acid, chlorogenic acid, maysin, total phenolics, chlorophylls, carotenoids, plastoquinone (oxidized and reduced), and total prenyl lipids are presented. Individual data points are plotted as open circles overlaid upon box and whisker plots that indicate the maximum, minimum, and 25th, 50th, and 75th percentiles. n = 4 individual plants. Insets indicate N treatment effect across all five hybrids with adjusted P-value according to Tukey's HSD.
Although the PCA did not separate the high and low N treatments among phenolics or prenyl-lipids, multiple compounds were responsive to side-dress N application (Figs. 3 and 4; Supplemental Tables S1, S3, and S4). First, considering the phenolics, shikimate, and quinic acid levels decreased substantially during the course of development, and the rate of decline accelerated when receiving side-dress N (Fig. 4; Supplemental Fig. S4). Similarly, in all hybrids, ferulic acid was reduced at the R2 stage in response to side-dress N (Supplemental Fig. S4). Notably, the total pool of phenolic compounds declined substantially during the course of development and was consistently lower in high N at the R2 stage in all five hybrids (Fig. 4). The majority of the phenolic pool at each developmental stage was contributed by the silk insecticidal C-glycosyl flavone maysin (ca. 35% to 70%), which declined substantially during development, and this decline was accelerated by N treatment as seen with shikimate and quinic acid (Fig. 4).
In addition to these N responses shared across all hybrids, many hybrid-specific N responsive effects were observed among the phenolic compounds. Total chlorogenic acid was suppressed by side-dress N application at the R2 stage specifically in the B73×Mo17, B73×PHN82, and LH195×PHN82 lines (Fig. 4). Apart from the N effects on chlorogenic acid levels, this compound showed a surprising development-dependent pattern in which it was strongly suppressed from the V7 to the V15 stage but was largely restored at the R2 stage. At the R2 stage, p-coumaric acid was substantially elevated under side-dress N in the B73×PHZ51 lines, but substantially reduced in the B73×PHN82 line (Supplemental Table S4). Similarly, apigenidin was substantially elevated under side-dress N in LH195×PHN82 but was unaffected by N in the other four lines. While maysin and chlorogenic acid have been associated with pathogen/herbivore tolerance in silks and other maize tissues (Waiss et al. 1979; Reese et al. 1982; Atanasova-Penichon et al. 2012), chrysoeriol is a precursor of tricin, a flavone that can function as lignin monomer (Lan et al. 2016).
Considering the prenyl-lipid compounds, chlorophyll levels tended to decline from V15 to R2 stage in the absence of side-dress N. As expected, this decline was strongly muted in the presence of side-dress N, but only in B73×Mo17 and PHB47×PHN82 (Fig. 3, Supplemental Fig. S5). In contrast, in B73×PHZ51 and LH195×PHN82, chlorophyll and carotenoid levels were essentially unchanged by N treatment. The pattern seen in B73×Mo17 was particularly curious since chlorophyll and carotenoid levels increased from V15 to R2 when provided with side-dress N (Fig. 4). These patterns suggest that the increased availability of N in the soil supports photosynthetically active leaf tissue to widely varying degrees across the five hybrids. This conclusion was supported by the patterns seen with the quinone compounds which are redox active and essential as electron carriers in the photosynthetic electron transport chain. Effect of N on levels of plastoquinone (oxidized + reduced forms; PQ) and phylloquinone were also highly hybrid-specific and generally followed the patterns seen with the pigments (Supplemental Table S5). At the R2 stage, phylloquinone was most strongly elevated by side-dress N in B73×Mo17 and PHB47×PHN82, the same lines with a clear increase of chlorophylls. In contrast, phylloquinone was unaffected by N in B73×PHN82 and B73×PHZ51 at R2. Similarly, PQ was most strongly elevated by side-dress N in the lines with elevated chlorophylls and phylloquinone, B73×Mo17 and PHB47×PHN82, albeit without statistical significance using two-way ANOVA (Fig. 4, Supplemental Table S5). Pheophorbide a is a derivative of chlorophyll a in which the lipophilic phytyl tail is absent. It is an intermediate of chlorophyll biosynthesis and degradation (Hortensteiner and Krautler 2011; Hortensteiner 2013). In general, pheophorbide a was lower at V15, and higher at V7 and R2, except in LH195×PHN82 (Supplemental Fig. S4). Pheophorbide a levels tended to be elevated by side-dress N at R2 across the hybrids. However, at the V7 stage, hybrid-specific effects were seen; B73×Mo17 and LH195×PHN82 were significantly reduced by side-dress N, whereas B73×PHZ51 was unaffected and PHB47×PHN82 was actually elevated by side-dress N, albeit without statistical significance.
We also noted that levels of PQ were higher at R2 in all hybrids, though to widely varying degrees; most strongly in B73×Mo17 where levels nearly tripled when provided with side-dress N and nearly doubled in the absence of side-dress N. This contrasts sharply with the declining levels of chlorophylls, carotenoids, and phylloquinone seen in all hybrids from the V15 to the R2 stage (Fig. 4). The retention of PQ, despite the apparent reduction in photosynthetic capacity, may signify the plant's use of PQ as a ROS scavenger to cope with oxidative stress at the R2 stage, during the disassembly of the photosynthetic machinery. The retention of PQ at the R2 stage is consistent with the prevalence of plastoglobules during developmental transitions (Rottet et al. 2015; van Wijk and Kessler 2017) which store large quantities of PQ.
Cell wall thickness and plastoglobule morphology are responsive to N status and indicate initiation of senescence at V15 stage in the absence of side-dress N
Prenyl-lipid responses indicate that photosynthetically active tissue is retained longer under side-dress N, particularly in the B73×Mo17 hybrid. Plastoglobules represent a rich site of prenyl-lipid accumulation, as well as the site of multiple prenyl-lipid metabolic steps. Furthermore, plastoglobule morphology—in particular large increases in size or abundance—can serve as a diagnostic marker of general stress (Zechmann 2019). For these reasons, we considered whether plastoglobule morphology or prevalence may be impacted by the N treatment. To investigate this question, we analyzed effects of side-dress N on cellular ultrastructure in the five hybrids. We focused on traits expected to reflect prevailing stress (plastoglobule size and prevalence) and carbon sequestration efficiency (cell wall thickness).
Cell wall thickness was indistinguishable across each of the hybrids and, as expected, was substantially greater in bundle sheath (BS) cells which comprise extensive suberized secondary cell walls. Cell wall thickness of both cell types decreased in response to the side-dress N by 10% to 15%, although responses to N within individual hybrids were not statistically significant (Fig. 5, Supplemental Fig. S5, Supplemental Tables S1 and S3). It appears that a general thickening of the mesophyll (M) and BS cell walls occurs as a general response to low N amongst the five hybrids, but likely could not be discerned within each hybrid due to the relatively low number of three biological replicates.
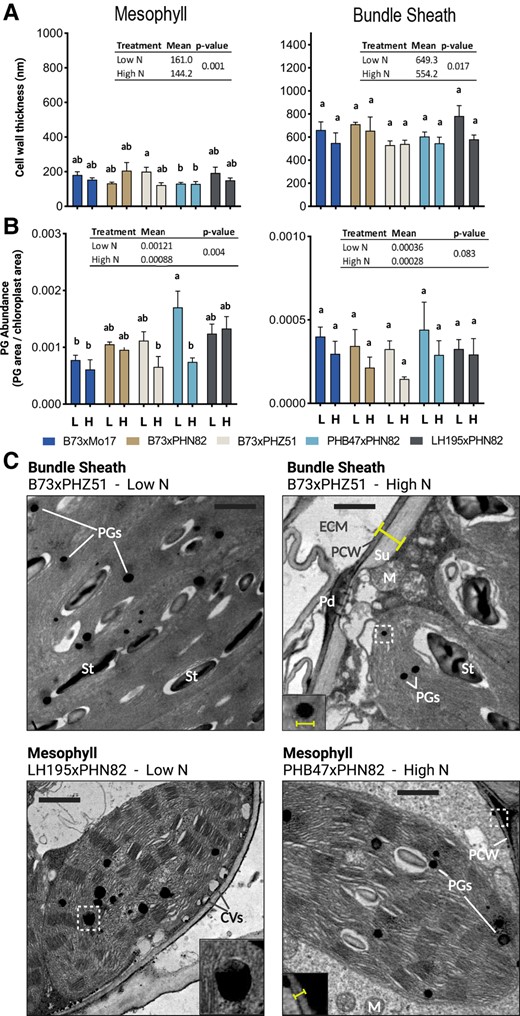
Quantification of cellular ultrastructural features at V15 reveal hybrid-specific effects on plastoglobule morphology and cell wall thickness. A) Cell wall thicknesses were measured from a minimum of three electron micrographs for each biological replicate (i.e. an individual maize plant). All measured thicknesses from each biological replicate were averaged to produce a single thickness value for each biological replicate that was then calculated and plotted as mean ± 1 SEM, n = 4. Statistical significance is indicated by letter code using Tukey's HSD with 95% confidence interval. Insets indicate N treatment effect on each trait with adjusted P-value according to Tukey's HSD. B) Plastoglobule (PG) cross-sectional diameters were measured for all plastoglobules visible within a minimum of five electron micrographs for each biological replicate (i.e. an individual maize plant). All measured diameters from each biological replicate were averaged to produce a single diameter value for each biological replicate that was then calculated and plotted as mean ± 1 SEM, n = 4. Statistical significance is indicated by letter code using Tukey's HSD with 95% confidence interval. Insets indicate N treatment effect on each trait with adjusted P-value according to Tukey's HSD. C) Representative electron micrographs from BS (top) and mesophyll (bottom), low N (left) and high N (right) conditions are presented from various hybrids. Yellow markings indicate how cell wall thickness and plastoglobule diameter were measured. Letters highlight selected ultrastructural features, including the extracellular matrix (ECM), primary cell wall (PCW), the suberin layer of the cell wall (Su), starch grains (St), mitochondria (M), plasmodesmal pits (Pd), cytosolic vesicles (CVs), and plastogobules (PGs). Regions highlighted in the insets are marked with dashed white boxes. All micrographs are shown at the same scale, black scale bars indicate 1 μm.
Morphology of the plastoglobules (abundance and size) was responsive to side-dress N in both M and BS cells when the analysis was done considering all the hybrids as a group, with a clear reduction of both plastoglobule size (cross-sectional diameter) and plastoglobule abundance (cross-sectional area of the plastoglobules normalized to the cross-sectional area of the chloroplast; Fig. 5, Supplemental Fig. S5, Supplemental Tables S1 and S3). Hybrid-specific effects were also observed in M cells. Plastoglobule abundance was reduced by half in M cells of the PHB47×PHN82 hybrid, while plastoglobule size was reduced in the B73×PHZ51 hybrid. Because these same trends can generally be seen in the other hybrids and an N-treatment effect is clearly observed across pooled hybrids, we conclude that reduction of plastoglobule size and abundance are general responses amongst the tested hybrids, particularly in M cells. To explore the possible significance of hybrid-specific effects on plastoglobule morphology, we also looked at correlations between plastoglobule size or abundance in each cell type with prenyl-lipid traits. While no correlation could be found with any carotenoid or chlorophyll compound, a weak positive correlation was seen between PQ levels and M plastoglobule size in four of the five hybrids (Supplemental Fig. S6), consistent with the large pool size of PQ in this nonphotosynthetically active site (Ksas et al. 2018, 2022; Havaux 2020).
Several unusual plastoglobule ultrastructural features were observed that are indicative of senescence. First, plastoglobules were often found in a crescent-shaped pattern in all hybrids except LH195×PHN82 (Fig. 6A). That the crescent-shaped patterns were typically found in cells undergoing apparent cellular disassembly—evidenced by partially dissolved chloroplast envelopes, wavy and swollen thylakoids, and large amounts of small amorphous electron-opaque material in the cytosol—supported the notion that these patterns did not arise as artifacts of tissue processing. In fact, such a crescent-shaped pattern of plastoglobules has been reported previously in senescing Taxus baccata leaf tissue (Cunninghame et al. 1979). This pattern may reflect plastoglobules undergoing large-scale lipolytic activity on one side, which may be anticipated during cellular degeneration. Second, in two independent chloroplasts of a B73×Mo17 low N sample we observed plastoglobules spanning the envelope membrane (Fig. 6B), as previously observed in senescing watermelon (Citrullus lanatus) leaves (Liu 2016), and a large cytosolic lipid droplet in contact with a chloroplast (Fig. 6C). These unique ultrastructural features (crescent-shaped and envelope-spanning plastoglobules) have been previously associated with senescing leaf tissue and suggest that low N-treated plants have initiated senescence in at least four of the five hybrid lines. The absence of the crescent-shaped plastoglobules in LH195×PHN82 is notable and may indicate this genotype prolongs vegetative growth for a longer time than the other genotypes in the absence of side-dress N.
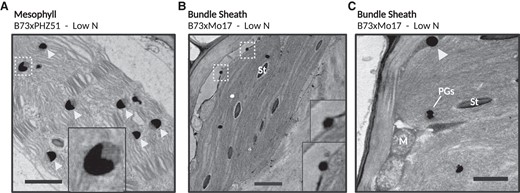
Unusual plastoglobule ultrastructural features are observed in low N-treated maize leaves at the V15 developmental stage. A) A representative micrograph of a mesophyll cell chloroplast with crescent-shaped plastoglobules, indicated with light gray arrowheads. B) Two plastoglobules were observed to span the chloroplast envelope membrane in this BS cell from B73×Mo17, both of which are magnified in the insets. C) In another instance from a B73×Mo17 BS cell, a lipid droplet was observed in contact with a chloroplast, indicated with a light gray arrowhead. The location of the insets are denoted with dashed white line. PGs, plastoglobules; St, starch, M, mitochondria. Black scale bars indicate 1 μm.
Broad effects on the leaf transcriptome identify biomarkers of leaf N status
To determine the effects of N supplementation on the transcriptome, we carried out BRB-seq (Alpern et al. 2019) on mRNA extracted from the same material utilized for the metabolic analyses. For each hybrid and biological replicate, we aligned reads to the B73 v5 genome (Supplemental Table S6) and determined that the number of genes represented in the BRB-seq data is similar between the different hybrids, providing evidence that there was not significant bias arising from the use of the B73 genome as reference. PCA shows that biological replicates clustered together, indicating reproducibility (Supplemental Fig. S7).
The effect of hybrid, treatment, and developmental stage on mRNA accumulation patterns was assessed by calculating the partial η2 values from ANOVA results on PC1 loadings (see Materials and methods). Developmental stage was the largest contributor toward PC1 variance (η2= 0.89), followed by treatment (η2= 0.37) and hybrid (η2= 0.31) (Supplemental Table S7). Samples were then subset by development stage to assess the effects at each time point, and a similar process was performed to calculate the effect of treatment and hybrid on gene expression at each individual time point. While N treatment explained a small proportion of the mRNA accumulation at the earliest developmental state, by the R2 stage N treatment was the dominant component (Table 2). We then evaluated differentially expressed genes (DEGs) between treatments at each development stage while controlling for hybrid type in the DESeq2 experimental design. This has the advantage of increasing the number of replications per N treatment level from four on a per hybrid level to 20 when bulked. Consequently, the analysis has more power to detect meaningful differences (Liu et al. 2014). We calculated the correlation of all 1,368 DEGs at the V15 stage with yield and found a bimodal distribution peaking around −0.5 and 0.5 (Fig. 7A). The almost complete absence of genes around a correlation coefficient of 0 indicates that nearly all DEGs at this stage associate either negatively or positively with yield. Among these DEGs, Zm00001eb433500 (cytokinin response regulator 2) was the most positively correlated (r = 0.73) and Zm00001eb294790 (threonine synthase 2) was the most negatively correlated (r = −0.68).
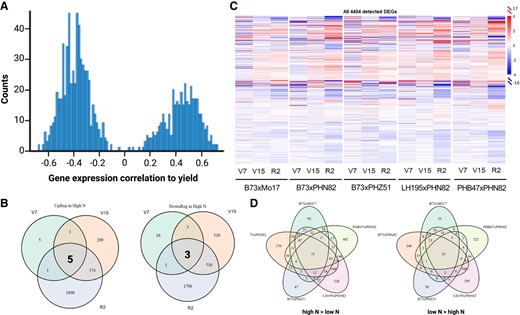
BRB-seq reveals mRNA accumulation patterns across hybrids and in response to side-dress N. A) Histogram of the Pearson correlation coefficients between each of the 1,368 DEGs at V15 stage genes with yield. B) Intersection of temporally conserved genes from bulk analysis. C) Heatmap of all 4,454 genes that are differentially expressed (with P-value <0.05) in at least one hybrid-developmental stage combination. D) Intersection of DEGs at R2 that are enhanced by side-dress N (left) and repressed by side-dress N (right).
Statistics of BRB-seq analysis
| DevStage | V7 | V15 | R2 |
|---|---|---|---|
| PC1 explained variance | 0.34 | 0.36 | 0.50 |
| SS proportion pedigree | 0.48 | 0.23 | 0.03 |
| SS proportion treatment | 0.00 | 0.11 | 0.83 |
| DevStage | V7 | V15 | R2 |
|---|---|---|---|
| PC1 explained variance | 0.34 | 0.36 | 0.50 |
| SS proportion pedigree | 0.48 | 0.23 | 0.03 |
| SS proportion treatment | 0.00 | 0.11 | 0.83 |
Thirty-seven DEGs were detected at the V7 stage (11 d after side-dress), 1,503 at V15, and 4,580 at R2, the latter corresponding to ∼11% of ∼40,000 genes in the B73 v5 reference genome (Supplemental Fig. S8). A total of eight genes were differentially expressed at all three developmental stages; five induced by N and three repressed by N (Fig. 7B, Table 3). Remarkably two of the repressed genes encoded isoforms of Thiamine Thiazole Synthase (THI4; Thi1 and Thi2) of the thiamine (vitamin B1) biosynthetic pathway, while two induced genes were associated with the circadian clock. Thiamine is implicated in abiotic and biotic plant stress responses, with upregulation of thiamine biosynthesis observed under multiple stresses (Goyer 2010; Fitzpatrick and Chapman 2020; Rosado-Souza et al. 2020). Thus, the repression of these genes in response to N treatment is consistent with maize sensing low N treatment as a stress even at the relatively early V7 stage. Due to the bulked nature of the analysis, it is possible that one or two hybrids bias results, so a three-way ANOVA was done to determine interaction effects between hybrid, treatment, and development stage on expression of Thi1 and Thi2.<***> For Thi1 there was no evidence for any possible two- or three-way interaction at P < 0.05. For Thi2, there was only evidence for treatment × developmental stage effects (P = 0.02). This indicates that regulation of the thiamine biosynthesis pathway through repression of Thi1 and Thi2 transcription is observed in all tested hybrids and at all developmental stages, suggesting they may represent robust indicators of plant N status.
Eight genes responsive to N side-dress at all three developmental stages
| N-response (log2 fold-change)b | ||||
|---|---|---|---|---|
| Gene accession | Namea | V7 | V15 | R2 |
| Zm00001eb081060 | Protein disulfide isomerase | 0.43 | 0.62 | 0.75 |
| Zm00001eb159850 | Thiamine thiazole synthase | −1.26 | −1.28 | −0.88 |
| Zm00001eb356910 | Thiamine thiazole synthase | −0.53 | −0.52 | −0.35 |
| Zm00001eb286760 | Glycosidase-like protein | 1.58 | 0.84 | 1.76 |
| Zm00001eb310450 | TauE/SafE-like sulfite exporter | 0.72 | 0.68 | 0.73 |
| Zm00001eb415760 | Circadian clock associated—uncharacterized | 0.60 | 0.49 | 0.45 |
| Zm00001eb172450 | Circadian clock associated (DNA-binding transcriptional regulator) | 0.60 | 0.57 | 0.52 |
| Zm00001eb314220 | Cys Protease | −0.61 | −0.80 | −0.91 |
aNames are acquired from UniProtKB and MaizeGDB.
bP-value <0.05.
To understand the genetic responses to N treatment and how they differ between hybrids, DEGs were evaluated independently within each hybrid at the three developmental stages (Fig. 7B) and sorted into those that showed significantly higher mRNA accumulation after N treatment (high N > low N) or significantly lower mRNA accumulation following N treatment (low N > high N, Supplemental Fig. S8). The total number of genes affected by N is significantly larger in R2 (total of 3,814 DEGs), followed by V15 (total of 1,368 DEGs), and only 49 total genes differentially expressed in V7 (Supplemental Fig. S8, Supplemental Table S7). When considering DEGs with at least a 2-fold difference, ∼1% of the 4,454 DEGs are affected at V7, ∼5% at V15, and ∼11% at R2 (Supplemental Table S8). Thus, many genes are affected by N, with the maximum impact at R2. No matter how the data are analyzed, the number of genes that are positively or negatively affected by N is comparable. Indeed, responses to many environmental and developmental signals result in combinations of upregulated and downregulated genes (Pope and Medzhitov 2018; Himanen and Sistonen 2019) and each set is likely to participate in distinct sets of cellular functions.
Out of the 4,454 genes affected by N in at least one line in at least one developmental stage, very few genes are affected in all five hybrids (Fig. 7C). How many genes are affected by N in all hybrids depends on how the data is analyzed. If we consider the overlap between the genes affected in each hybrid at each developmental stage, then we find that 72 genes were induced by N in all five hybrids and 30 other genes were repressed, all in the R2 developmental stage using a P < 0.05 (Supplemental Fig. S8). However, if a full model ANOVA is applied, then a much larger number of genes emerges as affected in all five hybrids (Supplemental Table S8). For example, using the full ANOVA model, ∼44.9% of the DEGs emerge as affected in all five hybrids by N, with about half induced (1,026 genes) and half repressed (976 genes). A better understanding of the cellular functions associated with these ∼2,000 genes and how their expression changes during development will be done in the future, in the context of additional years of gene expression responses to N. An example of the power of such analysis is provided by genes whose products are targeted to the plastoglobule, in which expression trends tended to be shared across the hybrids, even if not all changes were statistically significant. Similarly, N supplementation had a weak overall positive effect on photosynthesis genes, consistent with the literature (Efthimiadou et al. 2010; Su et al. 2020; Nasar et al. 2021). In contrast, while variable, phenolic genes showed a weak negative regulation upon N supplementation, consistent with the general reduction in phenolic compounds (Fig. 3). Although the literature is clear that low N induces anthocyanin accumulation in maize (Lawanson et al. 1972) and other plants (Poustka et al. 2007), it is less clear if N fertilization has a positive or negative effect on overall phenolic accumulation, with some phenolics being induced and others suppressed (Chishaki and Horiguchi 2017; Xu et al. 2019; Nasar et al. 2021).
Among the 102 conservatively identified overlapping genes are Carotenoid Cleavage Dioxygenase 4 (ZmCCD4; Zm00001eb188280) and Lipoxygenase 2 (ZmLOX2; Zm00001eb206040) which were significantly induced by N supplementation in all five hybrids (by 1.7- to 2.7-fold) specifically at the R2 stage (Supplemental Table S8). Arabidopsis (Arabidopsis thaliana) AtCCD4 expression is negatively associated with senescence (Lundquist et al. 2013; Espinoza-Corral et al. 2021; Espinoza-Corral and Lundquist 2022), thus the ZmCCD4 expression patterns are consistent with a prolonged vegetative growth period in all hybrids under side-dress. Indeed, broad upregulation of chlorophyll biosynthesis, the photosynthetic light reaction machinery, and Calvin cycle components were also seen at R2. At the same time, most gene expression patterns were hybrid-specific including genes involved in phenolic biosynthesis. For example, the Fe2OG Dioxygenase-like gene (Zm00001eb027940) was induced by side-dress N over 3-fold specifically in PHB47×PHN82, whereas the Phenolic Glucoside Malonyltransferase 2 (Zm00001eb225820) was repressed by side-dress N nearly 4-fold specifically in B73×PHN82. This is consistent with the hybrid-specific accumulation patterns we observed for phenolic compounds. One gene significantly reduced upon N treatment corresponds to a Glutathione S-transferase (GST, Zm00001eb418060), potentially involved in flavonoid biosynthesis (Supplemental Table S9).
To look for the most conserved expression patterns, we identified those genes that are most strongly induced or repressed by the side-dress N (at least 2-fold) in all five hybrids, resulting in lists of 35 induced genes and 18 repressed genes (Supplemental Table S10). Repressed genes include five proteases, among them a Metacaspase involved in programmed cell death and the chloroplast-localized Caseinolytic Protease R (ClpR) subunit, consistent with the prolonged vegetative growth seen under side-dress N. Among the induced genes were seven genes involved in cell wall metabolism or maintenance, including β-Expansin, a pectinesterase-inhibitor, and a Gly-rich cell wall structural protein. Curiously, a 9-Lipoxygenase was among the induced genes, which is responsible for generation of nonjasmonate oxylipins. It remains unclear how oxylipin(s) may be involved in the response to the side-dress N, but a number of oxylipins serve cellular signaling roles (Wasternack and Feussner 2018).
To identify hybrid-specific patterns of mRNA accumulation in response to side-dress N, DEGs were calculated on a per-hybrid basis and again the intersection of shared DEGs was calculated between hybrids. PHB47×PHN82 increased yield upon N supplementation the most (Fig. 2), hence we focused on DEGs specific to this hybrid, identifying 74 genes that responded positively to N and 52 downregulated by N at V15 (Supplemental Fig. S8, Supplemental Table S11). GO term enrichment amongst the PHB47×PHN82-specific DEGs revealed a clear induction of plastid-associated genes as well as those involved in oxidoreductase activity and phosphate antiport activity, and a clear repression of genes involved in DNA binding.
Conservation of gene expression between field seasons in response to nitrogen supplementation
The maize response to N is sensitive to numerous environmental factors (Urban et al. 2021). To understand to what extent our observations are reproducible across site-years, we re-grew hybrids in 2021 on a different field site at the Michigan State University agronomy fields, and subjected plants to a similar high/low N regime. Yield response to side-dress N was broadly similar, however the rank of order changed, with PHB47×PHN82 responding the strongest to side-dress N in 2020 (gain of 108.6 bu/acre) but B73×Mo17 in 2021 (gain of 84.1 bu/acre; Fig. 8).

Comparison of yield in two site-years. A) Moisture-adjusted yield of five hybrids in the 2020 growing season at the MSU agronomy farms, n = 2. B) Moisture-adjusted yield of the same five hybrids in the 2021 growing season at the MSU agronomy farms, n = 2. C) calculated response to N for each hybrid in site-year 2020 and site-year 2021.
To evaluate the similarity of the response of gene expression to N between the two field seasons, we first parsed the N-response candidate genes that we identified from the 2020 season, adding a criterion of at least a 2-fold difference in mRNA accumulation at R2 (Fig. 7D). Interestingly, the number of DEGs that we identified applying this additional criterion was not significantly different from the DEGs identified solely on statistically significant mRNA accumulation differences (compare R2 in Supplemental Fig. S8 and Fig. 7B). We then employed reverse transcription-quantitative PCR (RT-qPCR) to evaluate expression of 15 genes that had shown higher mRNA expression in low N (low N > high N, Fig. 7D) using the topmost ear leaf (ca. leaf 10) of R2 plants grown in 2021 under high and low N. Because we observed possible parental effects on expression from the BRB-seq results of 2020, our RT-qPCR investigation of the 2021 season targeted four hybrids with balanced parental contributions (B73×Mo17, B73×PHN82, LH195×PHN82, and LH195×Mo17), three of which were also tested in 2020 (PHB47×PHN82, LH195×PHN82, and B73xMo17). To ensure that the primers would effectively recognize each of the alleles in the hybrids, we tested them on genomic DNA of the corresponding inbred lines, from which we identified suitable primers for 15 of the genes (Supplemental Fig. S9). To normalize the data and validate the consistency of the two methods, since we would otherwise be comparing BRB-seq results from 2020 versus RT-qPCR results from 2021, we also carried out RT-qPCR on the 2020 mRNA used for BRB-seq.
The results showed that the expression of two genes were significantly and consistently downregulated in all four hybrids in both years, Zm00001eb116960 (Early Light Inducible Protein-like) and Zm00001eb011430 (Fantastic Four Meristem Regulator-like) (Fig. 9). The Early Light Inducible-Protein-like gene encodes an integral thylakoid membrane protein containing a chlorophyll-binding domain. Its downregulation is consistent with the extended period of photosynthetic activity under side-dress N. Fantastic Four Meristem Regulator genes repress meristematic growth by repressing Wuschel, consistent with side-dress N promoting meristematic growth later in the growing season. Additionally, Zm00001eb068280 (L-Asparaginase-like) was transcriptionally downregulated in three of the four hybrids tested in 2021 (excepting B73×PHN82) (Supplemental Fig. S10). This is notable in light of recent work by Huang et al. (2022) which identified an Asparagine Synthetase 4 gene in maize that promotes N-use efficiency and seed protein content. The downregulation of L-Asparaginase in our data is consistent with an important role for asparagine in maize N-use and grain filling. In contrast to the above genes, the expression of Zm00001eb075210 (Transcriptional Initiation Factor-like) was increased in at least three of the four hybrids in 2021. Notably, 12 of the tested genes were substantially downregulated in response to application of N supplementation in LH195×PHN82, whereas only three of the tested genes showed the similar downregulation in B73×PHN82 (Supplemental Fig. S10).
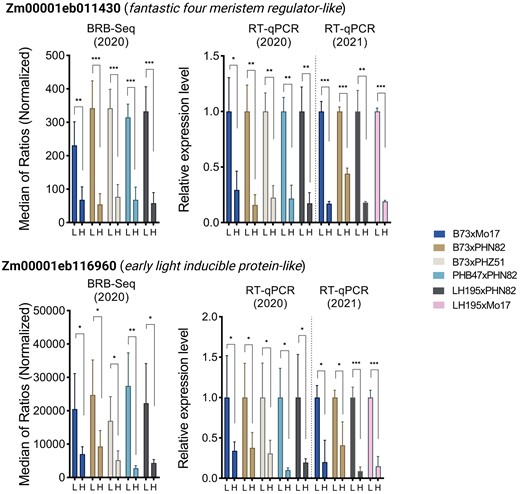
Site-year comparison of transcript expression. Transcript expression of three selected genes found to be downregulated in all five hybrids by the BRB-seq analysis in 2020. Expression levels were measured by RT-qPCR from the same dataset of 2020 as the BRB-seq, and from a replicate experiment in 2021. RT-qPCR expression is normalized to the Z. mays Ubiquitin2 housekeeping gene (Zm00001d053838). Error bars represent the mean ± 1 standard deviation, n = 3 (RT-qPCR) or n = 4 (BRB-seq). Asterisks indicate unpaired t-test values between high and low N treatments; *P < 0.1, **P < 0.01, ***P < 0.001.
Discussion
Nitrogen supplementation in commercial maize cultivation is a widely adopted practice. The optimization of the timing and rate of N supplementation represents a valuable opportunity to minimize unnecessary expenses for farmers and to limit environmental pollution. However, the rational optimization of N supplementation requires a more comprehensive understanding of how maize responds to N applications and the extent of variation in these responses across germplasm. In this study, we sought to address these questions using a multiscale investigation of the physiological changes induced by a side-dress N application in a field setting. We hypothesized that maize would perceive the absence of N supplementation by side-dress as a nutrient stress and the responses to this stress would be broadly conserved across the five tested hybrids.
The results support our initial hypothesis that plants perceive the low N treatment as a stress, but to varying degrees among the hybrids. Furthermore, the cellular PQ pool, most of which is stored in plastoglobules for ROS-scavenging and detoxification rather than photosynthetic electron transport, is elevated in low N conditions in all but the LH195×PHN82 hybrid. Cellular ultrastructural features seen at V15 are also consistent with stress, where all five hybrids display crescent-shaped plastoglobules specifically in low N-treated plants (Fig. 6). In contrast to the general stress features seen across the hybrids, photosynthetic pigment decline is N-dependent only in B73×Mo17 and PHB47×PHN82 (Fig. 3C). This indicates that the other three hybrids maintain productive photosynthesis for longer periods in the absence of sufficient soil N. Importantly, the B73×Mo17 and PHB47×PHN82 lines showed the lowest moisture-adjusted yields under low N conditions (Table 1). This observation supports the view that maintaining photosynthetic pigments (and presumably photosynthetic carbon fixation) even after the initiation of reproductive growth is critical for maximizing yield. What is it about the other three lines that allows them to maintain photosynthetic pigments at later stages of growth in the absence of side-dress N? Phenolic profiles and cellular ultrastructure do not correlate with the distinct effects on photosynthetic pigments in the hybrids, although the observed plastoglobules spanning the chloroplast envelope, specifically in B73×Mo17, is consistent with this hybrid undergoing leaf senescence (Guiamet et al. 1999; Liu 2016). Furthermore, our transcriptomics profiling shows that photosynthesis-associated genes are broadly and substantially induced by side-dress N at R2, often over 8-fold (Supplemental Table S9).
The observed effects on BS cell wall thickness were unexpected. The deposition of suberin in a thick secondary cell wall surrounding the BS is well known (O'Brien and Carr 1970; Mertz and Brutnell 2014). We report that the thickness of this suberin layer tends towards decreased thickness in response to N supplementation, although without strong statistical support (Fig. 5B). Suberin is a hydrophobic polyester of long chain fatty acids and phenolics that represent a substantial C sink in the plant leaf. Assuming a BS cell surface area of 2 m2 m−2 leaf surface area (Retta et al. 2016), a suberin layer of a uniform 783 nm thickness, and a cellular density of suberin of 200 kg m−3 (Pereira 2015), then a typical fully expanded maize leaf (surface area of 450 cm2) can be estimated to hold 14.1 mg of suberin surrounding the BS cell walls. This amounts to about 1.4% (w/w) of the leaf dry weight. A reduction in thickness to 580 nm, as seen in LH195×PHN82 in response to side-dress N, would decrease BS cell wall suberin to 10.4 mg. The reduction in suberin may reflect attempts by the plant to maintain cellular C:N ratios by freeing up C otherwise locked up in the cell wall. Because suberin represents a substantial sink in the vegetative tissue, we propose that reduced cell wall thickness represents a beneficial trait that frees up C and energy for the plant to invest in kernel development. While the trend does not hold up across all hybrids, it is notable that the hybrid with greatest decrease in cell wall thickness under N supplementation also displayed the second greatest increase in grain yield (LH195×PHN82), and the hybrid with the weakest decrease in cell wall thickness had the weakest gain in grain yield (B73×PHZ51). A survey of key genes involved in suberin biosynthesis (Woolfson et al. 2022) in the BRB-seq data showed some with variable responses to N in one or more of the hybrids, but no consistent patterns that could explain the observed phenotypes. It is possible that modest mRNA accumulation effects over multiple pathway genes contribute to the phenotype, but for practical reasons we focused on genes showing at least a 2-fold difference in mRNA levels in response to N. This may also explain why we failed to observe clear and strong correlations between phenolic and photosynthetic pigment changes in response to N and mRNA accumulation.
As a prominent site of prenyl-lipid compounds critical for efficient photosynthetic light capture, we also considered whether plastoglobules play a role in maintaining photosynthetic activity during the transition to reproductive growth. However, the two lines that retained chlorophylls and carotenoids in response to side-dress N at R2 (B73×Mo17 and PHB47×PHN82) did not show morphological features distinct from the other three hybrids, although it must be emphasized that our ultrastructural analysis was limited to the V15 stage. The appearance of crescent-shaped plastoglobules was striking because of their frequent appearance specifically in M cells of all hybrids, which suggests a true biological phenomenon rather than an artifactual effect related to sample preparation or processing (Fig. 6A; Supplemental Fig. S5C). To our knowledge, such a pattern has only been reported before in the context of senescing T. baccata leaves (Cunninghame et al. 1979). Specific segments on one face of each plastoglobule are characterized by a reduced osmiophilicity that appears as a “shadow” presumably representing the outline of the intact plastoglobule. This appearance of reduced osmiophilicity in these segments are indicative of a change in lipid composition (or an absence of lipid) that would be consistent with high levels of lipolytic activity anticipated during leaf senescence. Multiple distinct segments on a single plastoglobule were never observed in our micrographs, although the fractional proportion composed of the “shadow” segments varied widely from plastoglobule to plastoglobule. This suggests a processive encroachment of reduced osmiophilicity from a single face of each plastoglobule, possibly related to lipolytic activity. The observation of plastoglobules spanning the chloroplast envelope in a B73×Mo17 BS cell is also notable as it has been reported specifically in the context of leaf senescence (Guiamet et al. 1999; Liu 2016). It has been suggested that plastoglobules can be exported from the chloroplast and degraded to remobilize photosynthetic machinery during senescence (Lundquist et al. 2020).
A broad decline in phenolic compounds was observed in response to N supplementation, including the major component of the studied phenolic pool, maysin. Maysin and other C-glycosylflavones accumulate in the silks of maize where they provide protection to the corn earworm (Helicoverpa zea) (Waiss et al. 1979; Byrne et al. 1996; Casas et al. 2016). The observed accumulation in leaves suggests a role in the protection against other pathogens or herbivores (Gueldner et al. 1992), consistent with a decrease as the plants grow older. However, maysin was also shown to protect maize leaves to UV radiation, particularly in high-altitude maize landraces (Casati and Walbot 2005). The relevance of the reduction in phenolic compounds with N supplementation remains unclear, however, one possibility is that these compounds are induced as part of a “metabolic stress” response in the absence of side-dress N.
Transcriptome profiling of each of the five maize hybrids revealed extensive effects resulting from N supplementation. These effects were largely hybrid-specific, consistent with the biochemical results, although DEGs shared across all five hybrids were identified (particularly at the R2 stage), possibly representing robust gene expression markers of leaf N status. An analysis by Yang et al. (2011) identified broad effects of N supplementation on the maize transcriptome at the V6 stage, although the utility of expression patterns required a composite score of multiple genes to achieve robust assessment of N status across hybrids and experimental conditions. Their study of the V6 stage revealed over 3,000 N-responsive genes from two hybrids which contrasts with our much more limited number of N-responsive genes identified at the V7 stage. The discrepancy may arise from the more stringent rules that we employed for identification of DEGs and sharply different growth conditions (greenhouse) and N application method (as nutrient solution) used by Yang et al. (2011). On the other hand, our results were broadly consistent with another transcriptomic study of N-responsive DEGs from the R1 stage of 11 field-grown maize hybrids and their inbred parents (Cheng et al. 2021). Strong representation of functions associated with photosynthesis, proteolysis, and cell wall metabolism were seen in both studies, including Expansins, Clp Proteases, and Lipoxygenases. Furthermore, both studies identified multiple DEGs related to thiamine biosynthesis, although no specific gene was shared across both datasets. This further supports the putative relevance of thiamine biosynthesis in maize N-response.
The question of how different maize lines respond to N supplementation is important from crop production and environmental perspectives. Our results from a multilevel physiological and -omics study of five field-grown maize hybrids provide unique perspectives on this problem, while highlighting several of the challenges associated with conducting such experiments under field conditions. As shown before, different hybrids display distinct responses to N supplementation, and from the five hybrids tested, PHB47×PHN82 was the most responsive. Yield response to side-dress N was correlated with longer viability of photosynthetically active source tissue and associated photosynthetic pigments. From the perspective of gene expression changes promoted by N supplementation, they were most obvious at later developmental stages and were overall very hybrid-specific. This is consistent with the modest changes observed in phenolic compound accumulation, which responded much more to developmental stage than to N supplementation. Unexpectedly, a reduction in mRNA accumulation of genes associated with thiamine biosynthesis was one of the most consistent responses across all five hybrids at all developmental stages investigated. Future studies should determine whether they may represent robust indicators of plant N status.
Materials and methods
Chemicals and stock solutions
Reagents, and the 33 phenolic compounds used in this study (Supplemental Table S12), were obtained from Sigma-Aldrich (Burlington, MA, USA), Cayman Chemical (Ann Arbor, MI, USA), Indofine chemical (Hillsborough, NJ, USA), or ChromaDex (Irvine, CA, USA), with the exception of apimaysin, maysin, and rhamnosylisoorientin which were kindly provided by Dr. Michael McMullen (then at USDA-ARS, Columbia, MO) and Maurice Snook (then at Iowa State University, Ames, IA). All dilutions were done using ultrapure (>18 Ω) water. For each compound, 1 mM stock solutions were prepared in 80% (v/v) HPLC-grade methanol or 100% (w/v) dimethyl sulfoxide. A pooled mixture of all 33 standards, each at 1 μM, was prepared and through serial dilution produced samples with concentrations between 1,000 and 1.7 nM that were used as external standards. Eighteen prenyl-lipid compounds (Supplemental Table S12) used in this study were obtained from Sigma-Aldrich (St. Louis, MO, USA), except for lutein and zeaxanthin which was obtained from Fisher Scientific (Waltham, MA, USA). Each compound was dissolved in 100% (v/v) ethanol (or 90% (v/v) acetone for chlorophyll a and b and serial dilutions were produced in ethyl acetate, with concentrations of each compound ranging from 25 to 0.05 μg/mL, which were used as external standards for the calibration curve.
Maize germplasm and growth
Maize (Zea mays) hybrid lines kindly provided by Dr. Natalia de Leon (University of Wisconsin) were grown in a field located in Michigan State University (coordinates in decimal degrees: 42.04346457, −84.84989956). For the 2020 summer season, the field was planted on May 25, 2020 (Fig. 1). The field was laid out as a randomized complete block design with two blocks. Hybrids were planted in two-row plots. Each plot was 22 ft long, with 30 in. between rows and a 3 ft alley. Seeds were planted 6.2 in. apart and 1.5 in. deep at a density of 34,000 seeds/acre. The previous crop was soybean. The field was chisel-plowed in late-winter. All plants received 26 pounds of N per acre as a preplant application. Atrazine (1 pound per acre), Explorer (1.33 pints per acre), and Me-Too-Lachlor II (6 ounces per acre) were applied 2 d after planting to control weeds. Half of the plots received an additional 122 pounds of N/acre in the form of 28% UAN, 24 d after sowing as side-dress 2 in. deep in the center of the row. For the summer 2021 field season, the field was planted on May 13, 2021 and again laid out as a randomized complete block design. Seeds were planted, cultivated, and treated according to the same parameters as 2020 except for an additional postemergent herbicide application on June 9, 2021 of Hornet WDG (3 ounces per acre), Condition AMS (1 quart per 100 gallons), and Improve (1 quart per 100 gallons). High N treated plants received side-dress N (122 pounds per acre) 42 d after sowing.
Measurement of agronomic traits
A representative plant from each row was tagged for consistent measuring of traits throughout the growing season. The traits collected (and the dates and times) included total plant height (distance from ground to flag leaf collar) and ear height (distance from ground to node ear is attached), at 80 DAS, silking date (date at which at least half of the plot is showing silks), and anthesis date (date at which at least half of the plot is shedding pollen from at least halfway down the main tassel spike). All plots were harvested by a combine harvester 154 DAS.
Preparation of leaf tissue extracts
The middle third tissue of the top-most fully expanded collar leaf (V7) or ear leaf (V15 and R2) was collected from four individual field grown hybrids (two individuals each from two different plots), immediately frozen in liquid nitrogen, and stored at −80 °C until further use. To prepare leaf tissue for all biochemical and RNA measurements, maize leaf tissue was first thoroughly lyophilized before homogenizing with liquid nitrogen in a polyvinyl carbonate tube containing a metal bead using a paint shaker (5G-HD Harbil 5-Gallon Shaker model 37600) agitated for 2 min at 60 Hz. Lyophilized and ground tissue was stored at room temperature until further use.
Prenyl-lipid extraction and HPLC analysis
Prenyl-lipids were extracted according to Fraser et al. (2000) with minor modifications. Briefly, approximately 20 mg of lyophilized leaf tissue was resuspended in 200 µL of prechilled methanol and the resulting suspension was incubated on a rotator at 4 °C for 5 min. Afterwards, 200 µL of 50 mM Tris-HCl (pH 7.5) with 1 M NaCl was added and incubated at 4 °C for 10 min. Then, 800 µL of cold chloroform was added and incubated on a rotator at 4 °C for another 10 min. After centrifugation at 4 °C and 3,000 × g for 5 min, the organic hypophase was transferred to a new tube. The extraction was repeated three times by adding 800 µL of fresh chloroform followed by incubation for 10 min and phases separated by centrifugation. Lastly, the extracted hypophase was evaporated under a gentle stream of N2 and prenyl-lipids were dissolved in 400 µL of ethyl acetate immediately prior to HPLC analysis. Chromatography was performed essentially as described in Lundquist et al. (2013). Lipid extracts were filtered through a 0.45-µm syringe filter and 10 μL was injected onto a reverse phase C30 chromatography column [Thermo AccuCore 2.6 µm beads (150 × 2.1 mm)] using a Nexera-i LC-2040C 3D system (Shimadzu, Kyoto, Japan) with a flow rate of 0.4 mL min−1 and a photodiode array detector scanning continuously between 250 and 700 nm. Compounds were separated with a 30-min gradient program as detailed in Espinoza-Corral et al. (2021). Peak identities were obtained by comparing their retention time as well as their absorbance spectrum with calibration curves developed by commercial standards, except for PQ whose quantification was estimated from the extinction coefficient and calibration curve developed from the ubiquinone-10 commercial standard.
Phenolic extraction and LC–MS/MS analysis
Homogenized plant material (∼50 mg) was transferred to a 2 mL Eppendorf tube and combined with the extraction solvent consisting of 80% (v/v) HPLC grade methanol and 0.1% (v/v) formic acid. As an internal standard, 8-prenylnaringenin (50 nM) was added to the extract. Extraction was performed by incubating for 12 h at 4 °C, followed by reconstitution by vortexing for 20 s, centrifugation for 5 min at 15,000 × g at room temperature, and recovery of the supernatant for analysis by LC–MS on a Waters ACQUITY TQD Tandem Quadrupole UPLC/MS/MS (Waters Corporation, Milford, USA), using a 10-min targeted multiple reaction monitoring (MRM) method for detecting 33 phenolic compounds (Supplemental Tables S1 and S3), based on a modification of the MRM method previously described (Cocuron et al. 2020). For each hybrid line, four biological replicates were analyzed consecutively by injecting 10 μL of extract with the liquid chromatography separation taking place at 30 °C using a reverse phase Waters Symmetry C18 column (4.6 × 75 mm; 3 μm) with a Symmetry C18 prep-column (3.9 × 20 mm; 5 μm) (Waters Corporation, Milford, USA). Peak area for all compounds was integrated using MassLynx (v 4.2) with vendor-specific data files (.raw) to produce the raw peak area matrix (Rodriguez et al. 2022). Some of the compounds exceeded the range of the calibration curve and therefore 1:100 and 1:1,000 dilutions were made for all samples to obtain absolutes values.
Transmission electron microscopy of cellular ultrastructure
Leaf tissue was collected in the field and delivered on ice directly to the campus laboratory for chemical fixation, taking a maximum of 10 min from field collection to initial processing. Tissue from the midpoint of the leaf (i.e. half-way between the base and the tip, and off of the mid-rib) was sliced into 2 × 2 mm2 and deposited in 2% (w/v) paraformaldehyde and 2% (w/v) glutaraldehyde for chemical fixation. After primary fixation, samples were washed with 0.1 M phosphate buffer and post-fixed with 1% (w/v) osmium tetroxide in 0.1 M phosphate buffer, dehydrated in a gradient series of acetone and infiltrated and embedded in Spurr's resin. Seventy nanometer thin sections were obtained with a Power Tome Ultramicrotome (RMC, Boeckeler Instruments, Tucson, AZ, USA) and post-stained with uranyl acetate and lead citrate. Images were taken with JEOL 1400Flash Transmission Electron Microscope (Japan Electron Optics Laboratory, Japan) at an accelerating voltage of 100 kV.
BRB-seq analysis
RNA was extracted from a maximum of 100 mg of lyophilized leaf tissue using the “Purification of Total RNA from Plant Cells and Tissues and Filamentous Fungi” kit (Qiagen, Hilden, Germany). Extraction followed manufacturer's instructions and eluted in 30 µL of RNAase-free water, before storing at −80 °C until BRB-seq library preparation. RNA was extracted with RNeasy Qiagen plant kit and then sequencing libraries were prepared using the BRBSeq protocol to barcode and pool samples into a total of six sequencing libraries (Alpern et al. 2019). Libraries were sequenced at the Genomics Core at MSU on the Illumina NovaSeq 600 platform. Low-quality reads were trimmed with default FastP settings (Chen et al. 2018). Transcripts were aligned to the B73 V5 reference genome using STAR runMode alignReads with max mapping locations set to 1 and splice-junction aware with B73 V5 genomic feature file (Dobin et al. 2013). The feature number of base pair mismatches per read was four mismatches/100 bp. The reads were then counted and demultiplexed with BRBseqTools-1.6 CreateDGEMatrix (Alpern et al. 2019) and individual sample barcode map. Median of ratio normalized counts were generated and differentially expressed genes were calculated at each time point between treatments on a bulked and per-hybrid basis in DESeq2 (Love et al. 2014). The V15 timepoint was chosen for deeper analysis of hybrid specific gene expression. A cut-off to identify differentially expressed genes at an evidence level, P ≤ 0.01 was established; next, genes passing the threshold in PHB47×PHN82 but not the other four hybrids were selected. A list of 370 genes was generated this way. To gain insight into the underlying biological processes that these genes influence, an over-representation analysis of Gene Ontology terms was conducted with the g:Ost web tool (Raudvere et al. 2019). Principal component analysis of normalized counts calculated in the Scikit-learn Python package (Pedregosa et al. 2011). ANOVA on component loadings calculated in Pingouin Python package (Vallat 2018).
Partial η2 values were calculated from the sums of squares partitioning in ANOVA using the formula
Thus, the η2 value described the proportion of total variability attributable to a factor (Richardson 2011). Partial η2 of dependent variables on PC1 loadings of gene expression were used to interpret which factors contributed most toward overall expression.
RT-qPCR
Total RNA was extracted from lyophilized leaf tissues using RNeasy plant mini kit (Qiagen, Hilden, Germany) following manufacture's instruction. Genome DNA contamination was eliminated using TURBO DNA-free Kit (Invitrogen, Carlsbad, CA, USA). RNA quality was monitored by 1.0% (w/v) agarose gel electrophoresis and the concentration were measured using NanoDrop spectrophotometer (ThermoFisher). One microgram of purified RNA was reverse transcribed to first strand cDNA by SuperScript III reverse transcriptase (Invitrogen, Carlsbad, CA, USA). RT-qPCR was performed using an Applied Biosystems (Bedford, MA, USA) 7500HT real-time PCR system as described previously (Ying et al. 2023). Gene-specific primers were designed using PRIMERQUEST software and their sequences are listed in Supplemental Table S13. Results were analyzed with SDS software v.2.4 (Applied Biosystems). The maize ZmUBI-2 (Zm00001d053838) gene was used as reference. Experiments were repeated three times using cDNAs prepared from three independent biological replicates, defined as an individual plant.
Statistical analysis
Statistical analyses and plotting were performed with GraphPad Prism version 9.3 (GraphPad Software, Inc., San Diego, CA, USA). Data on phenolics or prenyl-lipid measurements were subjected to statistical analysis by MiniTab (State College, PA, USA).
Accession numbers
Accession numbers of all genes mentioned in this article can be found at the MaizeGDB V5 (https://www.maizegdb.org/).
The transcriptomic data underlying this article are available in the SRA database with BioProject accession number PRJNA904734 at https://www.ncbi.nlm.nih.gov/sra/PRJNA904734.
Acknowledgments
We thank Julia Matalon, Eric Mukundi Maina, and Zhongjie Ji for assistance with field work and data collection, Febri Susanto for assistance with tissue preparation of transmission electron micrographs, and the Genomes to Fields Maize GxE project collaboration for providing hybrid seed lines. We thank Robert Goodwin and Erin Bunting at the Remote Sensing and Geographic Information Science Center (MSU) for the drone field imagery of the field site. We thank the Center for Advanced Imaging at Michigan State University for their expert preparation and collection of transmission electron micrographs. We thank the Mass Spectrometry and Metabolomics Core Facility (MSU) for assistance in collection of phenolic compound measurements.
Author contributions
S.Y. did the formal analysis, investigation, data curation, writing original draft, writing—review & editing, visualization; B.W. has done the formal analysis, investigation, data curation, writing original draft, writing—review and editing, visualization; L.G.-C. has done the formal analysis, investigation, data curation, writing—review and editing, visualization; K.-K.S. has done the formal analysis, investigation, data curation, visualization; Q.W. has done the formal analysis, investigation, data curation, visualization; L.N. has done the investigation; E.G. has done the conceptualization, writing original draft, writing—review and editing, supervision, project administration, funding acquisition; A.T. has done the conceptualization, formal analysis, resources, data curation, writing original draft, writing—review and editing, supervision, project administration, funding acquisition; P.K.L. has done the conceptualization, formal analysis, data curation, writing original draft, writing—review and editing, supervision, project administration, funding acquisition.
Supplemental data
The following materials are available in the online version of this article.
Supplemental Figure S1. Pairwise correlations between selected ontogenic and agronomic traits.
Supplemental Figure S2. Principal component analyses of phenolic profiles from maize leaf tissue.
Supplemental Figure S3. Principal component analyses of prenyl-lipid profiles from maize leaf tissue.
Supplemental Figure S4. Selected metabolite levels in five maize leaf hybrids at each developmental stage.
Supplemental Figure S5. Effect of N supplementation on chloroplast ultrastructure at the V15 developmental stage.
Supplemental Figure S6. Correlation between plastoquinone levels and mesophyll plastoglobule size.
Supplemental Figure S7. Loadings of PCA plots of BRB-seq analysis.
Supplemental Figure S8. Summary of all DEGs from BRB-seq analysis.
Supplemental Figure S9. Validation of RT-qPCR primers.
Supplemental Figure S10. Year-to-year comparison of the 15 DEGs.
Supplemental Table S1. Plot level data of ontogenic, biochemical, and ultrastructural traits.
Supplemental Table S2. Maize yield responses to side-dress N.
Supplemental Table S3. Plant level data of biochemical and ultrastructural traits.
Supplemental Table S4. Phenolic compound fold-changes in response to side-dress N.
Supplemental Table S5. Prenyl-lipid compound fold-changes in response to side-dress N.
Supplemental Table S6. BRB-seq Read mapping results.
Supplemental Table S7. ANOVA of PC1 loadings.
Supplemental Table S8. Significantly DEGs from BRB-seq results.
Supplemental Table S9. Significantly DEGs of selected functional or sub-cellular categories.
Supplemental Table S10. Transcription response of genes to N supplementation. List of genes that are more than 2-fold upregulated or downregulated by N supplementation at R2 stage in all five hybrid lines.
Supplemental Table S11. DEGs specific to PHB47×PHN82 at V15.
Supplemental Table S12. Targeted MRM method for 33 compounds analyzed in maize leaves.
Supplemental Table S13. Primer sequences used in this study.
Funding
This work was supported by National Science Foundation grant IOS-1733633 to E.G., and the Ag Spectrum Company (DeWitt, IA 54742 USA) to P.K.L., A.T., and E.G. L.G.-C. was supported by a fellowship from Michigan State University under the National Institutes of Health Training Program in Plant Biotechnology for Health and Sustainability (T32-GM110523). This work was also supported in part by the Michigan State University Plant Science Fellowship and the National Science Foundation Research Traineeship Program (DGE-1828149) to B.W.
Data availability
All data underlying this article are available in the article and in its online supplementary material.
Dive Curated Terms
The following phenotypic, genotypic, and functional terms are of significance to the work described in this paper:
References
Author notes
Sheng Ying and Brandon Webster Co-first authors.
The author responsible for distribution of materials integral to the findings presented in this article in accordance with the policy described in the Instructions for Authors (https://dbpia.nl.go.kr/plphys/pages/General-Instructions) is P.K. Lundquist ([email protected]).
Conflict of interest statement. The authors declare that Ag Spectrum Company funded part of this research and that results from this research were shared with members of the company.
