


Abstract
The precise timing of flowering plays a pivotal role in ensuring successful plant reproduction and seed production. This process is intricately governed by complex genetic networks that integrate internal and external signals. This study delved into the regulatory function of microRNA397 (miR397) and its target gene LACCASE-15 (OsLAC15) in modulating flowering traits in rice (Oryza sativa). Overexpression of miR397 led to earlier heading dates, decreased number of leaves on the main stem, and accelerated differentiation of the spikelet meristem. Conversely, overexpression of OsLAC15 resulted in delayed flowering and prolonged vegetative growth. Through biochemical and physiological assays, we uncovered that miR397-OsLAC15 had a profound impact on carbohydrate accumulation and photosynthetic assimilation, consequently enhancing the photosynthetic intensity in miR397-overexpressing rice plants. Notably, we identified that OsLAC15 is at least partially localized within the peroxisome organelle, where it regulates the photorespiration pathway. Moreover, we observed that a high CO2 concentration could rescue the late flowering phenotype in OsLAC15-overexpressing plants. These findings shed valuable insights into the regulatory mechanisms of miR397-OsLAC15 in rice flowering and provided potential strategies for developing crop varieties with early flowering and high-yield traits through genetic breeding.
Introduction
The timing of the transition to flowering is crucial for the successful reproduction of plants, as it signifies the shift of energy and nutrient allocation from maternal growth to the development of offspring (Levy and Dean 1998; Millet et al. 2019; Brightbill and Sung 2022). The initiation of flowering is governed by a complex genetic network that integrates various internal signals and external environmental cues (Levy and Dean 1998; Yano et al. 2001; Jung and Müller 2009; Ma et al. 2022). This intricate regulation ensures the production of fertile seeds and the viability of plant species. Consequently, flowering time is closely associated with seed production traits. Generally, plants that flower late, with an extended vegetative growth period and higher accumulation of photosynthetic assimilates tend to produce larger seeds and have increased yields. Conversely, plants that flower prematurely often result in reduced grain yield (Jung and Müller 2009; Fang et al. 2019), and this relationship between flowering time and yield presents a substantial challenge in crop breeding, especially in regions with short growing seasons or frequent adverse conditions. Finding a balance between early flowering and high-yield traits is essential to overcome these obstacles and achieve optimal crop productivity in challenging environments.
Efforts have been dedicated to developing cultivars with not only higher yields but also earlier heading dates in various crops (Du et al. 2017; Guo et al. 2020; Lin et al. 2021a, 2021b; Zhang et al. 2022a; Ge et al. 2023; Liu et al. 2023; Zhao et al. 2023). A recent study conducted by Fang et al. presented an important finding where a long noncoding RNA locus (Ef-cd locus) was identified (Fang et al. 2019). Remarkably, this locus could shorten the maturity duration of rice (Oryza sativa) without compromising yield. This discovery suggests that the apparent contradiction between “high yielding” and “early maturing” traits could potentially be resolved through targeted gene manipulation. However, despite such progress, there remains a scarcity of reported crop lines that possess both early flowering and high-yield traits.
MicroRNAs (miRNAs) are small noncoding RNA molecules widely present in eukaryotes. In recent years, studies have demonstrated that miRNAs play essential roles in regulating various processes of plant growth, development, and metabolism (Li and Zhang 2016; Cai et al. 2018; Liu et al. 2018; Yang et al. 2019; Gao et al. 2022; Lin et al. 2022; Zhang et al. 2022b). Early research on miR397 primarily focused on its response to environmental stresses. For instance, in Arabidopsis (Arabidopsis thaliana), miR397 was found to be upregulated under cold, drought, salt, hydrogen peroxide stress, and abscisic acid treatment. Additionally, researchers have discovered that miR397 in Arabidopsis and poplar (Populus trichocarpa) could downregulate the expression of its target genes, which belonged to the laccase family, thereby influencing lignin biosynthesis and secondary cell wall metabolism (Huang et al. 2021). In our previous studies, we identified that miR397 in rice was highly expressed in young panicles and grains. Overexpression of this miRNA can downregulate the expression of the laccase gene LACCASE-15 (OsLAC15), increase the plant’s sensitivity to brassinosteroids (BR), promote the enlargement of rice grains, increase the number of panicle branches and grains per panicle, and substantially boost grain yield in field trials, up to 24.9% higher (Zhang et al. 2013). Moreover, we also observed that the overexpressing miR397 led to a substantial advancement of the flowering phase in rice (Zhang et al. 2013). The phenotype of early flowering and increased grain yield in miR397 overexpressing plants seems to contradict the generally accepted notion that early flowering is usually accompanied by reduced yield. Nonetheless, the underlying mechanism driving these effects remains unclear and requires further investigation.
Similarly, our investigation on LAC4, mediated by miR397b in Arabidopsis, also showed that the miR397b-mediated LAC4 pathway promoted seed enlargement, silique growth, and increased the number of seeds and inflorescence stems (Wang et al. 2014). This suggested the conservation and importance of this microRNA in different plant species. However, we intriguingly discovered that a natural variation of miR397b that targeted CASEIN KINASE II SUBUNIT BETA3 (CKB3), which in turn substantially impacts the circadian period of CIRCADIAN CLOCK ASSOCIATED1 (CCA1) in Arabidopsis, thereby delayed the plant’s flowering time (Feng et al. 2020). While miR397 exhibits a conserved and positive regulatory effect on seed size in both Arabidopsis and rice, its role in flowering regulation appears to be opposite, suggesting the need for further exploration into the underlying molecular mechanisms driving this divergence.
In this study, we conducted a series of physiological and molecular analyses on transgenic rice plants overexpressing miR397 and its target gene OsLAC15. Our aim was to uncover the mechanisms by which miR397 mediates post-transcriptional gene silencing of OsLAC15 and its influence on rice flowering traits. We found that OsLAC15 can be partially localized in peroxisomes and participates in regulating the photorespiration process within peroxisomes, consequently affecting rice’s photosynthetic assimilation capacity. The miR397-mediated silencing of OsLAC15 expression leads to a rice phenotype characterized by higher photosynthetic intensity, lower photorespiration rate, early flowering, and increased yield. Considering the conservation of miR397 in plants, we believe that revealing the regulatory pathway of miR397 that promotes early flowering and increased grain size in rice will be beneficial for the development of crop varieties with early flowering and high-yield traits through genetic breeding research.
Results
The miR397-OsLAC15 module promotes rice earlier heading date
To better understand the effect of miR397 and OsLAC15, we performed a detailed statistical analysis on rice flowering. Data from more than 50 plants per line were collected. Field studies showed that transgenic rice lines OXmiR397a and OXmiR397b (miR397a- and miR397b-overexpressing lines) consistently flowered approximately 1 wk earlier than the wild-type Zhonghua 11 (ZH11) (Fig. 1, A and B). Conversely, overexpression of OsLAC15 significantly delayed rice flowering by 10 days or more (Fig. 1, A and B). The statistical analysis confirmed the highly significant promotive effect of miR397 on rice flowering (Fig. 1B). Daily observations of heading date revealed that the wild-type plants usually started heading at around 64 d after germination, while OXmiR397a and OXmiR397b initiated heading at around 56 d after germination, with almost complete heading observed by day 64 (Fig. 1C). In contrast, OXLAC (OsLAC15-overexpressing lines) plants exhibited much later flowering, mainly concentrated between days 69 and 81 (Fig. 1C).
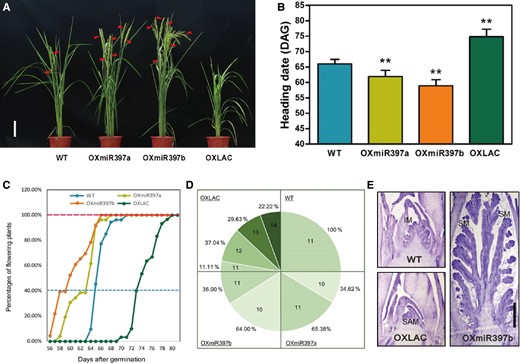
Flowering phenotype of OXmiR397 and OXLAC. A) Flowering of 66 DAG (days after germination) rice plants. The triangles represented young panicles. Scale bar = 20 cm. B and C) Flowering time of OXmiR397 and OXLAC. Data are represented as means ± SD. Asterisks indicate statistically significant differences compared with wild-type by Student’s t-test (*P < 0.05; **P < 0.01), n > 50. D) Total leaf number in the main-stem of wild-type and transgenic plants. E) The SAM of 6-wk-old rice plants. IM, inflorescence meristem; SM, spikelet meristem; SAM; shoot apical meristem. Scale bar = 500 μm.
In the observation of plant flowering time, the number of leaves is also an important measure, commonly used for flowering time statistics in plants such as Arabidopsis (Jing et al. 2019; Xie et al. 2020). The number of leaves on the main stem of rice is usually used to assess the physiological status of rice and is widely applied in agricultural practices. Based on our observations, the wild-type ZH11 usually has 11 leaves on the main stem when grown in the Guangdong region. However, OXmiR397a and OXmiR397b plants generally have 10 or 11 leaves on the main stem. In contrast, OXLAC plants can extend their main stem to have 11 to 14 leaves (Fig. 1D).
When rice switches from vegetative growth to reproductive growth, the first substantial morphological change occurs in the shoot apical meristem (SAM). Therefore, we hypothesized that miR397 regulation of rice flowering might also manifest in SAM changes. To investigate the specific changes in the SAM, we performed histological sections of approximately 6-wk-old rice plants. The results showed that when the wild-type plants had just differentiated the inflorescence meristem (IM), OXmiR397b plants already exhibited the presence of spikelet meristem (SM) in the SAM, while the SAM of OXLAC plants had not yet started differentiation and retained the leaf primordium stage characteristic of vegetative growth (Fig. 1E). This result aligns with the differences in flowering time and the number of main stem leaves observed in the transgenic plants, indicating that miR397-mediated regulation of OsLAC15 expression can influence the transition of rice from vegetative growth to reproductive growth.
MiR397-OsLAC15 regulates rice flowering through carbohydrate accumulation, but not the circadian or photoperiod pathway
In our previous research on Arabidopsis, we found that the ability of AtmiR397b to delay flowering is attributed to a natural variation in its mature sequence, which enables it to efficiently target CKB3 mRNA and consequently forms a miR397b-CKB3-CCA1 negative feedback loop. However, there is no evidence suggesting the presence of similar natural variations or regulatory mechanisms in rice miR397, indicating that the promotion of rice flowering by miR397 may involve a different mechanism. To explore the mechanism of flowering transition phenotype exhibited in miR397 and OsLAC15 transgenic lines, we first analyzed the expression of circadian rhythm and photoperiod-related genes. No substantial change was detected in OsLHY expression among the plants (Supplemental Fig. S1A). The expression of OsGI, Hd3a, and Ehd1 were all higher in OXmiR397 (Supplemental Fig. S1B–D). However, the expressions of these 3 genes in OXLAC were also up-regulated, even more than that in OXmiR397, which failed to interpret the delayed flowering in OXLAC (Supplemental Fig. S1B–D). Therefore, circadian or photoperiod might not be the direct regulatory pathways that miR397-OsLAC15 integrated in.
The content of carbohydrate substances in plants often reflects the metabolic status of the plant. Recent research has confirmed that carbohydrate substances are extremely important regulatory factors in inducing plant flowering, as they can promote the transition of SAM to IM (Corbesier et al. 1998; Wahl et al. 2013; Fichtner and Lunn 2021). The sugar nutrition in the SAM of rice comes from the transport and breakdown of photosynthetic products in the leaf sheath. Therefore, we examined the distribution of sugars in the leaf sheath of 6-wk-old rice plants. Sucrose is the main form in which rice transports photosynthetic products from source leaves to sink tissues, and the glucose and fructose produced by sucrose breakdown are the basic substrate molecules for various metabolic pathways in plant cells, including cellular respiration. We found that the overexpression of miR397 did not hinder sucrose transport; instead, it led to a significant increase in sucrose, glucose, and fructose content in the leaf sheath. Conversely, in OXLAC plants, the content of sucrose, glucose, and fructose was slightly lower than in normal plants (Fig. 2, A–C). The reduced levels of glucose and fructose are likely to weaken respiration in OXLAC plants, resulting in insufficient cellular energy and carbon-containing material supply. This may suggest that miR397-OsLAC15 could affect the acquisition and utilization of sugar nutrition by the SAM of rice. Additionally, during rice grain formation, approximately 30% of starch originates from the temporary storage in the leaf sheath. OXmiR397b showed significantly higher starch content than normal plants, while OXLAC showed a decrease (Fig. 2, A–D), which is consistent with miR397 promoting rice grain enlargement and increasing grain yield.
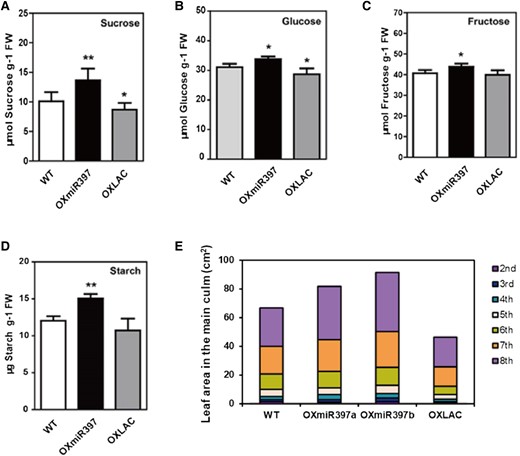
Carbohydrate and biomass accumulation analysis. A–D) Carbohydrate content analysis in rice leaf sheaths. Data are represented as means ± SD. Asterisks indicate statistically significant differences compared with wild-type by Student’s t-test (*P < 0.05; **P < 0.01), n = 3. E) Leaf areas and biomass of the 2nd to 8th leaves of rice main-stem, n = 10.
To evaluate the accumulation of biomass in rice, we further examined the leaf area of the 2nd to 8th leaves on the main stem during the vegetative growth period. Table 1 shows the changes in leaf area compared to the wild-type plants for transgenic lines. From the data, it is evident that constitutive expression of miR397 significantly increased the leaf area in rice, while overexpression of OsLAC15 had the opposite effect. The total biomass of the 2nd to 8th leaves, obtained by accumulating these data, also reflects more pronounced changes in material accumulation during the vegetative growth stage influenced by miR397 and OsLAC15 (Fig. 2E).
Leaf areas of the 2nd to 8th leaves of rice main-stem
| Plants | 2nd | 3rd | 4th | 5th | 6th | 7th | 8th |
|---|---|---|---|---|---|---|---|
| WT | 1.29 ± 0.30 | 1.41 ± 0.50 | 2.31 ± 0.36 | 5.00 ± 0.48 | 10.72 ± 1.08 | 19.08 ± 2.47 | 26.96 ± 2.66 |
| OXmiR397a | 1.09 ± 0.31 | 1.82 ± 0.36* | 3.38 ± 0.54** | 4.86 ± 0.53 | 11.27 ± 0.48** | 21.97 ± 1.60** | 37.17 ± 2.85** |
| OXmiR397b | 1.483 ± 0.21* | 2.46 ± 0.33** | 3.21 ± 0.27** | 5.61 ± 0.47** | 12.42 ± 1.49** | 25.13 ± 1.21** | 40.85 ± 1.83** |
| OXLAC | 0.46 ± 0.25** | 1.01 ± 0.52* | 1.67 ± 0.55** | 3.19 ± 1.30** | 5.76 ± 2.52** | 13.58 ± 1.39** | 20.52 ± 2.70** |
Data are represented as means ± SD. Asterisks indicate statistically significant differences compared with wild-type by Student’s t-test (*P < 0.05; **P < 0.01), n = 10.
MiR397-OsLAC15 significantly affects photosynthesis in rice
Green plants fix atmospheric CO2 through photosynthesis and store it in the form of sugars for their growth and development. The variation in the strength of plant photosynthesis directly affects the content of photosynthetic products. To explore the reasons for the abnormal accumulation of sugars in miR397 and OsLAC15 ectopic expression plants, we conducted tests on the photosynthetic intensity of the 2nd to 8th leaves of rice. The photosynthetic intensity of OXmiR397 plants was significantly higher than that of Wild Type (WT) plants, and it increased overall as we moved up the leaves. Surprisingly, we also found that the photosynthetic intensity of each leaf of OXLAC was significantly lower than that of WT levels (Fig. 3A). This result is consistent with the differences in sugar accumulation and leaf area size mentioned earlier, indicating that miR397 enhances the photosynthetic capacity of rice during the nutritional growth stage, while OsLAC15 appears to be a negative regulator of photosynthesis.
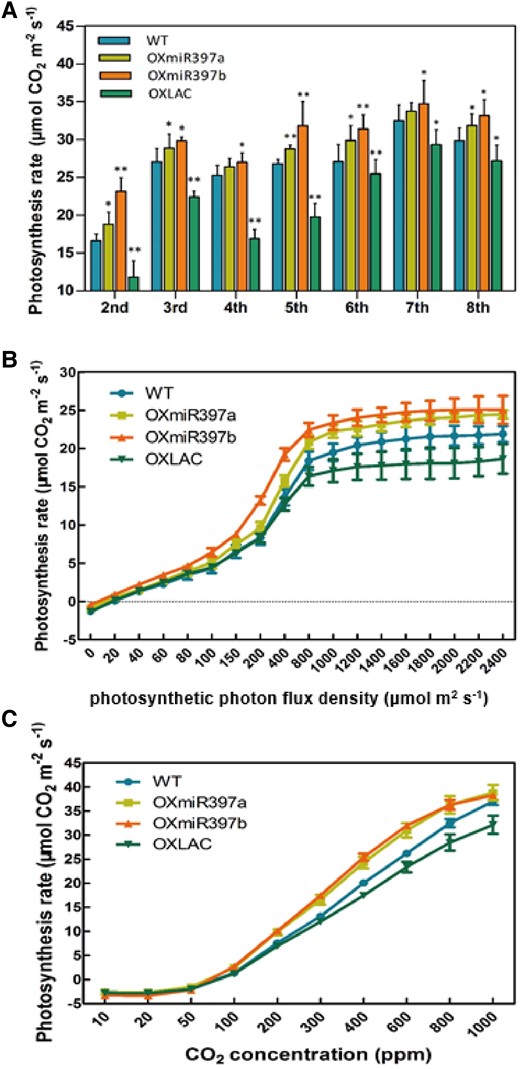
Photosynthesis rate of 2nd to 8th leaves and light-/CO2-responsive curves of flag leaves. A) Photosynthesis rate of fully expanded 2nd to 8th leaves of wild-type, OXmiR397a/b, and OXLAC under the light intensity of 1200 μmol m2 s−1. B) Light-responsive curves of rice flag leaves. C) CO2-responsive curves of rice flag leaves. Data are represented as means ± SD. Asterisks indicate statistically significant differences compared with wild-type by Student’s t-test (*P < 0.05; **P < 0.01), n = 10.
We not only tested the 2nd to 8th leaves of rice during the nutritional growth stage but also analyzed the photosynthetic capacity of the flag leaf, which is crucial for rice grain formation. The light response curves of the flag leaf showed that although overexpression of miR397 and OsLAC15 did not change the light saturation point of rice, overexpression of miR397 substantially reduced the light compensation point and increased the photosynthetic intensity under the same light intensity (Fig. 3B). Similarly, under different CO2 concentrations, the flag leaf of OXmiR397 had a lower CO2 compensation point and higher photosynthetic intensity at the same CO2 concentration (Fig. 3C). Conversely, the trends of these parameters in OXLAC plants were opposite to those in the OXmiR397 plants (Fig. 3, B and C). All of the above results indicate that miR397 can enhance rice's efficient use of light and CO2. The overexpression of miR397 leads to higher photosynthetic intensity, lower light compensation point, and lower CO2 compensation point, which are highly favorable traits for crop breeding.
miR397-OsLAC15 does not substantially affect the light reaction phase of photosynthesis
The determination of photosynthetic intensity described above focuses on the gas exchange during the dark reaction phase of photosynthesis. However, the characteristics of the light reaction phase can be assessed through chlorophyll and its fluorescence kinetics parameters (Boisvert et al. 2006; Kupper et al. 2019; Jin et al. 2023). We conducted measurements of chlorophyll content and chlorophyll fluorescence parameters in the 8th leaves of miR397- and OsLAC15-overexpressing plants, as presented in Supplemental Fig. S2 and Table S1. The chlorophyll content was upregulated in the OXmiR397 plants, while there was no significant change in OXLAC plants, consistent with the value of initial fluorescence Fo in the chlorophyll fluorescence kinetics parameters. Moreover, we observed that OXLAC plants had a lower light energy absorption rate and electron transfer rate in photosystem II. However, in OXmiR397a/b, parameters like Fv/Fm, ΦPSII, electron transport rate (ETR), and qP showed no significant changes. Therefore, the higher photosynthetic efficiency in OXmiR397 plants is not attributed to their photosystem II having a superior advantage in the photochemical reaction process compared to normal plants.
Copper is an essential micronutrient for plants, and in the photosynthetic electron transport chain, plastocyanin (PC) is a crucial electron transfer component that utilizes copper as an essential cofactor in chloroplasts (Zhang et al. 2017). OsLAC15 encodes a laccase-like protein, which belongs to the multicopper oxidases family that catalyzes the one-electron oxidation of substrates. We hypothesized that both OsLAC15 and PC, being 2 copper-binding proteins, might compete for copper ions, potentially affecting the photosynthetic electron transport chain and disrupting copper homeostasis in transgenic plants. However, our evaluation of the PC level showed no substantial degradation of PC protein in OXLAC plants (Supplemental Fig. S3), suggesting that copper uptake in the chloroplast was not substantially affected when OsLAC15 expression was altered. Nevertheless, chlorophyll fluorescence analysis revealed that the photosynthetic ETR was indeed down-regulated in OXLAC, while such a change was not observed in OXmiR397 (Supplemental Table S1). These results indicate that the alteration of photosynthesis rate in response to miR397-OsLAC15 expression might be due to a regulatory mechanism other than the control of copper concentration.
OsLAC15 partially located in the peroxisome and regulates photorespiration
The subcellular localization analysis of proteins is crucial for comprehending their biological functions and regulatory mechanisms. Therefore, we initiated the prediction of subcellular localization for the OsLAC15 protein, employing various online tools. The predictions indicated that the protein might be transported into the intracellular membrane system. Moreover, PSORT and MultiLoc2 suggest a higher probability of OsLAC15 being localized to peroxisomes (Supplemental Table S2). Subsequently, we conducted further investigations into the subcellular localization of OsLAC15. Through fusing OsLAC15 with a fluorescent protein and transiently introducing it into rice protoplasts, we observed that OsLAC15-GFP primarily localized in the cytosol while partially overlapping with the peroxisome marker (Fig. 4A). We also examined the distribution of OsLAC15 in Arabidopsis protoplasts and Nicotiana benthamiana epidermal cells, revealing a spotted fluorescence signal that also overlapped with peroxisome markers (Fig. 4, B and C). These findings provide evidence that the OsLAC15 protein is at least partially localized within the peroxisome organelle.
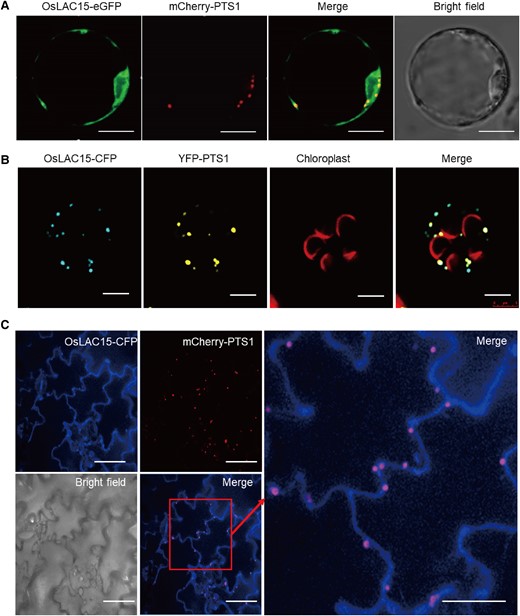
Subcellular localization of OsLAC15. A) Cotransformation of OsLAC15-eGFP and mCherry-PTS1 in rice protoplast. Scale bar = 2 μm. B) Cotransformation of OsLAC15-Cyan Fluorescent Protein (CFP) and Yellow Fluorescent Protein (YFP)-PTS1 in Arabidopsis protoplast. The autofluorescence of chloroplast was labeled in red. Scale bar = 5 μm. C) Cotransformation of OsLAC15-CFP and mcherry-PTS1 in Nicotiana benthamiana leaf epidermal cells. Scale bar = 40 μm.
Peroxisomes, single-membrane-bound spherical organelles, reside adjacent to chloroplasts and mitochondria in photosynthetic cells of green plants, actively participating in the regulation of diverse processes such as photorespiration, photosynthesis, aerobic respiration, nitrogen metabolism, and amino acid metabolism. Therefore, we explored whether the subcellular localization of OsLAC15 in peroxisomes influenced the metabolic processes involving these organelles. To investigate this, we collected RNA samples from 14-d-old rice wild-type, OXmiR397b, and OXLAC seedlings and subjected them to RNA-seq analysis to assess the impact of miR397 and OsLAC15 differential expression on peroxisome-related metabolism. From numerous differentially expressed genes, we identified 41 genes significantly related to peroxisome biogenesis, glycolate metabolism, photosynthetic dark reactions, glutamate and nitrogen metabolism, as well as glycine-serine metabolism. Upon closer examination, we found that most genes in OXLAC showed upregulated expression, while the trend in OXmiR397b was opposite to that of OXLAC (Fig. 5A). To validate the results, we conducted reverse transcription-quantitative PCR (RT-qPCR) to measure the relative expression levels of genes such as OsLAC15, GLYCOLATE OXIDASE (GLO1), CATALASE (OsCAT), GLUTAMATE: GLYOXYLATE AMINOTRANSFERASE (GGAT), SERINE: GLYOXYLATE AMINOTRANSFERASE (SGAT), and HYDROXYPYRUVATE REDUCTASE (OsHPR), along with the genes encoding MALATE DEHYDROGENASE (pMDH, mMDH, cMDH) (Fig. 5B). The results aligned well with the high-throughput sequencing data. These analyses suggest that overexpression of OsLAC15 activates the photorespiration pathway in OXLAC plants at the transcriptional level, while miR397 overexpression weakens mRNA expression levels in this pathway.
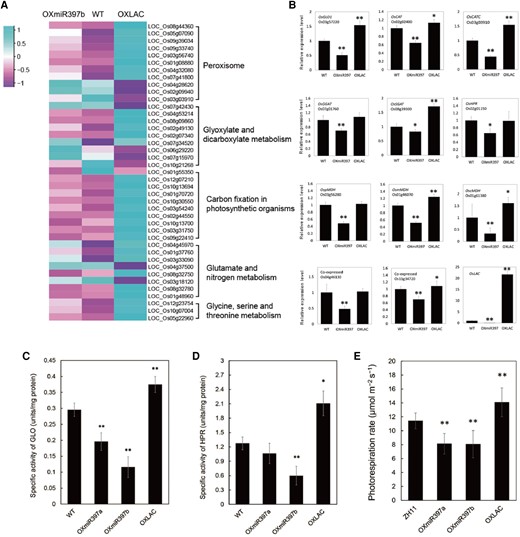
The miR397-OsLAC15 module affects peroxisome-related gene expression and metabolism. A) Differentially expressed genes in peroxisome-related biological processes. The Reads Per Kilobase of transcript per Million mapped reads (RPKM)-normalized gene expression levels from RNA-Seq of 14-d-old seedlings of rice WT, OXmiR397b, and OXLAC plants are represented by a color gradient, as illustrated in the color chart. Differentially expressed genes are grouped into several biological processes including peroxisome biosynthesis, glyoxylate and dicarboxylate metabolism, carbon fixation in photosynthesis, glutamate and nitrogen metabolism as well as glycine and serine metabolism. B)OsLAC15-triggered differentially expressed genes in photorespiration. Relative expression of OsLAC15 and the main genes that encode enzymes in photorespiration were identified by using RT-qPCR. Data are represented as means ± SD. Asterisks indicate statistically significant differences compared with wild-type by Student’s t-test (*P < 0.05; **P < 0.01), n = 3, ACT2 was used as the reference gene. C and D) Enzyme activity of GLO C) and HPR D) in rice. Data are represented as means ± SD. Asterisks indicate statistically significant differences compared with wild-type by Student’s t-test (*P < 0.05; **P < 0.01), n = 3. E) Photorespiration rate of rice plant leaves. Data are represented as means ± SD. Asterisks indicate statistically significant differences compared with wild-type by Student’s t-test (*P < 0.05; **P < 0.01), n = 10.
Next, we conducted enzyme activity assays for key enzymes involved in the photorespiration pathway in the peroxisome segment: GLO and hydroxypyruvate reductase (HPR). Both enzyme activities significantly increased in OXLAC plants, whereas plants with high miR397 expression displayed notably decreased enzyme activities (Fig. 5, C and D). This indicates that OsLAC15 activates the regulation of photorespiration. To quantitatively assess the photorespiration pathway's activation by OsLAC15, we measured the photorespiration rate in rice wild-type and transgenic plants under low oxygen (2%) and normal oxygen (21%) conditions using the photosynthetic rate difference method. The results showed that the photorespiration rate in wild-type plants was 11.42 ± 1.14 μmol CO2 m−2 s−1, while OXLAC transgenic plants exhibited a rate of 14.09 ± 2.07 μmol CO2 m−2 s−1, a 23.33% increase compared to WT. In OXmiR397a and OXmiR397b, the photorespiration rates were 8.13 ± 1.48 μmol CO2 m−2 s−1 and 8.08 ± 1.96 μmol CO2 m−2 s−1, respectively, indicating a 28.79% and 29.30% decrease compared to wild-type plants (Fig. 5E). Overall, the enzyme activity results and direct detection of leaf photorespiration rates affirm that miR397-OsLAC15 indeed impacts rice photorespiration.
High CO2 concentration would restore the late flowering in OXLAC
Because high environmental CO2 concentration suppresses the oxidase activity of RubisCO, physiological and morphological defects resulting from photorespiratory regulation can be compensated by elevating CO2 (Peterhansel and Maurino 2011; Umnajkitikorn et al. 2020). To explore whether high CO2 conditions would improve the growth status of OsLAC15-overexpressing plants, we cultivated both wild-type and transgenic rice plants under 3,000 ppm CO2 concentration for 35 d and subsequently transferred them to normal CO2 conditions (approximately 380 ppm in the atmosphere) for continued growth. Throughout this process, we closely monitored the growth of WT, OXmiR397a, OXmiR397b, and OXLAC plants on days 7, 14, 21, 28, and 35 (Fig. 6, A to E). During the initial week after germination, rice seedlings mainly rely on nutrients stored in the seeds due to their relatively weak photosynthetic capacity. At this stage, OXLAC seedlings appear shorter compared to wild-type and miR397 overexpressing plants (Fig. 6A). However, as we continued cultivation for 14, 21, 28, and 35 days under high CO2 conditions, the growth differences among the various rice plants gradually reduced (Fig. 6, B–E and G). At the conclusion of the 35-day high CO2 treatment, the OXLAC plants exhibited noticeable distinctions from those grown under normal CO2 conditions (Fig. 6, F and H). This suggests that inhibiting the photorespiration rate under high CO2 conditions effectively minimizes the growth and development disparities between OXLAC and WT or OXmiR397 plants.
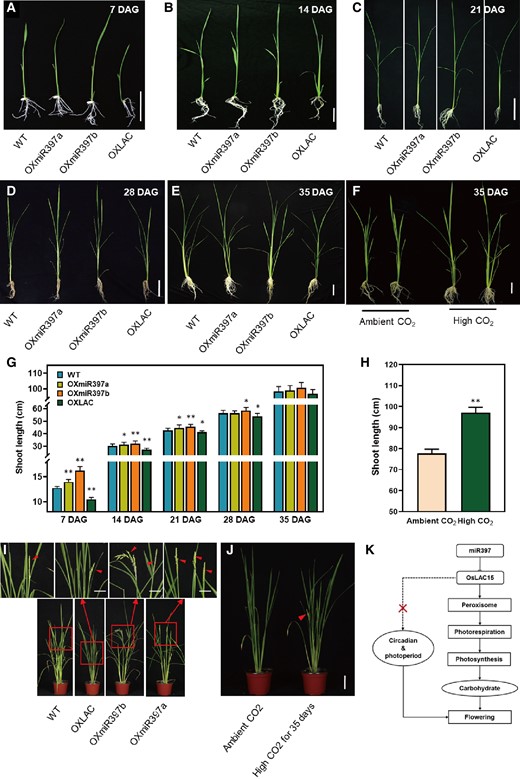
Phenotypes comparison of rice plants grown in high concentration or ambient CO2. A to E) Phenotypes of rice grown under the condition of high concentration CO2 for 7 days A), 14 days B), 21 days C), 28 days D), 35 days E); DAG, days after germination. F) 35-d-old OXLAC plants grown under the condition of high concentration or ambient CO2. For A and B), the scale bar is 5 cm, while for C–E) is 10 cm. G) Shoot length of rice grown under the condition of high concentration CO2. Data are represented as means ± SD. Asterisks indicate statistically significant differences compared with wild-type by Student’s t-test (*P < 0.05; **P < 0.01), n = 15. H) Shoot length of OXLAC rice grown under the condition of high concentration or ambient CO2. Data are represented as means ± SD. Asterisks indicate statistically significant differences compared with wild-type by Student’s t-test (*P < 0.05; **P < 0.01), n = 15. I) Flowering of rice plants that were first grown under the condition of high concentration CO2 for 35 d and then under ambient CO2 conditions. The scale bar is 10 cm. The triangles direct the emerged panicles. J) Comparison of flowering in OXLAC plants grown under ambient CO2 after 35 d high concentration CO2 with that grown under ambient CO2 condition. The scale bar is 10 cm. The triangles direct the emerged panicles. K) A simplified summary to show the regulation of miR397-OsLAC module in rice flowering.
Subsequently, we transferred the rice plants, which were previously cultivated under high CO2 conditions for 35 d, back to normal air conditions, while maintaining the same temperature and light periods. Under these conditions, the flowering time of OXmiR397a and OXmiR397b remained slightly earlier than that of wild-type, and interestingly, OXLAC also exhibited slightly earlier flowering than wild-type (Fig. 6I). On the contrary, OXLAC plants that were continuously grown under normal CO2 conditions had not fully expanded their flag leaves yet (Fig. 6J). This result further confirms that the activation of photorespiration by OsLAC15 is a decisive factor restricting the accumulation of photosynthetic products in rice, consequently leading to a delay in rice flowering.
Transcriptome-metabolome integrated analysis reveals global gene expression and metabolic alterations
To further investigate the downstream regulatory effects of the miR397-OsLAC15 module, we initiated an assay for OsLAC15 protein by assessing its enzyme activity. Laccase activities can be assessed through the measurement of 2,2'-Azino-bis(3-ethylbenzothiazoline-6-sulfonic acid (ABTS) oxidation, which serves as an indicator of laccase activity (Bourbonnais et al. 1998; Wang et al. 2004). By overexpressing OsLAC15 in cells and extracting total protein for ABTS method testing, we utilized total protein from cells expressing an empty vector (NC) and H2O (Background Sample [BLANK]) as controls. Our results demonstrated the oxidation of ABTS by OsLAC15, indicating its enzymatic oxidative activity as a laccase (Supplemental Fig. S4). We also conducted OsLAC15-GFP immunoprecipitation coupled with mass spectrometry (IP-MS) experiments, resulting in the identification of potential interacting proteins (Supplemental Table S3). These proteins are primarily involved in metabolic processes related to carbohydrates, lipids, flavonoids, and other substances, offering valuable insights for future mechanistic investigations.
Furthermore, we conducted a comprehensive analysis of both the transcriptome and metabolome to elucidate the global impact of miR397 and OsLAC15 on gene expression and metabolic processes. Through transcriptome sequencing, we identified 4,042 differentially expressed genes (Supplemental Table S4), which were subsequently subjected to Kyoto Encyclopedia of Genes and Genomes (KEGG) pathway analysis. Among the most prominent KEGG functional categories were global and overview maps, followed by carbohydrate metabolism and biosynthesis of other secondary metabolites (Supplemental Fig. S5). Within the carbohydrate metabolism subcategory, 14 pathways were involved (Supplemental Table S5). Among these pathways, 23 differentially expressed genes were associated with starch and sucrose metabolism, aligning with previous findings regarding changes in sugar accumulation. Additionally, there were 11 differentially expressed genes related to pyruvate metabolism and six associated with glyoxylate and dicarboxylate metabolism, which could be linked to alterations in the photorespiratory pathway. Metabolome profiling was conducted on OXLAC and wild-type plants, leading to the identification of 121 differentially expressed metabolites. Notably, 61 (50.41%) of them were flavonoids and isoflavonoids (Supplemental Fig. S6 and Table S6). Given the close relationship between laccase oxidative activity and flavonoid metabolism, this observation appears reasonable. In summary, the integrated analysis of the transcriptome and metabolome presented above highlights the potential of the miR397-OsLAC15 module to trigger global gene expression and metabolic alterations in rice.
Taken together, this study explores the role of miR397 and OsLAC15 in rice flowering. Overexpressing miR397 advances flowering and enhances photosynthesis, while overexpressing OsLAC15 delays flowering. MiR397 affects carbohydrate accumulation and regulates the photorespiration pathway through OsLAC15, influencing rice flowering traits (Fig. 6K). These findings offer valuable insights for developing early flowering and high-yield crop varieties through genetic breeding.
Discussion
The screening of flowering traits in plants has always been a critical topic in crop breeding research, as the successful timing of the flowering phase is essential for the formation of high-quality seeds and increased seed yield, especially in crops (Jung and Müller 2009). Advancing into the reproductive growth phase early allows crops to mitigate the impact of adverse environmental factors and pests, providing more time for grain filling and embryo development in later stages. Consequently, plant breeders are constantly striving to develop crop varieties that can both flower early and increase yield. However, achieving both early flowering and high yield in practical production appears to be challenging. Plants typically require a longer vegetative growth period and material accumulation to produce larger seeds and higher yields, while those that achieve early flowering often experience reduced yield. In our previous studies, we reported that overexpressing miR397 in rice promoted grain enlargement, and panicle branching (Zhang et al. 2013). In this study, we closely observed and recorded the flowering phenotypes and biomass accumulation in leaves 2 to 8 during the vegetative growth phase of miR397 overexpressing plants, OXmiR397a, and OXmiR397b. Our findings indicate that miR397 not only enhances substance accumulation during the vegetative growth phase but also promotes early flowering in rice by 5 to 8 d.
The photorespiration pathway, also known as the C2 cycle, is the process in green plants where O2 is absorbed and CO2 is released under light conditions (Peterhansel and Maurino 2011; Eisenhut et al. 2019; Wang et al. 2020). Unlike the assimilation effect of photosynthesis, photorespiration leads to the loss of CO2 fixed in the Calvin cycle of photosynthesis. RubisCO in the chloroplast has the ability to catalyze the carboxylation and oxygenation of ribulose-1,5-bisphosphate, which forms the structural basis for photorespiration. Despite numerous attempts to weaken photorespiration in C3 plants by altering the structure of RubisCO or inhibiting the activity of key enzymes, such efforts have not been successful (Raines 2011). Studies have shown that mutants lacking major enzymes in the photorespiration pathway, except for HPR in the peroxisome, cannot grow normally under atmospheric CO2 concentration. This highlights the importance and necessity of photorespiration in regulating plant growth, development, and natural immunity, suggesting that a moderate suppression of photorespiration rate in breeding practices based on photorespiration may yield better results. High-level expression of miR397 can accelerate the differentiation of rice floral meristems and increase yield by approximately 25%. This study identified OsLAC15, as a target gene of miR397, encoding a laccase-like protein localized in peroxisomes. By assessing the photorespiration rate and the activity of the key enzyme in the photorespiration pathway, GLO, we found that miR397 overexpression reduced the level of photorespiration, while overexpression of OsLAC15 substantially enhanced photorespiration. In OXmiR397 transgenic plants, the expression of OsLAC15 was suppressed to a lower level, resulting in a reduction of the photorespiration rate by about 30% compared to that of the wild-type. From the perspective of overall plant morphology, flowering phenotype, and yield phenotype, the level of photorespiration inhibition by miR397 is moderate.
The rice laccase gene family consists of 30 members, with most predicted to be secretory proteins. This suggests that the primary function of laccase family members is likely associated with plant lignification and secondary cell wall metabolism. However, as plants continue to evolve, it is inevitable that laccase members will gradually exhibit structural and functional differentiation. OsLAC15 serves as an example of the emergence of distinct functionality within the rice laccase family. Our subcellular localization study of OsLAC revealed its presence around the cell walls of Nicotiana benthamiana leaf epidermal cells. Surprisingly, we also discovered OsLAC expression in plant peroxisomes, a finding confirmed through colocalization with markers for laccases and peroxisomes. The rice laccase gene family can be divided into six subgroups, with OsLAC4, OsLAC5, OsLAC6, OsLAC11, OsLAC13, OsLAC14, and OsLAC15 classified under Group 1. OsLAC6 is predicted to localize in mitochondria. Considering that laccases are a type of multicopper oxidase if laccases involved in redox reactions are localized in mitochondria, their ectopic expression might affect the normal process of aerobic respiration in plants, leading to severe consequences for plant development and metabolic activities. These findings strongly suggest that the Group 1 laccase gene family has likely evolved additional potential regulatory functions, extending beyond the formation of secondary cell walls in plants.
This study focused on the regulatory mechanism of miR397-mediated OsLAC15 in rice flowering. Additionally, we conducted preliminary explorations of potential downstream regulatory mechanisms through IP-MS and integrated transcriptome-metabolome analysis. For example, transcriptome analysis revealed substantial alterations in the expression of genes related to carbohydrate metabolism, aligning with our earlier observations of changes in photosynthetic intensity and photorespiration. The IP-MS experiment for OsLAC15 indicated potential interactions with carbohydrate and flavonoid-related substances, consistent with the clustering of flavonoid compounds from the metabolomic data. These findings collectively suggest that miR397 and OsLAC15 exert a broad spectrum of effects on plant growth, development, and metabolic processes.
However, due to the complexity of the issue and time constraints, our current understanding likely represents only a fraction of the downstream regulatory pathways of the miR397-OsLAC15 module. Further research on the regulatory roles of miR397 and OsLAC15 requires more in-depth exploration. For example, the specific behavior of OsLAC15 in peroxisomes remains unclear. Peroxisomes, chloroplasts, and mitochondria in mesophyll cells are closely interconnected in the photorespiration pathway, collectively controlling the assimilation and dissimilation of nutrients within cells. This study detected those changes in the photorespiration rate mediated by miR397-OsLAC15 influenced leaf photosynthetic capacity and sugar accumulation in rice. However, the exact mechanism by which OsLAC15 protein affects the photorespiration pathway remains unknown. As a laccase-like enzyme, the substrates catalyzed by OsLAC15 also require clarification. Additionally, there may be other unknown proteins that interact with OsLAC15, raising further questions that require urgent resolution in the subsequent stages of this research.
Materials and methods
Plant materials
In this study, we used the japonica rice (Oryza sativa) background of Zhonghua 11 as the plant material. Transgenic rice plants overexpressing miR397a, miR397b, and the OsLAC15 gene were reported in our previously research (Zhang et al. 2013). The genomic DNA sequences of pre-miR397a, pre-miR397b, and the coding sequence of OsLAC15 were subcloned into the XbaI/EcoRI sites of the pHQSN vector, situated between the CaMV35S promoter and the Nos terminator. The HYGROMYCIN PHOSPHOTRANSFERASE (HPT) gene was employed as the selection marker. The rice plants, including wild-type and transgenic plants, were grown in a Thermoline TPG-1260-TH plant growth chamber with controlled CO2 concentrations of 3,000 ppm or 380 ppm, a temperature of 28 °C during the day and 25 °C during the night, and a 12-hour light/12-hour dark photoperiod. The nutrient solution used for plant cultivation was the Kimura B nutrient salt solution.
RNA extraction
Plant samples were weighed and ground in liquid nitrogen in a precooled mortar. For each 0.1 g sample, 1 mL of RNAzol, and 100 μL of 2 M NaAc (pH 4.0) were added, followed by thorough grinding. An equal volume of phenol:chloroform:isoamyl alcohol (49:1) was added, and the mixture was transferred to a 50 mL centrifuge tube. After 5 min of ice bath, the mixture was centrifuged at 4 °C and 12,000 rpm for 15 min. The supernatant was carefully collected, and an equal volume of phenol:chloroform:isoamyl alcohol (50:49:1) was added. After mixing, the mixture was left on ice for 5 min and then centrifuged at 4 °C and 12,000 rpm for 15 min. This extraction process was repeated 2 to 3 times. After collecting the supernatant, 0.6 volumes of isopropanol were added, and the mixture was placed on ice or at −20 °C for 30 min to 1 h. Then, it was centrifuged at 4 °C and 12,000rpm for 15 min, and the supernatant was discarded. The RNA pellet was dissolved in an appropriate amount of Diethylpyrocarbonate (DEPC)-treated water. To the dissolved RNA, 1/10 volume of 3 M NaAc (pH 5.2) and 3 volumes of anhydrous ethanol were added, mixed, and incubated at −20 °C for at least 2 h. After centrifugation at 4 °C and 12,000 rpm for 15 min, the supernatant was discarded, and the pellet was washed twice with 70% ethanol (v/v) and once with 95% ethanol (v/v). The RNA was then vacuum-dried for 5 min. The RNA was dissolved in 15 to 30 μL of DEPC-treated water and stored at −80 °C.
RT-qPCR
Reverse transcription was performed using the TAKARA PrimeScript RT reagent Kit With gDNA Eraser, and quantitative PCR was performed using the TAKARA SYBR Premix EX Taq (Perfect Real-time) Kit. The relative expression of mRNA was calculated using the ΔΔCt method, and the relative expression between different groups or different genes was calculated using the formula 2-ΔΔCt. The error bars in the bar graphs represent the standard deviation (SD) of 3 independent experiments, and the values presented are the average values ± standard deviation (Mean ± SD). The primers are listed in Supplemental Table S7.
Rice flowering time and main stem leaf count
Starting from the germination of seeds, the leaf age was marked every 10 d by placing a dot on the back of the leaf until the flag leaf emerged. The total number of main stem leaves was recorded for each plant. At the heading stage, the flowering time was counted daily at 11 Am, and the day when the panicle emerged on the main stem was recorded as the flowering date for each plant. Flowering time was recorded for all panicles until all rice plants had headed.
Rice leaf area measurement (2nd to 8th leaves)
Rice leaf area was measured using a correction coefficient. When the tested leaves were fully expanded, the length and width of the leaves were measured directly, and the leaf area was calculated by multiplying the length, width, and correction coefficient. The correction coefficient for rice leaves was 0.75.
GC-MS detection of sucrose, glucose, and fructose content in rice sheaths
Approximately 100 mg of the sample was taken and rapidly frozen with liquid nitrogen. Two minutes of grinding with steel beads at 20 Hz were applied to obtain a powder. Following this, 1400 μL of prechilled methanol (−20 °C) was added, and the mixture was vortexed for 10 s. Then, 60 μL of ribitol (stored in 0.2 mg/mL dH2O) was added as an internal quantitative standard, and the mixture was vortexed for 10 s. The mixture was shaken at 70 °C and 950 RPM for 10 min. Subsequently, centrifugation was carried out at 11,000 × g for 10 min, and the supernatant was transferred to a Schott GL14 glass bottle.
To the bottle, 750 μL of pre-chilled chloroform and 1,500 μL of pre-chilled dH2O (at 4 °C) were added, followed by vortexing for 10 s (800 μL for approximately 100 mg of the sample and 750 μL for approximately 50 mg). The mixture was then centrifuged at 2,200 × g for 15 min, and 150 μL of the upper phase (polar phase) was transferred to a new 1.5 mL tube. The sample was vacuum-dried (without heating), and the tube was filled with argon gas, and sealed in a plastic bag containing silica gel desiccant to prevent oxidation and degradation by atmospheric oxidants. Subsequently, 40 μL of methoxyamination reagent was added, and an empty tube was set aside as a blank control. The mixture was incubated at 37 °C for 2 h. Following this, 70 μL of the solution prepared with N-Methyl-N-(trimethylsilyl)trifluoroacetamide reagent was added, and shaking continued at 37 °C for an additional 30 min. The content was then transferred to a glass container for Gas Chromatography (GC)-MS analysis.
Measurement of total starch content in rice sheaths
After grinding the plant material, approximately 100 mg of the powdered sample was accurately weighed and added to a test tube (16 × 120 mm). The test tube was tapped to ensure settling at the bottom, and 0.2 mL of 80% ethanol solution (v/v) was added to wet the sample and facilitate dispersion. Thorough mixing was achieved using a vortex mixer. Immediately following, 3 mL of heat-resistant α-amylase was added, and the test tube was incubated in boiling water for 6 min, with periodic shaking every 2 min.
The test tube was then placed in a water bath at 50 °C, and 0.1 mL of starch glucoamylase was added, mixed well by vortexing, and incubated at 50 °C for 30 min. The entire solution from the test tube was transferred to a 100 mL volumetric flask, rinsed thoroughly, and the washings were added to the flask. The solution volume was adjusted with distilled water and thoroughly mixed.
Following centrifugation of the solution in the volumetric flask (3,000 rpm, 10 min), the clear, undiluted solution was used for measurement. Two aliquots of the diluted solution (0.1 mL each) were transferred into separate round-bottom test tubes. To each test tube, 3.0 mL of Glucose Oxidase/Peroxidase (GOPOD) reagent was added, and incubation at 50 °C was carried out for 20 min.
The glucose control included 0.1 mL of glucose standard solution (1 mg/mL) + 3.0 mL of GOPOD reagent. The reagent blank solution consisted of 0.1 mL of water and 3.0 mL of GOPOD reagent. Absorbance was measured for each sample and glucose control at 510 nm relative to the reagent blank.
Histological section and staining
Samples of rice basal meristematic tissue are fixed in Formaldehyde, Acetic Acid, and Ethanol solution precooled to 4 °C and placed on ice. The samples undergo a 15-minute vacuum treatment to facilitate rapid infiltration of the fixative into the tissues. After vacuuming, the fixative is replaced, and the samples are left for overnight fixation. Subsequent steps involve dehydration with ethanol at concentrations of 50%, 60%, 70%, 85%, and 95%, followed by staining with 95% ethanol containing 0.1% Safranin Y. A heating plate is preheated to 65 °C and covered with aluminum foil to prevent paraffin contamination. A paper box is prepared, filled with approximately 0.8 cm of pure paraffin, and quickly loaded with the fixed samples. The box is transferred to a tabletop with newspaper covering it, and once the paraffin at the bottom of the box starts to solidify, the orientation of the samples is adjusted. The box is then moved to cold water or ice for rapid solidification, and the resulting paraffin blocks with the embedded samples are stored at 4 °C. After attaching the samples to wooden blocks, sections of 6 to 10 µm thickness are obtained using a microtome. The resulting ribbons are floated on water in a culture dish, stretched, and placed on slides. Following overnight baking, the paraffin blocks are sectioned for microscopic analysis. The sections undergo dewaxing and rehydration using a series of ethanol and xylene solutions. This is followed by staining with 0.05% Methylene Blue staining solution. After staining, the sections are dehydrated, cleared, and mounted for microscopic observation.
Subcellular localization
The experiment involves the expression of the fusion protein of OsLAC15 and a fluorescent protein in protoplasts of rice and Arabidopsis. The OsLAC15-Cyan Fluorescent Protein (CFP) fusion protein is expressed using the agrobacterium-mediated transient transformation method in Nicotiana benthamiana leaf epidermal cells. A fluorescent protein fused with PTS1 is employed as a marker for peroxisome localization. The experiment utilizes a 2-photon laser scanning confocal microscope (Zeiss 7 DUO NLO), where the Cyan fluorescence of CFP is excited at 405 nm with a detection range of 410 to 500 nm; the green fluorescence of GFP is excited at 480 nm with a detection range of 490 to 520 nm; the yellow fluorescence of Yellow Fluorescent Protein (YFP) is excited at 514 nm with a detection range of 520 to 600 nm; chlorophyll autofluorescence is excited at 633 nm with a detection range of 650 to 750 nm, and the red fluorescence of mCherry is excited at 561 nm with a detection range of 560 to 610 nm.
Protein extraction and immunoblot analysis
After grinding the seeds into powder in liquid nitrogen, the powder was quickly transferred to pre-chilled centrifuge tubes. Extraction buffer, pre-chilled on ice, was added at a ratio of 1:5 (seed weight to extraction buffer). The extraction buffer consisted of 30 mmol/L Tris–HCl (pH 8.7), 50 mmol/L MgCl2, 1 mmol/L Ethylenediaminetetraacetic Acid, 1 mmol/L Vc (Vitamin C), 1 mmol/L PMSF (phenylmethylsulfonyl fluoride), and 10 mmol/L β-mercaptoethanol. After thorough mixing, the mixture was allowed to stand on ice for 10 min. Under 4 °C, centrifugation was performed at 12,000 rpm for 15 min, the precipitate was discarded, and the supernatant was collected. The supernatant underwent centrifugation again under the same conditions, and the protein solution was collected. The extracted protein was quantified using the Bradford method, based on the principle of the interaction between the Bradford reagent and proteins, causing a shift in the dye's maximum absorption peak from A456 to A595. Protein samples were then stored at −80 °C for long-term preservation. Antiplastocyanin antibody (Agrisera, AS06141) was used for immunoblot analysis. The protein levels were detected using a super Enhanced Chemiluminescence western blotting substrate (Beyotime, P0018AS).
RNA-Seq analysis
After the removal of reads containing adapters, exclusion of reads with more than 10% uncertain bases, and elimination of low-quality reads (bases with a quality value Q ≤ 5 constituting over 50% of the entire read), clean reads are generated for subsequent information analysis. Clean reads are aligned to both the rice reference genome and reference gene sequences using the short-read alignment software SOAPaligner/soap2, allowing for up to 2 mismatches. Gene expression levels are quantified using the Reads Per Kilobase of transcript per Million mapped reads (RPKM) method. Multiple hypothesis testing correction is applied to the P-values obtained from differential analysis, with the false discovery rate (FDR) controlled to determine the significance threshold. Differentially expressed genes are selected based on the criteria of FDR ≤ 0.001 and a fold change of at least 2. Pathway enrichment analysis is performed at the KEGG pathway level using hypergeometric testing. This analysis identifies pathways significantly enriched among differentially expressed genes when compared to the entire genome, providing insights into the main biochemical and signal transduction pathways in which these genes are involved.
Glycolate oxidase activity assay
Enzyme Extraction: 0.1 g of rice leaves were taken and homogenized with 1 mL of 0.1 mM Phosphate-Buffered Saline (pH 8.0) and a small amount of quartz sand. Following centrifugation at 4 °C and 12,000 rpm for 20 min, the supernatant was collected as the crude enzyme solution. A mixture containing 1 mL of 100 mmol/L pH 8.0 phosphate buffer, 0.05 mL of 4-aminopyridine, 0.05 mL of horseradish peroxidase, 0.15 mL of phenol, 0.15 mL of FMN, and 0.05 mL of glycolic acid was prepared. After thorough mixing, the solution was incubated in a constant-temperature water bath at 30 °C for 5 min. Subsequently, 0.05 mL of crude enzyme solution was added to initiate the reaction, and the change in absorbance per minute (ΔA/min) at a wavelength of 520 nm was measured. A standard curve was established using hydrogen peroxide (H2O2) to achieve final concentrations of 10, 20, 30, 40, and 50 μmol L−1. In this assay, one unit of enzyme activity was defined as the enzyme quantity required to produce 1 μmol of H2O2 per minute, denoted as 1 unit of enzyme activity (U).
Hydroxypyruvate reductase activity assay
Enzyme Extraction: 0.1 g of rice leaves were taken and homogenized with 1 mL of Buffer A and a small amount of quartz sand. Following centrifugation at 4 °C and 12,000 rpm for 20 min, the supernatant was collected as the crude enzyme solution.
HPR Activity Assay: The reaction system consisted of 1 mL and included 0.2 mM NADH/NADPH, 0.5 mM hydroxypyruvate, an appropriate amount of crude enzyme solution, and buffer A, adjusted to a final volume of 1 mL. The reaction temperature was maintained at 25 °C. All components, except for the substrate hydroxypyruvate, were mixed and allowed to stand for 5 min to eliminate endogenous interference. The reaction was initiated by adding the substrate, thoroughly mixing, and transferring the reaction mixture into a quartz cuvette with a 2 mm light path. The change in NADH/NADPH absorbance at 340 nm was measured. Standard curves were prepared for NADH at 2 to 10 μM and 20 to 100 μM, and for NADPH only at 2 to 10 μM. In this assay, 1 unit of enzyme activity was defined as the enzyme quantity required to catalyze the production of 1 μmol of NADH/NADPH to NAD/NADP per minute.
Laccase activity assay
Laccase activity was assessed through the ABTS oxidation method (Bourbonnais et al. 1998). The assay mixture consisted of 0.5 mM ABTS, 0.1 M sodium acetate (pH 4.5), and an appropriate enzyme quantity. The oxidation of ABTS was tracked by monitoring the increase in absorbance at 420 nm. For the reaction, 0.5 mM ABTS substrate was mixed with 2.8 mL of 0.1 M sodium acetate buffer at pH 4.5 and 100 μL of culture supernatant. The mixture was incubated for 5 min, and the absorbance was then measured at 420 nm, referencing against an appropriate blank.
Accession numbers
Sequence data from this article can be found in the GenBank/EMBL data libraries under the following accession numbers: ACT2 (LOC_Os10g36650), Ehd1 (LOC_Os10g32600), Hd3a (LOC_Os06g06320), OsCAT (LOC_Os03g03910), OscMDH (LOC_Os01g61380), OsGGAT (LOC_Os07g01760), OsGI (LOC_Os01g08700), OsGLO1 (LOC_Os03g57220), OsHPR (LOC_Os02g01150), OsLAC15 (LOC_Os05g38420), OsLHY (LOC_Os08g06110), OsmMDH (LOC_Os01g46070), OspMDH (LOC_Os03g56280), and OsSGAT (LOC_Os08g39300).
Author contributions
J.P.L. and C.Y. carried out the functional study and drafted the manuscript. Y.Z.F., Q.L., C.Y.W., Y.F.Z., Q.J.H., Q.F.Z., and Y.C.Z. carried out mutant screening and functional experiments. Y.Q.C. and Y.Y. conceived of the study, participated in its design, and coordination and helped to draft the manuscript. All authors read and approved the final manuscript.
Supplemental data
The following materials are available in the online version of this article.
Supplemental Figure S1. Circadian- and photoperiod-related gene expressions in rice miR397 or OsLAC15 overexpressors.
Supplemental Figure S2. Chlorophyll content in rice plants.
Supplemental Figure S3. Western blot of PC in rice.
Supplemental Figure S4. Enzyme activity of OsLAC15. Laccase activity was assessed through the ABTS oxidation method.
Supplemental Figure S5. KEGG Clustering Analysis of Differentially Expressed Genes in WT, OXmiR397b, and OXLAC.
Supplemental Figure S6. KEGG Clustering Analysis of Differentially Expressed Metabolites in WT and OXLAC.
Supplemental Table S1. Comparison of chlorophyll fluorescence dynamics parameters in miR397/OsLAC15 overexpressors and wild-type.
Supplemental Table S2. Subcellular localization prediction of OsLAC15 protein using 5 online tools.
Supplemental Table S3. Proteins identified in the OsLAC15 IP-MS assay.
Supplemental Table S4. 4,055 differentially expressed genes in WT, OXmiR397b, and OXLAC.
Supplemental Table S5. KEGG Clustering Analysis of Differentially Expressed Genes in WT, OXmiR397b, and OXLAC.
Supplemental Table S6. KEGG Clustering Analysis of Differentially Expressed Metabolites in WT and OXLAC.
Supplemental Table S7. Primers used in this study.
Funding
This research was supported by the National Natural Science Foundation of China (No. U1901202), grants from Guangdong Province (2019JC05N394 and 2022A1515010858) and support from “The open competition program of top 10 critical priorities of Agricultural Science and Technology Innovation” for the 14th Five-Year Plan of Guangdong Province (2022SDZG05).
Data availability
The RNA sequencing of 14-d-old rice seedlings generated in this study was submitted to the NCBI Sequence Read Archive database with the BioProject ID PRJNA1029241.
Dive Curated Terms
The following phenotypic, genotypic, and functional terms are of significance to the work described in this paper:
References
Author notes
Jian-Ping Lian and Chao Yuan contributed equally.
The author responsible for distribution of materials integral to the findings presented in this article in accordance with the policy described in the Instructions for Authors (https://dbpia.nl.go.kr/plphys/pages/General-Instructions) is Prof. Yue-Qin Chen.
Conflict of interest statement: None declared.
