


Abstract
Photosynthetic organisms harvest light using pigment–protein complexes. In cyanobacteria, these are water-soluble antennae known as phycobilisomes (PBSs). The light absorbed by PBS is transferred to the photosystems in the thylakoid membrane to drive photosynthesis. The energy transfer between these complexes implies that protein–protein interactions allow the association of PBS with the photosystems. However, the specific proteins involved in the interaction of PBS with the photosystems are not fully characterized. Here, we show in Synechocystis sp. PCC 6803 that the recently discovered PBS linker protein ApcG (sll1873) interacts specifically with PSII through its N-terminal region. Growth of cyanobacteria is impaired in apcG deletion strains under light-limiting conditions. Furthermore, complementation of these strains using a phospho-mimicking version of ApcG causes reduced growth under normal growth conditions. Interestingly, the interaction of ApcG with PSII is affected when a phospho-mimicking version of ApcG is used, targeting the positively charged residues interacting with the thylakoid membrane, suggesting a regulatory role mediated by phosphorylation of ApcG. Low-temperature fluorescence measurements showed decreased PSI fluorescence in apcG deletion and complementation strains. The PSI fluorescence was the lowest in the phospho-mimicking complementation strain, while the pull-down experiment showed no interaction of ApcG with PSI under any tested condition. Our results highlight the importance of ApcG for selectively directing energy harvested by the PBS and imply that the phosphorylation status of ApcG plays a role in regulating energy transfer from PSII to PSI.
Introduction
Light harvesting in cyanobacteria and red algae is enhanced by soluble protein–pigment complexes known as phycobilisomes (PBSs). The energy absorbed by PBSs is transferred to PSII and PSI embedded in the thylakoid membrane. In the model species Synechocystis sp. PCC 6803 (hereafter referred to as Synechocystis), the PBS consists of a tri-cylindrical core with 6 attached rods, in a hemidiscoidal arrangement (Gantt and Conti 1969; Bryant et al. 1979; Dominguez-Martin et al. 2022). The PBS consists of phycobiliproteins containing covalently linked bilin pigments and assembled into disc-like trimers (αβ)3 or hexamers (αβ)6 and colorless linker proteins that connect the phycobiliprotein discs (de Marsac and Cohen-Bazire 1977; Glauser et al. 1992; Anderson and Toole 1998; Adir 2005). Their size and ability to absorb light at wavelengths between 550 and 650 nm, where chlorophyll a absorption is low, increases the area and the spectral range of light harvesting in cyanobacteria.
The energy transfer from water-soluble PBS to the photosystems entails close contact between these complexes. A recent structure of the PBS–PSII super-complex (with a resolution of 14.3 Å) from the red algae Porphyridium purpureum UTEX 2757 provides insights on the architecture of this interaction, involving allophycocyanin E (ApcE, also classified as core membrane linker protein LCM), allophycocyanin D (ApcD), and 3 unidentified connector proteins from PBS (Li et al. 2021). These phycobiliproteins have been classified as terminal emitters responsible for energy transfer to PSII (ApcE) and PSI (ApcD; Gindt et al. 1992; Dong et al. 2009; Liu et al. 2013; Peng et al. 2014). Additionally, pull-down experiments followed by MS of PBS and photosystems from Synechocystis have shown putative contact sites in the interface of these super-complexes involving ApcD and ApcE (Liu et al. 2013).
Furthermore, PBSs and photosystems have been observed to be organized into 3 main microdomains in the thylakoid membrane, one containing the trimeric PSI, another one with the dimeric PSII and PBS, and the last one including both photosystems and PBS (Straskova et al. 2019). Additionally, cryogenic electron tomography of Synechocystis has shown that PBSs organize in arrays on the thylakoid membrane, presumably increasing the efficiency of light harvesting (Rast et al. 2019). While PBSs are able to transfer energy to either PSII or PSI, the proteins involved in PBS–PSII or PBS–PSI interactions that govern such specificity are still unknown. Moreover, energy transfer from PBS to PSI could follow 2 plausible models. On the one hand, there is the model of PBS mobility on thylakoid membranes, which assumes the detachment of PBS from PSII to then attach to PSI (Mullineaux et al. 1997; Sarcina et al. 2001; Yang et al. 2007). On the other hand, the spillover model proposes that the energy absorbed by PBS is first transferred to PSII, which then transfers the excess energy to PSI (Olive et al. 1997; McConnell et al. 2002; Folea et al. 2008). There is an efficient mechanism for short timescale regulation of photosystem activity in response to variations in both the quality and quantity of light known as state transitions. This process aims to prevent photodamage caused by the saturation of the photosynthetic electron transport chain, ensuring a balanced activity of both PSI and PSII. In contrast to plants, there is little consensus on how state transitions are achieved and regulated in cyanobacteria (Calzadilla and Kirilovsky 2020).
The Synechocystis PBS structure recently obtained by cryogenic electron microscopy (Cryo-EM, with a resolution of 2.1 to 3.5 Å) included different rod conformations and revealed a new PBS linker protein (ApcG) located at the bottom 2 cylinders of the tri-cylindrical core (Dominguez-Martin et al. 2022). Due to its location in the PBS core, it has been hypothesized that this linker protein could interact with the photosystems allowing the tethering of PBS to the thylakoid membrane.
Here, we show that the PBS linker protein ApcG binds specifically to PSII via its N-terminal region and that this interaction is likely affected by the phosphorylation state of ApcG. Furthermore, an apcG deletion strain shows slower growth compared with the wild-type under light-limiting conditions. Under normal light conditions, only a phospho-mimicking apcG complementation strain shows slower growth. This phenotype was further characterized by low-temperature fluorescence, revealing an imbalance in PSII and PSI activity in the deletion and complementation strains, which exhibited lower PSI fluorescence with the lowest in the phospho-mimicking version of ApcG. Our results indicate that ApcG plays a crucial role in PBS–PSII interaction and the transfer of energy toward PSI, presumably via the “spillover” mechanism.
Results
Domain organization of ApcG
The recent Synechocystis PBS structure showed that 2 ApcG molecules bind to the PBS at the membrane-facing side, one at each of the bottom core cylinders via the C-terminal domain of ApcG (Fig. 1, A and B; Dominguez-Martin et al. 2022). The PBS-binding domain is characterized by a conserved FxxM motif, which interdigitates with ApcA at the bottom core cylinder (Liu 2023; Fig. 1, A and C). The location observed in the Cryo-EM structure indicates that the N-terminal portion of ApcG extends outward from the PBS core, presumably to interact with the photosystems in the thylakoid membrane. A sequence search indicated that ApcG homologs are found in 94% of cyanobacterial genomes that also have an ApcE ortholog (Dominguez-Martin et al. 2022). Additionally, proteomics data indicate that ApcG and ApcE expression levels are comparable, with similar behavior under different light intensities (Zavrel et al. 2019). The amino acid conservation of ApcG orthologs from various cyanobacteria species shows 3 conserved domains: (i) the N-terminal domain, (ii) a positively charged middle domain, and (iii) the PBS-binding domain (Fig. 1C). Additionally, phospho-proteomic data show that ApcG contains several phosphorylation sites detected under low and high carbon growth conditions (Angeleri et al. 2016). They are located within the positively charged middle domain, which could play a role in regulating this region's interaction with the thylakoid membrane (Fig. 1, B and D). Specifically, residues 46 to 48 (TTS) were found to be phosphorylated under low and high carbon conditions (Angeleri et al. 2016). Furthermore, AlphaFold2 (Jumper et al. 2021) structure prediction of ApcG shows that the middle domain is unstructured compared with the PBS-binding domain (Fig. 1D). The conservation of ∼20 residues at the N-terminus (Fig. 1C) suggests that it could play a role in regulating the interaction of PBS with one of the photosystems.
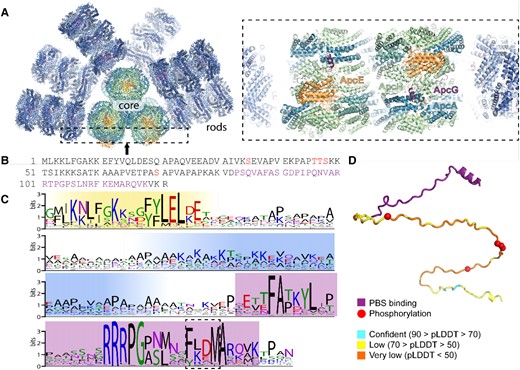
PBS linker protein ApcG binding site, conservation, and domain structure. A) Overview of Synechocystis PBS (left) and zoomed in view of ApcG binding site at the bottom cylinder (right). B) Primary structure of Synechocystis ApcG. Phosphorylation sites are highlighted in red, while PBS-binding region is in purple. C) Sequence conservation logo of 347 cyanobacterial ApcG homologs. The N-terminal conserved region is highlighted in yellow, positively charged region in blue, and C-terminal PBS-binding region in purple. The conserved FxxM motif is highlighted with a dashed box. D) AlphaFold predicted structure (colored according to prediction confidence) of residues 1 to 121 of ApcG (not present in the cryo-EM structure) of the combined model of the PBS interaction domain from the cryo-EM structure (purple). Phosphorylation sites are shown as red spheres.
The phosphorylation status of ApcG impacts growth and activity of photosystems in Synechocystis
In order to understand the physiological role of ApcG (sll1873 gene locus), we generated a deletion strain replacing the native coding sequence of apcG with a chloramphenicol resistance cassette (ΔapcG). Additionally, we complemented this deletion strain by replacing the native psbA2 gene copy (Englund et al. 2016) with the apcG wild-type open reading frame and 2 phospho-mimicking versions to test the impact of the phosphorylation sites in the positively charged domain (Supplemental Fig. S1). This strategy ensures strong expression of the genes under the promoter of psbA2 (PpsbA2) in Synechocystis. Furthermore, the expression of psbA2 under high light and under different light qualities is similar to that of apcG and psbA3 expressions, enabling the comparison of the complementation strains with wild-type and mutant strains (Luimstra et al. 2020; Cho et al. 2021). The generation of ApcG versions for testing the impact of its phosphorylation sites was achieved by mutating codons coding the residues 46 to 48 from apcG to glutamic acid (phospho-mimicking, TTS/EEE) or to alanine (permanent nonphosphorylated, TTS/AAA). Growth of wild-type and apcG deletion strains showed no differences under normal conditions (constant light, 30 μmol photons m−2 s−1) as well as under stress conditions such as high light (400 μmol photons m−2 s−1 light intensity) and light to dark intervals (12 h light and 12 h darkness; Supplemental Fig. S2). However, when the deletion strain was grown under light-limiting conditions (10 μmol photons m−2 s−1), its growth was strongly impaired compared with the wild-type (Fig. 2A). Furthermore, when complemented with the phospho-mimicking apcGTTS/EEE, growth was delayed during the exponential phase under both 10 and 25 μmol photons m−2 s−1 compared with the deletion mutant and the other complementation strains (Fig. 2A). Additionally, the comparison of the strain's growth using blue light (450 nm), green light (530 nm), red light (615 nm, exciting PBS), and far-red light (730 nm, exciting PSI; Fuente et al. 2021) showed that the phospho-mimicking apcGTTS/EEE strain only shows reduction in growth when using red and far-red light, which could indicate an imbalance in the activity of the photosystems (Supplemental Fig. S3). Whole-cell absorption spectra of wild-type and apcG deletion and complementation strains cultivated under normal conditions (i.e. white light of intensity 25 to 30 μmol photons m−2 s−1) were similar (Fig. 2, B and C). Analyses of the pigments present in the strains revealed that the phospho-mimicking strain contains a higher ratio of carotenoids to chlorophyll, reduced overall chlorophyll and carotenoid content, however, no difference in phycobiliprotein content compared with the wild type (Fig. 2D). Interestingly, the ratio of carotenoids and chlorophyll to culture turbidity, representing the amount of pigments per cell, was lower in the phospho-mimicking strain compared with the wild-type and the apcG deletion strain.
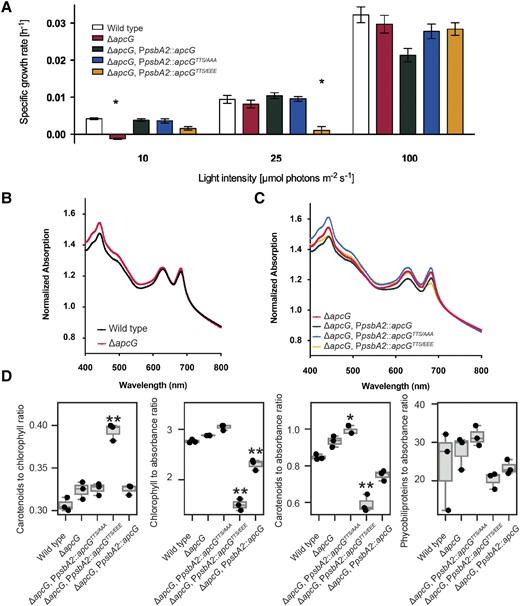
Impact on growth in apcG deletion strains. A) Specific growth rate comparison of the apcG deletion, complementation strains, and wild type under 10, 25, and 100 μmol photons m−2 s−1. Values represent means of 4 independent replicates ± standard error of mean, and asterisks show statistical difference compared with wild type according to Student's t-test (2-sided, P < 0.05). B) Whole-cell absorption spectra for wild-type Synechocystis and apcG deletion mutant and C) for apcG deletion and its complementation strains. Values correspond to averages of 3 biological replicates normalized to 720 nm. D) Comparison of the relative pigment composition among apcG strains. Pigment concentrations were measured in 3 biological replicates in mg/mL units, and culture turbidity was measured as absorbance at 720 nm. The center line in the boxplot represents the median, the box limits are the upper and lower quartiles, and the whiskers represent 1.5× interquartile range. Points represent individual measurement values. A single asterisk represents statistical significance at the P value of 0.05, and 2 asterisks represent statistical difference at the P value of 0.01.
To gain further insight into the photosynthetic performance of the strains, low-temperature (77 K) fluorescence spectra were recorded. In these experiments, we added an additional complementation strain using a construct coding for an apcG lacking the first 20 residues (of the N-terminal domain, Fig. 1B). Excitation of chlorophyll at 430 nm revealed a decrease in PSI fluorescence at 728 nm in the apcG mutant compared with the wild-type. An even lower PSI fluorescence was observed in the complementation strains using the phospho-mimicking apcGTTS/EEE accompanied by an increase in PSII fluorescence compared with wild-type and nonphosphorylated strains (Fig. 3A). Interestingly, when PBSs were excited at 590 nm, all strains showed reduced PSI and PSII fluorescence (Fig. 3B).
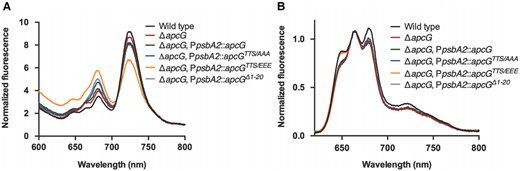
apcG deletion and phosphorylation impact PSII and PSI energy balance. Synechocystis cultures were grown to compare their fluorescence under low temperature (77 K). Each curve on the spectra represents the mean from 3 biological replicates. All cultures were preincubated at room temperature in darkness for 15 min before measurements. A) Fluorescence emission spectra of chlorophyll from Synechocystis with an excitation of 430 nm. The first peak at 680 nm corresponds to the fluorescence from PSII, while the one around 720 nm to PSI. Values correspond to mean of 3 biological replicates while normalizing the data to 800 nm. B) Fluorescence emission spectra of Synechocystis strains by exciting PBS at 590 nm. The fluorescence peak at 650 to 660 nm corresponds to PBS, 680 nm to PSII, and 720 nm to PSI. Values correspond to the means of 3 biological replicates while normalizing the data to the peak of PBS at 660 nm.
Since the apcG deletion, as well as phospho-mimicking apcGTTS/EEE showed a striking decrease in PSI fluorescence at 77 K, we investigated the possible role of ApcG in state transitions. State I was induced in all tested Synechocystis strains by pretreating the cultures with blue light, and State II was induced by preincubating the cultures in darkness. To monitor the differences in each state, 77 K fluorescence spectra of the cultures were recorded by exciting PBS at 590 nm. Surprisingly, all strains showed the same behavior as the wild-type under State I or II (Supplemental Fig. S4), indicating that the imbalance of PSI and PSII observed by exciting chlorophyll a (Fig. 3A) is not related to state transitions.
Because the phospho-mimicking complementation strain showed lower PSI fluorescence, we analyzed the steady-state levels of proteins from PBS, PSII, and PSI. Interestingly, immunoblots revealed no major differences between strains in the levels of marker proteins for PSI (PsaB), PSII (PsbA), and PBS (APC; Fig. 4, A and B). In order to discard the possibility that changes in the composition of thylakoid super-complexes could account for the lower PSI fluorescence observed in the apcG deletion strain, we compared the thylakoid super-complexes by blue native gels, which showed no differences between wild-type and the apcG deletion strain (Fig. 4C). Additionally, isolated PBS from wild-type, apcG deletion, and its complementation strains showed that the absence of ApcG did not impact the absorbance or fluorescence spectra of PBSs (Supplemental Fig. S5).
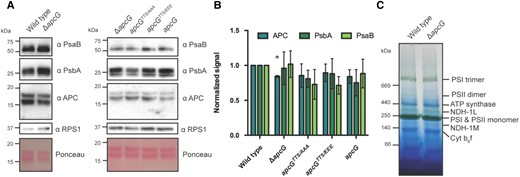
Impact of ApcG deletion on thylakoid super-complexes in Synechocystis. A) Whole-cell protein extracts were obtained from Synechocystis strains to compare the accumulation of marker proteins for PBS (APC), PSI (PsaB), and PSII (PsbA). The ribosomal protein RPS1 was used as loading control. A total of 20 μg of protein were loaded for each lane. A representative immunoblot out of 3 biological replicates is shown. B) Western blot signal quantification from 3 biological replicates for marker proteins APC, PsbA, and PsaB. Values were normalized using the wild-type signal. The error bars represent standard error of mean, and asterisks represent statistical difference compared with wild type according to Student's t-test (2-sided, P < 0.05). C) Thylakoid membrane fractions from wild-type and apcG deletion mutant were solubilized and separated on blue native gels to analyze the accumulation of the major thylakoid super-complexes. A total of 30 μg of chlorophyll were loaded for each strain. A representative native gel from one of 3 biological replicates is shown.
Overall, our physiological comparison of Synechocystis strains shows that PBSs impair energy transfer toward PSI when ApcG is phosphorylated, indicating a regulatory role impacting photosynthesis without disturbing the native organization of thylakoid super-complexes.
The N-terminal domain of ApcG binds PSII
The structure of Synechocystis PBS shows that the C-terminal domain of ApcG binds to one of the 2 bottom core cylinders, but the N-terminal and middle domains are not resolved (Dominguez-Martin et al. 2022). To investigate interaction partners of the N-terminal portion, we designed a version of ApcG where the PBS-binding domain is replaced by a His-tag (Fig. 5A). This allowed both the rapid purification of the recombinant protein from Escherichia coli as well as performing the pull-down experiments using nickel affinity resin. We incubated in vitro ApcG bound to nickel resin with solubilized thylakoid membranes and noticed that the eluate after washing was green. This was not observed in the negative control (no ApcG). Immunoblot analyses to detect marker proteins for PSI and PSII showed that proteins from PSII were pulled down with the truncated ApcG (Fig. 5B). The eluate was then separated on clear native (CN) gels showing the presence of one specific complex (Fig. 5C). A second dimension of SDS-PAGE from the CN gel suggests that the complex found could correspond to PSII when compared with thylakoid (Fig. 5D). Indeed, immunoblot analyses of the CN gels using antibodies against PsbA showed that it corresponds to PSII (Fig. 5E). Additionally, immunoblots using antibodies against the His-tag showed the presence of ApcG comigrating with the PSII complex, confirming their interaction (Fig. 5E).
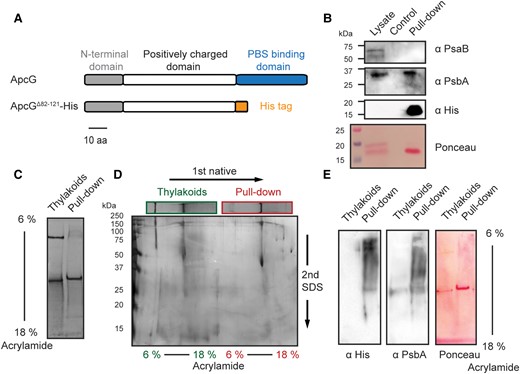
The N-terminal domain of ApcG interacts specifically with PSII. A) Schematic representation of ApcG domains and the ApcG truncation used for pull-down experiments. B) Immunoblots of the pull-down eluate using antibodies to detect the presence of PSI (anti-PsaB) and PSII (anti-PsbA). Whole-cell protein extract was used as a positive control for marker proteins. C) Solubilized thylakoid membranes were incubated with nickel beads containing ApcGΔ82–121-His. After washing the beads and eluting with 200 mm imidazole, the eluate was separated in CN gels. For comparison, solubilized thylakoid membranes were loaded alongside the eluate from the pull-down experiment. A total of 1.3 μg of chlorophyll was loaded into each lane. D) Second dimension of CN gel lanes by SDS-PAGE and stained with silver staining. E) Immunoblots of the first CN gel dimension of pull-down eluate with total thylakoid super-complexes. Antibodies against His-tag were used to detect the presence of ApcGΔ82–121-His. Additionally, antibodies against PsbA were used as a marker for PSII. Images from section B) to E) correspond to a representative experiment from 3 biological replicates.
Our results using complementation strains with the phospho-mimicking version of apcG suggest that phosphorylation of the positively charged domain of ApcG could impact its interaction with the thylakoid complexes or the membrane. In order to assess this possibility, we generated 2 additional versions of the truncated ApcG by mutating the same residues used for the complementation strains, i.e. a permanent nonphosphorylated (TTS/AAA) and a phospho-mimicking version (TTS/EEE). Pull-down experiments showed a decrease in PSII proteins pulled down by the phospho-mimicking version, while the wild-type and the nonphosphorylated version showed a similar amount of proteins from PSII (PsbA) being pulled down (Fig. 6A). Furthermore, when using 3 times the amount of phospho-mimicking (TTS/EEE) truncated ApcG for the pull-down experiment relative to wild-type and the permanent nonphosphorylated (TTS/AAA), similar amounts of PsbA were pulled down. This implies that the ability of ApcG to interact with PSII in the phospho-mimicking version (TTS/EEE) is reduced compared with the wild-type ApcG. The PSI core protein PsaB was not detected in any of the pull-downs, indicating that neither wild-type ApcG nor any of the phospho-mimicking mutants interact with PSI (Fig. 6B). In order to corroborate that the proteins pulled down corresponded to the complex of PSII, CN gels were run using the same amount of protein loaded in each lane and blotted to a membrane to detect PSII complexes using antibodies against PsbA. Indeed, all 3 ApcG versions were able to pull down PSII complexes (Fig. 6C). These results indicate that the N-terminal region of ApcG specifically interacts with PSII, while the phosphorylation of ApcG in its positively charged middle domain impairs the ApcG–PSII interaction. Additionally, the phosphorylation of ApcG does not alter its specificity for PSII.
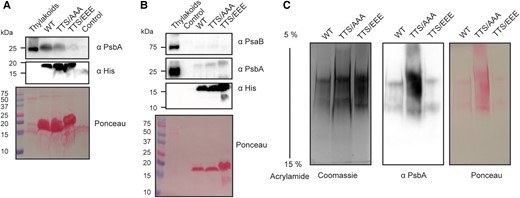
The phosphorylation status of ApcG influences its interaction with PSII. Pull-down experiments using the truncated form of ApcG with a mutated version for a permanent nonphosphorylated (TTS/AAA) and a phospho-mimicking version (TTS/EEE). Solubilized thylakoid membranes from the ApcG deletion strain were used to perform pull-down experiments. A representative experiment (1 of 4) is shown. A) Western blot analysis for the detection of PSII marker protein PsbA pulled down by each ApcG version used. Anti-His antibodies were used to detect the 3 ApcG His-tagged versions. The experiment was performed using the same amount of truncated ApcG versions and solubilized thylakoids. B) Pull-down experiment using 3 times more of the phospho-mimicking version (TTS/EEE) compared with wild type and permanent nonphosphorylated (TTS/AAA). Antibodies against marker proteins for PSII (PsbA) and PSI (PsaB) were used to detect the super-complexes pulled down by each truncated form of ApcG. C) Native gel analysis for the pull down of PSII super-complexes (2 μg of protein loaded per lane). A Coomassie stained gel is shown as well as the immunoblot detection of PSII marker protein PsbA. Images from section A) to C) show a representative experiment from 3 biological replicates.
Discussion
In cyanobacteria, the energy transfer from PBS to the photosystems is known to have several modes of regulation. For example, in response to high light, there is the PBS quenching mechanism mediated by the orange carotenoid protein, which dissipates the excess of energy absorbed by PBS (Leverenz et al. 2015; Kerfeld et al. 2017; Dominguez-Martin et al. 2022), thus reducing the likelihood of saturating the electron transport chain in the thylakoid membrane. Likewise, as a response to differences in light quality, the PBS can undergo state transitions by shifting between State I (PSII saturation or reduced plastoquinone pool) and State II (PSI saturation or oxidized plastoquinone pool) to balance the activity of both photosystems and prevent the accumulation of reduced intermediates in the electron transport chain (Bonaventura and Myers 1969; Hodges and Barber 1983; Emlyn-Jones et al. 1999; Xu et al. 2012). Cyanobacterial state transitions, unlike those of plants, are not well understood. Several models have been put forward to explain the mechanism behind this regulatory process. For example, the “attachment/detachment” model in which PBS are released from PSII (State I) and interact with PSI (State II; Mullineaux et al. 1997; Sarcina et al. 2001; Yang et al. 2007). Another model is the “spillover” mechanism in which PBS maintains its interaction with PSII, but excitation energy spills over from PSII to PSI (Olive et al. 1997; McConnell et al. 2002; Folea et al. 2008).
Several of our observations are consistent with a spillover mechanism. Our studies using deletion and complementation strains for different versions of ApcG showed that this linker protein is indeed necessary for the efficient transfer of energy to drive photosynthesis, especially under light-limiting conditions (10 μmol photons m−2 s−1 light intensity). Furthermore, under normal conditions (25 μmol photons m−2 s−1 light intensity), the phospho-mimicking apcGTTS/EEE strain showed delayed growth compared with all others including the deletion apcG strain (Fig. 2A). psbA2 replacement allowed the overexpression of apcG using the promoter from psbA2; however, psbA transcripts undergo posttranscriptional regulation (Sakurai et al. 2012), which could alter the expression levels of PsbA (D1) in PSII when deleting psbA2. Previously, characterization of psbA knock-out mutants show that, e.g., psbA3 alone is able to produce transcripts at a level comparable with the wild type (Mohamed and Jansson 1989; Mohamed et al. 1993); this is consistent with our results at the protein level indicating no difference in PsbA accumulation (Fig. 4B). Comparison of the deletion and complementation strains under increasing light intensities showed that the deletion of apcG increases the maximal measured growth rate (µmax) as well as the light intensity necessary to saturate growth (IS; Platt et al. 1980; Supplemental Fig. S6). Analyses of pigment content showed an increase in carotenoid per chlorophyll ratio in the phospho-mimicking apcGTTS/EEE strain (Fig. 2D). Similarly, deletion mutants for proteins affecting photosynthetic function in Synechocystis showed that indeed a higher carotenoid per chlorophyll ratio is symptomatic of light stress with increased antioxidant compounds content such as myxoxanthophyll and zeaxanthin (Havaux et al. 2003; Maeda et al. 2005; Schafer et al. 2005; Cunningham et al. 2010). Strikingly, 77 K fluorescence spectra of these strains displayed a decrease in PSI fluorescence when exciting chlorophyll with the lowest one observed in the phospho-mimicking apcGTTS/EEE strain along with an increase in PSII fluorescence. This phenomenon was observed in both the raw and normalized spectra among strains (Fig. 3A). In order to determine whether or not the PSI fluorescence from wild-type strain is due to the expression of IsiA (because this has been observed in conjunction with the formation of PSI–IsiA super-complexes; Burnap et al. 1993; Bibby et al. 2001a, 2001b; Nagao et al. 2023), we compared the oligomeric state of thylakoid super-complexes from strains grown under normal and iron deficiency conditions. Indeed, under iron-deficient conditions, a reduction is observed in PSI–IsiA complexes as well as PSI trimers (Duhring et al. 2006) compared with normal conditions (Supplemental Fig. S7). Considering that (i) in these strains, PBSs impact the PSI fluorescence even when PBSs are not absorbing energy (Fig. 3A) and (ii) among strains, there is no difference in PSI accumulation or super-complex distribution to account for the differences in PSI fluorescence (Fig. 4), the mechanism that best accounts for these observations is “spillover.” Furthermore, in 77 K fluorescence spectra from exciting PBS at 590 nm, all strains showed a reduced PSII and PSI fluorescence, which indicates less efficient energy transfer from PBS to these photosystems (Fig. 3B). Thus, as a consequence of the phosphorylation of ApcG, our results support an indirect effect of the PBS linker protein ApcG on the transfer of energy from PSII toward PSI most likely via “spillover.” The spillover model has generally been associated with state transitions (McConnell et al. 2002; Li et al. 2004, 2006). However, our results show that the putative spillover involving ApcG does not play a role in state transitions because all the mutant strains used in this study are able to transit between State I and II, comparable with the wild type (Supplemental Fig. S4). Therefore, the spillover phenomenon observed in the apcG deletion as well as in the phospho-mimicking apcGTTS/EEE strains implies that this process is not related to state transitions. Nonetheless, these 2 mechanisms (spillover and attachment/detachment) could very well happen in parallel, as has been suggested (Mullineaux et al. 1997; McConnell et al. 2002; Li et al. 2004, 2006; Mullineaux 2014). Thus, the phenotype observed under light-limiting conditions in the deletion apcG strain highlights the imbalance in PSI and PSII, leading to a decrease in the linear electron transport.
The PBS linker protein ApcG offers an opportunity to investigate the interface between PBS and the membrane-embedded photosystems because of its position at the base of the 2 core cylinders (Dominguez-Martin et al. 2022). Due to its occurrence along with ApcE, which by its domain architecture defines the cylindrical core structure of PBS, the function of ApcG in PBS is likely conserved among cyanobacteria. Hence, ApcG is expected to facilitate the interaction of PBS with complexes in the thylakoid membrane. Our pull-down experiments using a truncated form of ApcG lacking the PBS-binding domain show that the N-terminal region of the ApcG interacts with PSII from solubilized thylakoids, presumably via the conserved domains of the N-terminus or the positively charged middle region. Furthermore, in the ApcGTTS/EEE phospho-mimicking mutant protein, the interaction with PSII is impaired. Additionally, the phospho-mimicking apcGTTS/EEE strain showed delayed growth (Fig. 2A), suggesting that phosphorylation could as well cause repulsion of the middle domain from the negatively charged head groups of thylakoid lipids. Our results support a regulatory role for phosphorylation of ApcG by altering the charge of the positively charged middle domain, which influences its interaction with PSII (Fig. 6A). Indeed, phosphorylation of other PBS proteins has been reported (Toyoshima et al. 2020) (including ApcA, ApcC, ApcF, CpcA, CpcB), with CpcB phosphorylation having a direct impact on state transitions (Chen et al. 2015). Interestingly, 77 K spectra after excitation of the PBS at 590 nm showed lower PSII and PSI maxima among strains (Fig. 3B), implying that ApcG is involved in the interaction between PBS and PSII. This is supported by a red alga PBS–PSII structure containing 3 unknown connector proteins in PBS (Li et al. 2021). As observed in 77 K fluorescence spectra, PSI receives less energy in the apcG deletion and phospho-mimicking apcGTTS/EEE strains, and pull-down experiments showed no accumulation of PsaB (a core protein of PSI; Fig. 6B). These results suggest that the phosphorylation of ApcG in its middle domain impairs the energy transfer from PSII to PSI through spillover. However, we cannot discount the possibility that the experimental approach of mimicking phosphorylation by amino acid substitution may have had some slight perturbation on the folding or function of ApcGTTS/EEE although this seems unlikely given that the protein levels are similar across strains (Fig. 4A). Further studies are indeed required to determine if the phosphorylation affects the stability of ApcG as well as its specific interaction with PSII. The impairment occurs without a direct physical interaction between ApcG and PSI. Therefore, the effect that ApcG exerts on the fluorescence of PSI might be the result of PSII–PSI interaction allowing the energy from PSII to spill over to PSI. Indeed, there is experimental evidence for super-complexes involving PBS–PSII–PSI as well as PSII–PSI, except for PBS–PSI (Liu et al. 2013; Beckova et al. 2017; You et al. 2023). A super-complex of PBS–PSII–PSI would allow spillover to occur; we observe evidence for ApcG interacting solely with PSII yet affecting the energy transfer from PSII to PSI. A recent PBS–PSII–PSI super-complex structure has been reported in red algae P. purpureum; an ApcG homolog (Lpp2) is found in the super-complex interacting with a PSII dimer. In contrast, the PSII–PSI interaction does not involve Lpp2 (You et al. 2023), consistent with our observations (Figs. 3A and 6B).
Our experiments explored the influence of phosphorylation using only ApcG point mutations. Under similar growth conditions, other proteins of a PBS–PSII complex might also be phosphorylated. Indeed, PSII undergoes phosphorylation in several subunits (PsbA, PsbB, and PsbC) as well as for PSI (PsaA, PsaB, PsaC, PsaD, PsaE, PsaF, and PsaL; Angeleri et al. 2016; Toyoshima et al. 2020). Thus, our results cannot exclude that ApcG interacts with PSI or a PSI–PSII super-complex under conditions in which ApcG, as well as the subunits of PSI and PSII, undergo phosphorylation.
Collectively, our results show that the linker protein ApcG is necessary for efficient light harvesting under light-limiting conditions. While the C-terminal PBS-binding domain binds to each of the 2 core bottom cylinders (Dominguez-Martin et al. 2022), its N-terminal region interacts specifically with PSII as shown in our in vitro pull-down assays. Furthermore, when phosphorylated in its positively charged middle domain, the interaction of ApcG with PSII is hindered, which is associated with a slower growth rate (Figs. 2A and 6A). The phosphorylation of ApcG in complementation strains showed a decrease of energy absorbed by PSI even under conditions where PBS does not absorb light, suggesting a role for ApcG in the spillover from PSII to PSI.
Materials and methods
Cyanobacteria growth conditions
Cyanobacteria Synechocystis sp. PCC 6803 strains were grown in BG-11 medium (Rippka et al. 1979), buffered to pH 8 with 10 mm HEPES, at 28°C to 30°C under constant light (25 to 30 μmol photons m−2 s−1), and enriched with 3% CO2 (v/v), unless otherwise stated, in shaken liquid cultures (160 rpm). For selection of mutants on plates, BG-11 containing 3 g L−1 sodium thiosulfate was solidified with 1.2% Difco agar (w/v). Antibiotic concentrations used for selection of Synechocystis mutants were chloramphenicol at 25 μg mL−1 or spectinomycin at 20 μg mL−1.
Cyanobacteria growth under these conditions (hereafter referred to as normal conditions) was compared by cultivating the strains in flasks in batch regime starting with OD750 0.05. To apply light stress, the multicultivators (MC 1000-OD, Photon System Instruments, PSI, Czech Republic) were used for cultivations under constant high light (400 μmol photons m−2 s−1) or for 12 h darkness followed by 12 h illumination (30 μmol photons m−2 s−1) for a period of 10 d.
The strains were further cultivated in Multicultivators MC-1000-MIX (Photon System Instruments) in turbidostat regime, in BG-11 cultivation medium as described in the previous section at 30°C and at 0.5% CO2 (v/v). The strains were cultivated under 10, 25, and 100 μmol photons m−2 s−1 of warm white as well as green, red, and far-red light under 25 and 100 μmol photons m−2 s−1. The illumination was provided by LEDs with the following peaks and half-bandwidths: blue: 450 ± 25 nm, green: 537 ± 40 nm, red: 615 ± 25 nm, and far-red: 730 ± 15 nm (Supplemental Fig. S8). The density range of the turbidostat cultivation was set to OD720 0.5 to 0.51, (∼107 cells mL−1). The cultures were cultivated under each light condition for at least 22 h, to secure full metabolic acclimation (Zavrel et al. 2019). After the acclimation period, specific growth rates were estimated from the change of OD720.
Generation of Synechocystis deletion and complementation strains
The generation of deletion strain for apcG was done by amplifying the 600 bp upstream as well as downstream its gene locus (sll1873) using primers oREC1 (5′-CCCTCAAACCCCAAACGATT) and oREC2 (5′-CGGGGCGAATGGTTTCTAAC) and cloning into pJET1.2. The apcG gene was then replaced by a SacI site through inverse PCR using primers oREC3 (5′-GAGCTCTTTAATGTGGTTCTCCTAATTG) and oREC4 (5′-AAACCTCATTGATTTACTGTTTTATAC). This construct was used to introduce an insert from pRL1075 compatible for bacterial conjugation and containing chloramphenicol resistance cassette (Black et al. 1993). The insert was introduced by digestion and ligation using SacI, resulting in the construct pSL399 for transformation of wild-type Synechocystis sp. PCC 6803. For complementation strains, the open reading frame from apcG was amplified with oREC9 (5′-TCGTCATATGTTAAAAAAATTGTTTGGCGCT) and oREC10 (5′-GTGCTCGAGACCGGAGCGTTTAACCTTAACTTGGCGAG) and cloned into pET-28a(+) using restriction digestion enzymes BamHI and XhoI, resulting into the construct pREC4. A region containing apcG from pREC4 was amplified using oREC11 (5′-CCAATCCGGAGGATCCTATAGTTCCTCCTTTCAGCAA) and CK10 (5′-TAATACGACTCACTATAGGG) and cloned into pPSBA2KS (Lagarde et al. 2000) using restriction digestion enzymes BamHI and NdeI, resulting in the plasmid pREC6. A Bom site compatible for bacterial conjugation was incorporated into pREC6 by inverse PCR and ligation using oREC25 (5′-CACTCTCAGTACAATCTGCTCTGATGCCGCATCGAGCTCTGTACATGTCCGCGG) and oREC26 (5′-CACCATATGCGGTGTGAAATACCGCACAGATGAGAAGTACTAGTGGCCACGTGG) resulting in plasmid pREC9. A spectinomycin resistance cassette was incorporated into pREC9 by amplifying the aadA gene from pRL3332 (Nieves-Morion et al. 2017) using oREC46 and oREC47 having BamHI at both extremes that was used to clone it into pREC9 using its unique BamHI site, resulting in plasmid pREC17. Finally, the C-terminal His tag from pREC17 was removed by inverse PCR using oREC50 (5′-TGAGATCCGGCTGCTAACAAAG) and oREC51 (5′-GCGTTTAACCTTAACTTGGCGAGCCA) resulting in pREC28 bearing a spectinomycin cassette for selection in Synechocystis sp. PCC 6803 and a Bom site for bacterial conjugation of the deletion strain for apcG. The phospho-mimicking complementation constructs were generated by inverse PCR using pREC28 as template with primers oREC38 (5′-CCGGCTCCGGCTGCTGCTAAAAAAACT) and oREC39 (5′-TTTTTCCACCGGAGCTACCTCCG) for the permanent nonphosphorylated version (residues 46 to 48 TTS into AAA, construct pREC30) and the phospho-mimicking version (residues 46 to 48 TTS to EEE, construct pREC31) using primers oREC39 and oREC42 (5′-CCGGCTCCGGAAGAAGAAAAAAAAACT).
Furthermore, constructs for overexpression in E. coli for a truncated version of ApcG removing its PBS-binding domain (residues 82 to 121) and keeping a C-terminal His tag was obtained by inverse PCR using pREC4 as template and primers oREC32 (5′-AACTTTGGCCTTGGGAGCCGGGG) and oREC33 (5′-GGTCTCGAGCACCACCACCAC), to then subclone this region using BamHI and NdeI into pBF6 resulting in plasmid pREC54 for tetracycline bacterial induction. Likewise, phosho-mimicking versions for overexpression in E. coli were obtained by inverse PCR using pREC54 as template and primers oREC38 and oREC39 (permanent nonphosphorylated, pREC56) as well as oREC39 and oREC42 (phospho-mimicking version, pREC55). Transformation of wild-type as well as the ApcG deletion mutant was performed by bacterial conjugation as described by Black et al. (1993).
Synechocystis strains genotyping
Cyanobacteria Synechocystis sp. PCC 6803 strain cultures were grown to OD750 0.6 to 0.8 under normal conditions, and their genomic DNA was extracted by the phenol–chloroform method described by Billi et al. (1998). For amplification of the wild-type allele, the primers used by PCR were oREC12 (5′-AGACGGGGAAAAGGCTCTAC) and oREC13 (5′-CCGCTTCAATTTCCTCGTCC). However, the deletion allele was amplified with primers oREC12 and oREC27 (5′-TTCCACGGACTATAGACTATACT). The overexpression insertion was detected by amplifying a fragment using primers oREC57 (5′-CCCAGGGACAATGTGACCAAAAAATTCA) and oCK11 (5′-GCTAGTTATTGCTCAGCGG).
Protein expression and purification
Plasmids carrying the truncated form of ApcG for pull-down experiments (pREC54, pREC55, and pREC56) were transformed into E. coli BL21 DE3 (Invitrogen, Carlsbad, CA, USA). Cell cultures were grown in luria broth under 37°C till they reached OD600 ∼0.7, followed by induction with 10 μg mL−1 anhydrous tetracycline at 25°C overnight. One-liter cultures were centrifuged and resuspended in Buffer A (50 mm Tris pH 8, 200 mm NaCl) with protease inhibitor cocktail (Sigma, St. Louis, MO, USA), Dnase I (Sigma), and lysed using 2 passes through a cell disruptor (Constant Systems, Aberdeenshire, UK) at 15 kPSI. The soluble fraction of the lysed sample was obtained by centrifugation for 30 min at 30,000×g and 4°C. The recombinant proteins were purified loading the cell lysate supernatant to a 5 mL HisTrap HP column (GE Healthcare, Little Chalfont, UK), washed with Buffer A, followed by a 5-column volume (CV) of 90% Buffer A and 10% Buffer B (v/v) (50 mm Tris pH 8, 200 mm NaCl, 500 mm imidazole) and eluted with a 5 CV gradient from 10% to 100% Buffer B (v/v). The recombinant proteins were further purified by cation exchange. The eluate from HisTrap was diluted with 50 mm Tris pH 8 10 times to reach 20 mm NaCl and loaded into preequilibrated cation exchange resin (TOYOPEARL SP-650, CV 5 mL) and performed the chromatography by gravity at 4°C. The column was then washed with 10 CV of Buffer W (50 mm Tris pH 8, 20 mm NaCl), 5 CV with W2 (50 mm Tris pH 8, 50 mm NaCl), and eluted with Buffer A. When purifying the truncated form of ApcG with residues 46 to 48 TSS mutated to EEE (phospho-mimicking), cation exchange step was omitted due to their weak binding to the resin. Protein concentration was measured using BCA method (Pierce BCA Protein Assay Kit, 23227, Thermo Scientific).
Pull-down experiments with solubilized thylakoid membranes from Synechocystis
Cyanobacterial Synechocystis sp. PCC 6803 cultures of the apcG deletion strain grown for 1 wk under normal conditions were collected by centrifugation and resuspended in 0.1 m phosphate buffer and pH 7.5. The cells were broken by French pressing, and the membranes were separated from the soluble proteins by centrifugating the sample for 30 min and 45,000×g at 4°C. The thylakoids in the pellet fraction were resuspended in 10 mL of solubilization buffer (1% dodecyl-beta-d-maltoside [w/v], 750 mm aminocaproic acid, 50 mm Bis-Tris pH 7, and 50 mm imidazole) and were incubated on ice for 30 min. After this, the sample was centrifuged for 30 min at 30,000×g at 4°C to discard insoluble membrane complexes. The soluble fraction corresponds to the solubilized thylakoid super-complexes whose protein and chlorophyll contents were quantified by BCA method and methanol extraction, respectively. The solubilized thylakoid super-complexes were loaded into NTA nickel beads (0.8 mL CV) preincubated with the truncated ApcG with His tag at its C-terminus in solubilization buffer with 50 mm imidazole. Beads were incubated under rotation for 1 h at 4°C. The beads were then centrifuged for 2 min at 100×g, and the supernatant was discarded to wash the beads 4 times with 10 CV of solubilization buffer and 50 mm imidazole. The elution was performed with 1.5 mL of solubilization buffer and 200 mm imidazole.
Separation of super complexes in first dimension native and second dimension denaturing gels
Solubilized thylakoid super complexes as well as eluates from pull-down experiments were separated in native gels following the method described by Schagger and Vonjagow (1991). For CN gels though, the same method described by Schagger and Vonjagow (1991) was followed but by preparing the cathode running buffer as well as the sample loading buffer without Coomassie brilliant blue. After the separation of super-complexes in native gels, we further separated their protein content in a second dimension under denaturing conditions with 12% SDS-polyacrylamide gels (w/v) supplemented with 4 m urea. The gels were stained using the method described by Blum et al. (1987).
Preparation of total protein extracts
Synechocystis sp. PCC 6803 strains were grown in 10 mL BG-11 media in flasks of 25 mL under agitation under constant light (c. 25 to 30 μmol photons m−2 s−1) supplemented with 3% CO2 (v/v) until they reached OD750 ∼1. Cultures were centrifuged, and the supernatant was discarded to resuspend cells in extraction buffer (50 mm HEPES pH 7.0, 25 mm CaCl2, 5 mm MgCl2, 10% [v/v] glycerol, and protease inhibitor cocktail). Resuspended cells were broken by French pressing, and Triton X-100 was added to a final concentration of 1% (v/v). After incubation on ice for 10 min, cell debris was discarded by centrifugation for 2 min at 2,000 × g, 4°C and the supernatant was rescued as total protein extract. Protein concentration was measured by BCA method.
Cyanobacterial pigment analyses
To quantify chlorophyll and carotenoids, 1 mL culture was harvested in an Eppendorf tube. The cell pellet was suspended in 100% methanol (v/v), and absorption spectra of the extracted pigments were measured. The pigment concentration was calculated using calculations described by Zavřel et al. (2015). Phycobiliproteins were quantified as described by Zavrel et al. (2018).
Immunoblot analyses
Proteins separated into SDS-PAGE gels were transferred to a nitrocellulose membrane (Amersham, Protran). The membrane was blocked with 5% milk (w/v) in TBS (Tris 20 mm and 150 mm NaCl) at room temperature for 1 h and then incubated with monospecific polyclonal antisera in TBS-T (Tris 20 mm, 150 mm NaCl, and 0.01% tween-20 [v/v]) overnight at 4°C (anti-PsbA; AS05 084A; anti-PsaB; AS10 695; anti-APC; AS08 277; Agrisera, anti-His tag; TA150087; OriGene). The membrane was washed 3 times in TBST-T at room temperature for 15 min with each wash followed by incubation with secondary polyclonal antirabbit antisera HRP for 1 h at room temperature in TBS-T (Jackson ImmunoResearch, 111-035-003). After 3 additional washes with TBS-T, the membrane was visualized by the enhanced chemiluminescence technique.
Isolation of PBSs from Synechocystis
Cyanobacteria Synechocystis sp. PCC 6803 cultures of 1 L were grown under normal conditions for 1 wk and harvested for resuspension in phosphate buffer (0.8 m, pH 7.5) supplemented with protease inhibitor cocktail (Sigma). Cells were broken by French pressing followed by the addition of 1% Triton X-100 (v/v) and an incubation of 15 min at room temperature under darkness and gentle rotation. The soluble fraction containing PBSs was separated from the membrane fraction by centrifugation for 30 min at 30,000×g and room temperature. The supernatant was rescued and centrifuged again for 1 h at 42,000×g and room temperature, and the dark blue supernatant was separated from the green top with a syringe. These samples were loaded onto sucrose gradients composed of 1.5, 1, 0.75, 0.5, and 0.25 m phases in phosphate buffer (0.8 m, pH 7.5) and separated by centrifugation at 25,000 rpm and room temperature overnight. Intact PBS fractions were recovered from the 0.75 to 1 m interface of the sucrose gradients. The PBS protein content was measured by BCA method, and the proteins were precipitated by trichloroacetic acid before being separated into SDS-PAGE.
Measurements of absorption or fluorescence spectra
Whole-cell or PBS absorption spectra were recorded with a Varian Cary Bio 100 spectrophotometer (Agilent). Fluorescence spectra of isolated PBS samples were recorded with a fluorimeter (SpectraMax M2, Molecular Devices) exciting at 590 nm and emission spectra collected at room temperature from 610 to 800 nm.
Fluorescence emission spectroscopy at 77 K
Whole-cell fluorescence spectra at 77 K were obtained from cells grown in BG-11 media enriched with 3% CO2 (v/v) at an OD720 of 0.5 to 0.8. Cells were diluted for a final glycerol concentration of 60% (v/v), and absorption at 430 nm was not higher than 0.1. Cells were dark incubated at room temperature for 15 min and brought to 77 K for 15 min prior every measurement. Fluorescence emission was recorded at 77 K using a home-built spectrometer (Gurchiek et al. 2020) with LED compact double monochromator for excitation light source and a cryogenic chamber optistat DN (Oxford Instruments). The excitation wavelength was 430 or 590 nm with a 2-nm slit size. The emission wavelength measured was from 600 to 800 nm with a 4-nm slit size.
For state transitions measurements, cells were grown in BG-11 supplemented with 20 mm NaHCO3 and 10 mm HEPES-NaOH (pH 8.0) on a shaker at 30°C under constant light intensity at ∼50 µmol photons m−2 s−1. The cell concentration was adjusted to OD630 of 0.2 to 0.3 as measured by absorption spectroscopy using an integrating sphere (Shimadzu UV-3600i Plus with ISR-603). The dark treatment was applied for 20 min to induce State II, and subsequently, the blue light illumination was applied for 10 min to induce State I (McConnell et al. 2002; Bhatti et al. 2020; Calzadilla and Kirilovsky 2020). Fluorescence emission was recorded at 77 K using a FluoroMax-4 spectrofluorometer (Horiba Scientific). The excitation wavelength was 590 nm with a 2-nm slit size. The emission wavelength measured was from 630 to 780 nm with a 2-nm slit size. Fluorescence emission for each sample was recorded consecutively 3 times to obtain averaged spectra. The results shown are the averages of 3 independent biological replicates (3 independent cultures in 25 mL flasks grown from the same strain).
Software
Figures were generated using Adobe Illustrator CS6. Graphs and statistical analyses (Student's t-test, 2-sided, P < 0.05) were done using Python (Sanner 1999) and GraphPad Prism version 6.0 (GraphPad Software, La Jolla, CA, USA; www.graphpad.com). Structural figures were prepared with PyMOL (www.pymol.org). Semiquantitative analyses of western blots were generated using ImageJ (https://imagej.nih.gov). The sequence conservation logo was generated with Weblogo (Crooks et al. 2004).
Accession numbers
Sequence data from this article can be found in the GenBank/EMBL data library Uniprot in Supplemental Table S1.
Acknowledgments
The authors thank Dr Warren Beck (MSU) and his research group for assistance with 77 K fluorescence spectra measurements with CO2 supplementation.
Author contributions
R.E.-C. designed and conducted the research, analyzed the data, and wrote the article; M.I. conducted low-temperature fluorescence and analyzed the data; T.Z. conducted cyanobacteria growth experiments and analyzed the data; S.L.-Y. conducted pigment analyses of cyanobacteria strains and analyzed the data; C.A.K. and M.S. designed research, analyzed the data, and wrote the article; J.C., K.K.N. as well as all other authors provided comments on the manuscript and contributed to experimental design.
Supplemental data
The following materials are available in the online version of this article.
Supplemental Figure S1. Genotyping of deletion and complementation strains of apcG.
Supplemental Figure S2. Growth curve comparison of the wild-type and apcG deletion strains under normal and light stress conditions.
Supplemental Figure S3. Comparison of growth in apcG strains under different light qualities and quantities.
Supplemental Figure S4. ApcG does not play a role in state transitions.
Supplemental Figure S5. Absorption and fluorescence spectra of isolated PBS from deletion and complementation strains.
Supplemental Figure S6. Growth curves of apcG strains under different high light intensities.
Supplemental Figure S7. Absence of IsiA–PSI super-complexes under normal growth conditions.
Supplemental Figure S8. Light sources spectra.
Supplemental Table S1. Sequence data for ApcG homologs.
Funding
The research in the Kerfeld lab was supported by the Office of Science of the U.S. Department of Energy under award number DE-SC0020606. M.I. and K.K.N. were supported by the US Department of Energy, Office of Science, Basic Energy Sciences, Chemical Sciences, Geosciences, and Biosciences Division under field work proposal 449B. K.K.N. is an investigator of the Howard Hughes Medical Institute.
Data availability
The data underlying this article are available in the article and in its online supplementary material.
Dive Curated Terms
The following phenotypic, genotypic, and functional terms are of significance to the work described in this paper:
References
Author notes
The author responsible for distribution of materials integral to the findings presented in this article in accordance with the policy described in the Instructions for Authors (https://dbpia.nl.go.kr/plphys/pages/General-Instructions) is: Cheryl A. Kerfeld ([email protected]).
Conflict of interest statement. None declared.
