


Dear Editor,
n-Alkanes, the unfunctionalized component of leaf waxes, are indispensable in protecting land plants from desiccation, UV radiation, pathogens, and insect attack (Jetter and Kunst 2008). Although the fatty acids (FAs) biosynthetic pathway was elucidated only in bacteria (by Konrad Bloch, Feodor Lynen and colleagues), the pathway knowledge was “extrapolated” to land plants and algae. The current consensus on land plants is that (i) the immediate precursor for FA biosynthesis is pyruvate-derived acetyl-CoA, (ii) the chain growth is effected by the continual (stepwise) addition of a C2 unit (acetyl-CoA, derived from malonyl-CoA), and (iii) n-alkanes are formed by direct decarboxylation from FAs or indirect decarbonylation of fatty aldehydes formed by FA reduction (Jetter et al. 2006). However, the metabolic controls on FA chain elongation remain poorly understood, in addition to the metabolic branching into aldehydes, alkanols, and alkanes (Kunst et al. 2006), and if such metabolic controls differ between C3 and C4 land plants, given the sharp differences in their CO2 fixation biochemistries. Indeed, pathway-specific lipid contents differ between the two distinct photosynthetic modes (Zhou et al. 2015).
Natural abundance carbon isotope composition [δ13C, in units of mUr equivalent to ‰ = (Rsample−RV-PDB)/RV-PDB, where Rsample and RV-PDB are the 13C/12C ratios for the sample and international standard V-PDB (Vienna Pee Dee Belemnite), respectively] is particularly useful for elucidating/confirming biosynthetic pathways and gauging fluxes at metabolic branch points (Monson and Hayes 1980; Schmidt and Kexel 1997; Gleixner et al. 1998; Zhou et al. 2016; Zhu et al. 2020) as the biochemical reactions involved in lipid biosynthesis are accompanied by isotope effects (IEs). The split of biochemical labor between mesophyll and bundle sheath cells in C4 photosynthesis distinguishes itself isotopically from C3 photosynthesis. For example, there are clear demarcations between bulk organic matter δ13C of C3 (−20 to −35 mUr, averaging −26 mUr) and C4 (−10 to −14 mUr, averaging −12 mUr) (Farquhar et al. 1989; Brugnoli and Farquhar 2000). Such distinction is also seen in lipids (Chikaraishi and Naraoka 2007; Zhou et al. 2010), and is tied to the physiological roles of lipids (Zhou et al. 2015).
To identify the possible differences in metabolic controls on lipid biosynthesis in C3 and C4 plants, we obtained the δ13C-versus-chain length profiles of leaf n-alkanes for field-grown C3 (14 species) and C4 (24 species) grasses (see Supplemental Information S1). In all C3 species surveyed, n-alkanes δ13C showed an overall decreasing trend with chain growth (C19 to C37), while an overall opposite trend was observed across all C4 species surveyed (Fig. 1; see Supplemental Figs. S2 and S3 for a complete list of individual profiles). The contrast is clear, regardless of whether the leaves are healthy or unhealthy, or whether the leaves are grown at high or low latitudinal zones (see also Chikaraishi and Naraoka 2007).
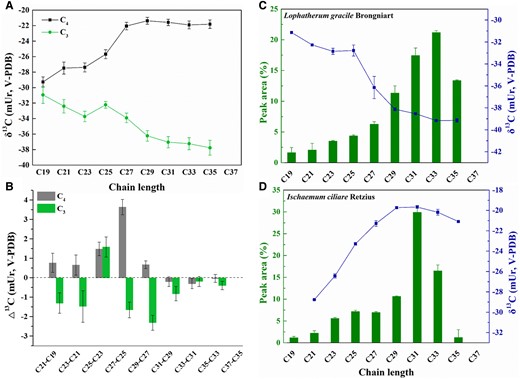
The observed contrasting leaf n-alkanes δ13C-versus-chain length profiles between the “averaged” C3 and C4 grasses. The y-axes in A and B) represent the arithmetic mean of δ13C for all individual species investigated, and the (stepwise) δ13C difference between two neighboring (C2n−1 and C2n+1) n-alkanes, , respectively. The error bars represent mean ± Se (n = 14 for C3 grasses, n = 24 for C4 grasses). Juxtaposed are the profiles of two representative individual species (Lophatherum gracile Brongniart, a C3, C), and Ischaemum ciliare Retzius, a C4, D)). The even-carbon-numbered (ECN) n-alkanes, which are much lower in abundance than, and track the δ13C trend of their odd-carbon-numbered (OCN) homologs, are excluded here. The error bars represent mean ± Sd (n = 2).
To facilitate a general (physiological and biochemical) explanation for the contrasting trends of n-alkane δ13C-versus-chain length, we related the δ13C of n-alkanes to the IEs accompanying the FA chain growth and branching into other lipid derivatives following the established biosynthetic pathways (see Supplemental Information S2 for the histories of carbons in the lipids) using the following equation (see Supplemental Information S2 for the derivation of the below equation):
where , , and are the isotope compositions of C2n FA, C2n+2 FA, and C2n−1 alkane, respectively; , and are the isotope fractionations (all negative) associated with the formation of a C–C bond between a C2n fatty acyl-ACP chain and an acetyl-CoA during chain elongation, between the residual and the original FAs, and decarboxylation or decarbonylation, respectively; and are the isotope compositions of the C2 extension unit (acetyl-CoA) and the carboxyl carbon of the C2n FA, respectively; f is the respective flux (F) ratio between decarboxylation/decarbonylation and the elongated, and the residual FAs (lumped with alkanols and aldehydes); n (>10 but <19 in this work) is the number of chain extensions with C2 units needed for the formation of C20–38 FAs.
The stepwise δ13C change from C2n−1 alkane to C2n+1 alkane () can be approximated by using the below equation (see Supplemental Information S2 for further details of the derivation),
that is to say, () depends largely on , and the differences () between two neighboring FAs in their respective f (flux ratio) values. Because only is always negative and chain length dependent among the three terms on the right of Eq. 2, it is therefore the best candidate to account for the observed decreasing trend in the “averaged” C3 plants (Fig. 1A), which is also observed by Abraham and Hesse (2003), and confirmed by our most recent position-specific carbon isotope analysis (PSIA-13C) for a C16:0 FA of C3 plant origin, which showed that the C2 unit ending up in the fatty chain is progressively depleted (Zhao et al. 2023). However, the magnitude of the stepwise decrease () increased from C19 to C27 alkane, rather than the predicted decrease, before leveling off slightly thereafter. As can either stay unchanged in a metabolic steady state (i.e. acetyl-CoA pool size is stable) or become progressively enriched as more acetyl-CoA is drawn down, reducing the acetyl-CoA pool for chain elongation, and therefore, cannot contribute to the observed magnitude increase of the stepwise decrease (), substantial flux ratio change during the chain extension of C3 leaf lipids is therefore inferred.
Because the chain-length-dependent decrease, , should apply to both C3 and C4 plants, the actual magnitude of the increase with chain length in C4 plants, caused by an increase in , alone, or an increase in both and , should be even greater than that observed across the entire chain length range and at every single cycle of chain extension. Because, as stated above, the sign of is uncertain, the chain-length-dependent isotopic change in the precursor acetyl-CoA, , must account for the observed increasing trend in the “averaged” C4 plants. The intramolecular δ13C profiles of hexoses (the ultimate precursor, Gilbert et al. 2012) and acetyl-CoA (the immediate precursor) for lipid biosynthesis (see Supplemental Fig. S5) differ between C3 and C4 plants (Henn and Chapela 2000). However, such difference can explain only the possible C3-versus-C4 difference in the intramolecular 13C distribution of the fatty lipid chains, but not the here deduced chain-length dependence of in C4 plants, as chain growth involves only C–C bond formation between fatty acyl-ACP and acetyl-CoA (Julien et al. 2022).
Here, we invoke a Rayleigh-type isotope fractionation mechanism associated with the export of sugars from leaves to explain the deduced chain-length dependence of in C4 plants (Fig. 2). In C4 monocots, 14CO2-pulse-chase experiments showed that >77% of the hexoses (sucrose) are exported, while only about 30% are exported in C3 monocots (Grodzinski et al. 1998). The IE associated with the export () of sugars enriches the residual sugars in an export ratio (p)–dependent fashion. A higher p (as in C4) leads to greater 13C-enrichment in the residual sucrose (δR) than a lower p (as in C3). When the residual sucrose is converted to acetyl-CoA, such differential enrichment is passed first onto the FAs and then to other lipids. Considering that only a fraction of the pyruvate generated from the “residual” sugars is converted to acetyl-CoA, the actual p values for C4 and C3 are likely even greater. For a realistic = −3 mUr, the isotopic enrichment difference between C4 (with a realistic p of 0.9) and C3 (with a realistic p of 0.4) is estimated to be 5.2 mUr. This difference is sufficient to account for the bulk of the observed stepwise increase () (Fig. 1).
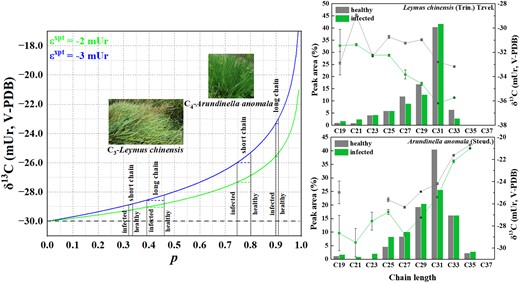
A Rayleigh-type fractionation mechanism explaining the isotopic dependence of the residual sugars (δR), the ultimate precursor for the synthesis of the acetyl-CoA used in fatty chain extension, on the portion (p) of exported sugars. The curves are represented by , where and δR,0 are the isotopic fractionation associated with sugars export and the initial isotope composition of sugars (the dashed line), respectively. The = −3 mUr used for the calculation of δR is a realistic estimation based on the known −3 mUr fractionation associated with the export of triose phosphates from chloroplast (Gleixner et al. 1998; note that even though there is evidence (Bögelein et al. 2019) for a relative 13C-enrichment of sucrose in the phloem sap over leaf sucrose, we believe that is a consequence of respiration in the sink tissues, rather than sugar export from leaf). Because, in general, C4 (not C3) acetyl-CoA for the synthesis of FAs is limited, the isotopic consequence of the across-the-board improvement in acetyl-CoA supply (p) increase following infection (upper right for C3, lower right for C4) is predicted to be more pronounced in the C3 longer chain and C4 short chain during lipid biosynthesis. The error bars represent mean ± Sd (n = 2).
The validity of the proposed Rayleigh-type fractionation mechanism can be tested with growth experiments where paired δ13C values and pool sizes of acetyl-CoA, δ13C values and abundances of FAs of different classes and chain lengths, and leaf sugar export ratios at various stages of FA biosynthesis can be obtained and compared between C3 and C4 grasses. However, an easier, albeit indirect, test is to compare the n-alkane δ13C-versus-chain length profiles between healthy and unhealthy (infected with phyllospheric microorganisms such as fungi, bacteria, and viruses) leaves. Here, the p sensitivity to infection is predicted to differ between C4 and C3. Indeed, such profiles for both Arundinella anomala Steud. (a C4) and Leymus chinensis Trin. (a C3) showed, in addition to a clear δ13C decrease in the infected grasses (compared with healthy ones), which can be attributed to respiration and blockage of stomata by microorganisms, and forced recycling of internal CO2 for photosynthesis (Suryanarayanan et al. 2022), a diminishing decrease toward the longer chains in C4 plants, and a growing decrease toward the longer chains in C3 plants. This is likely because C4 photosynthesis is less affected by infection, as it is equipped with a carbon concentration mechanism, and the priority to allocate acetyl-CoA resources for shorter FA biosynthesis.
In conclusion, we observed an overall decreasing leaf n-alkanes δ13C trend with chain growth in C3 grasses and an overall opposite trend in C4 grasses. The δ13C-versus-chain length profile in C3 grasses can be explained by a kinetic isotope effect associated with C–C bond formation between a fatty acyl-ACP chain and an acetyl-CoA during chain elongation and flux changes from FA to their longer homologs, fatty alcohols/aldehydes, and n-alkanes, while that for C4 can be rationalized mainly by a (much) higher export ratio (relative to C3) of leaf sucrose that enriches the 13C of the residual sucrose, the precursor for FA synthesis. The inferred fundamental difference in the metabolic controls of fatty lipid chain extension between C3 and C4 grasses can be validated by directly targeting the C2 unit pool size and isotopic composition in the context of fatty chain elongation.
Acknowledgments
Dr S.T. Li, and Dr W. Sun and Ms S.X. Zhou are thanked for their help with isotopic instrumentation and sample collection, respectively. Discussions with Drs X.Y. Gong, Y.Y. He, and X. Song and Profs B.L. Zhang and C.H. Hocart improved the quality of the manuscript. This is contribution #33 from the Isotopomics in Chemical Biology (ICB) group.
Author contributions
Y.P.Z. conceived and designed the study. Y.Z., Y.P.Z., and H.B.Y. collected samples, conducted experiments, acquired data, and prepared the manuscript; Z.Y.Z., B.W., Q.L.Y., S.W.H., and Z.G.S. contributed to the discussion.
Supplemental data
The following materials are available in the online version of this article.
Supplemental Figure S1. The GC/MS and GC/C/IRMS chromatograms for Ottochloa nodosa.
Supplemental Figure S2. The δ13C and relative abundance-versus-chain length profiles of C4 grass leaf n-alkanes.
Supplemental Figure S3. The δ13C and relative abundance-versus-chain length profiles of C3 grass leaf n-alkanes.
Supplemental Figure S4. The δ13C of individual n-alkanes-versus-chain length profiles for the “averaged” C3 and C4 grasses.
Supplemental Figure S5. The pathways (enclosed in the blue box with dashed lines) for n-alkane (and other lipids) biosynthesis in plant leaves and the differences in the ultimate precursors (sucrose 27 in C3 and 27′ in C4) and immediate precursors (acetyl-CoA 6a and 6b in C3, and 6c and 6d in C4), metabolic controls between C3 and C4 cells.
Supplemental Table S1. The δ13C differences of individual n-alkanes between the original (certified) and the recovered n-alkane standard mixture from the whole procedure blank experiment.
Supplemental Table S2. The photosynthetic modes of the investigated grass species, and the δ13C and chemical abundances of their leaf n-alkanes, together with the published sugar export ratios of C3 and C4 grasses.
Supplemental Information S1. The experimental details.
Supplemental Information S2. Deriving the quantitative relationship of δ13C of individual n-alkanes with chain length and metabolic branching into other lipids in plant leaves.
Funding
Chinese Natural Science Foundation (NSF) grants (42250203 and 41973072 to Y.P.Z. and 32071507 to Z.Y.Z.) are gratefully acknowledged.
Data availability
All data were included in the supplemental files.
Dive Curated Terms
The following phenotypic, genotypic, and functional terms are of significance to the work described in this paper:
References
Author notes
Yu Zhao and Hubiao Yang contributed equally to this work.
The author responsible for distribution of materials integral to the findings presented in this article in accordance with the policy described in the Instructions for Authors (https://dbpia.nl.go.kr/plphys/pages/General-Instructions) is: Youping Zhou ([email protected]).
Conflict of interest statement. None declared.
