


Abstract
Organelle-derived nuclear DNAs, nuclear plastid DNAs (NUPTs), and nuclear mitochondrial DNAs (NUMTs) have been identified in plants. Most, if not all, genes residing in NUPTs/NUMTs (NUPGs/NUMGs) are known to be inactivated and pseudogenized. However, the role of epigenetic control in silencing NUPGs/NUMGs and the dynamic evolution of NUPTs/NUMTs with respect to organismal phylogeny remain barely explored. Based on the available nuclear and organellar genomic resources of wheat (genus Triticum) and goat grass (genus Aegilops) within Triticum/Aegilops complex species, we investigated the evolutionary fates of NUPTs/NUMTs in terms of their epigenetic silencing and their dynamic occurrence rates in the nuclear diploid genomes and allopolyploid subgenomes. NUPTs and NUMTs possessed similar genomic atlas, including (i) predominantly located in intergenic regions and preferential integration to gene regulation regions and (ii) generating sequence variations in the nuclear genome. Unlike nuclear indigenous genes, the alien NUPGs/NUMGs were associated with repressive epigenetic signals, namely high levels of DNA methylation and low levels of active histone modifications. Phylogenomic analyses suggested that the species-specific and gradual accumulation of NUPTs/NUMTs accompanied the speciation processes. Moreover, based on further pan-genomic analyses, we found significant subgenomic asymmetry in the NUPT/NUMT occurrence, which accumulated during allopolyploid wheat evolution. Our findings provide insight into the dynamic evolutionary fates of organelle-derived nuclear DNA in plants.
Introduction
In higher plants, mitochondria and plastids originated from the endosymbiotic α-proteobacteria- and cyanobacteria-like prokaryotes, respectively (McFadden 1999; Osteryoung and Nunnari 2003; Archibald 2015). Owing to the same cellular environment, extensive intercompartmental DNA transfer among nuclear, mitochondrial, and plastid genomes occurred during the course of evolution in higher plants (Martin et al. 2002; Keeling and Palmer 2008; Kleine et al. 2009; Downie and Jansen 2015). Among those DNA transfer events, the frequency of transfer of the plastid DNA (ptDNA)/mitochondrial DNA (mtDNA) to the nucleus was much higher than that of the other transfer events, such as DNA transfer from the nucleus to organelle genomes or between organelle genomes (Martin et al. 1998; Kleine et al. 2009; Sloan et al. 2018; Zhao et al. 2019). The nuclear plastid DNA (NUPT) and nuclear mitochondrial DNA (NUMT) refer to the organellar DNA derived from the plastids and mitochondria, respectively, which have already been incorporated in the nuclear DNA (Leister 2005). NUPTs/NUMTs occur frequently and continuously; for example, >200 deciphered plant genomes, including Arabidopsis (Arabidopsis thaliana), rice (Oryza sativa), maize (Zea mays), and common wheat (Triticum aestivum), possess NUPTs/NUMTs with varying abundance (Michalovová et al. 2013; Zhang et al. 2020). Moreover, changes in the external environment and the switch of a developmental stage can lead to dramatic changes in the frequency of NUPT/NUMT occurrence in the nuclear genome (Sheppard et al. 2008; Caro et al. 2010; Cheng and Ivessa 2010; Wang et al. 2012a, b). Several potential mechanisms underpinning the transfer and integration of ptDNA and mtDNA into the nuclear genome have been posited: (i) direct physical association of the nucleus with the organelle, (ii) formation of the tubular extensions from the organelle membranes for the DNA transfer (Leister 2005), and (iii) occurrence of double-strand breaks (DSBs) in the nuclear genome, facilitating ptDNA/mtDNA integration between those breaks by the nonhomologous end joining pathway or through homologous recombination (Kleine et al. 2009; Hazkani-Covo et al. 2010; Portugez et al. 2018).
Several studies have reported that after the integration into the nuclear genome, NUPTs/NUMTs could generate nucleotide mutations (Huang et al. 2005), amplify together with the hosting transposable elements (TEs) (VanBuren and Ming 2013), or get fragmented because of TE insertion (Michalovová et al. 2013). The foregoing processes are prone to inducing interruptions in the open reading frames (ORFs) of those organellar genes residing in NUPTs/NUMTs (NUPGs/NUMGs). It is well established that the majority of NUPGs/NUMGs are inactivated, as they lack regulatory elements to drive their transcription and a sequence coding a signal peptide to target them to the correct subcellular compartment (Kleine et al. 2009; Sloan et al. 2018). However, there remains an open question as to whether NUPGs/NUMGs also lack additional factors such as an open chromatin/active epigenetic environment in order to enable their re-activation. Three exemplary studies independently reported NUPTs/NUMTs as the alien nuclear genetic materials (like TEs) to be silenced through genomic defense (Zhang et al. 2020), the important role of DNA methylation against NUPTs to maintain genome stability (Yoshida et al. 2019), and the possible role of epigenetic modification in the silencing of a NUMT fragment in Arabidopsis (Fields et al. 2022). However, these studies did not compare the DNA methylation and other epigenetic modifications of NUPGs/NUMGs with the indigenous nuclear genes; moreover, the generality of their conclusions remained unclear.
Besides diploid divergence and speciation, the ubiquitous whole-genome duplication or polyploidization has played a pivotal role in the evolution and speciation of angiosperms (Adams and Wendel 2005; Jiao et al. 2011; Van de Peer et al. 2017). Theoretically, in a polyploid plant, multiple nuclear subgenomes are merged into the same nucleus; thus, more nuclear sites are available for NUPTs/NUMTs. Based on the established subgenome dominance embodied as asymmetric expression, epigenetic modification, structural variations, and TE dynamics (Pont and Salse 2017; Bird et al. 2018; Li et al. 2021), whether the evolutionary dynamics of NUPTs/NUMTs are related to these features of subgenome asymmetry poses an intriguing question.
The wheat (genus Triticum) and goat grass (genus Aegilops) within Triticum/Aegilops complex consists of 31 species including 14 diploid, 11 allotetraploid, and 6 allohexaploid species (Ogihara et al. 2016). Around 7 million years ago (MYA), ancient Triticum and Aegilops species diverged into 2 diploid lineages, namely A- and B-lineages; thereafter, the D-lineage species were derived from the homoploid hybridization between A- and B-lineage species. Common wheat (T. aestivum) harboring 3 distinct subgenomes, A (from Triticum urartu in the A lineage), B (from an unknown species related to Aegilops speltoides in the B lineage), and D (from Aegilops tauschii in the D lineage), was eventually developed via 2 distinct rounds of allopolyploidization events (Marcussen et al. 2014; Levy and Feldman 2022; Li et al. 2022; Xiao et al. 2022). Similarly, the Triticum/Aegilops complex species encompass a reticulate evolutionary trajectory involving diploid speciation, allopolyploidization, and crop domestication and improvement. Moreover, a series of high-quality nuclear and organelle genome assemblies in the Triticum/Aegilops complex species have been recently published (Avni et al. 2017; Luo et al. 2017; International Wheat Genome Sequencing Consortium et al. 2018; Ling et al. 2018; Maccaferri et al. 2019; Walkowiak et al. 2020; Wang et al. 2020; Fu 2021; Li et al. 2022), these genomic resources established the basis for systematic investigation of the dynamic evolution of NUPTs/NUMTs at the phylogenomic scale (Liang et al. 2018).
In this study, we investigated the evolutionary fates of NUPTs/NUMTs by delineating the genome-wide atlas of NUPTs/NUMTs in the diploid and allopolyploid Triticum/Aegilops species. We also characterized the mutational features, expression profiles, and epigenetic modification atlas of NUPGs/NUMGs. We constructed a phylogenomic- and pan-genomic-based pipeline to analyze the evolution pattern of the genomic/subgenomic NUPTs/NUMTs during the diploid speciation and allopolyploid evolution of the Triticum/Aegilops species. Our results provide insights into the dynamic evolutionary fates of organelle-derived nuclear DNAs in plants.
Results
The landscapes of NUPTs/NUMTs in the Triticum/Aegilops complex species
The genomic/subgenomic NUPTs were identified by Blastn homology search using plastid genomes of respective or closely related Triticum/Aegilops complex species (see Materials and Methods). Considering the sequence variation in mitochondrial genomes among species (even among different accessions within the same species) (Liu et al. 2011), we only adopted the T. aestivum mitochondrial genome as a query to identify NUMTs that shared homology to the T. aestivum mitochondrial genome. After a series of quality control filtration, a total of 2,605 to 4,068 NUPT and 4,909 to 8,242 NUMT high-confidence sequences were identified (Fig. 1B; Supplemental Figs. S1B, S2 and Table S1; see Materials and Methods). The number of NUPTs and NUMTs varied across different species lineages: NUPTs, D lineage > B lineage > A lineage (except T. urartu); NUMTs, D lineage > A lineage > B lineage (except Ae. speltoides) (Fig. 1B; Supplemental Fig. S1B). At the allohexaploid level, all tested accessions displayed typical patterns, namely D subgenome > B subgenome > A subgenome (NUPTs) and B subgenome > D subgenome > A subgenome (NUMTs; Supplemental Fig. S4). The majority of NUPTs (49.0% to 53.1%) and NUMTs (56.2% to 64.0%) were short insertions (<200 bp), and >90% of both NUPTs and NUMTs were <2,000 bp in size (Supplemental Figs. S3 and S4). The median size of NUPTs was slightly greater than that of NUMTs (Fig. 1C; Mann–Whitney U test, P value <0.01).
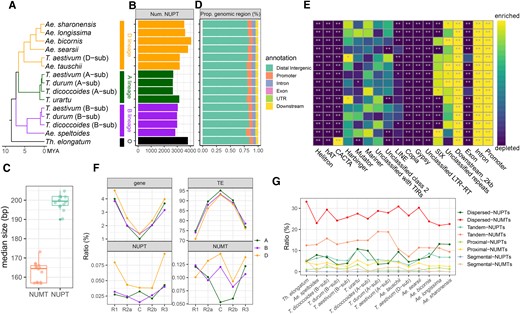
Genomic landscape of NUPTs/NUMTs in the Triticum/Aegilops complex species. A) Phylogenetic tree topology in the Triticum/Aegilops complex species from a previous study (Li et al. 2022). B) Total number of NUPTs among genomes/subgenomes. C) The median length of NUPTs and NUMTs; each point represents a given genome (diploid) or subgenome (allopolyploid). D) The proportion of the distribution of different genomic features for NUPTs. Box-plot elements are defined as center line, median; box limits, upper, and lower quartiles; whiskers, 1.5× interquartile range; points, each data point. E) Enrichment/depletion analysis of NUPTs in different nuclear genome regions based on bootstrap hypothesis test. The threshold of significant level is set to 950 of 1,000 simulations (alpha = 0.05) with frequency less than (enriched) or larger than (depleted) real frequency for a given genomic region. The significant results are shown as **P < 0.01 and *0.01 < P < 0.05. F) The relative proportion of genes, TEs, and NUPTs/NUMTs in 5 different chromosome regions of the IWGSC RefSeq 1.0 genome; the division of chromosome regions is based on the work of International Wheat Genome Sequencing Consortium et al. R1, distal region on chromosome short arm; R2a, proximal region on chromosome short arm; C, centromeric-pericentromeric region; R2b, proximal region on chromosome long arm; R3, distal region on chromosome long arm. G) The proportion of different types of duplicated NUPTs/NUMTs in each genome/subgenome, including dispersed, tandem, proximal, and segmental NUPTs/NUMTs. The corresponding genomic characteristics of NUMTs are shown in Supplemental Fig. S1.
The genomic distribution of both NUPTs and NUMTs was conserved across the genomes/subgenomes. As expected, the majority of NUPTs/NUMTs were located in the intergenic regions (78.3% to 84.1% for NUPTs; 84.5% to 90.2% for NUMTs) (Fig. 1D; Supplemental Fig. S1C), but were enriched in promoter, intron and gene downstream regions, whereas depleted in exon, CACTA and Gypsy transposon regions (Fig. 1E; Supplemental Fig. S3D). Notably, NUPTs were depleted in Copia transposon regions, while NUMTs showed the opposite pattern (Fig. 1E; Supplemental Fig. S1D). The distribution of NUPTs/NUMTs, relative to the protein-coding genes and TEs present in the chromosomes, was further compared (Fig. 1F) based on the IWGSC RefSeq 1.0 genome [T. aestivum Chinese Spring (CS) variety]. The gene density gradually decreased from the telomeric region to the centromeric region, whereas TEs exhibited opposite trends in all 3 subgenomes (Fig. 1F); intriguingly, neither NUPTs nor NUMTs showed a distribution similar to that of genes or TEs. The NUPT/NUMT distribution patterns within different subgenomes were distinct (Fig. 1F), suggesting that large-scale subgenomic/species-specific integration/deletion of the ptDNA/mtDNA happened during the evolution of the Triticum/Aegilops complex species.
Additionally, the occurrence and the extent of the second amplification/duplication events of NUPTs/NUMTs were investigated. Intriguingly, similar to other indigenous genic duplication events, the results showed a large scale of endo-nuclear replication events for both NUPTs and NUMTs (see Materials and Methods). A total of 8.2% to 24.7% NUPTs and 34.5% to 55.6% NUMTs had at least one duplication event, where the major duplication classes were dispersed duplication and tandem duplication, followed by proximal duplication (Fig. 1G). Segmental duplication events occurred with the lowest frequency (Fig. 1G). Enrichment analysis revealed that NUPTs/NUMTs endo-nuclear replication was reduced in genic-related regions, while interestingly, duplicated NUMTs were enriched in Copia transposon regions, suggesting a possible role of transposons in enhancing intranuclear amplification in Triticum/Aegilops complex species (Supplemental Fig. S5).
Genetic variations resulting in ORF disruption of NUPGs/NUMGs
Taking NUPTs as an example, after aligning to the corresponding organelle genomes, all NUPTs in each of the genomes/subgenomes covered the whole plastid genome regions, suggesting that the ubiquitous ptDNA sequences could transfer into the nuclear genome (Fig. 2A). During genomic evolution, NUPTs/NUMTs could generate a wide range of genetic variations, such as single nucleotide polymorphisms (SNPs) and insertions/deletions (InDels). A detailed analysis of respective SNPs and InDels in NUPTs among all the genomes/subgenomes with reference to their indigenous plastid genomic sequences revealed the following: (i) 17.7% to 25.6% SNP sites (73.7% nonredundant SNPs in total) and 3.1% to 9.9% InDels (28.8% nonredundant InDels in total) were identified in our interested Triticum/Aegilops complex (Fig. 2, B and C); (ii) SNPs and InDels were highly similar among NUPTs of all the genomes/subgenomes in terms of their types, transitions, and transversions for SNPs and InDels of different lengths. For SNPs, the proportion of transitions (especially G to A and C to T) was larger than that of transversions, which is consistent with the results of a previous study (Noutsos et al. 2005). For InDels, the proportions of 1-bp variations (both insertion and deletion) were substantially overwhelming compared with the other length classes (Fig. 2, D and E); (iii) In NUPTs of all the genomes/subgenomes, the proportions of conserved SNPs and InDels (<1%) were very low, and 23.1% of SNPs and 47.1% InDels were genome-specific (Fig. 2, F and G); (iv) mutations within the same genome/subgenome origination (A, B, D, and S) were highly shared, resulting in the phylogenomic-mimic clustering pattern, especially for SNPs (Fig. 2, H and I). NUMTs exhibited similar mutation patterns as NUPTs; moreover, they had certain conserved genomic variations as well as a higher proportion of species-specific variations (Supplemental Fig. S6).
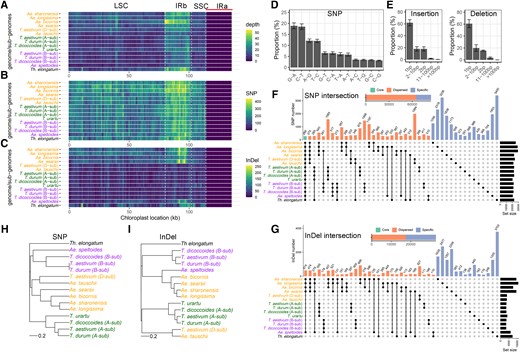
Characteristics of genetic variations in NUPTs compared with the plastid genome. The density feature of NUPTs in different regions of the plastid genome is based on non-overlapping 1-kb windows, including A) insertion frequency (depth), B) single nuclear polymorphism (SNP) density, and C) InDel density. NUPTs were first aligned to the plastid genomes and then examined for each feature. LSC, large single-copy region; SSC, small single-copy region; IRa, repeat region a; IRb, repeat region b. D) The proportion of different types of SNPs. E) The proportion of different types of insertions and deletions. The error bars in D) and E) indicate the Sd among different genomes/subgenomes. F and G) The UpSet plot based on the intersection matrix of SNPs F) and InDels G) in each variation site among genomes/subgenomes. The total number of SNPs and InDels including core, dispersed, and specific classes were also shown. H and I) The NJ tree topology is based on the intersection matrix of SNPs H) and InDels I) used in F) and G). The corresponding information on NUMTs is shown in Supplemental Fig. S6.
Given that SNPs/InDels could induce ORF disruption via fragmentation and premature and frameshift mutations, we explored the genetic fate of the NUPGs/NUMGs in terms of their intact and disrupted ORFs. NUPGs/NUMGs with intact and disrupted ORFs were named as i-NUPGs/NUMGs and d-NUPGs/NUMGs, respectively. The NUPT/NUMT alignment with respective plastid/mitochondrial genomes identified 142 (Triticum durum B-subgenome)–784 (Aegilops bicornis) and 104 (Ae. speltoides)–364 (Ae. bicornis) sequences harboring both i-NUPGs/NUMGs and d-NUPGs/NUMGs. Among them, d-NUPGs ranged from 44.3% (T. durum B-subgenome) to 75.2% (Aegilops sharonensis), and d-NUMGs ranged from 56.7% (T. urartu) to 90.4% (Ae. bicornis) (Fig. 3A; Supplemental Fig. S7A). Among the proportions occupied by d-NUPGs, Sitopsis genomes were the largest (57.3% to 76.7%), followed by A- (57.0% to 60.9%), B- (44.4% to 59.7%), and D (48.1% to 50.9%)-genomes/subgenomes (Fig. 3A). The proportions of d-NUMGs in the different genomes/subgenomes existed in a similar order as that of NUPGs but with an overall higher probability of disrupted ORFs (Supplemental Fig. S9A). The frequency of i-NUPG/NUMG ORFs was determined for different organelle genes (Fig. 3B; Supplemental Fig. S7B). Relative to the indigenous plastid genes, the ORFs of 60S ribosomal protein L22 (rpl22), cytochrome f protein of cytochrome b6f complex (petA), NADH dehydrogenase subunit 4 (ndhD) and 7 (ndhH) in the nuclear genome were almost disrupted (low i-NUPG ratio), whereas most of cytochrome b6f complex subunit VI (petL) and N (petN), photosystem II protein L (psbL) and N (psbN) in the nuclear genome maintained their intact ORFs (high i-NUPG ratio; Fig. 3B).
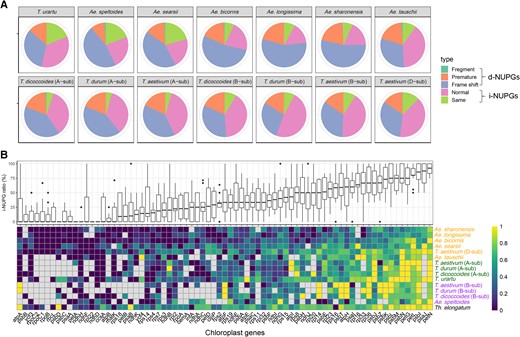
The genetic fate of genes in NUPTs. A) Different genetic fates of genes in NUPTs. Three groups including lost start and terminal codons (fragment), SNP/InDel induced premature (premature), and frameshift were defined as d-NUPT genes (NUPGs) (disruption of ORFs), whereas those that maintained original (same) and larger than 50% amino acid similarity (normal) with plastid gene sequences were defined as i-NUPGs (maintaining intact ORFs). B) The proportion of i-NUPGs for each plastid gene among different genomes/subgenomes. The box plot on the top panel shows the proportion of each plastid gene among the 13 genomes/subgenomes. Box-plot elements are defined as center line, median; box limits, upper and lower quartiles; whiskers, 1.5× interquartile range; points, outliers. The heatmap on the bottom panel gives detailed information on each plastid gene in each genome/subgenome. The corresponding information on NUMTs is shown in Supplemental Fig. S7.
Repressive epigenetic atlas of transcriptional silenced i-NUPGs/NUMGs
In spite of maintaining intact ORFs, the eventual coding abilities of i-NUPGs/NUMGs still depend on their transcriptional status. Accordingly, based on the PacBio SMRT and Illumina RNA-seq data, we further analyzed whether those i-NUPGs/NUMGs were transcribed in the nuclear genome of hexaploid wheat (see Materials and Methods). Using PacBio SMRT RNA-seq data, we found that 0.04% to 2.5% and 0.02% to 0.08% of transcripts/isoforms included at least one plastid and mitochondrial annotated gene, respectively (Supplemental Table S2). Furthermore, almost all transcripts/isoforms were transcribed from the plastid/mitochondrion rather than from i-NUPGs/NUMGs based on the similarity assessment (Supplemental Table S2), which was also confirmed by analyses using Illumina RNA-seq data (Supplemental Table S3), suggesting the global transcriptional silencing of the i-NUPGs/NUMGs after their insertion into the nuclear genome.
The epigenetic landscape of alien promoter-depleted i-NUPGs/NUMGs and nuclear indigenous genes was also compared in detail. Accordingly, we characterized and compared the epigenetic signal intensities (DNA methylation in the CG, CHG, and CHH contexts and 6 histone modifications) among NUPTs/NUMTs, i-NUPGs/NUMGs, protein-coding genes (PC-genes), transposons (such as Gypsy, Copia, and CACTA transposons), and their up/downstream flanking regions (±3 kb) (Fig. 4). Notably, divergent signal patterns were generated for all the aforementioned epigenetic makers between PC-genes and i-NUPGs/NUMGs (Fig. 4). Specifically, for DNA methylation, i-NUPGs/NUMGs with flanking regions were highly methylated; their signal fluctuated across the body, and flanking regions were not as remarkable as that for PC-genes (Fig. 4A). For the CG and CHG contexts, the methylation levels of i-NUMGs were comparable to those of TEs, whereas those of NUMTs, NUPTs, and i-NUPGs were slightly lower than those of TEs but substantially higher than those of PC-genes (Fig. 4A). The methylation levels of the CHH context were similar between i-NUPGs and i-NUMGs, which were lower than those of NUPTs/NUMTs and TEs (Fig. 4A). For the euchromatin markers (H3K4me3, H3K27me3, H3K36me3, and H3K9Ac), the signal intensities of PC-genes were substantially higher than those of other genomic features, especially in gene-body regions, whereas i-NUPGs/NUMGs exhibited the lowest transcriptional activation signal (Fig. 4B). For the heterochromatin makers, the signal intensities of H3K27me1 in i-NUPGs and i-NUMGs were higher than those in PC-genes and lower than those in TEs and NUPTs/NUMTs, whereas those of the i-NUPGs and i-NUMGs were lowest for the H3K9me2 marker (Fig. 4C). These observations reflect the distinct repressive epigenetic atlas of i-NUPGs/NUMGs in the nuclear genome.
![Epigenetic profiling of different genomic features. The read density [for chromatin immunoprecipitation sequencing data, measured as a counter per million reads (CPM) value] and methylation signal (for methylome data) of the body and the flanking 3-kb regions of different epigenetic categories including A) DNA methylation (including the CG, CHG, and CHH context), B) representative euchromatin markers (H3K4me3, H4K27me3, H3K36me3, and H3K9ac), and C) heterochromatin markers (H3K27me1 and H3K9me2) were investigated for protein-coding genes, TEs (Gypsy, Copia, and CACTA), NUPTs/NUMTs, and i-NUPGs/NUMGs, respectively. The regions between dashed lines indicate body region; for protein-coding genes, “start” means the start codon position, whereas “end” means the terminal codon position.](https://oup.silverchair-cdn.com/oup/backfile/Content_public/Journal/plphys/194/2/10.1093_plphys_kiad552/1/m_kiad552f4.jpeg?Expires=1750188956&Signature=S87aRN98uCf4LiwBzBkOY7ZMbjxHf0MxcRa4RCcBfakpwN~tPVOcTaGnZKyXsLmb-mqCrUPOO8kqpmQj-JnPqD0lXQD0Nqr7IUFqkoUgKjDLSfEofbfgJp58495fgVVFRg1JTZlJ8Z2sNNtC~v7KEzqxmldlj17iy6pdz6f99SFgmV~vtfCK-0MieAp8phI~S0XcRGsJdXNqnqO5jGjERk1xsovyXikCntkhdb2nS5VrxO45zmv4Hdi-6~3VxLdVcS-GO4NX3KsGfw~fZ1DG-w~fdZxFR~FiwemfeJtlay8n6au9RF32OQkOmjrTL2xQ2i4jv6zgWJ5aQHEbz9GCaQ__&Key-Pair-Id=APKAIE5G5CRDK6RD3PGA)
Epigenetic profiling of different genomic features. The read density [for chromatin immunoprecipitation sequencing data, measured as a counter per million reads (CPM) value] and methylation signal (for methylome data) of the body and the flanking 3-kb regions of different epigenetic categories including A) DNA methylation (including the CG, CHG, and CHH context), B) representative euchromatin markers (H3K4me3, H4K27me3, H3K36me3, and H3K9ac), and C) heterochromatin markers (H3K27me1 and H3K9me2) were investigated for protein-coding genes, TEs (Gypsy, Copia, and CACTA), NUPTs/NUMTs, and i-NUPGs/NUMGs, respectively. The regions between dashed lines indicate body region; for protein-coding genes, “start” means the start codon position, whereas “end” means the terminal codon position.
The gradual relaxation of epigenetic repression in NUPTs/NUMTs
Considering that most of the NUPTs/NUMTs are located in the silent chromatin region, we further investigated the tempo of establishing the current epigenetic status in the alien NUPTs/NUMTs after their insertion. Three possible scenarios were proposed, which included (i) gradual heterochromatinization, (ii) immediate heterochromatinization maintained over time, and (iii) immediate silencing followed by gradually relaxed heterochromatinization. To determine the scenario of the case, we categorized NUPTs/NUMTs into 3 classes based on their insertion time, which was estimated by their sequence similarity with respective donor segments in the plastid/mitochondrial genome: young, similarity ≥ 98%; intermedium, 90% < similarity < 98%; and old, similarity ≤ 90%. The epigenetic signal intensities (DNA methylation in the CG, CHG, and CHH context and 6 histone modifications) of those categorized NUPTs/NUMTs and their up/downstream flanking regions (±3 kb) were characterized and compared as mentioned above.
Regarding DNA methylation, we observed the following: (i) the overall hierarchical order of CG DNA methylation levels was “old ≈ young < intermedium” and “old < intermedium ≈ young” for NUPT and NUMT body regions, respectively (Fig. 5A); (ii) the overall hierarchical order of CHG DNA methylation levels was also “old < intermedium < young” for NUMT body regions but was “old < intermedium ≈ young” for NUPT body regions; (iii) the hierarchical order “old < intermedium < young” was observed for NUPT flanking regions in both CG and CHG contexts; (iv) the highest DNA methylation level was detected in flanking regions of old NUPTs/NUMTs in the CHH context. For the epigenetic histone modification, except for H3K9ac in NUMTs, the signal intensity of the 4 euchromatic markers in body regions of NUPTs and NUMTs increased with their insertion time (Fig. 5B). Contrary to the active chromatic markers, the 2 heterochromatic markers existed in the following opposite trend: the signal intensities of old NUPTs and NUMTs were the lowest in both body and flanking regions (Fig. 5C). Interestingly, compared with the young and intermedium NUPTs, the old ones were allocated away from TEs but close to PC-genes; old NUMTs were also close to PC-genes but not far away from TEs (Fig. 5D; Tukey–Kramer test after Kruskal–Wallis rank sum test, P values <2.2e−16). These results suggested that the contextual epigenetic modifications surrounding the nuclear insertion sites underpinned the repressive chromatin status of young (even intermedium) NUPTs/NUMTs, whereas such epigenetic regulation can be gradually relaxed during the course of evolution.
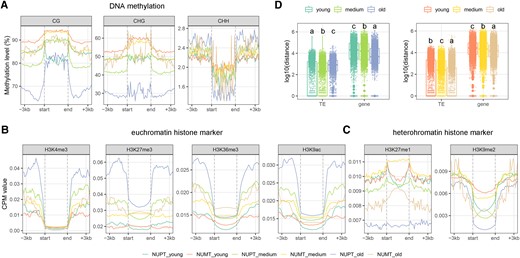
Epigenetic profiling of different types of NUPTs/NUMTs. The read density (for chromatin immunoprecipitation sequencing data and measured as a CPM value) and methylation signal (for methylome data) of the body and the flanking 3-kb regions of different epigenetic categories including A) DNA methylation (including the CG, CHG, and CHH context), B) representative euchromatin markers (H3K4me3, H4K27me3, H3K36me3, and H3K9ac), and C) heterochromatin markers (H3K27me1 and H3K9me2) were investigated for young, medium, and old NUPTs/NUMTs. The regions between dashed lines indicate body regions; for protein-coding genes, “start” means the start codon position, whereas “end” means the terminal codon position. D) Comparisons of the distance between the 3 NUPT/NUMT groups and adjacent TEs and genes. Left panel, NUPTs; right panel, NUMTs. Different letters represent different distances among the 3 NUPT/NUMT groups (Tukey–Kramer test after Kruskal–Wallis rank sum test, P < 2.2−-16). Box-plot elements are defined as center line, median; box limits, upper and lower quartiles; whiskers, 1.5× interquartile range; points, each data point.
The gradual accumulation of species-specific NUPTs/NUMTs in the Triticum/Aegilops complex species
To investigate the evolution of NUPTs/NUMTs at the phylogenic scale, we further strictly identified homologous NUPTs/NUMTs (abbreviated as homo-NUPTs/NUMTs) among the Triticum/Aegilops complex species and constructed their polymorphism matrix. For 2 arbitrary NUPTs/NUMTs derived from different genomes, they were classified into an identical homo-NUPT/NUMT group if they had similar body and flanking regions and were located in synteny genomic regions (Supplemental Figs. S8 and S9; see Materials and Methods). Then, we characterized the dynamic evolutionary history of the homo-NUPT/NUMT group. Taking the NUPT as an example, among 7 diploid Triticum/Aegilops and one outgroup species (Thinopyrum elongatum), we identified 1,066 highly confident homo-NUPT groups in which the majority of groups (77.5%) were species-specific (defined as a specific group). However, only 17.9% of groups were shared by at least 2 species (defined as a shared group) (Fig. 6, A and B). Following the parsimony criteria, we labeled the dynamic InDels of respective homo-NUPT groups in the phylogenetic speciation tree (Li et al. 2022). Our findings are as follows: (i) the relative insertion frequency of homo-NUPTs increased gradually (on each node) from the ancestral node (2.3; 7.3 MYA) to the present node (38.2; <1 MYA) for shared groups; (ii) the relative insertion frequencies in the D-lineage species (22.4–44.3) were higher than those in A- (T. urartu, 16.1) and B-lineage species (Ae. speltoides, 17.7) (Fig. 6B), which was consistent with aforementioned NUPT content in D-lineage species (Fig. 1, A and B). Notably, there were only 3 species-specific and none shared deletion of NUPTs was detected based on the current 1,066 homo-NUPT groups, which indicated gradual accumulation during the evolution of the Triticum/Aegilops complex species. Similarity analysis between NUPTs and respective original plastid sequences at each node/tip also supported the accuracy of our current phylogeny-based method (Fig. 6C). Specifically, older (younger) NUPT groups, which were shared by more (less) species, had lower (higher) sequence similarity. Additionally, the similarity of a given species-specific group was higher than that of its nearest shared group (i.e. the similarity of the Ae. tauschii-specific group was less than that of the 5-shared group).
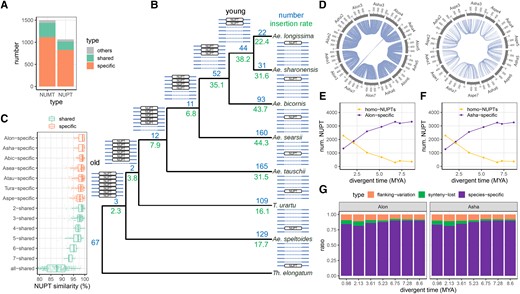
Evolution of NUPTs/NUMTs during species differentiation among diploids from the Triticum/Aegilops complex species. A) The number of different types of homo-NUPT/NUMT groups. For each homo-NUPT/NUMT group, “shared” means the homo-NUPTs/NUMTs shared by 2 or more species under each node of the phylogenetic tree (from 2 to 8 species, see B), “specific” means only one species including NUPTs/NUMTs, whereas “others” represents the remaining types. B) Phylogeny-based statistics of NUPTs. The ideograms of shared and specific homo-NUPT/NUMT groups are drawn near each node and tip, respectively. Numbers represent the number and relative insertion ratio (insertion number between 2 adjacent nodes divided by the evolution time between the corresponding 2 adjacent nodes) of NUPTs in each node/tip. C) Statistics of NUPT similarity (sequence similarity between NUPTs and corresponding DNA fragments in plastid genome sequence) for the shared and species-specific homo-NUPT/NUMT groups. Box-plot elements are defined as center line, median; box limits, upper and lower quartiles; whiskers, 1.5× interquartile range; points, each data point. D) Example circos plots of homo-NUPT pairs between Ae. sharonensis and Ae. longissima (diverged 0.98 MYA) and between Ae. sharonensis and Ae. speltoides (diverged 7.28 MYA). The numbers indicate the homo-NUPT pairs in each comparison. E and F) Change patterns of homo-NUPT pairs and species-specific NUPTs over the divergence time, with Ae. longissimaE) and Ae. sharonensisF) is considered as the base (anchor) species, respectively. For each point, the X-axis indicates the divergence time between the base species and one of the other species. G) The proportion of different types of nonhomo-NUPTs in the base (anchor) species when compared with different nonbase species. “Flanking variation” means that a given NUPT has a synteny counterpart in the nonbase species but the flanking regions are not aligned with each other (the loss of homology at the insertion site). “Synteny lost” means a given NUPT has a counterpart with flanking regions matched but lost synteny relationship. The corresponding information of NUMTs is shown in Supplemental Fig. S10. Aspe: Ae. speltoides; Tura: T. urartu; Atau: Ae. tauschii; Asea: Ae. searsii; Abic: Ae. bicornis; Asha: Ae. sharonensis; Alon: Ae. longissima.
We then performed pairwise homo-NUPT comparisons between Aegilops longissima/Ae. sharonensis (the species at the base of the phylogenetic tree) and each of the rest species. The number of homo-NUPTs decreased from 2,282 (64.2%, Ae. sharonensis vs. Ae. longissima) to 397 pairs (11.2%, Ae. sharonensis vs. Ae. speltoides) as the divergent time increased, whereas Ae. longissima-specific NUPTs increased from 25.8% to 88.8% (Fig. 6, D and E). Even though both unaligned flanking regions and nonsyntenic NUPTs also contributed to the content of nonhomo-NUPTs, their proportions were found to be only 10.1% to 18.4% among comparisons across different divergence times. Notably, the proportion of species-specific insertion increased with divergence time (from 81.6% to 89.9%), whereas the proportion of nonsyntenic NUPTs showed an opposite trend (Fig. 6G). With Ae. longissima as a comparison anchor, we observed similar results (Fig. 6, F and G). Similar to NUPTs, NUMTs exhibited species-specific characteristics, and their accumulation gradually increased during the differentiation of the Triticum/Aegilops complex diploid species (Supplemental Fig. S10).
Asymmetric ptDNA/mtDNA integration into subgenomes during the evolution of allopolyploid wheat
Contrary to the single-origin nuclear and cytoplasmic genomes in the Triticum/Aegilops complex diploid species, the uniparental inheritance of maternal organellar genome (B-genome origin) with multi-origin nuclear subgenomes in wild and domesticated allopolyploid Triticum species (B- and A-subgenomes in allotetraploid wheat and B-, A-, and D-subgenomes in allohexaploid wheat) allowed us to determine whether ptDNA/mtDNA subgenome integration was asymmetric during the evolution trajectory of allopolyploid wheat (because the real B-genome parent for allotetraploid wheat is still controversial, allotetraploidy process was not considered in our study).
We first conducted a global comparison of the difference in NUPTs/NUMTs insertion dynamics between A- and B-subgenomes (considering Triticum dicoccoides, T. durum, and T. aestivum, simultaneously). To quantify the degree of change in NUPTs/NUMTs for a given subgenome, we defined the dynamic index (DI). Specifically, based on a given subgenome-related tree topology (e.g. a 4-factors tree topology including A-subgenome of T. dicoccoides, T. durum, and T. aestivum as well as the diploid donor of A genome, T. urartu; or a 3-factors tree topology including A-subgenome of T. dicoccoides, T. durum, and T. aestivum) and a split time point (here is the domestication of allotetraploid wheat), the number of NUPTs/NUMTs shared (before the split time point, abbreviated as Nshared) and un-shared (after the split time point, abbreviated as Nun-shared) among allopolyploids are known. Therefore, DI is equal to Nun-shared/(Nshared + Nun-shared) (Fig. 7A). Then, the DI of A- and B-subgenomes can be statistically compared (i.e. χ2-test) at both 4-factors (Fig. 7B) and 3-factor (Fig. 7C) tree topology levels. Accordingly, a significantly higher DI value of a certain subgenome than that of its counterpart represented asymmetric NUPTs/NUMTs among different subgenomes. Notably, when using CS as the representative allohexaploid wheat (T. aestivum), the comparison revealed that the DI of NUPTs in the B-subgenome was significantly higher than that in the A-subgenome (0.124 vs. 0.078 at 4-factors tree topology level, P value = 4.500e−5, Fig. 7B; 0.107 vs. 0.080 at 3-factors tree topology level, P value = 1.363e−3, Fig. 7C; χ2-test). Even replacing CS with different hexaploid wheat genomes, we were still able to find the DI differences, which mostly supported foregoing subgenomic asymmetry of NUPTs/NUMTs change in the B-subgenome at both 4-factors (Fig. 7D) and 3-factors (Fig. 7E) tree topology levels. Second, we compared species-specific and homo-NUPTs/NUMTs between A and B-subgenomes in other 2 pairs of species: (i) wild and domesticated allotetraploid wheat species (T. dicoccoides vs. T. durum; the domestication process, Fig. 7F) and (ii) domesticated allotetraploid and hexaploid wheat species (T. durum vs. a series of T. aestivum accessions; the allohexaploidy process, Fig. 7G). Accordingly, as shown in Fig. 7, F and G, more species-specific NUPTs/NUMTs in B-subgenome than those in A-subgenome were observed in both paired comparisons, which implicated the asymmetric subgenomic NUPTs/NUMTs integration in both domestication and allohexaploidy process.
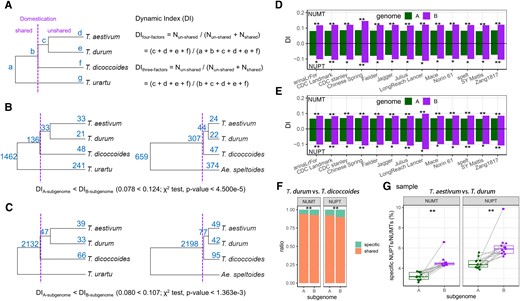
Subgenomic asymmetry of ptDNA/mtDNA integration during tetraploid domestication and allohexaploid processes. A) The schematic diagram for calculating the DI for NUPTs/NUMTs. The letters near each node/tip indicate the number of NUPTs/NUMTs in each evolution node. The dashed line indicates the split time point (here, the time of tetraploid domestication). B and C) Comparing the DI of NUPTs between A- and B-subgenomes based on B) 4-factors and C) 3-factors tree topology levels. Whether the DI in A-subgenome is significantly different from that in B-subgenome is tested using the χ2 test. In these 2 tree topology levels, IWGSC RefSeq 1.0 (CS) was used as the representative common wheat genome (T. aestivum). Comparison of the DI of NUPTs/NUMTs between A- and B-subgenomes based on D) 4-factors and E) 3-factors tree topology levels, using different resources of hexaploid wheat genomes. The significant results of the χ2 test are shown as **P < 0.01 and *0.01 < P < 0.05. F) The ratio of species-specific and homo-NUPTs/NUMTs between A- and B-subgenomes based on the pairwise comparison of T. dicoccoides (before domestication) and T. durum (after domestication) (χ2 test, P < 0.05). G) The ratio of specific NUPTs/NUMTs between A- and B-subgenomes (n = 13 for each) based on the pairwise comparison of T. durum (before hexaploidy) and different resources of T. aestivum (after hexaploidy). P values were calculated based on the pairwise Mann–Whitney U test (P < 0.01).
Finally, to characterize any subgenomic asymmetric accumulation of NUPTs/NUMTs in wheat at the hexaploidy level, we investigated and compared subgenomic polymorphisms of NUPTs/NUMTs in 13 hexaploid wheat genomes from the pan-genomic viewpoint. First, the pan-NUPTs were constructed based on homo-NUPTs for each subgenome (see Materials and Methods; Supplemental Fig. S2), which revealed their abundance as follows: D-subgenome (2,559) > B-subgenome (2,113) > A-subgenome (2,064); the abundance of core-NUPTs in the 3 subgenomes was consistently ranked as follows: D- (2,442) > A- (1,867) > B- subgenome (1,747) (Fig. 8A). We also calculated the NUPT polymorphism ratio based on the number of core- and pan-NUPTs ([Npan-NUPTs − Ncore-NUPTs]/Npan-NUPTs) and found that this ratio was highest in B-subgenome as well (Fig. 8B; χ2 test and post hoc test, P value <0.01). Furthermore, based on the sequenced genomes of wild and domesticated allotetraploid wheat (T. dicoccoides and T. durum for both A- and B-subgenomes) and 2 Ae. tauschii accessions (AL8/78 and AY61 for D-subgenome), we further estimated the gain and loss of NUPTs during the hexaploid improvement process for each subgenome (Fig. 8, C and D; Materials and Methods). As shown in Fig. 8D, we also found that both gain and loss of NUPTs preferentially occurred in B-subgenome (χ2 test and post hoc test, P value <0.01), wherein the gain of NUPTs was significantly higher than the loss of NUPTs (χ2 test, P value <0.01). We then performed a pairwise comparison among 13 hexaploid accessions to characterize the shared ratio of homo-NUPTs at subgenomic level (Fig. 8E), which revealed that the 3 subgenomes showed significantly different abundance in the shared homo-NUPTs, as follows: B-subgenome < A-subgenome < D-subgenome (Fig. 8F; Tukey–Kramer test after Kruskal–Wallis rank sum test, P value <0.01). Similar to the results of NUMTs (Supplemental Fig. S11), all these results suggested the subgenomic asymmetry of NUPT/NUMT polymorphism during allohexaploidy and the improvement process of wheat.
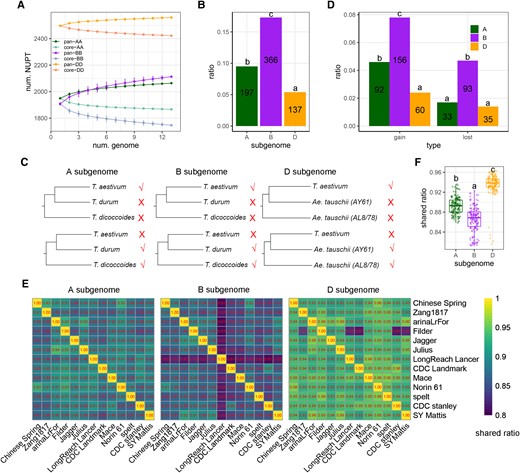
Subgenomic asymmetry of NUPT polymorphism among bread wheat accessions. A) The profiling of pan-NUPTs and core-NUPTs among 13 hexaploid wheat genomes using pan-genome-based analysis according to 2,064 (A-subgenome), 2,113 (B-subgenome), and 2,559 (D-subgenome) homo-NUPT groups. The error bars indicate the Sd among different combinations. B) Comparisons of the NUPT polymorphism ratio among A-, B-, and D-subgenomes. Letters indicate the results of multiple comparisons based on the χ2 and post hoc tests (P < 0.05). The numbers indicate the difference between the numbers of pan-NUPTs and core-NUPTs of each subgenome. C) Ideogram of gain and loss patterns of NUPTs among hexaploid genomes based on 2 outgroup genomes for each of the 3 subgenomes. Taking A-subgenome as an example: the outgroup genomes are A-subgenomes of T. dicoccoides and T. durum. For each homo-NUPT group, if NUPTs did not occur in both outgroup genomes but existed in at least one hexaploidy genome, it is classified as a gain group; if NUPTs occurred in both outgroup genomes but did not appear in at least one hexaploidy genome, it is classified as a lost group. D) The proportion of gain and loss homo-NUPT groups among the 3 subgenomes in hexaploid wheat accessions. Letters indicate the results of multiple comparisons based on the χ2 and post hoc tests (P < 0.05). The number of gain and loss groups is also shown. E) Pairwise comparisons of homo-NUPT pairs among 13 genomes of the 3 subgenomes. The number in each cell represents the proportion of homo-NUPTs to the total number of NUPTs for each comparison. F) Summary of homo-NUPT ratios among the 3 subgenomes based on 13 hexaploid genome datasets. A total of 156 pairwise comparisons were displayed for each subgenome. Letters indicate the results of multiple comparisons based on the Kruskal–Wallis rank sum test and Tukey–Kramer test (P < 2.2e−16). Box-plot elements are defined as center line, median; box limits, upper and lower quartiles; whiskers, 1.5× interquartile range; points, each data point. The corresponding information on NUMTs is shown in Supplemental Fig. S11.
Discussion
Integration of organellar DNA (both mitochondrial and/or ptDNA) into the nuclear genome has been identified in many eukaryotes from fungi and plants to mammals, which affects the genome structure and genetic diversity and further promotes evolution (Leister 2005; Kleine et al. 2009; Sloan et al. 2018). Nevertheless, the transcriptional expression and epigenetic state of organelle genes inside NUPTs/NUMTs and the evolutionary dynamics of NUPTs/NUMTs at the phylogenic scale are poorly explored. Accordingly, in the Triticum/Aegilops complex species with abundant NUPTs/NUMTs and distinct evolutionary trajectories (Marcussen et al. 2014; Glémin et al. 2019; Zhang et al. 2020), we determined the genetic mutation, transcriptional expression, and epigenetic status of NUPTs/NUMTs and their phylogenomic and pan-genomic insertion characteristics during diploid speciation, polyploidization, and domestication.
Transcriptional silencing and epigenetic characteristics of NUPGs/NUMGs
Previous studies showed that organelle-derived nuclear genes are always inactivated, lose their original function, and are pseudogenized (Kleine et al. 2009). Consistently, we found (i) most NUPGs/NUMGs identified in the Triticum/Aegilops complex species were pseudogenized after the accumulation of genetic mutations that cause ORF interruption and (ii) almost all i-NUPGs/NUMGs are transcriptionally silent compared with their counterparts in the organelles. Accordingly, our methylome and ChIP-seq analyses showed that i-NUPGs/NUMGs were substantially distinct from endogenous nuclear genes but similar to TEs in terms of their epigenetic modifications (Fig. 4). Consistent with previous findings that showed that NUPTs/NUMTs and TEs might share a similar homology-dependent DNA methylation mechanism to maintain nuclear genome stability (Maumus and Quesneville 2014; Yoshida et al. 2019), we confirmed that NUPGs/NUMGs did not possess the epigenetic properties of actively transcribed genes. We therefore speculated that, in addition to acquiring regulatory elements and sequence coding signal peptides for transcription and protein localization, NUPGs/NUMGs also need to overcome the restriction of inhibitory epigenetic modification to be re-activated.
On the other hand, the fate of some ancient NUPGs/NUMGs is functional maintenance in encoding proteins targeting back to the original endosymbionts, such as proteobacteria-like and cyanobacteria-like prokaryotes, which involves exemplary rbcS encoding subunits of the plastid RuBisco complex and cytochrome c encoding subunits of the mitochondrial enzyme complex of oxidative phosphorylation (Blier et al. 2001; Rand et al. 2004; Andersson and Backlund 2008). How those ancient NUPGs/NUMGs acquired signal peptide and regulation elements and escaped from foregoing epigenetic control are intriguing questions. Given that certain NUPGs/NUMGs identified in rice species were integrated into euchromatic regions (Wang and Timmis 2013), the NUPGs/NUMGs generating functional genes possibly integrated into the euchromatic regions with a low load of epigenetic silencing within their eukaryotic ancestors and subsequently acquired cis elements that have enabled their expression. More epigenetic and evolutionary data with the common ancestor species are required to test this hypothesis.
Dynamic insertions of NUPTs/NUMTs in Triticum/Aegilops complex species
Previous studies have compared the genomic composition and characteristics of NUPTs/NUMTs within various species (Michalovová et al. 2013; Zhao et al. 2019). However, as they rarely distinguish shared- and species-specific NUPTs/NUMTs, making characterization of the dynamics of NUPTs/NUMTs in the evolution of closely related species is difficult (Liang et al. 2018). In the present study, we used a phylogenomic-based method to identify homo- and species-specific NUPT/NUMT groups among diploid Triticum/Aegilops complex species for the robust investigation of NUPTs/NUMTs at the evolutionary scale. The results suggested that the species-specific insertion of NUPTs/NUMTs, having a substantially higher abundance than homo-NUPTs/NUMTs, mainly contributed to NUPT/NUMT polymorphism within the last ∼7 million years. Moreover, by using the phylogenomic method, we also estimated and compared the relative insertion rates of those homo-and species-specific NUPTs/NUMTs (Richly and Leister 2004; Leister 2005). Interestingly, we observed a gradual increase in the relative insertion frequency of homo-NUPTs from the ancestral node to the present node (Fig. 6B; Supplemental Fig. S10B), indicating that the insertions of NUPTs/NUMTs occurred at different rates throughout the speciation of Triticum/Aegilops complex; additionally, the insertion rate of species-specific NUPTs/NUMTs varied across respective species as well (Fig. 6B). Dynamic insertions of foregoing homo- and species-specific NUPTs/NUMTs could collaboratively result in the compositional variation of NUPTs/NUMTs in different lineages of Triticum/Aegilops complex (Fig. 1B). Notably, since our current adopted Blastn homology search strategy is not sensitive to those old NUPT/NUMT insertions, the undetectable ancient NUPT/NUMT insertions followed by subsequent gradual loss in Triticum/Aegilops evolution could make few contributions to current observed NUPT/NUMT composition.
Integration asymmetry of ptDNA/mtDNA among subgenomes during the evolution trajectory of allopolyploid wheat
Besides empirical evidence for subgenomic dominance (bias in gene retention, gene diversity, TE dynamics, and epigenetic modifications) in allopolyploids (Pont and Salse 2017; Li et al. 2021; Levy and Feldman 2022), we observed and defined the recently discovered subgenomic dominance regarding the asymmetric integration of ptDNA/mtDNA into different subgenomes (majorly biased integration into the B-subgenome). As both A- and D-subgenomes were less fractionated and B-subgenome was more fractionated during allopolyploid wheat evolution (Pont et al. 2013; El Baidouri et al. 2017; Pont and Salse 2017), the more plastic subgenome increased NUPT/NUMT polymorphism. We assume that a subgenome with more TE dynamics may generate more TE-related DSBs, especially during meiosis, which eventually enhances the dynamics of NUPTs/NUMTs. This assumption is based on the following lines of evidence: (i) the molecular basis for the integration of ptDNA/mtDNA necessitates nuclear DSBs (Hazkani-Covo et al. 2010), (ii) TE transportation generally produces DSBs (Gorbunova and Levy 1999; Gasior et al. 2006; Hedges and Deininger 2007), and (iii) ptDNA/mtDNA mainly inserted in TE-enriched intergenic regions in the present case, although they could enrich in gene regulation regions where DSBs occurred frequently. Moreover, B-subgenome, which is the largest subgenome and contains more abundant TEs in the wheat genome (International Wheat Genome Sequencing Consortium et al. 2018), can carry a stronger genetic load, including ptDNA/mtDNA insertions. Notably, a comprehensive introgression into the B-subgenome of allopolyploid wheat (Walkowiak et al. 2020; Zhou et al. 2020; Wang et al. 2022) may also be a potential contributor to enhance the genomic diversity and further NUPT/NUMT polymorphism. On the other hand, given that the ancient B genome is the source of the common wheat organelle genome (Fu 2021), it remains possible that the native maternal nuclear B-subgenome might have distinct inherent associations with its corresponding organelle genome, indicative of a process akin to cytoplasmic-nuclear coevolution (Gong et al. 2014; Sloan et al. 2018). Verification of foregoing possible scenario still needs further exploration across various allopolyploid species. Accordingly, extensive investigations are required to elucidate how subgenome plasticity and maternal effects contribute to the observed skewed distribution of NUPTs/NUMTs among distinct subgenomes.
Taken together, the present systematic analyses of the whole-genome atlas of NUPTs/NUMTs in the Triticum/Aegilops complex species reveal their repressed epigenetic status, species-specificity, gradual accumulation, and asymmetric subgenome integration in allopolyploid species. The study provides insights into the evolution of nuclear organellar DNAs in plants.
Materials and methods
Sequence resources of nuclear, plastid, and mitochondria genomes
All genome sequence resources of nuclear, plastid, and mitochondria were obtained from previous publications and/or NCBI website (https://www.ncbi.nlm.nih.gov/). Nuclear genome sequences included tall wheatgrass (Th. elongatum), red wild einkorn wheat (T. urartu) (Ling et al. 2018), 5 Tausch's goatgrass (Ae. tauschii) accessions (AL8/78, AY17, AY61, T093, and XJ02) (Luo et al. 2017; Zhou et al. 2021), 5 Sitopsis section (genus Aegilops) species (Ae. speltoides, Aegilops searsii, Ae. bicornis, Ae. sharonensis and Ae. longissima) (Li et al. 2022), wild emmer wheat (T. dicoccoides) (Avni et al. 2017), durum wheat (T. durum) (Maccaferri et al. 2019), common wheat (T. aestivum) of semiwild Zang1817 (Guo et al. 2020) and extra 12 accessions (CS, ArinaLrFor, Jagger, Julius, LongReach Lancer, CDC Landmark, Mace, Norin61, Spelta, CDC Stanley, SY Mattis, and Filder) (International Wheat Genome Sequencing Consortium et al. 2018; Walkowiak et al. 2020). Plastid genome sequences were obtained from NCBI website, including Th. elongatum (NC_043841), T. urartu (MG958555), Ae. tauschii (MG958544), Ae. speltoides (MG958553), Ae. searsii (NC_024815), Ae. bicornis (NC_024831), Ae. sharonensis (NC_024815), Ae. longissima (MG958549), T. dicoccoides (MG958552), T. durum (MG958545) and T. aestivum (MG958554). Mitochondria genome sequence of T. aestivum (NC_036024) was also obtained from NCBI. For polyploid nuclear genomes, they were split onto different subgenome sequences to separate database files for further identification of NUPTs/NUMTs.
Identification and validation of NUPTs/NUMTs
BLAST-based method was used to identify NUPTs/NUMTs. For NUPTs, all query plastid sequences were aligned to corresponding or related (for example, for identification of NUPTs in T. aestivum A-subgenome, the plastid genome of T. urartu was treated as query sequence) genomes/subgenomes using Blastn. While for NUMTs, the mitochondria genome of T. aestivum was aligned to each genomes/subgenomes using Blastn. The parameters of Blastn were set as “-evalue 1e-5 -dust no -penalty -2 -word_size 9.” To obtain high confident NUPTs/NUMTs, the raw NUPT/NUMT hits were further filtered based on the following criteria: (i) the length of NUPT/NUMT hit is larger than 100 bp; (ii) contig (genomic region between Ns) whose total NUPT/NUMT hits length larger than 90% coverage was removed for NUPT/NUMT identification; (iii) The 50 bp flanking regions of NUPT/NUMT hit does not overlap with gap (namely N bases); (iv) NUPT hit which showed higher similarity to mitochondria or NUMT hit which showed higher similarity to plastid were removed; (v) adjacent NUPT/NUMT hits whose distance <1 kb were merged into one NUPT/NUMT. The annotation of the genomic regions for NUPTs/NUMTs was performed using ChIPseeker (Yu et al. 2015).
For each genome/subgenome assembly, we downloaded their original Illumina WGS data and aligned them to our identified NUPT/NUMTs with 1 kb flanking regions using Minimap2 (Li 2018). NUPTs/NUMTs with both junctions supported by either (i) junction-spanning reads or (ii) junction-spanning pairs were defined as “recalled NUPTs/NUMTs” (Supplemental Fig. S12 and Table S1). Custom Python scripts were used to identify recalled NUPTs/NUMTs and calculate recalled ratios.
Identification of intragenomic duplication NUPTs/NUMTs
The intragenomic duplication of NUPTs/NUMTs after their insertion in nuclear genome were identified based on previous methods with modification (Liang et al. 2018): (i) all vs. all Blastn of NUPTs/NUMTs in each genome/subgenome was performed for checking candidate NUPT/NUMT pairs; (ii) for each duplicated NUPT/NUMT pair, the 5′ and 3′ flanking regions of 500 bp length were extracted for further pairwise alignment using Blastn. The candidate NUPT/NUMT pair was retained if both of the flanking regions were well aligned; (iii) MCscanX (Wang et al. 2012a, b) were performed to classify maintained candidate NUPT/NUMT pairs to duplication categories (duplicate_gene_classifier -m 4 -n 4), including dispersed, tandem, proximal and segmental duplication NUPTs/NUMTs.
Detection of homo-NUPTs/NUMTs groups among genomes/subgenomes
Twenty-four thousand two hundred and thirty-nine conserved genomic regions (CGRs) among 8 diploid genomes (including 7 Triticum/Aegilops species and Th. elongatum) were constructed based on our previous pipeline (Li et al. 2022). In brief: first, the genic and flanking 20 kb regions of all diploid genomes were aligned to the B-subgenome sequence of IWGSC RefSeq 1.0 (backbone sequence) using the nucmer module of MUMmer v3.9 (Kurtz et al. 2004) with the parameters –mum -c 90 -l 40. Second, the best one-to-one query-reference alignments for each diploid genome were obtained based on delta-filter and show-coords module. Then, Bedtools intersect module was used to identify original CGRs among all species based on the alignment regions on the backbone sequence. Finally, the original CGRs from the backbone genome were re-aligned to each diploid genome sequence for the detection of final CGRs through minimap2 (v2.17) (Li 2018). The CGR markers showed good collinearity patterns among diploid species (Supplemental Fig. S8). According to the above 24,239 CGR markers, we also constructed 22,763, 23,287, and 22,531 CGR markers for A-, B- and D-subgenomes of 12 T. aestivum genomes, respectively. The CGR marker showed remarkable syntenic relationships among different genomes and therefore provided robust anchors for further homo-NUPTs/NUMTs detection. The CGR markers were ranked in each genome/subgenome.
The method for detection of homo-NUPTs/NUMTs between a given pair of genome/subgenomes was mimic to intragenomic duplication NUPTs/NUMTs. A pair of NUPTs/NUMTs from 2 different genomes/subgenomes were defined as homo-NUPT/NUMT if: (i) their NUPT/NUMT bodies were well aligned; (ii) their NUPT/NUMT flanking regions (500 bp) were well aligned; (iii) they were located in synteny regions, i.e. the rank difference between the NUPT/NUMT-nearest CGR markers was <20. Except for homo-NUPTs/NUMTs, the remaining NUPTs/NUMTs in each genome/subgenome were defined as genome/subgenome-specific NUPTs/NUMTs. For a given genome/subgenome-specific NUPT/NUMT, if its flanking regions have a syntenic locus in the other genome/subgenome, we defined such locus as NUPT/NUPT-related homologous locus (NHL). The homo-NUPT/NUMT pairs and NUPT/NUMT-NHL pairs were used for further identification of homo-NUPT/NUMT groups.
For the 8 diploid genomes, we performed all possible pairwise comparisons and obtained 28 combinations of homo-NUPT/NUMT pairs and NUPT/NUMT-NHL pairs. We used the Python model networkx to concatenate all related homo-NUPT/NUMT pairs and NUPT/NUMT-NHL pairs and generate candidate homo-NUPT/NUMT groups among 8 species. If a given homo-NUPT/NUMT group satisfied (i) including exactly 8 members, with each species providing one member and (ii) possessing only 2 types of members namely NUPT/NUMT and NHL, it will be maintained as a diploid-level homo-NUPT/NUMT group for further analysis. For 12 hexaploid wheat genomes, we performed same analysis to obtain A-, B-, and D-subgenome-level homo-NUPT/NUMT groups (also defined as A-, B- and D-subgenome pan-NUPTs/NUMTs), respectively. The ideogram of the pipeline on identification of homo-NUPT/NUMT groups is shown in Supplemental Fig. S9.
Variant calling for NUPTs/NUMTs and ORFs checking for organelle-derived genes
For each genome/subgenome, NUPTs/NUMTs were first aligned to corresponding organelle genome sequences and generated related Bam files using Minimap2. Second, SAMtools mpileup module (https://www.samtool.org) was performed to produce the pileup files which include the base information for each nucleotide site of organelle genome sequences. Custom Python scripts were used to parse the pileup file and obtain the variant information (including SNPs and InDels) and insertion times (depth) for each non-overlapping 1 kb nucleotide region. Variant information of all genomes/subgenomes were combined to construct a binaty (0/1) matrix, where “1” indicated the presence of a given variant, and “0” indicated its absence. The R package ape (Paradis et al. 2004) was used to generate phylogenetic trees based on the binary matrix with the following steps: first, nj function was used to make a Neighbor-Joining (NJ) tree. Second, root function was employed to designate Th. elongatum as the root of the tree. Then, the chronos function was used to produce an ultrametric tree. Finally, the tree topology was visualized with plot.phylo function.
For NUPTs/NUMTs which covered the complete gene body regions of genes in organelle genome sequences, we aligned them to corresponding coding sequences of organelle genes by MAFFT (https://mafft.cbrc.jp/alignment/software/). Custom Python script was used to search variant sites (including SNPs and InDels) that occurred in CDS regions which disrupted the ORFs of organelle genes. Six possible destinies of organelle-derived genes might happen: (i) identical to original organelle gene (same); (ii) SNP/InDel introduced variations that cause amino acid changes, but ORF region maintained and have >50% sequence similarity to the source gene (normal); (iii) SNP/InDel introduced variations that cause amino acid changes, but ORF region maintained and have <50% sequence similarity to the source gene (new); (iv) SNP/InDel-induced premature; (v) SNP/InDel-induced loss of initial and stop codons (fragment) and (vi) frame shift (the sequence length of alignment region is not multiple of 3). The first 2 types maintained the intact ORF of source organelle genes were defined as NUPT/NUMT-related genes (NUPGs/NUMGs), whereas the last 3 types with disrupted ORF were defined as d-NUPGs/NUMGs.
RNA-seq data analysis
Considering the powerful potency for the identification of full-length RNA transcripts, the PacBio SMRT RNA-seq data were used to determine whether an expressed gene is derived from plastid/mitochondria or nuclei. Previous published full-length transcript datasets of hexaploidy wheat (Dong et al. 2015; Wei et al. 2019; Athiyannan et al. 2022), which were assembled based on long sequencing reads from PacBio SMRT platform, were download from the NCBI SRA and GEO database (including ERR6022024, ERR6022025, ERR6022026, ERR6022027, ERR6022028, ERR6022029, SRR3018829 and GSE118474).
Illumina short-read RNA-seq data from different tissues of T. aestivum were also downloaded from NCBI SRA database (including ERR1598028, ERR1598029, ERR1598030, ERR1598031, ERR1598032 and ERR1598033). After removing low-quality reads by Trimmomatic (Bolger et al. 2014), the clean RNA-seq data were aligned to organelle genomes (MG958554 for plastid and NC_036024 for mitochondria) of hexaploid wheat using STAR (v2.5.4) (Dobin et al. 2013) with the parameter –outFilterMismatchNoverLmax 0.3 to cover more organelle-gene-related sequencing reads. Reference-guided transcripts de novo assembly were performed using Trinity (v2.6.6) (Cabau et al. 2017) by default parameters.
The Iso-seq-based and Illumina RNA-seq-based transcript datasets were aligned to the reference genome and transcriptome of both nuclear (IWGSC reference genome V1.0) and organelle (MG958554 for plastid and NC_036024 for mitochondria) of hexaploid wheat using Minimap2 (Li 2018). If the editing distance (based on the number of SNPs and InDels) of a given transcript to the NUPG/NUMG is less than that to the organelle gene, such transcript is inferred as NUPG/NUMG -derived, otherwise it is inferred as plastid/mitochondria-derived transcript/isoform.
Methylome and ChIP-seq data analysis
The hexaploid wheat methylome data (SRR6792673, SRR6792681, SRR6792684, SRR6792687, SRR6792688 and SRR6792689) and ChIP-seq data including H3K4me3 (ERR4649763), H3K27me3 (SRR10300747), H3K9ac (SRR6350667), H3K36me3 (SRR6350670), H3K27me1 (ERR4649762), H3K9me2 (ERR4649764) were download from NCBI SRA database (International Wheat Genome Sequencing Consortium et al. 2018; Tock et al. 2021). A combined reference genome data was constructed by merging IWGSC RefSeq 1.0, plastid (MG958554), and mitochondria (NC_036024) genome sequences for further short reads alignment.
For methylome data analysis, after filtering out adaptors and low-quality data by Trimmomatic (Bolger et al. 2014), the bisulfite-treated short reads were first aligned to the combined reference genome using bismark (Krueger and Andrews 2011) with default parameters. Second, bismark_methylation_extractor and bismark2bedGraph modules were performed to generate bedGraph files for CG, CHG, and CHH genomic context. Then, bedGraph files were converted to bigWig files using bedGraphToBigWig script (https://www.encodeproject.org/software/bedgraphtobigwig/). Finally, deepTools (Ramírez et al. 2014) computeMatrix module was used to calculate the methylation level of different genomic features (including genes, TEs, NUPTs/NUMTs, and NUPGs/NUMGs) and flanking regions (3,000 bp) in CG, CHG, and CHH genomic context.
For ChIP-seq data analysis, after filtering out adaptors and low-quality data by Trimmomatic, all short-reads datasets were first aligned to the combined reference genome using Bowtie2 (Langmead and Salzberg 2012) with default parameters. Second, the aligned reads that satisfied (i) proper pair (ii) MAPQ large than 2 and (iii) <6 mismatches were maintained. The filtered Bam files were converted to bigwig file using deepTools bamCoverage module. Finally, deepTools computeMatrix module was used to calculate the read density of different genomic features (including genes, TEs and NUPTs/NUMTs and NUPGs/NUMGs), and flanking regions (3,000 bp).
Statistical analyses
All statistical analyses in this article were performed using R version 4.0.3. Bootstrap hypothesis tests were conducted to perform the enrichment analysis of NUPTs/NUMTs across various genomic regions. Tukey–Kramer test and Kruskal–Wallis rank sum test were employed to compare (i) the physical distance differences to genes/TEs among old, intermediate, and young NUPTs/NUMTs and (ii) homo-NUPT/NUMT ratios among the 3 subgenomes in hexaploid wheat accessions. Pairwise Mann–Whitney U test was employed to compare the difference in the ratio of specific NUPTs/NUMTs between A- and B-subgenomes during the hexaploid process. χ2 test was performed to compare the difference of (i) DI value between A- and B-subgenomes in different common wheat accessions, (ii) species-specific NUPTs/NUMTs between A- and B-subgenomes in both T. dicoccoides and T. durum, (iii) NUPT/NUMT polymorphism ratio and the proportion of gain and loss homo-NUPT groups among the 3 subgenomes in hexaploid wheat accessions. The significant threshold of all statistical tests is set to 0.05.
Accession numbers
Sequence data from this article can be found in the NCBI/CNGB data libraries under accession numbers specified in Supplemental Table S4.
Acknowledgments
We express our gratitude to the anonymous reviewers for their valuable comments and insightful suggestions, which greatly contributed to enhancing the quality of the manuscript.
Author contributions
Z.B.Z., T.Y.W., B.L., and L.G. designed the research. Z.B.Z., T.Y.W., B.L., and L.G. performed the research. B.W. and Y.Q.M. collected and preprocessed all sequencing data, Z.B.Z., J.Z., J.Z.L., J.Y., N.L., and T.Y.W. analyzed data. Z.B.Z., H.Y.W., B.L., and L.G. wrote the manuscript.
Supplemental data
The following materials are available in the online version of this article.
Supplemental Figure S1. Genomic landscape of NUMTs in Triticum/Aegilops complex species.
Supplemental Figure S2. Number of NUPTs and NUMTs among 3 subgenomes in 13 hexaploid wheat accessions.
Supplemental Figure S3. Size distribution of NUPTs among Triticum/Aegilops complex species.
Supplemental Figure S4. Size distribution of NUMTs among Triticum/Aegilops complex species.
Supplemental Figure S5. Enrichment/depletion analysis of NUPTs and NUMTs in different nuclear genome regions based on bootstrap hypothesis test.
Supplemental Figure S6. Characteristics of genetic variations in NUMTs compared with mitochondria genome.
Supplemental Figure S7. The genetic fate of genes inside NUMTs.
Supplemental Figure S8. Dot plots of CGRs among 7 diploid species in the Triticum/Aegilops complex.
Supplemental Figure S9. Flow chart for the identification of homo-NUPT/NUMT groups.
Supplemental Figure S10. Evolution of NUMTs during species differentiation among diploids from Triticum/Aegilops complex species.
Supplemental Figure S11. Subgenomic asymmetry of NUMTs polymorphism among bread wheat accessions.
Supplemental Figure S12. Diagram illustrating the validation of NUPT/NUMT insertion junctions based on Illumina WGS data.
Supplemental Table S1. The recalling ratio of NUPTs/NUMTs is based on WGS data analysis.
Supplemental Table S2. Detection of NUPT/NUMT-derived or organelle-derived transcripts based on Iso-seq data.
Supplemental Table S3. Detection of NUPT/NUMT-derived or organelle-derived transcripts based on Illumination RNA-seq data.
Supplemental Table S4. Accession numbers of sequence data are used in this article.
Funding
This work was supported by the National Natural Science Foundation of China (NSFC)-Israel Science Foundation (ISF) Joint Scientific Research Program (NSFC-ISF, 32061143001 to B.L.), the China Postdoctoral Science Foundation (2023T160095 and 2021M700749 to Z.B.Z.), the Jilin Province Young Science and Technology Talent Support Project (QT202119 to Z.B.Z.), the Fundamental Research Fund for the Central Universities (2412023YQ005 to L.G.), Chinese Academy of Sciences (CAS) Youth Interdisciplinary Team (JCTD-2022-06 to L.G.) and National Natural Science Foundation of China (NSFC #32001457 to T.W.).
Data availability
The data underlying this article are available in the article and in its online supplementary material.
Dive Curated Terms
The following phenotypic, genotypic, and functional terms are of significance to the work described in this paper:
References
Author notes
Zhibin Zhang, Jing Zhao and Juzuo Li contributed equally to this work.
The author responsible for distribution of materials integral to the findings presented in this article in accordance with the policy described in the Instructions for Authors (https://dbpia.nl.go.kr/plphys/pages/General-Instructions) is Lei Gong.
Conflict of interest statement. The authors declare no competing interests.
