


Abstract
High-affinity potassium (K+) transporter (HAK)/K+ uptake permease (KUP)/K+ transporter (KT) have been identified in all genome-sequenced terrestrial plants. They play an important role in K+ acquisition and translocation and in enhancing salt tolerance. Here, we report that plasma membrane–located OsHAK18 functions in K+ and sodium (Na+) circulation and sugar translocation in rice (Oryza sativa). OsHAK18 was expressed mainly, though not exclusively, in vascular tissues and particularly in the phloem. Knockout (KO) of OsHAK18 reduced K+ concentration in phloem sap and roots but increased K+ accumulation in the shoot of both ‘Nipponbare’ and ‘Zhonghua11’ cultivars, while overexpression (OX) of OsHAK18 driven by its endogenous promoter increased K+ concentration in phloem sap and roots and promoted Na+ retrieval from the shoot to the root under salt stress. Split-root experimental analysis of rubidium (Rb+) uptake and circulation indicated that OsHAK18-OX promoted Rb+ translocation from the shoot to the root. In addition, OsHAK18-KO increased while OsHAK18-OX reduced soluble sugar content in the shoot and oppositely affected the sugar concentration in the phloem and its content in the root. Moreover, OsHAK18-OX dramatically increased grain yield and physiological K+ utilization efficiency. Our results suggest that—unlike other OsHAKs analyzed heretofore—OsHAK18 is critical for K+ and Na+ recirculation from the shoot to the root and enhances the source-to-sink translocation of photo-assimilates.
Introduction
The vascular system of tracheophytes connects all organs and carries out long-distance delivery of materials via 2 parallel structures, the xylem and phloem. The xylem conducts water and solutes from root to shoot, while the phloem transports mainly photo-assimilates and amino nitrogen (N) compounds in addition to water and minerals from the source to the sink (White and Ding 2022). Potassium (K+) is the most abundant cation in the sap of the xylem or phloem.
K+ is the most abundant cation in plants in general and is critical in maintaining ion charge balance, regulating turgor pressure and enzyme activity, as well as in promoting the mobilization of other nutrients and sugar (Anschtz et al. 2014; Li et al. 2018). K+ is a highly mobile cation; it circulates in plants, regulating photosynthetic carbon translocation from the source to the sink. About 40% to 90% of K+ transported from the root via the xylem to aerial parts is circulated from the shoot to the roots along with photosynthates, sugars, and other nutrients (Peuke and Rennenberg 2011; Lu et al. 2015). Such circulation may be an important feedback signal regulating root K+ uptake and smoothing out the fluctuations of external K+ supply (Marschner et al. 1996). K+ gradients serve as a mobile energy source in plant vascular tissues, and K+ circulating in the phloem transports energy stored in the K+ gradient between phloem cytosol and the apoplast (Gajdanowicz et al. 2011; Dreyer et al. 2017). K+ and sodium (Na+) ions share great similarity in physical and chemical characteristics; thus, enhancing K+ absorption can impair Na+ accumulation, which is one of the key strategies for salt stress tolerance in glycophytes (Maathuis and Amtmann 1999; Munns and Tester 2008; Shabala and Cuin 2008).
K+ is absorbed by roots from the soil and circulated within the plant by multiple families of K+ channels and transporters. The Shaker family of voltage-gated K+ channels and high-affinity K+ transporter (HAK)/K+ uptake permease (KUP)/K+ transporter (KT) family are major proteins underlying intercellular K+ transport. K+ entry into roots when the external K+ concentration at the root surface is high and occurs via the K+ channel AKT1 down the K+ electrochemical potential, while at a low external K+ concentration, a high-affinity K+ uptake occurs via HAK/KUP/KT family members such as via AtHAK5 in Arabidopsis thaliana (Rubio et al. 2010) and OsHAK1 and OsHAK5 in rice (Oryza sativa; Yang et al. 2014; Chen et al. 2015). At the root endoderm, the hydrophobic Casparian strip prevents apoplastic movement of K+ into the xylem sap; therefore, K+ must enter the symplast of the endodermis and then be released into the xylem sap. Protoplasts of stellar cells (the root xylem–enwrapping parenchyma cells) possess voltage-gated Shaker-like K+ outwardly rectifying (SKOR) channels (Wegner and Raschke 1994; Roberts and Tester 1995). These SKOR channels subserve K+ release into the xylem sap toward the shoots (Gaymard et al. 1998). Moreover, high-affinity K+ transporters like AtKUP7 and OsHAK5, which are also expressed in stellar cells, contribute substantially to the root-to-shoot K+ translocation via the xylem, particularly when K+ supply is low (Yang et al. 2014; Han et al. 2016).
The phloem is comprised of longitudinally aligned sieve elements (SEs) and adjoining companion cells (CCs). It is divided into 3 functional domains, collection phloem, transport phloem, and unloading phloem (De Schepper et al. 2013). Loading photo-assimilates and inorganic ions, mainly sucrose, into SE/CC complexes of the collection phloem at source leaves and releasing them from the unloading phloem in sink organs generate an osmotically derived hydrostatic pressure gradient (Turgeon 2010). This hydrostatic pressure gradient is considered to be the major driving force for the phloem bulk flow in herbaceous plants (Crafts and Crisp 1972; Knoblauch and Peters 2016). High K+ concentration in sieve tubes of phloem and a steep transmembrane pH gradient are required for sucrose transporter (SUT1) to load apoplastic sucrose into the sieve tubes at source leaves (Ayre 2011; Julius et al. 2017). However, even with impaired SUT1, the bulk flow in the phloem was preserved due to the elevation of K+ concentration at the source, which served as the main osmoticum compensating for decreased loading of sucrose (Babst et al. 2022).
The transport phloem connecting the collection phloem and the unloading phloem allows a “leak out” of solutes which partially nourish the tissues in the plant axis (van Bel 2003) or are reloaded back into the tube (Pate and Dieter Jeschke 1995; Marschner et al. 1996). The leakage of K+ from the CCs of the transport phloem is conducted by the AKT2 channel of the Shaker family (Deeken et al. 2002) shown, by genetic manipulation and computational modeling, to function here as a K+ release channel (Gajdanowicz et al. 2011). The switch of the AKT2 gating from voltage-rectifying to nonrectifying, which allows K+ release, occurs by channel phosphorylation (Michard et al. 2005).
Solutes, including K+, are loaded into the collecting phloem via both symplastic and apoplastic routes. In the symplastic route, plasmodesmata from mesophyll cells (MCs) allow the passage of solutes directly into the CCs, while transporters are required in the apoplastic route. Whether K+ loading into the collecting phloem involves a K+ channel is uncertain, though a phloem-expressed K+ channel in maize (Zea mays), KZM1, can mediate K+ influx current in Xenopus oocytes (Philippar et al. 2003). Computational modeling demonstrated that energy-dependent K+ transport is required for K+ loading into phloem in source leaves (Turgeon and Ayre 2005). However, the identity of K+ transporter(s) involved in phloem K+ recirculation in plants is unknown.
In this study, we provide molecular, physiological, and genetic evidence that OsHAK18 (accession no. AK065464), a member of cluster III of HAK/KUP/KT family (Supplemental Fig. S1), plays a major role in the recycling of K+ and Na+ from the shoot to the root in rice. OsHAK18 is expressed abundantly in rice MCs and vascular tissues, functions in efficient utilization of K+ and limiting Na+ accumulation in the shoot, and contributes to source-to-sink translocation of K+-accompanied soluble sugar used in the production of grains.
Results
Tissue and cellular localization of OsHAK18 expression in rice
Plant HAK transporters have been shown to contribute to root K+ uptake and translocation of K+ from root to shoot under a varied supply of [K+]. By checking the expression pattern of rice HAK transporter genes via publicly released microarray data (RiceXPro, http://ricexpro.dna.affrc.go.jp/), we found that OsHAK18, unlike other HAK family members, is minimally transcribed in the root, suggesting that its function may divert from what is currently known about this family. Before exploring the physiological function of this gene, we first examined the organ-specific expression pattern of this gene by RT-qPCR in 3-wk-old seedlings. Indeed, the transcript level is low in the root and leaf sheath (L.S.) but high in the L.B. (Supplemental Fig. S2, A to C).
To examine further the tissue and cellular localization of this gene in rice, the GUS (β-glucuronidase) reporter gene was fused to the putative promoter of OsHAK18 (2,000 bp upstream of the translational start codon), and then, transgenic rice plants harboring the ProOsHAK18:GUS construct were generated. Histochemical analysis of these transgenic rice plants showed that OsHAK18 is expressed in the vascular cylinder of roots, basal nodes, and leaves, as well as in MCs (Fig. S2D, a to c; Fig. 1). OsHAK18 is also expressed in the glumous flower (Supplemental Fig. S2Dd).
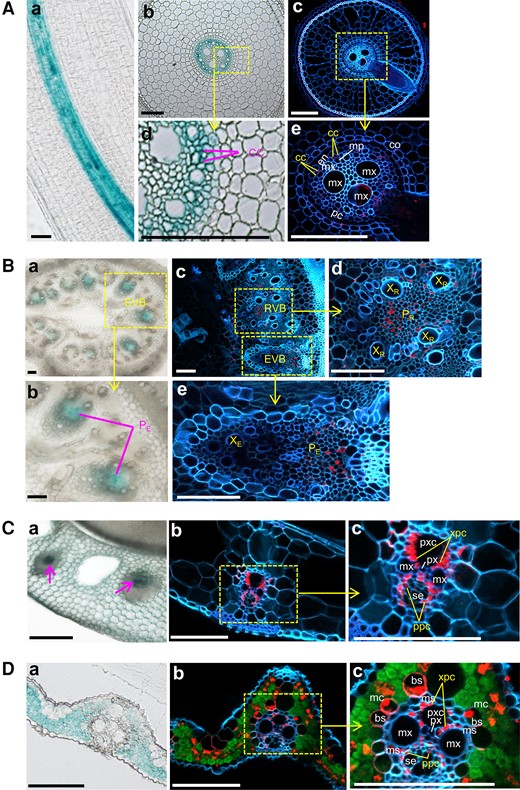
Tissue and cellular localization of OsHAK18 in rice. The localization is based on the detection of GUS reporter staining in transgenic rice plants harboring the ProOsHAK18:GUS construct and by OsHAK18 immunostaining. A) Crown root. B) Basal node. C) L.S. D) L.B. The GUS staining is seen in the transmitted-light images, Aabd, Bab, Ca, and Da, and the immunostaining in confocal fluorescence images, Ace, Bcde, Cbc, and Dbc. In the immunostained cross-sections, the red, green, and blue colors represent the expression of OsHAK18, chlorophyll autofluorescence, and cell wall autofluorescence, respectively. bs, vascular bundle sheath; cc, phloem companion cell; co, cortex; en, endodermis; EVB, enlarged vascular bundle; mc, mesophyll cell; mp, metaphloem; ms, mestome sheath; mx, metaxylem vessel; pc, pericycle; PE, phloem of EVB; PR, phloem of RVB; px, protoxylem; pxc, protoxylem cavity; RVB, regular vascular bundle; se, sieve element; ppc, phloem parenchyma cell; XE, xylem of EVB; xpc, xylem parenchyma cell; XR, xylem of RVB. Scale bars = 100 μm.
To further examine the expression of OsHAK18 at a cellular level, an immunostaining analysis was performed. In both roots and basal nodes, OsHAK18 expression was restricted to the phloem. Specifically, OsHAK18 was expressed in the CCs of the root phloem (Fig. 1, A and D and E) as well as in the phloem of the regular vascular bundle (RVB) and enlarged vascular bundle (EVB; Fig. 1, B and C to E). Unlike that found in roots and basal nodes, OsHAK18 was expressed in both the phloem parenchyma cells (PPCs) and xylem parenchyma cells (XPCs) of L.S. and leaf blades (L.B.) (Fig. 1, Cc and Dc). In the L.B., it was also transcribed in the vascular bundle sheath (BS) layer and MCs (Fig. 1Dc).
OsHAK18 is located in the rice protoplast plasma membrane and mediates K+ and Na+ import in yeast
To determine the subcellular localization of OsHAK18, we transiently coexpressed in rice protoplasts OsHAK18 fused to eGFP at its N- or C-terminal and OsRac1 fused to mCherry as the plasma membrane marker (Fig. 2). eGFP alone, the product of an “empty” vector, diffused within the cytosol, while the green signal of the eGFP-fused OsHAK18 overlapped very well with the plasma membrane marker, irrespective of the OsHAK18 terminus to which eGFP was fused (Fig. 2, A and B).
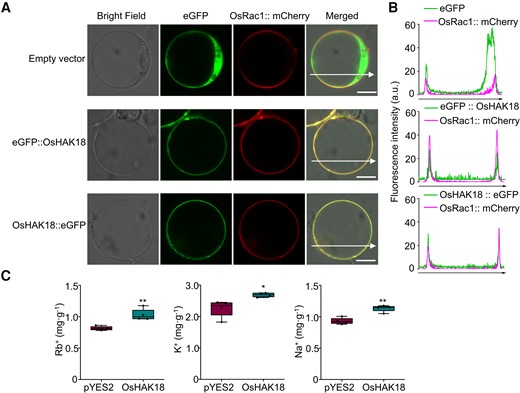
Subcellular localization of OsHAK18 and evaluation of the K+ transport activity of OsHAK18 in yeast. A) An expression of eGFP::OsHAK18 or OsHAK18::eGFP fusion proteins in rice protoplasts. OsHAK18 was colocalized with the plasma membrane–localized GTPase OsRac1. Scale bars = 10 μm. B) Line scans of rice protoplasts coexpressing OsHAK18–eGFP and OsRac1. C) Cells of G19 transformed with the empty vector pYES2 or OsHAK18 were cultured in liquid SC-U medium supplemented with RbCl for 12 h and KCl or NaCl for 24 h. Each treatment contains 4 biological replicates. In the box plots, the symbols represent individual data, whiskers represent minimum and maximum data values, the boxes are delimited by the 1st and the 3rd quartiles, and the horizontal line within the box indicates the median. Significant differences from pYES2 are indicated by asterisks (*P<0.05; **P<0.01). Nonpaired, 2-tailed, equal-variance t test was used for the statistical analysis.
To test whether OsHAK18 can mediate K+ uptake, we used the yeast strain R5421, the trk1 trk2 double mutant defective in high-affinity K+ uptake, for the functional complementation assay of the transporter. Both OsHAK18 and OsHAK5 (as a positive control of a high-affinity K+ transporter) were cloned into 3 different yeast expression vectors, p416GPD, pDR196, and pYES2, and transformed into R5421. As expected, OsHAK5 could rescue the growth defect of R5421 mutant at low external K+ medium (0.1 mM and 1 mM); however, OsHAK18 did not complement the defective growth of R5421 (Supplemental Fig. S3), implying that OsHAK18 cannot serve as a high-affinity K+ transporter, at least in yeast.
OsHAK18 was also expressed in a Na+-sensitive yeast strain G19. OsHAK18 increased by about 25% the rubidium (Rb+) content of G19 supplied with Rb+ (Fig. 2C). Moreover, OsHAK18 could elevate the K+ and Na+ content of G19 supplied with KCl and NaCl, respectively (Fig. 2C). These results suggest that OsHAK18 is able to transport both Na+ and K+.
OsHAK18 substantially affects K+ distribution between root and shoot
The GUS expression profile, subcellular location, and the Rb+ transport activity of OsHAK18 in G19 yeast suggest that OsHAK18 mediates K+ translocation in rice. To delve into the physiological function of this transporter, we obtained 2 different Tos17 insertion mutants of OsHAK18-KO in the genetic background of cv. ‘Nipponbare’ (NB) from the National Institute of Agrobiological Sciences (NIAS) in Japan and cv. ‘Zhonghua11’ (ZH) from Huazhong Agricultural University in China and verified their Tos17 insertional sites (Supplemental Fig. S4, A to C). In addition, we generated OsHAK18 self-promoter–controlled overexpression (OX) lines in cv. NB (Supplemental Fig. S4, D to F).
K+ concentration [K+] has been determined in all genotypes, in the root and in 2 parts of the shoot, the L.S. and the L.B., at 2 external K+ concentrations ([K+]EXT) outside the root (1 mM or 0.1 mM). In the wild-type (WT) plants, the L.S.'s [K+] was about 30 mg K+ per g dry weight, roughly 20% to 100% higher than the L.B.'s [K+] (Fig. 3, A to D). In contrast, in the OsHAK18-KO plants, at the normal [K+]EXT of 1 mM, the root's [K+] was reduced relative to WT's, but [K+] in the KO's shoot did not differ from that in the WT's shoot (Fig. 3A). At [K+]EXT of 0.1 mM, [K+] in the KO's root was also reduced relative to WT's, but in contrast, in the KO's L.S., [K+] was elevated appreciably compared with WT's (Fig. 3C).
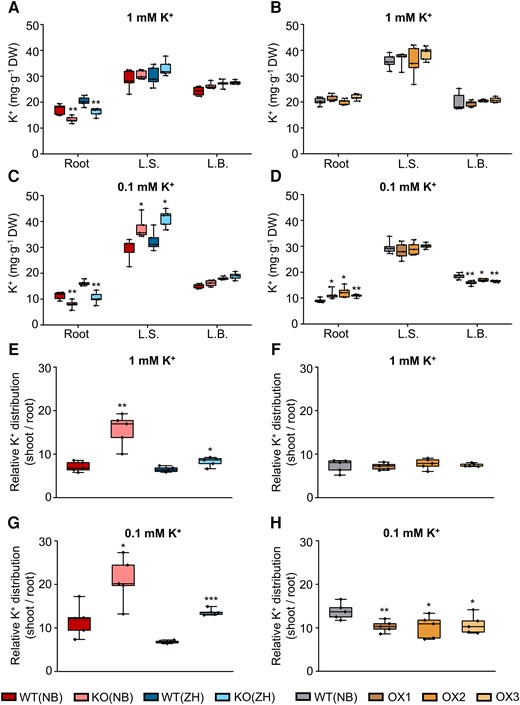
Effect of OsHAK18 expression level on K+ distribution at the seedling stage. Ten-d-old seedlings were grown in IRRI solution containing 1 mM K+ for 4 wks and then transferred to 1 mM K+ (A), B), E), F)) or to 0.1 mM K+ (C), D), G), and H)) solutions for 2 wks. A) to D) K+ concentration in root, L.S., and L.B. E) to H) Relative K+ distribution (shoot/root ratio of total K+ content). Detailed data on total K+ content in root and shoot are provided in Supplemental Fig. S6. Each treatment contains 5 biological replicates. The box plots and t tests are as in Fig. 2. Significant differences from the corresponding WT are indicated by asterisks (*P<0.05; **P<0.01; ***P<0.001).
The biomass of the OsHAK18-KO plants was smaller than that of WT (Supplemental Fig. S5, A, B, E, and F), such that the total K+ content (biomass* [K+]) in any of the separate parts of the KO plant—root, L.B., and L.S.—was appreciably smaller than in the WT and by a larger percentage in the root (75%) than in the shoot (50%; Supplemental Fig. S6A). A similar decrease (in %) in the total K+ content was observed in KO vs the WT plants at the low [K+]EXT of 0.1 mM, even though at this low [K+]EXT, the total K+ content was lower in both genotypes, relative to the regular [K+]EXT (Supplemental Fig. S6B). Therefore, the shoot-to-root ratio of the total K+ content (a measure of total K+ distribution in the plant) increased appreciably, also irrespective of [K+]EXT (Fig. 3, E and G). In summary, compared with WT, OsHAK18-KO dramatically increased the [K+] in the shoot at [K+]EXT of 0.1 mM (Fig. 3C) and shifted the relative distribution of K+ to the shoot, irrespective of the [K+]EXT (Fig. 3, E and G; see Discussion).
The OsHAK18 function was also analyzed in 3 representative OX lines. The biomass of all parts of the OX plants was also smaller than WT's (Supplemental Fig. S5, C, D, G, and H). While at [K+]EXT of 1 mM, OX did not affect [K+] neither in the root nor in the shoot (Fig. 3B), at the low [K+]EXT of 0.1 mM, OX increased [K+] in the root and decreased it in the L.B. (Fig. 3D). Thus, with 1 mM K+ in the growth solution, OX decreased the total K+ content both in the shoot and the root (Supplemental Fig. S6C), but it did not affect the relative distribution of total K+ between the shoot and the root relative to WT's (Fig. 3F). In contrast, at [K+]EXT of 0.1 mM, OX diminished the total K+ content only in the shoot (Supplemental Fig. S6D) and thus decreased the shoot-to-root ratio of the total K+ content (Fig. 3H). These results suggest that OsHAK18 appreciably affects the distribution of K+ between the root and the shoot, particularly under a limited K+ supply.
OsHAK18 does not contribute to root K+ uptake and transport from root to shoot
In the root, OsHAK18 is expressed only in the stele, not in epidermal and cortex cells (Fig. 1A, a to c), suggesting that OsHAK18 may not contribute to K+ uptake. To test this, we determined the short-term K+ acquisition rate (normalized to the root weight) at 1 mM or 0.1 mM [K+] in the growth medium, which was determined by K+ depletion experiments from the external solution. The K+ acquisition rate during a 12 h assay did not differ among all the rice genotypes, WT, KO, and OX at both [K+]EXT, even if it was roughly 3 times lower at the low [K+]EXT compared with the regular [K+]EXT (Supplemental Fig. S7). These results exclude a direct role of OsHAK18 in the root K+ uptake in rice.
To examine the OsHAK18 role in the xylem transport of K+ directly, we first analyzed K+ concentration in the xylem sap of all our rice genotypes grown in 1 mM or 0.1 mM K+. To generate similar starting conditions for both treatments, the roots were immersed for 3 h in a medium without K+ (because otherwise, they would start with different root [K+] as a result of the different growth conditions [Fig. 3, A to D], which would generate bias in the xylem sap [K+]). We collected the xylem sap initially in 1 h intervals for 3 consecutive h at nominally zero K+ and subsequently for additional 3 h with either 1 mM or 0.1 mM K+ restored to the bath. During the K+ deprivation period, the KO plants grown in 1 mM K+ had a lower xylem sap [K+] than the corresponding WT only during the first h (Fig. 4A), while in KO grown in 0.1 mM K+, this difference in the xylem sap [K+] lasted for twice as long (Fig. 4B). However, after 3 h, the root [K+] became the same in both treatment groups (a suitable starting point for assaying the effect of K+ resupply).
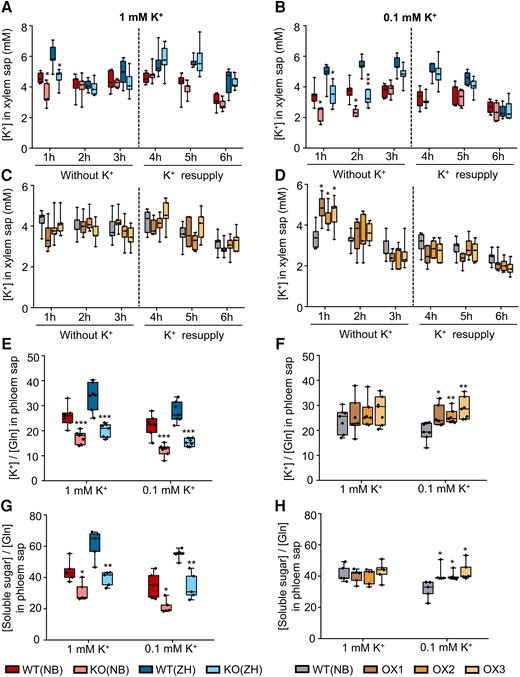
Effect of OsHAK18 expression level on K+ concentration in the xylem and soluble sugar concentration in phloem sap of rice. A) to D) The seedlings were grown in IRRI solution containing 1 mM K+ for 8 wks and then transferred to a medium with 1 mM K+ (A) and C)) or 0.1 mM K+ (B) and D)) for 3 d. Subsequently, the shoot was excised, the root was transferred to 0.1 mM CaCl2 solution without K+, and the xylem sap was collected during 3 1 h periods. After 3 h, the root was transferred back to 1 mM K+ (A) and C)) or 0.1 mM K (B) and D)) solution, and the xylem sap was collected similarly, in 3 1 h periods for 3 more h. E) to H) The seedlings were grown in IRRI solution containing 1 mM K+ for 8 wks and then transferred to a medium with 1 mM or 0.1 mM K+. After 3 d of culture, phloem sap was collected during a 5 h period for K+ and soluble sugar analysis. Glutamine was determined for internal standard (Ren et al. 2005). Each treatment contains 5 (A) to D), G), and H)) or 7 (E) and F)) biological replicates. The box plots and t tests are as in Fig. 2. Significant differences from the corresponding WT are indicated by asterisks (*P<0.05; **P<0.01; ***P<0.001).
In the OX lines grown in 1 mM K+, the xylem sap K+ concentration was the same as in WT and did not change with time (Fig. 4C), matching the preexperiment lack of difference between WT's and OX’s root [K+] (Fig. 3F). In contrast, in OX grown in 0.1 mM K, root [K+] was higher than in WT during the first h of K+ deprivation and declined to the same level as WT's during the next 2 h (Fig. 4D). Thus, also the root [K+] of the OX plants required an equilibration period. After K+ was added back, K+ concentration in the xylem sap of KO or OX lines remained similar to their corresponding WTs and did not increase during the 3 h of the follow-up period (Fig. 4, A to D), again, excluding OsHAK18's role in xylem sap loading with K+.
OsHAK18 is involved in K+ recirculation and affects sugar translocation in the phloem
Based on the above results, it is reasonable to assume that OsHAK18 influences K+ root and shoot distribution via the phloem transport. To examine this directly, phloem sap was collected from all our rice genotypes grown in a medium with 1 mM or 0.1 mM K+. Because glutamine is abundant in the phloem sap and remains quite constant during the entire 24 h day–night cycle, glutamine is often used as an internal standard for measuring the concentration of ion and photo-assimilates in phloem sap (Corbesier et al. 2001; Ren et al. 2005). The phloem sap [K+] was thus normalized to the glutamine concentration in the same sample. The phloem sap [K+] in both KO lines was only about 50% to 65% of that in the corresponding WTs irrespective of the [K+]EXT levels (Fig. 4E), while in all 3 OX lines grown in [K+]EXT of 0.1 mM, it increased by at least 30% (Fig. 4F). These results support the notion that OsHAK18 contributes to K+ entry into the phloem.
Since translocation of photo-assimilates from source leaves to roots via the phloem requires high K+ concentrations in the sieve tubes and a steep transmembrane pH gradient, we examined the OsHAK18 effect on sugar concentration in the phloem. Remarkably, KO and OX of OsHAK18 affected oppositely the soluble sugar concentration in the phloem at the low [K+]EXT: KO reduced and OX increased it (Fig. 4, G and H). In contrast, at the normal K+ supply level, while KO reduced the sugar level, OX did not affect it (Fig. 4, G and H). These changes in the phloem sugar level were consistently similar to changes in the phloem [K+] of these transformants.
To test further whether OsHAK18 contributes to K+ recycling from the shoot to the root, we took advantage of the Rb+ transport capability of the HAK family transporters (Ródenas et al. 2017) and performed an experiment with split-root plants. One half root was first exposed to 0.5 mM Rb+ and the other half to 0.5 mM K+ for 3 h. After that, the medium in both root containers was switched to one with 0.5 mM K+ (Fig. 5A). We measured the Rb+ content in both parts of the root and the shoot at 3 h and 6 h after initiation of the treatments.
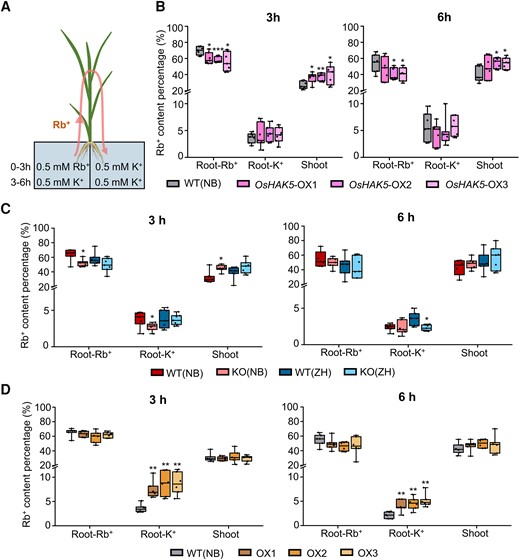
Effect of OsHAK18 expression level on Rb+ transport in rice plants. A) Schematic diagram of split-root experiment. B) Rb+ content percentage (i.e. the percentage of the total Rb+ acquired by the plant) in different plant parts in OsHAK5-OX lines and their corresponding WT at 3 and 6 h of the pulse chase. C)OsHAK18-KO lines and their corresponding WTs. D)OsHAK18-OX lines and their corresponding WT. Root-Rb+, root exposed to Rb+; Root-K+, root not exposed to Rb+. Each treatment contains 7 (B) and C)) or 6 (D)) biological replicates. The box plots and t tests are as in Fig. 2. Significant differences from the corresponding WT are indicated by asterisks (*P<0.05; **P<0.01; ***P<0.001).
As a control, we performed the same experiment on rice overexpressing OsHAK5, a transporter known to mediate root to shoot K+ translocation in rice. In OsHAK5-OX, as expected, the relative amount of Rb+ in the Rb+-exposed half root (i.e. the percentage of the total Rb+ acquired by the plant) was lower than in WT, while in the roots exposed to K+, the relative amount of Rb+ was the same as in WT (Fig. 5B). In the shoot, Rb+ accumulation was enhanced in OsHAK5-OX relative to WT (Fig. 5B). The fulfilled expectation with regard to the OsHAK5-OX effect, together with an earlier demonstration of Rb+ transport by OsHAK18 (Fig. 2C), confirmed that the Rb+ distribution in the split-root experiment with OsHAK18 should also reliably represent the circulation of K+ in rice.
The relative amount of Rb+ in the Rb+-exposed half root was almost the same in both OsHAK18-KO lines and their corresponding WTs (roughly 50% to 70%), except that in the NB KO line, it was less than in NB WT in 3 h of treatment. The root of the K+-exposed half contained a very low fraction of Rb+ (roughly 4% of total); KO reduced this even further (by roughly 25% to 30% of WT, the NB cultivar after 3 h and the ZH cultivar after 6 h; Fig. 5C). In the shoot, which accumulated about 40% of the Rb+ in 3 h and 50% Rb+ in 6 h, the NB KO line accumulated more Rb+ than NB WT in 3 h of treatment (Fig. 5C). In contrast, the Rb+ content in the K+-exposed roots of OsHAK18-OX plants was more than double than in WT at both h 3 and h 6 (Fig. 5D). All these data support the notion that the direction of K+ flow mediated by OsHAK18 is opposite from that of OsHAK5 and that OsHAK18 enhances K+ translocation from the shoot to the root.
Increasing OsHAK18 expression affects the plant architecture and the sugar translocation resulting in an increased yield of rice in a paddy field
To reveal the role of OsHAK18 in the rice maturation stage, we evaluated the plant growth and the grain yield of WT, KO, and OX mature (20 wks old) plants. Compared with WT, OsHAK18-KO plants had appreciably reduced height, tiller number, panicle length, seed setting rate (%), and grain number per panicle, leading to reduced yield and grain-to-straw ratio (Fig. 6, A and B; Supplemental Fig. S8, A and C). In contrast, while OsHAK18-OX plants had also reduced plant height, they had markedly higher tiller numbers and, therefore, a higher grain yield (Fig. 6, F and G; Supplemental Fig. S8, B and D).
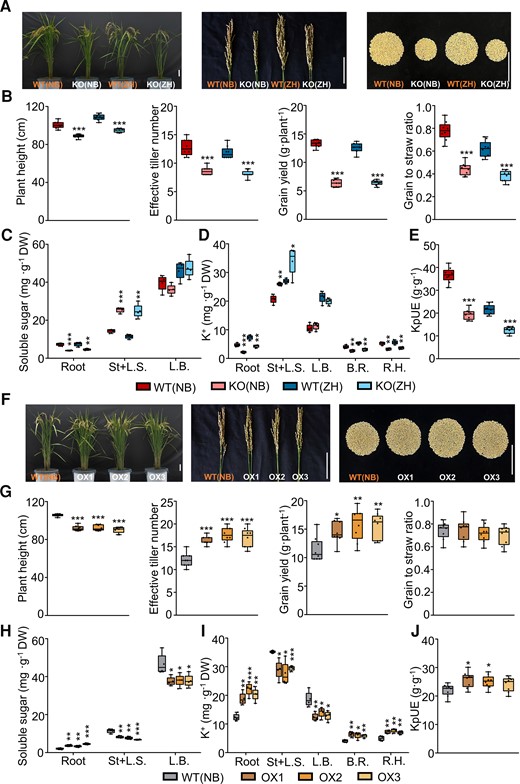
Effect of OsHAK18 expression level on agronomic traits and K+ and soluble sugar distribution at reproduction. Rice plants were grown in the paddy field and irrigated, fertilized, and medicated regularly until they were fully mature (∼20 wks old). A) and F) Phenotypes of whole plants and panicles and yield per plant. Scale bars = 10 cm. B) and G) Plant height, effective tiller number, grain yield, and grain-to-straw ratio. C) and H) Soluble sugar concentration. D) and I) K+ concentration. E) and J) KpUE, K+ physiological utilization efficiency, i.e. the grain yield produced by unit weight of total accumulated K+ per plant. St + L.S., stem and leaf sheath; L.B., leaf blade; B.R., brown rice; R.H., rice hull. Detailed data on other agronomic traits are provided in Supplemental Fig. S8. Each treatment contains 8 (B), E), G), and J)) or 4 (C), D), H), and I)) biological replicates. The box plots and t tests are as in Fig. 2. Significant differences from the corresponding WT are indicated by asterisks (*P<0.05; **P<0.01; ***P<0.001).
Since K+-generated turgor pressure in the phloem is essential for loading soluble sugar at the source and unloading at sink sites (Dreyer et al. 2017 ), we asked whether OsHAK18 had a role in these processes. Therefore, we examined the soluble sugar distribution in the root, stem, L.S., and L.B.. In the OsHAK18-KO plants, soluble sugar accumulation in the root was markedly lower compared with WT, but in the stem and L.S., it was higher than in the WT (Fig. 6C). In contrast, in the OsHAK18-OX plants, the soluble sugar content was higher in the roots but lower in the stem, L.S., and L.B. than in the WT (Fig. 6H).
To further outline the OsHAK18 role in altering K+ distribution between source and sink organs at the maturation stage, we measured K+ concentration in the root, stem, L.S., L.B., brown rice (a whole rice grain without the hull), and rice hull. As expected, K+ concentration in the root, brown rice, and rice hull was reduced by OsHAK18-KO and increased by OsHAK18-OX. In contrast, K+ concentration in stem and leaves was increased by OsHAK18-KO and decreased by OsHAK18-OX (Fig. 6, D and I). The differences in K+ concentration among the samples were consistent with those of the sugar. Interestingly, K+ physiological utilization efficiency (KpUE), i.e. the grain yield normalized (w/w) to the total accumulated K+ in a plant, was almost halved by OsHAK18-KO (Fig. 6E) but increased by 9% to 17% by OsHAK18-OX (Fig. 6J), demonstrating that OsHAK18-controlled K+ recirculation in the phloem is essential for maintaining a high KpUE. Thus, properly enhancing the OsHAK18 activity driven by its endogenous promoter can promote both grain yield and K+ use efficiency.
OsHAK18 mediates Na+ recycling from the shoot to the root under salt stress
Since OsHAK18 also enhanced the accumulation of Na+ in yeast (Fig. 2C), we examined its function in rice under 100 mM NaCl stress. Relative to WT, OsHAK18-KO reduced both K+ and Na+ concentration in the root while increasing the concentration of Na+, but not K+, in the shoot (Supplemental Fig. S9, A and C). Their calculated K+/Na+ ratio was lower than that of the WT in both root and shoot (Supplemental Fig. S9E). In contrast, OsHAK18-OX elevated K+ concentration but decreased Na+ concentration in the shoots with the opposite change of K+ and Na+ concentration in the root (Supplemental Fig. S9, B and D) and thus resulted in a higher K+/Na+ ratio compared with WT in the shoot (Supplemental Fig. S9F).
Ion recycling under high salt stress may be affected due to a disruption of phloem transport by plasmodesmata plugged by callose accumulation and P-protein aggregation at the sieve pores (Xie and Hong 2011). To distinguish this effect of the salt stress on plasmodesmata transport from the effect of salt stress on membrane transport via OsHAK18, we treated all our rice genotypes with a moderate salt stress of 20 mM Na+ (at [K+]EXT of 1 mM) for 3 d and measured K+ and Na+ in the phloem sap. Both K+ and Na+ concentrations were appreciably lower in the sap of the OsHAK18-KO plants than in WT (Fig. 7, A and B) and markedly higher (by about 30% to 40%) in the phloem sap of the OsHAK18-OX lines compared with WT (Fig. 7, C and D). The results suggest that under salt stress, OsHAK18 enhances Na+ (K+) recycling from the shoot to the root in rice.
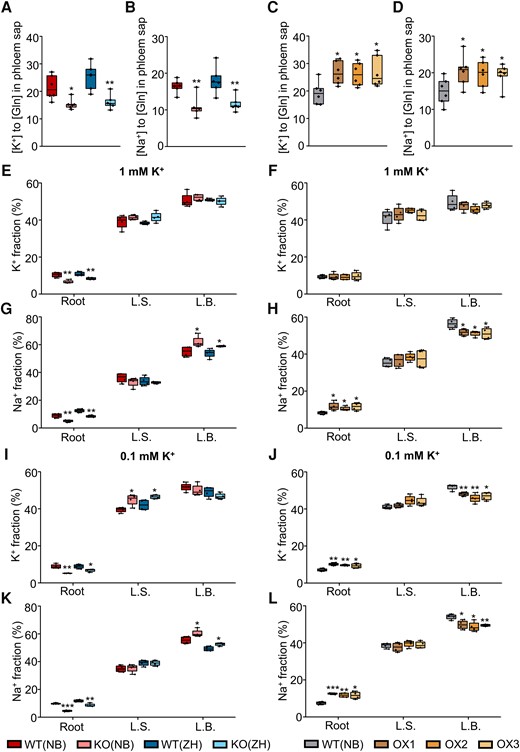
Effect of OsHAK18 expression level on K+ and Na+ transport and distribution in rice supplied with NaCl in the culture solution. A) to D) Ten-d-old seedlings were grown in IRRI solution containing 1 mM K+ for 8 wks, then transferred to a solution containing additional 20 mM NaCl, and allowed to grow for 3 d. The phloem sap was collected and analyzed. E) to L) Ten-d-old seedlings were grown in IRRI solution containing 1 mM K+ for 2 wks, then transferred to 1 mM K+ (E) to H)) or to 0.1 mM K+ (I) to L)) solutions for 2 wks, then transferred to 1 mM K+ or to 0.1 mM K+ solutions containing additional 20 mM NaCl and allowed to grow for 3 d, and then returned to 1 mM or 0.1 mM K+ medium without NaCl for additional 3 d. K+ or Na+ fraction (%) represents the percentage of K+ or Na+ content in each plant part of the total K+ or Na+ content of the whole plant. L.S., leaf sheath; L.B., leaf blade. Detailed data on K+ and Na+ concentration in root and shoot are provided in Supplemental Fig. S10. Each treatment contains 6 (A) to D)) or 4 (E) to L)) biological replicates. The box plots and t tests are as in Fig. 2. Significant differences from the corresponding WT are indicated by asterisks (*P<0.05; **P<0.01; ***P<0.001).
In a follow-up experiment, we treated all rice lines with 20 mM NaCl for 3 d at [K+]EXT of 1 mM and 0.1 mM. We returned the plants to 1 mM and 0.1 mM [K+]EXT medium without NaCl for an additional 3 d and then measured K+ and Na+ content in the roots and shoots. At [K+]EXT of 1 mM, although K+ concentration and its relative distribution in shoots of KO and OX plants were similar to those of WT (Supplemental Fig. S10, A and B; Fig. 7, E and F), Na+ concentration in the L.S. and the L.B. of KO plants was markedly higher than in the respective WT plants (Supplemental Fig. S10C). Furthermore, compared with WT, OsHAK18-KO plants had a lower fraction (% of the total accumulated amount per plant) of Na+ in the roots but a higher Na+ fraction in the L.B. (Fig. 7G); these differences were exactly opposite in the OsHAK18-OX plants (Fig. 7H). These differences resulted in a decrease in the K+/Na+ ratio in the shoot of OsHAK18-KO and an increase in the shoot of OsHAK18-OX.
At [K+]EXT of 0.1 mM, the concentration of K+ and Na+ in the roots of OsHAK18-KO plants was lower than in the corresponding WT plants, while K+ concentration in the L.S. and Na+ concentration in both the L.S. and the L.B. of KO plants were markedly higher than in the corresponding WT plants (Supplemental Fig. S10, E and G). Therefore, compared with WT, OsHAK18-KO plants had a lower fraction of K+ and Na+ in the roots but a higher K+ fraction in the L.S., as well as a higher Na+ fraction in the L.B. (Fig. 7, I and K). Moreover, these differences were exactly the opposite in the OsHAK18-OX plants with regard to Na+ (Supplemental Fig. S10H compared with S10G and Fig. 7L compared with 7K) and also with regard to K+ (with a “switch” between L.S. vs L.B.; Supplemental Fig. S10F compared with S10E and Fig. 7J compared with 7I). All these results indicate that under salt stress, OsHAK18 contributes to the recirculation of Na+ and K+ from the shoot to the root, which is more pronounced at the limited than at the regular K+ supply.
Discussion
That K+ circulates in plants from root to shoot and back from the shoot to the root has been textbook knowledge for years. Out of the rice HAK/KUP/KT genes of K+ carriers, the OsHAK18 gene product, OsHAK18, is shown here unequivocally to mediate the downward, shoot-to-root K+ translocation via the phloem and translocation of Na+ under the presence of Na+ salts. Enhancing OsHAK18 expression controlled by its native promoter can dramatically promote sugar translocation, grain yield, and KpUE in rice (Fig. 6, F to J).
The specific cellular localization of OsHAK18 suggests its role in several stages of this K+ recirculation (the following description of its activity is based solely on OsHAK18's expression patterns; Fig. 1): In source leaves, OsHAK18 mediates the transport of K+ from MCs to the SE–CC complex (Fig. 8A). Generally, the short-distance transport of K+ in source leaves may be achieved through 2 distinct pathways (Fig. 8A; dashed horizontal arrows) and/or their combination: (i) K+ leaked to the apoplastic space from MCs can be imported by OsHAK18 into the adjacent MCs or into the adjacent vasculature bundle sheath (VBS) cells and then diffuse via plasmodesmata into mestome sheath (MS) cells. Then, it can leak again into the apoplast (including the xylem) and be imported again by OsHAK18 (stained in Fig. 1Dc and especially strongly in Fig. 1Cc) into the adjacent XPCs. Then, it can leak again into the apoplast and be imported by OsHAK18 into PPCs/CCs and then diffuse into phloem SEs through plasmodesmata. (ii) At the other extreme, not involving membrane transporters, K+ can diffuse all the way from MCs to the phloem SEs via plasmodesmata (symplastically), through the VBS cells and MS cells and various parenchyma cells (incl. PPCs/CCs). Notably, as interfering with OsHAK18 expression shows (see discussion further down), the purely symplastic pathway is probably much less effective for the downward translocation of K+.
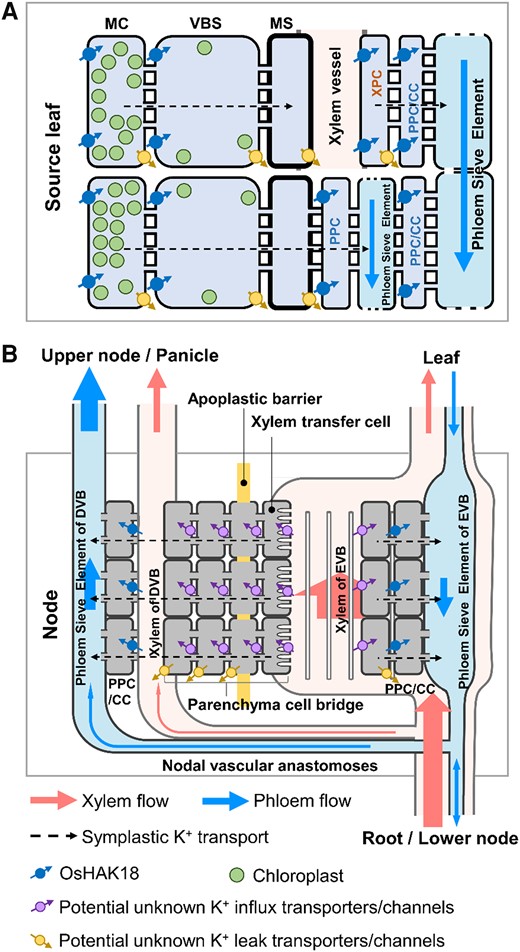
A working model for the roles of OsHAK18 in K+ redistribution in the leaf blades and nodes of rice. A) The role of OsHAK18 in the short-distance transport of K+ in a source leaf. B) The role of OsHAK18 in a node. CC, companion cell; DVB, diffuse vascular bundle; EVB, enlarged vascular bundle; MC, mesophyll cell; MS, mestome sheath cell; PPC, phloem parenchyma cell; VBS, vascular bundle sheath cell; XPC, xylem parenchyma cell. The size of arrows in the phloem and xylem represents flow area.
It should be noted that phloem bulk flow in rice is not only downward but also conveys minerals and photo-assimilates upwardly from the source leaves to the sink leaves and organs; the branching into the 2 types of flow occurs in the node. Thus, in the rice node vascular system (Fig. 8B; referring to the schematic diagram by Yamaji and Ma 2017), OsHAK18 mediates the influx of K+ into PPCs/CCs of the EVB and of the diffuse vascular bundle (DVB; Fig. 8B). In future work, it would be of interest and importance to identify the different K+ efflux and K+ influx transporters in both leaves and nodes.
The evidence for OsHAK18 function in K+ recirculation via the phloem is based on an ensemble of 9 findings using a variety of approaches (all the comparisons are in relation to WT): (i) the natural OsHAK18-enriched expression in the phloem CCs and PPCs and particularly in the shoot (Fig. 1, B to D); (ii) the membrane localization of OsHAK18 in rice protoplasts (Fig. 2, A and B); (iii) a decreased [K+] in the root of OsHAK18-KO in both NB and ZH cultivars (Fig. 3, A and C); (iv) the decreased [K+] in the L.B. of OsHAK18-OX in the NB cultivar plants exposed to K+-deficient solution (Fig. 3D); (v) the increased shoot-to-root ratio of total K+ content in the KO plants (Fig. 3, E and G) and the decreased shoot-to-root ratio of total K+ content in OsHAK18-OX plants faced with K+-deficient nutrient solution (Fig. 3H); (vi) identical rates—among all genotypes within a given group (KO or OX)—of K+ depletion from the media bathing the roots, independent of both K+ supply levels (low and high), even if 3-fold slower at the low [K+]EXT (these findings exclude OsHAK18 as a root K+ acquisition transporter) (Supplemental Fig. S7); (vii) a reduced [K+] in the phloem sap of OsHAK18-KO plants (Figs. 4E and 7, A and B) and increased [K+] in the phloem sap of OsHAK18-OX plants (Figs. 4F and 7, C and D); (viii) the decreased Rb+ translocation from the Rb+-fed root half to the Rb+-spared root half in the split-root experiment in the KO plant (Fig. 5C) and the enhanced Rb+ translocation from the Rb+-fed root part to the Rb+-spared root part in the OX lines (Fig. 5D); and (9) the diametrically opposed to the above distribution of K+ between the root parts of OsHAK5-OX in the control split-root experiment (Fig. 5B), due to the known function of OsHAK5 in enhancing translocation of K+ from root to shoot (Yang et al. 2014; 2020).
OsHAK18 is not involved in root K+ absorption nor in root-to-shoot K+ translocation
Root absorption of K+ from culture medium is mediated by high- and low-affinity transporters and channels, which enable adaptation to varied supply levels (Epstein et al. 1963; Maathuis and Sanders 1997; Li et al. 2018). Root-acquired K+ is transported into root stelar tissues and translocated from the root toward the shoot via xylem vessels (Marschner et al. 1996). As detected in Arabidopsis and rice, most putative HAK transporters and K+ channels are located in root epidermal and XPCs, indicating their function mainly in root K+ absorption and K+ translocation to the shoot. In Arabidopsis, AtHAK5 is the only system for root K+ uptake from as low as 0.01 mM external [K+] (Rubio et al. 2010), and AtKUP7 shows a higher expression level in root than in other organs and is crucial for K+ uptake (Han et al. 2016). In rice, both OsHAK1 and OsHAK5, which have the homology with AtHAK5, participate in K+ absorption and are upregulated by K+ deficiency in roots (Yang et al. 2014; Chen et al. 2015). OsHAK16 was also upregulated by K+ deficiency in roots and plays a similar but nonredundant role in K+ uptake by roots, as do OsHAK1 and OsHAK5 (Feng et al. 2019). In this study, we found that, unlike those already-described HAK family members, OsHAK18 is expressed mainly in the phloem CCs but not in epidermal and cortex cells of the root (Fig. 1A) and its transcripts in the root are not upregulated by K+ deficiency (Supplemental Fig. S2A).
While in the long-term experiments OsHAK18-KO decreased the [K+] in the root and increased [K+] in the shoot (Fig. 3, A and C), the lack of effect of OsHAK18 elimination on the short-term K+ absorption by the root (Supplemental Fig. S7, A and B) indicates that OsHAK18 is not involved in root K+ uptake in rice. This conclusion is further strengthened by the OsHAK18-OX under its native promoter that we generated to enhance OsHAK18 activity without affecting its pattern of expression and localization to avoid potential alteration of its K+ transport properties. As expected, OsHAK18-OX did not affect the short-term K+ absorption rate (Supplemental Fig. S7, C and D). A similar conclusion is also suggested by the lack of effect of either OsHAK18-KO or OsHAK18-OX on the K+ concentration in the xylem sap (compared with the corresponding WT), irrespective of the external K+ supply levels at the root (Fig. 4, A to D).
OsHAK18 promotes K+ circulation from the shoot to the root and sugar translocation from source to sink organs
In Arabidopsis, a “weakly-inward rectifying” K+ channel, AKT2, has been shown to mediate K+ phloem loading but also (under different circumstances) to mediate K+ release from the phloem, thereby enhancing the loading of phloem with sugar (Deeken et al. 2002, Gajdanowicz et al. 2011). Similar to AKT2, OsAKT2 has been shown to be important for K+ phloem loading and K+ recirculation via the phloem (Tian et al. 2021). However, it was not known if additional K+ transporter(s) is also involved in K+ movement in the phloem, especially in the K+ translocation from the shoot to the root. The fact that OsHAK18-KO plants are impaired in K+ recirculation means that OsAKT2 cannot fulfill this role all by itself. OsHAK18 has now been revealed as a new participant in the phloem loading of K+ and the shoot-to-root translocation of K+. Furthermore, OsHAK18's participation in sugar translocation paralleling with K+ redistribution (Figs. 4, G and H, and 6, C and H) resembles the function of OsAKT2, which enhances sugar transfer from source sites to sink sites (Tian et al. 2021), demonstrating that OsHAK18 coordinates the delivery of K+ and photo-assimilates in the phloem.
OsAKT2 and OsHAK18 may play complementary roles in the phloem movement of K+ at different K+ supply levels or different loading directions. On one hand, OsAKT2 functions mainly as an inward rectifier with strong voltage dependency (Huang et al. 2021) and the elimination of phloem-located OsAKT2 expression resulted in a relatively higher accumulation of K+ in the shoot at a normal K+ supply (Tian et al. 2021). Notably, OsHAK18 contributes to K+ recirculation in phloem at both normal and low K+ supply status (Figs. 3, E and H, and 4, E and F). In addition, when expressed in Arabidopsis, OsAKT2 can complement the K+ deficiency in the phloem sap and the leaves of the akt2 mutant (Huang et al. 2021). On the other hand, however, unlike AKT2, which functions in the leakage of K+ from the CCs of the transport phloem (Deeken et al. 2002; Gajdanowicz et al. 2011), OsAKT2 does not allow K+ leak from cells (Huang et al. 2021). Furthermore, since this outward K+ leak is what allows the Arabidopsis AKT2 to generate the sugar-loading-into-phloem “K+ battery” (Gajdanowicz et al. 2011), the lack of outward K+ leak via OsAKT2 casts doubt on its participation in any such battery in rice (Huang et al. 2021). Therefore, it seems that in the rice plant, OsAKT2 and OsHAK18 share the responsibility for K+ loading into the phloem; however, between the 2, only OsHAK18 is likely to be involved in the phloem sugar loading, perhaps “partnering” instead with a dedicated K+ release channel, such as OsGORK (that is expressed in rice more widely than its homolog, OsSKOR; Kim et al. 2015).
OsHAK18 activity manifests differently at different K+ supply levels
The OsHAK18 relevance for K+ recirculation, which was not evident in the WT, becomes obvious in OsHAK18-KO, (i) as a decrease of [K+] in the root (relative to WT), irrespective of K+ supply ([K+]EXT; Fig. 3, A and C), and (ii) as an increase of [K+] in the shoot (relative to WT), but only at the low [K+]EXT (Fig. 3C).
The decrease in the root's [K+] in the KO is consistent with a decline in K+ return from the shoot due to a decreased K+ phloem loading in the absence of OsHAK18, attesting to its nonnegligible role in the WT. In support of this notion, at [K+]EXT of 1 mM, the phloem sap [K+] was indeed appreciably lower in the OsHAK18-KO than in the WT (Fig. 4E). This difference also held at the low [K+]EXT (at least, after 3 d of growth at [K+]EXT of 0.1 mM K+; Fig. 4E).
Furthermore, given that OsHAK18-KO did not affect the rates of K+ upward movement in the xylem, irrespective of [K+]EXT (Fig. 4, A and B, h 4 to 6; Supplemental Fig. S7, A and B), in the absence of this downward-translocating transporter, the shoot's [K+] would be expected to increase. Why, then, did the shoot's [K+] increase in KO only at [K+]EXT of 0.1 mM (Fig. 3C)? The decreased K+ return via the KO's phloem could explain this occurrence. That it is not reflected in the shoot's [K+] at [K+]EXT of 1 mM is probably due to the large K+ storage capacity of the shoot, particularly in the L.S., which at the normal K+ supply buffers small changes in [K+].
Moreover, why is the root's [K+] decline in the KO plants at [K+]EXT of 1 mM and 0.1 mM (due to diminished downward K+ return) mirrored in the OX plants as the root's K+ enrichment only at [K+]EXT of 0.1 mM (Fig. 3D) but not at [K+]EXT of 1 mM (Fig. 3B)? The same question applies to the OX shoot's [K+], which shows depletion (in the L.B.) only at [K+]EXT of 0.1 mM (Fig. 3D). It would appear that the increased expression of OsHAK18 (under its native promoter; Supplemental Fig. S4F) is not effectively pronounced at the transport activity level at the normal K+ supply, perhaps because of its posttranslational modification. In support of this notion of the lack of added OsHAK18 activity in OX at the normal K+ supply is also the unaltered [K+] in the phloem sap (Fig. 4F).
However, at [K+]EXT of 0.1 mM, OsHAK18 expression in the shoot may even be enhanced (resembling its enhanced expression on Day 3 of root treatment with 0 mM K+; Supplemental Fig. S2, B and C). Since such expression enhancement, and possibly also posttranslational modification, would likely include the additional gene copies under the OsHAK18's native promotor in OX, OsHAK18 would play a prominent role in recirculating K+ from the shoot to the root (Figs. 3D and 4F). Moreover, the fact that lowering the K+ supply level emphasized the effect of OsHAK18-OX on [Na+] in the root, but even more so in the shoot (Supplemental Fig. S10H compared with S10D), supports the notion of increased activity of OsHAK18 also toward Na+, as a result of regulatory feedback of the K+ level on the transporter itself. Moreover, by comparison, OsHAK5's role as an upward K+-translocating transporter is similarly not pronounced at [K+]EXT of 1 mM but becomes substantial at [K+]EXT of 0.1 mM (Yang et al. 2014).
Enhancing OsHAK18 expression increases KpUE and grain yield
Improving K+ physiological use efficiency, i.e. less K+ demand for reaching high yield, can reduce soil K+ depletion by plants and the demand for K+ fertilizers (Shin 2014). Unlike N and P, which are mainly accumulated in grains/seeds, the majority of acquired K+ from soil or fertilizer is kept in vegetative organs, like straw, in rice. The dramatic reduction of K+ concentration in the straw of OsHAK18-OX (Fig. 6I) and its increased grain yield (Fig. 6G) signify an increase of KpUE by a nonnegligible 9% to 17% (Fig. 6J), resulting—we presume—from an enhanced circulation of K+ in the phloem.
We noticed that OsHAK18 had a significant effect on rice architecture, especially tiller number, which is 1 of the 3 major components in determining the rice grain yield (Fig. 6, B and G; Supplemental Fig. S8). Plant architecture, including rice tiller number, is regulated by polar auxin transport (Lu et al. 2015; Luo et al. 2020). Cellular auxin fluxes are strongly affected by transmembrane pH gradients (Steinacher et al. 2012), which, in turn, are regulated by interactions between H+ pumps, H+-coupled carriers, and ion channels at the plasma membrane (PM) (Sze and Chanroj 2018). For example, OsHAK5, an electrogenic K+/H+ symporter, regulated the chemiosmotic gradient, PM polarization, and extracellular pH in rice, resulting in positive regulation of polar auxin delivery streams and an increased rice tiller number (Yang et al. 2020). Since OsHAK18 is a plasma membrane–located K+/H+ cotransporter (Fig. 2), expressed abundantly in the vascular tissue (Fig. 1B), we speculate that OsHAK18 affects the pH in the apoplast and thus, among others, controls tiller emergence in the basal node, thus affecting rice architecture (Fig. 6, B and G). These findings may, in the future, render OsHAK18 a target for manipulations aimed at increasing the rice yield and K+ use efficiency in the field.
Materials and methods
Plant materials and growth conditions
Two cultivars of rice (O. sativa subsp. japonica) were used in this work, NB and ZH. For hydroponic experiments, seed sterilization and basal nutrient solution composition for seedling growth were described previously (Ai et al. 2009). Similar-size 10-d-old rice seedlings of each WT and transgenic lines were selected and transferred to International Rice Research Institute (IRRI) nutrient solution (Yoshida et al. 1976; Yang et al. 2014). For K+ starvation or depletion experiments, rice seedlings were grown in the IRRI solution containing 1 mM K+ for 4 wks and then transferred into a solution in which KH2PO4 and K2SO4 were replaced by NaH2PO4 and KCl, respectively. For salt stress experiments, 100 mM NaCl was added to the IRRI solution after 4 wks. In all treatments, the solutions were replaced every 2 d. The hydroponic experiments were carried out in a greenhouse under 16 h light/8 h dark conditions, at a temperature between 22 and 30°C and 60% to 70% relative humidity. For field experiments, rice plants were grown in paddy soil with regular fertilization during the normal growing seasons in Nanjing, China. At each harvest, the roots of all rice plants were washed in 0.1 mM CaSO4 for 5 min. Roots, stems, L.S. and L.B., brown rice, and rice hull were separated before their biomass was recorded, and concentrations of K+ and Na+ were measured as described previously (Yang et al. 2014).
Phylogenetic analysis
The unrooted phylogenetic tree of HAK/KUP/KT family in rice (OsHAK) and Arabidopsis was constructed using their amino acid sequences by the neighbor-joining algorithm within the MEGA 7 software. The reference numbers of the protein sequences used for constructing the tree are shown in Supplemental Fig. S1.
RNA extraction and transcript analysis of OsHAK18
Isolation of total RNA was extracted from roots, L.S., and L.B. of treated seedlings with RNAiso plus reagent (TaKaRa, TaKaRa Bio Inc., Dalian, China) following the manufacturer's instructions. Relative quantitative results were normalized to OsACT (accession number AB047313) and are presented here as mean normalized transcript levels obtained by the comparative cycle threshold method (2−ΔΔCt). RT-qPCR assays were performed in 20 μL reaction volumes using a QuantStudio 6 Flex Real-time PCR System (Applied Biosystems). The primers used are listed in Supplemental Table S1.
GUS staining and immunostaining analysis
The 2,000 bp DNA sequence upstream of the start codon of OsHAK18 was amplified by PCR, and the primers used are listed in Supplemental Table S2. The purified PCR product was then fused upstream of the GUSPlus reporter gene in the pCAMBIA1300-GN vector via BamHI/KpnI (Chang et al. 2019). The construct was transformed into Agrobacterium strain EHA105 by electroporation and then transformed into callus derived from mature embryos of japonica rice cultivar NB via Agrobacterium tumefaciens–mediated transformation (Jia et al. 2011). The GUS staining analysis was performed as described by Ai et al. (2009). Immunostaining analysis with an antibody against GUS was performed as described in Yamaji and Ma (2007), and sections were observed by a confocal laser scanning microscope (Leica, Wetzlar, Germany; TCS SP8X). The cell wall autofluorescence was excited by ultraviolet light with an intensity of 0.7% to 3%; the collection bandwidth and gain value were 410 to 470 nm and 30% to 60%, respectively. The collection bandwidth for Alexa Fluor 555 (the secondary antibody) was 560 to 580 nm, and the gain value was 50% to 60% (Dai et al. 2022).
Subcellular localization assay
For constructing eGFP::OsHAK18 and OsHAK18::eGFP, the OsHAK18 coding sequence (including the stop codon) was amplified by PCR using primers listed in Supplemental Table S3. The amplified cDNA was cloned into the middle vector pSAT6A-EGFP-C1 and pSAT6A-EGFP-N1. The middle vector was cut by the PI-PspI and inserted in-frame into the expression vector pRCS2-ocs-nptII. OsRac1-mCherry was used as a plasma membrane control. Transient expression of OsHAK18 in rice protoplasts was observed and photographed using sequential scanning mode of confocal microscopy (TCS SP8X, Leica, Germany). Excitation/emission wavelengths were 488 nm/498 to 540 nm for eGFP and 552 nm/600 to 640 nm for mCherry (Dai et al. 2022).
Yeast strains and culture conditions
Coding sequences of OsHAK18 and OsHAK5 were cloned into each of the expression vectors p416GPD, pDR196, and pYES2, which contain the constitutive GPD promoter, the inducible PMA promoter, and the inducible GAL1 promoter, respectively, for selection and expression in yeast (Saccharomyces cerevisiae). The primers used are listed in Supplemental Table S4. The expression vectors were transformed into the K+ uptake-deficient R5421 (MATα, Δtrk1, trk2 :: pCK64, his3, leu2, ura3, trp1, and ade2) strain (Anderson et al. 1992) and the Na+-hypersensitive G19 (MATα, his3, leu2, ura3, trp1, ade2, and Δena1::HIS3::Δena4) strain (Quintero et al. 1996) of the yeast using the LiAC/ssDNA/PEG method. The transformants were selected on SC-agar plates without uracil (SC-U). Then, an arginine and phosphoric acid (AP) medium was used for subsequent growth assays, as described previously (Horie et al. 2011). For liquid culture of G19, we collected cells at 12 h in 5 mM RbCl and 24 h in 400 mM KCl or NaCl SC-U media for Rb+, K+, and Na+ measurement (Feng et al. 2019).
Identification of oshak18 mutant lines and generation of OsHAK18–overexpressing transgenic rice
Two different Tos17 insertion lines of OsHAK18-KO mutants in the genetic backgrounds of cv. NB and cv. ZH were requested from the NIAS, Japan, and Huazhong Agricultural University, China, respectively. According to the insertional information, 2 primers for the OsHAK18 gene and primers specifically for the Tos17 vector were used to determine the Tos17 insertional sites. Homozygous plants for Tos17 insertions were identified by 2-round PCR analysis (Supplemental Table S5). Further detection of the expression levels of OsHAK18 in the homozygous mutant seedlings was via RT-PCR analysis. The primers used are listed in Supplemental Table S6.
For generating the transgenic rice lines with OX of the OsHAK18 gene, the endogenous promoter of OsHAK18 (1,958 bp sequence upstream of transcriptional start site) was used to replace the ubiquitin promoter in the expression vector pTCK303 (Ai et al. 2009), and the primers used are listed in Supplemental Table S7. Vector harboring pOsHAK18:OsHAK18 was transferred into A. tumefaciens strain EHA105 by electroporation, and the agrobacteria were used to infect callus induced from WT rice (cv. NB) as described in Tang et al. (2012). A total of 12 OsHAK18-OX transgenic lines were selected after GUS staining and PCR analysis following the protocol described by Yang et al. (2014). Three representative lines (OX1, OX2, and OX3) were used for the detailed analysis (Supplemental Fig. S4, E and F).
Measurement of K+ and Na+ concentrations in xylem sap and phloem sap
Similar-size 10-d-old rice seedlings of each WT and transgenic line were grown in the IRRI solution for 8 wks and then transferred to 1 mM or 0.1 mM K+ solutions for 3 d before the sampling. The detailed protocols for the shoot excision, the xylem sap collection by cotton ball, and the determination of K+ concentration were described previously by Yang et al. (2014). At the same time, the shoot part removed from plants during the collection of the xylem sap was put into calibrated test tubes containing 20 mL 20 mM EDTA solution (pH = 7.5 to 8.0) and placed in a dark environment with air humidity higher than 70% for 5 h to collect the phloem sap. The protocol was derived from King and Zeevaart (1974). The amounts of K+, Na+, and glutamine released in the EDTA solutions were determined by ICP-OES (Agilent 710, Agilent Technologies, USA) and Agilent 1200 HPLC coupled with Agilent G6410 mass spectra, respectively. The concentration ratio of K+ or Na+ to glutamine was used to standardize the K+ or Na+ data (Ren et al. 2005).
Detecting the effect of OsHAK18 expression level on the rice root short-term K+ acquisition
Rice K+ depletion experiments followed the previously described procedures (Nieves-Cordones et al. 2007; Rubio et al. 2008) with some modifications. Similar-size 10-d-old rice seedlings were grown in the IRRI solution containing 0.1 mM or 1 mM K+ for 4 wks and then subjected to K+ starvation for 7 d by excluding K+ from both solutions. After 7 d of K+ starvation, the roots were rinsed with a cold K+-free nutrient solution, and then, seedlings of WTs or transgenic lines were transferred to containers filled with 350 mL of solution for 0.11 mM or 1 mM K+ treatment (2 plants per container). Three mL of the solution were collected from each container at 0, 0.5, 1, 2, 4, 6, 8, and 12 h, and K+ concentration in the sample was determined by ICP-OES (Agilent 710, Agilent Technologies, USA) as described previously (Cai et al. 2012). At the end of the experiment, root fresh weight of each plant was determined. The K+ acquisition rate was calculated by taking the K+ decrease in the solution at every time point and normalizing it to the root fresh weight (g) of the corresponding individual plant (Chen et al. 2015).
Split-root experiment for assay of Rb+ circulation
Similar-size 10-d-old rice seedlings of each WT and transgenic line were grown in the IRRI solution for 6 wks. Then, the rice plants were grown individually in pots, and the roots per plant were divided almost equally into 2 plastic vessels containing a nutrient solution of 0.5 mM Rb+ (Root-Rb+) and 0.5 mM K+ (Root-K+), respectively. After 3 h, both roots were placed back into 0.5 mM K+ nutrient solution for another 3 h. The 2 root parts and the shoots were collected at 3 and 6 h, counting from the beginning of the Rb+ treatment, and their Rb+ content was measured by ICP-MS (Thermo Fisher Scientific, USA).
Measurement of soluble sugar content
Roots, stems, L.S., and L.B. of soil-grown plants were harvested at the mature stage. All samples were snap-frozen in liquid nitrogen and stored at −80°C. Soluble sugar was extracted with 80% (v/v) ethanol from an 80°C water bath. Soluble content was determined based on the method described by Leyva et al. (2008) with minor modifications using anthrone-sulfuric acid colorimetry. The anthrone reagent was prepared right before analysis by dissolving 0.1 g of anthrone (0.1% [w/v]) in 100 mL of 70% (v/v) sulfuric acid, protected from light and used within 12 h. The reaction liquid was heated and then cooled to room temperature before reading absorbance at 625 nm.
Statistical analysis
Data were analyzed by nonpaired, 2-tailed, equal-variance t test using the SPSS 21 program (SPSS Inc., Chicago, IL, USA).
Accession numbers
Sequence data from this article can be found in the GenBank/EMBL data libraries under accession numbers AK065464 (OsHAK18), AK241580 (OsHAK5), and AB047313 (OsACT)_.
Acknowledgments
We thank Prof. Yi Wang (China Agricultural University), Prof. Wenhua Zhang (Nanjing Agricultural University), and Associate Prof. Tianyuan Yang (Anhui Agricultural University) for providing the yeast mutant line and expression vector. We also thank associate Prof. Huimin Feng (Nanjing Agricultural University) and Ms. Xiaoli Dai (Nanjing Agricultural University) for their help in this work.
Author contributions
L.Y. and G.X. conceived the study and designed the experiments; L.P. conducted most of the experiments; H.X., R.L., and Y.Z. generated transgenic lines and performed part of the experiments; M.G. conducted the immunostaining assay; L.Y., G.X., and L.P. analyzed the data and together with N.M. wrote the manuscript.
Supplemental data
The following materials are available in the online version of this article.
Supplemental Figure S1. Phylogenetic tree of HAK/KUP/KT family genes in rice (OsHAK) and Arabidopsis.
Supplemental Figure S2.OsHAK18 expression and tissue localization in rice.
Supplemental Figure S3. Complementation of a yeast mutant R5421 defective in K+ uptake by OsHAK18.
Supplemental Figure S4. Homozygous Tos17 insertion mutants of OsHAK18 in rice and characterization of OsHAK18-OX transgenic rice lines in the background of the NB cultivar.
Supplemental Figure S5. Effect of OsHAK18 expression level on rice growth at the seedling stage.
Supplemental Figure S6. Effect of OsHAK18 expression level on total K+ content at the seedling stage.
Supplemental Figure S7. Effect of OsHAK18 expression level on short-term root K+ acquisition rates at different K+ supply conditions.
Supplemental Figure S8. Effect of OsHAK18 expression level on agronomic traits at reproduction.
Supplemental Figure S9. Effect of OsHAK18 expression level on the salt sensitivity of rice.
Supplemental Figure S10. Effect of OsHAK18 expression level on K+ and Na+ content in rice supplied with NaCl in the culture solution.
Supplemental Table S1. Primers used to amplify OsACT and OsHAK18 for RT-qPCR.
Supplemental Table S2. Primers used to amplify OsHAK18 promoter for tissue localization.
Supplemental Table S3. Primers used to amplify OsHAK18 cDNA for subcellular localization.
Supplemental Table S4. Primers used to amplify OsHAK18 and OsHAK5 cDNA for functional assay in yeast.
Supplemental Table S5. Primers for identification of 2 homozygous mutant lines of oshak18.
Supplemental Table S6. Primers used to amplify OsHAK18 and OsACT for RT-PCR.
Supplemental Table S7. Primers used to amplify OsHAK18 promoter and cDNA for construction of OX lines.
Funding
This work was supported by the National Key Research and Development Program of China (grant no. 2021YFF1000402) and National Natural Science Foundation of China (grant no. 31872166).
Data availability
The data that support the findings of this study are available from the corresponding authors upon reasonable request.
Dive Curated Terms
The following phenotypic, genotypic, and functional terms are of significance to the work described in this paper:
References
Author notes
The author responsible for distribution of materials integral to the findings presented in this article in accordance with the policy described in the Instructions for Authors (https://dbpia.nl.go.kr/plphys/pages/General-Instructions) is Guohua Xu ([email protected]).
Conflict of interest statement. None declared.
