


Abstract
The functions of sucrose transporters (SUTs) differ among family members. The physiological function of SUT1 has been studied intensively, while that of SUT4 in various plant species including tomato (Solanum lycopersicum) is less well-understood. In this study, we characterized the function of tomato SlSUT4 in the regulation of flowering using a combination of molecular and physiological analyses. SlSUT4 displayed transport activity for sucrose when expressed in yeast (Saccharomyces cerevisiae), and it localized at both the plasma membrane and tonoplast. SlSUT4 interacted with SlSUT1, causing partial internalization of the latter, the main phloem loader of sucrose in tomato. Silencing of SlSUT4 promoted SlSUT1 localization to the plasma membrane, contributing to increased sucrose export and thus increased sucrose level in the shoot apex, which promoted flowering. Both silencing of SlSUT4 and spraying with sucrose suppressed gibberellin biosynthesis through repression of ent-kaurene oxidase and gibberellin 20-oxidase-1 (2 genes encoding key enzymes in gibberellin biosynthesis) expression by SlMYB76, which directly bound to their promoters. Silencing of SlMYB76 promoted gibberellin biosynthesis. Our results suggest that SlSUT4 is a functional SUT in tomato; downregulation of SlSUT4 expression enhances sucrose transport to the shoot apex, which promotes flowering by inhibiting gibberellin biosynthesis.
Introduction
Appropriate flowering time is critical for the successful reproduction of plants. Flowering is regulated by both environmental and endogenous factors. The genetic pathways of flowering have been extensively characterized, especially in the model plant Arabidopsis (Arabidopsis thaliana), and these mainly include the vernalization, photoperiod, autonomous, gibberellin (GA), thermosensory, and aging pathways (Quiroz et al. 2021). In recent years, researchers have identified more flowering pathways, such as the sugar, stress, and other hormonal signals (Izawa 2021). However, the crosstalk among some of these pathways is still poorly understood.
Sugars are produced from photosynthesis, with sucrose being the primary product (Ding et al. 2019). Sucrose not only serves as a carbon and energy source but also plays a signaling role during plant growth and development (Yoon et al. 2021). Once produced, sucrose is transiently stored in vacuoles of source organs, and it is also transported from source to sink organs via the phloem (Yoon et al. 2021). The long-distance source-sink transport includes 3 steps: (i) sucrose efflux into the apoplasm from the cytosol via Sugar Will Eventually be Exported Transporters (SWEETs) (Chen et al. 2012); (ii) sucrose uptake from the apoplast into the sieve element–companion cell complex of the phloem, which is mediated by sucrose transporters (SUTs); and (iii) sucrose release from the phloem into sink cells, which is mediated by plasmodesmata or SUTs (Oner-Sieben et al. 2015). Therefore, SUTs play an important role in photoassimilate source-sink partitioning.
SUTs are transmembrane proteins belonging to the major facilitator superfamily, and they are divided into 3 groups (types I, II, and III) according to phylogenetic analysis (Reinders et al. 2012). Type I SUTs only exist in eudicots, and they are essential for some functions, such as phloem loading (Riesmeier et al. 1994) and pollen germination (Sivitz et al. 2008). Type II SUTs can be further separated into 2 subgroups: dicot-specific type IIA and monocot-specific type IIB. Monocot species have been found to use type II SUTs for phloem loading (Aoki et al. 2004; Sivitz et al. 2005; Slewinski et al. 2009). Some type IIB SUTs are involved in phloem unloading and sucrose import into sink tissues (Kühn and Grof 2010). Type III SUTs exist in all land plants, and they are localized at the tonoplast or plasma membrane or both of them (Chincinska et al. 2013, and references therein). Tonoplast-localized SUTs function in sucrose transport from the vacuole into the cytoplasm (Reinders et al. 2008), and plasma membrane-localized ones may be involved in signaling process (Chincinska et al. 2013).
SUTs are encoded by a gene family, which is usually composed of 3 to 9 members (Xu et al. 2018). In tomato (Solanum lycopersicum), there are 3 SUTs - SlSUT1 (Solyc11g017010.1.1), SlSUT2 (Solyc05g007190.2.1), and SlSUT4 (Solyc04g076960.2.1), which belong to type I, IIA, and III SUTs, respectively (Reinders et al. 2012). These SUTs are all localized in the enucleate sieve elements of tomato (Reinders et al. 2002). Using the yeast (Saccharomyces cerevisiae) two-hybrid split ubiquitin system, Reinders et al. (2002) found that all the 3 SlSUTs have a potential to interact with each other. The function of SlSUT1 in phloem loading and long-distance transport has been verified by antisense inhibition: downregulation of the SlSUT1 expression brought about inefficient phloem loading, causing delayed development of sink organs (Hackel et al. 2006). SlSUT2 has been proposed as a putative receptor of extracellular sucrose (Barker et al. 2000) and plays a role in pollen tube growth (Hackel et al. 2006). SlSUT2 also interacts with brassinosteroid to affect arbuscular mycorrhiza formation (Bitterlich et al. 2014). Relatively, the functional characteristics of SlSUT4 are less understood. Weise et al. (2000) found that SlSUT4 was predominantly expressed in sink leaves, stems, cotyledons, and immature fruits. They also observed that SlSUT4 was not functional in sucrose transport when expressed in yeasts and it was localized at the plasma membrane. However, the subcellular localization of SlSUT4 still needs to be confirmed, as differential results have been reported in different plants and even in the same species (Chincinska et al. 2013). For instance, in the Solanaceous plant potato (Solanum tuberosum), Chincinska et al. (2013) observed a dual localization of StSUT4, i.e. at plasma membrane and most possibly tonoplast as well. Therefore, the functional characteristics of SlSUT4 still remain to be investigated.
The inductive effect of sucrose on flowering has been observed in different species (Cho et al. 2018; Quiroz et al. 2021). For instance, sucrose levels in the phloem and shoot apex are usually increased at the early stage of flowering process (Pryke and Bernier 1978; Houssa et al. 1991). Sucrose addition generally enhances flowering in different plants, such as oilseed rape (Brassica campestris) (Friend et al. 1984), tobacco (Nicotiana tabacum) (Teichmanová et al. 2007), Arabidopsis (Yang et al. 2013) and chrysanthemum (Chrysanthemum morifolium “Floral Yuuka”) with a night break (Sun et al. 2017). Increasing endogenous sucrose levels through transgenic approach also promotes flowering. For example, inhibition of AGPase expression in potato leads to an accumulation of soluble sugars including sucrose and glucose in the leaves and earlier flowering (Muller-Rober et al. 1992). In tomato, expressing maize (Zea mays) sucrose phosphate synthase gene enhances sucrose accumulation in the leaves, and the plants flower earlier in CO2-elevated conditions (Micallef et al. 1995). In addition, as mentioned above, SUTs play a key role in sucrose source-sink partitioning. Therefore, modulating the expression of SUTs may alter the shoot apex sucrose level and thus flowering time, as observed in potato, where downregulation of the plasma membrane-localized StSUT4 leads to early flowering and tuberization (Chincinska et al. 2008). Although much evidence has demonstrated the role of sucrose in promoting flowering, the underlying molecular mechanism is still not well-clarified.
GA signaling is one of the early identified genetic pathways of flowering. In plants, the major bioactive GAs include GA1, GA3, GA4, and GA7 (Yamaguchi 2008). Three classes of enzymes are required for GA biosynthesis from geranylgeranyl diphosphate, i.e. terpene synthases (TPSs), cytochrome P450 monooxygenases (P450s), and 2-oxoglutarate-dependent dioxygenases (Yamaguchi 2008). Two TPSs, ent-copalyl diphosphate synthase (CPS) and ent-kaurene synthase (KS), catalyze the conversion of geranylgeranyl diphosphate to ent-kaurene, which is then converted to GA12 by two P450s, ent-kaurene oxidase (KO) and ent-kaurenoic acid oxidase (KAO) (Yamaguchi 2008). GA 20-oxidase (GA20ox) and GA 3-oxidase (GA3ox) catalyze the production of different bioactive GAs from GA12 (Yamaguchi 2008). The role of GA in regulating flowering differs with plant species. For instance, GA promotes flowering in Arabidopsis (Fukazawa et al. 2021), whereas it inhibits flowering in tomato (García-Hurtado et al. 2012; Silva et al. 2019) and apple (Malus domestica) (Zhang et al. 2016). In the GA signaling, the binding of GA with its receptor GIBBERELLIN INSENSITIVE DWARF1 (GID1) induces a conformational change of GID1, which creates a surface for binding DELLAs (Willige et al. 2007; Murase et al. 2008). The formation of GA–GID1–DELLA complex stimulates the binding of E3 ubiquitin ligase to DELLAs, resulting in DELLA degradation (Silverstone et al. 2001) and thus affecting the expression of its target genes, such as those related to flowering (Bao et al. 2020). Therefore, DELLAs play a key role in flowering regulation in the GA signaling pathway.
Accumulating evidence has demonstrated that sucrose signal interplays with the hormonal network, including GA signaling (Sakr et al. 2018; Garg and Kühn 2022). In Arabidopsis, physiological evidence indicates that sucrose-induced anthocyanin biosynthesis is inhibited by exogenous GA (Loreti et al. 2008). Further evidence has demonstrated that sucrose stabilizes DELLA proteins, which act as a positive regulator of anthocyanin biosynthesis (Li et al. 2014). These studies suggest that GA signaling is involved in sucrose signaling pathway in anthocyanin biosynthesis. However, more work is still needed to understand the roles of sucrose signaling in various physiological processes, such as flowering.
In this study, we provide evidence demonstrating that SlSUT4 is a functional SUT in tomato. We also found that downregulation of SlSUT4 expression via RNA interference (RNAi) enhances sucrose transport to the shoot apex, which promotes tomato flowering by inhibiting GA biosynthesis. The study may help us understand the function of SlSUT4 and the molecular mechanism of sucrose in promoting flowering.
Results
SlSUT4 cloning and transport activity of SlSUT4
Based on the CDS of SlSUT4 in “Heinz 1706” (Solyc04g076960.2.1), we cloned this gene from the genotype “M82” by polymerase chain reaction (PCR). The CDS of SlSUT4 is 1,503-bp-long, which encodes a protein with 500 amino acids (Supplemental Fig. S1, A and B). The CDSs of “M82” and “Heinz 1706” demonstrated base variations at 3 positions (Supplemental Fig. S1A), whereas their protein sequences showed 1 amino acid residue difference at the 480 position (Supplemental Fig. S1B). We also compared the sequences in “M82” with those in “UC82b” and observed 1 base difference, resulting in 1 amino acid residual variation at the 203 position (Supplemental Fig. S1B).
To determine whether SlSUT4 has sucrose transport activity, we expressed the gene in two yeast strains. The results showed that the SUSY7/ura3 yeast cells (a mutant that cannot synthesize invertase; Riesmeier et al. 1992) expressing SlSUT4, AtSUC2, or AtSUT4 grew better than the negative control when sucrose was used as the sole carbon source, while their growth did not differ when glucose was provided (Fig. 1, A and B). Esculin is a sucrose analog and has been used for transport activity assay of SUTs (Gora et al. 2012; Garg et al. 2022). In this study, SEY6210 yeast cells expressing SlSUT4, AtSUC2, or AtSUT4 took up more esculin than the negative control (empty vector), and the optimum pH for the uptake differed between these SUTs: between 3 and 4 for AtSUC2, and between 4 and 5 for AtSUT4 and SlSUT4 (Fig. 1, C to E). The yeast cells expressing AtSUC2 demonstrated esculin uptake at different concentrations (0.01 to 8 mM), whereas those expressing AtSUT4 and SlSUT4 showed obvious esculin uptake when the substrate concentration was 1 mM or higher (Fig. 1, F to H), suggesting that SlSUT4 and AtSUT4 had a lower affinity to esculin than AtSUC2. These results indicate that similar to AtSUC2 (Sauer and Stolz 1994) and AtSUT4 (Weise et al. 2000), SlSUT4 is a functional SUT.
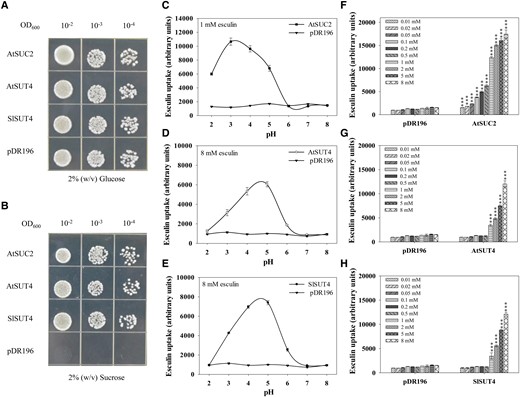
Transport activity of SlSUT4 in yeasts. A, B) Growth of sucrose uptake-deficient yeast strain SUSY7/ura3-expressing SlSUT4 with glucose (A) or sucrose (B) as the sole carbon source. C to E) The pH dependence for SUTs to uptake esculin. The transformed SEY6210 yeasts were incubated in 25 mM sodium phosphate buffer (pH 2 to 8) containing 1 or 8 mM esculin for 1 h, and the esculin fluorescence intensity was quantified with a multifunctional enzyme labeling instrument at excitation and emission wavelengths of 367 and 454 nm, respectively. F to H) Esculin uptake by SEY6210 yeasts expressing SUTs at different esculin concentrations. The transformed yeasts were incubated in 25 mM sodium phosphate buffer (pH 4) containing different esculin concentrations for 1 h, and the esculin fluorescence intensity was quantified. Data are means ± Sd (n = 3). At each esculin concentration, the uptake was compared between SlSUT4 and the empty vector using Student's t-test. Asterisks above bars indicate significant differences compared with the empty vector at the corresponding esculin concentrations. ***P < 0.001. In both growth and esculin uptake experiments, the yeasts transformed with AtSUC2 and AtSUT4 were used as positive controls and empty vector pDR196 as the negative control.
Subcellular localization of SlSUT4
To investigate the subcellular localization of SlSUT4, the GFP gene was fused to SlSUT4 and transiently expressed in Nicotiana benthamiana epidermal cells. The GFP fluorescence signal was generally weak when it was fused to the C-terminus of SlSUT4, while the signal was clear when GFP was fused to the N-terminus (Supplemental Fig. S2, A and B). Therefore, the GFP-SlSUT4 construct was used for localization analysis by co-expression with a tonoplast marker Atγ-TIP-mCherry and a plasma membrane marker myr-mCherry. The results showed that the GFP signal overlapped with mCherry signal at both plasma membrane and tonoplast (Fig. 2), indicating that SlSUT4 is a tonoplast- and plasma membrane-localized SUT.

Subcellular localization of SlSUT4 in N. benthamiana leaves. The constructs carrying Atγ-TIP-mCherry and myr-mCherry were used as tonoplast- and plasma membrane-localized markers, respectively. The vector carrying GFP only was used as a positive control. The constructs carrying GFP-SlSUT4 and the ones carrying Atγ-TIP-mCherry or myr-mCherry were transiently co-transformed into epidermal cells of N. benthamiana leaves. The fluorescence was observed under a confocal laser scanning microscope at excitation wavelengths of 488 nm for GFP and 552 nm for mCherry. mCherry is shown in magenta. The arrowheads point to transvacuolar strands. The fluorescence signal strength was analyzed with ImageJ. The white arrows indicate paths used for generating the fluorescence intensity profiles on the right.
SlSUT4-RNAi plants show early flowering
To further investigate the function of SlSUT4, we generated SlSUT4-overexpressing and RNAi silencing tomato lines (Fig. 3B). The RNAi lines demonstrated earlier flowering phenotype and had fewer leaves at the first floral bud appearance compared with the wild type (Fig. 3, A, C, and D). The tomato FALSIFLORA (FA) and MACROCALYX (MC) are the orthologs of LEAFY and APETALA1 in Arabidopsis, respectively, both of which are essential for floral meristem identity (Molinero-Rosales et al. 1999; Silva et al. 2019; Bao et al. 2020). The expression of FA and MC in SlSUT4-RNAi plants was significantly increased (Fig. 3, E and F). However, the expression of two floral integrator genes, SUPPRESSOR OF OVEREXPRESSION OF CONSTANS 1 (SOC1) or SINGLE FLOWER TRUSS (SFT, an ortholog of FLOWERING LOCUS T; Lifschitz et al. 2006; Bao et al. 2020), was not affected by SlSUT4 silencing (Fig. 3, G and H). To our surprise, the flowering time was not affected by SlSUT4 overexpression (Fig. 3, A, C, and D), nor was the expression of flowering-related genes (Fig. 3, E to H).
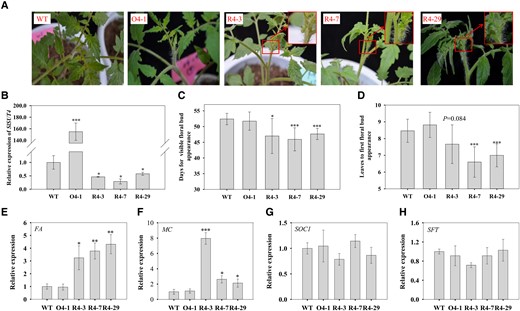
Effect of altered SlSUT4 expression on tomato flowering. A) The early flowering phenotype of SlSUT4-RNAi plants. B)SlSUT4 expression in the transgenic plants. C) Days for first floral bud appearance. D) Leaves to first floral bud appearance. E to H) Relative expressions of FA(E), MC(F), SOC1(G), and SFT(H). The gene expressions were analyzed using RT-qPCR, and actin and ubiquitin were used as internal controls. Data are means ± Sd (n = 3 to 28 for flowering time analysis and 3 for gene expression analysis). The data were subjected to Student's t-test, and asterisks above bars indicate significant differences compared with the wild type. *P < 0.05, **P < 0.01, and ***P < 0.001. WT, wild type; O, overexpression line; R, RNAi line.
Silencing SlSUT4 promotes sucrose efflux and increases soluble sugar accumulation in the shoot apex
To examine whether there was any change in the sucrose level between the SlSUT4-RNAi and wild-type plants, we analyzed the sucrose concentration in mature (source) leaves at different time of the day. At 10:00 Am (3 h under light), there was no difference in the sucrose concentration between SlSUT4-RNAi and wild-type plants (Supplemental Fig. S3A); whereas at 3:00 Pm (8 h under light) and 9:00 Pm (2 h in dark), SlSUT4-RNAi plants had higher sucrose concentration than the wild type (Supplemental Fig. S3A). In addition, silencing SlSUT4 did not change the starch concentration in leaves (Supplemental Fig. S3B). In the shoot apex (a sink tissue), the concentrations of sucrose as well as glucose and fructose in the SlSUT4-RNAi plants were significantly increased at night (Fig. 4, A to C), which were consistent with the change of sucrose concentrations in source leaves. However, overexpression of SlSUT4 did not alter the soluble sugar concentrations in the shoot apex (Fig. 4, A to C). Moreover, the sucrose export rate was significantly increased in the SlSUT4-RNAi plants (Fig. 4D). These results indicate that silencing SlSUT4 enhanced sucrose efflux from source leaves and thus increased soluble sugar accumulation in the shoot apex.
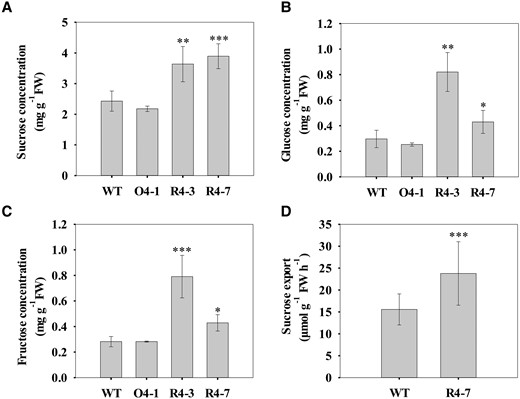
Effect of altered SlSUT4 expression on the soluble sugar concentrations in the shoot apex and sucrose efflux. A to C) Concentrations of soluble sugars in shoot apex. D) Sucrose content of phloem exudates from detached, fully expanded tomato leaves. Exudation into 20 mM EDTA (pH 7.8) was allowed for 5 h in the dark. Data are means ± Sd (n = 3 to 5 for shoot apex sugar concentration and 12 for sucrose export rate). The data were subjected to Student's t-test, and asterisks above bars indicate significant differences compared with the wild type. *P < 0.05, **P < 0.01, and ***P < 0.001. FW, fresh weight; WT, wild type; O, overexpression line; R, RNAi line.
Silencing SlSUT4 promotes SlSUT1 localization at the plasma membrane
The increase of sucrose export mediated by SlSUT4 silencing led us to investigate the expression of other SlSUT family members. SlSUT1 is a major phloem loader and plays a role in long-distance sucrose transport (Hackel et al. 2006). SlSUT2 has been proposed as a putative receptor of extracellular sucrose (Barker et al. 2000). Silencing SlSUT4 did not affect the expression of SlSUT1 or SlSUT2 (Supplemental Fig. S4, A and B), suggesting that the increase of sucrose export in the SlSUT4-RNAi lines may not be attributed to any alteration in the transcription of SlSUT1 or SlSUT2. Previously, SlSUT4–SlSUT1 interaction was found using the yeast split-ubiquitin system (Reinders et al. 2002). In this study, the effect of the interaction on subcellular targeting specificity of SlSUT1 was analyzed by co-expression of GFP-SlSUT4 and SlSUT1-mCherry in N. benthamiana epidermal cells, and the western blotting result showed that the relative proportion of SlSUT1-mCherry was decreased in the plasma membrane when SlSUT1 and SlSUT4 were co-expressed compared with that SlSUT1 was co-expressed with GFP (Fig. 5A). This result suggests that interaction of SlSUT4 and SlSUT1 decreases the targeting specificity of the latter to the plasma membrane and causes its internalization. We then analyzed SlSUT1 protein abundance in the microsomal membrane and plasma membrane in the wild-type and SlSUT4-RNAi plants. Our results showed that silencing SlSUT4 did not change SlSUT1 abundance in the microsomal membrane but increased the protein abundance in the plasma membrane (Fig. 5B), which further proved that the targeting specificity of SlSUT1 to plasma membrane was regulated by its interaction with SlSUT4. These results suggest that silencing SlSUT4 promotes SlSUT1 localization at the plasma membrane, which may have contributed to the increased sucrose export.
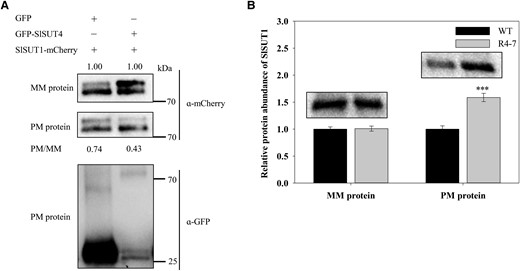
Internalization of SlSUT1. A) Partial internalization of SlSUT1 from the plasma membrane caused by co-expression of GFP-SlSUT4 and SlSUT1-mCherry in N. benthamiana leaf cells. Ten-microgram microsomal membrane proteins and 3-µg plasma membrane proteins were separated by 10% (w/v) sodium dodecyl sulfate-polyacrylamide gel electrophoresis, and western blotting analysis on mCherry and GFP was conducted with their antibodies, respectively. The numbers (0.74 and 0.43) indicate the relative quantity of SlSUT1 in plasma membrane normalized to that in microsomal membranes. These values do not represent the relative quantity of SlSUT1 in the microsomal membrane protein. B) Effect of silencing SlSUT4 on SlSUT1 protein abundance in the microsomal membrane and plasma membrane of tomato leaves. Fifty-microgram microsomal membrane proteins and 30-µg plasma membrane proteins were separated by 10% (w/v) sodium dodecyl sulfate-polyacrylamide gel electrophoresis. The SlSUT1 protein abundance was analyzed using western blotting assay with a specific antibody against SlSUT1. Data are means ± Sd (n = 3). The data were subjected to Student's t-test, and asterisks above the bar indicate a significant difference compared with the wild type. ***P < 0.001. WT, wild type; R, RNAi line; MM, microsomal membrane; PM, plasma membrane.
GA biosynthesis is suppressed by high sucrose level in the SlSUT4-RNAi plants
We noticed that the plant height and internode length were significantly decreased in the SlSUT4-RNAi plants compared with the wild type (Supplemental Fig. S5, A to C), which is similar to the low GA phenotype (Li et al. 2012). Therefore, we detected the GA concentration in the shoot apex of both plants. GA1, GA3, and GA4 are major active GAs in tomato (Chen et al. 2016). Our results showed that the concentrations of GAs, especially GA1 and GA4, were obviously decreased in the SlSUT4-RNAi plants (Fig. 6A). The expression of the main GA biosynthetic genes, including SlGA20ox1 (Solyc03g006880.1.1), SlGA20ox3 (Solyc11g072310.1.1), SlGA3ox1 (Solyc06g066820.4.1), and SlKO (Solyc04g083160.1) (Mignolli et al. 2015), was also significantly decreased in the SlSUT4-RNAi plants (Fig. 6, B and C). Besides, the expression of PRO/DELLA, which activates FA/LFY and MC/AP1 to control flowering in tomato (Silva et al. 2019), was higher in the SlSUT4-RNAi plants than the wild type (Fig. 6D). These results imply that silencing SlSUT4-induced increase in shoot apex sucrose level inhibited GA biosynthesis and thus promoted tomato flowering.
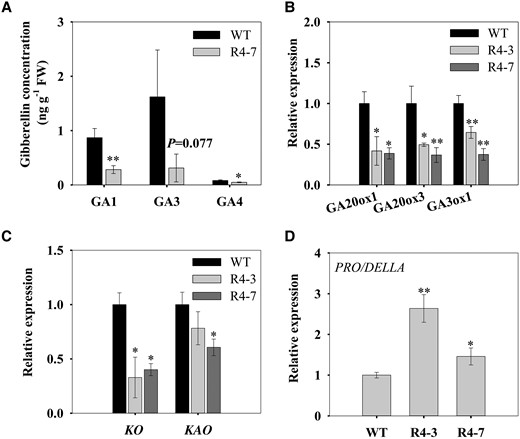
Effect of silencing SlSUT4 on GA synthesis and signaling. A) Shoot apex GA concentration. B, C) Expression of GA biosynthetic genes. D) Expression of PRO/DELLA—a central repressor of GA signaling. The gene expression was analyzed by RT-qPCR, and actin and ubiquitin were used as internal controls. Data are means ± Sd (n = 3). The data were subjected to Student's t-test, and asterisks above bars indicate significant differences compared with the wild type. *P < 0.05 and **P < 0.01. WT, wild type; R, RNAi line; GA, gibberellin; FW, fresh weight.
To confirm the regulatory role of sucrose on flowering and GA biosynthesis, we treated the wild-type tomato seedlings with exogenous sucrose and GA. The results showed that in contrast to the effect of GA, sucrose treatment decreased the plant height and promoted tomato flowering (Fig. 7, A and B). The expression of FA/LFY and MC/AP1 as well as PRO/DELLA was decreased by GA treatment, but all increased after sucrose treatment (Fig. 7, C to E). Sucrose treatment decreased the expression of SlGA20ox1, SlGA20ox3, SlKO, and SlKAO (Solyc08g007050.2.1) (Fig. 7, F and G) and the levels of GAs, especially GA1 and GA4 (Fig. 7H). These results suggest that sucrose can inhibit GA biosynthesis and thus GA signaling.
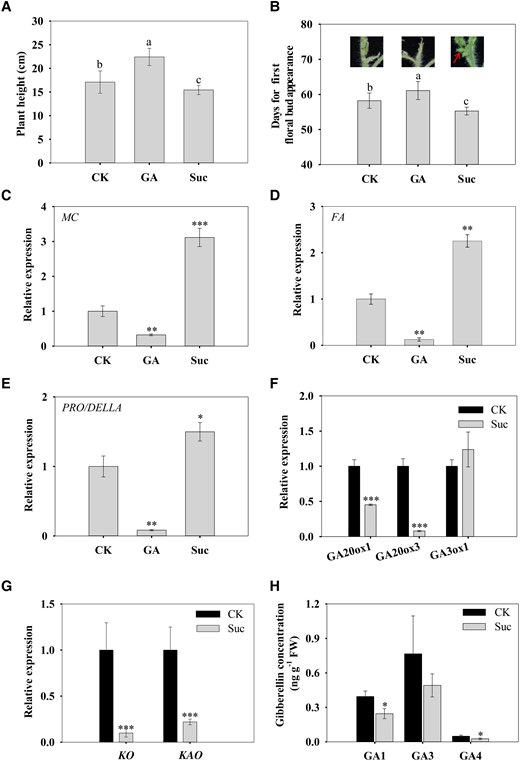
Effect of exogenous sucrose and GA on tomato flowering. A) Plant height. B) Days for first floral bud appearance after GA or sucrose treatment. The upper photograph shows the tomato shoot apex. C to E) Expression of MC, FA, and PRO/DELLA in shoot apex. The gene expression was analyzed by RT-qPCR, and actin and ubiquitin were used as internal controls. F, G) Expression of GA biosynthetic genes. H) Shoot apex GA concentration. Data are means ± Sd (n = 9 to 11 for flowering time and plant height analysis and 3 for gene expression and GA analysis). Different letters above bars indicate significant differences between treatments at P < 0.05 (A, B). Asterisks above bars indicate significant differences compared with the control using Student's t-test (C to H). *P < 0.05, **P < 0.01, and ***P < 0.001. CK, control; GA, gibberellin; Suc, sucrose.
A sucrose-induced R2R3 MYB transcription factor SlMYB76 directly binds to the promoters of SlKO and SlGA20ox1 and represses their expression
Given that both silencing SlSUT4 and exogenous sucrose treatment inhibited SlGA20ox1 and SlKO expressions, we analyzed the promoter sequences of these two genes. The results showed that the promoters contain several MYB-binding sites (Supplemental Fig. S6). Transcriptome analysis on the wild-type and SlSUT4-RNAi plants demonstrated differential expressions of some MYB transcription factor genes, among which the expression of a R2R3 MYB gene SlMYB76 was increased in the SlSUT4-silenced plants. Reverse transcription quantitative PCR (RT-qPCR) analysis confirmed the result (Fig. 8A). Moreover, the expression of this gene was also increased by sucrose treatment (Fig. 8B). When analyzing the promoter of SlMYB76, we found a potential cis-acting element - sucrose response element (SURE) box (Fig. 8C). To verify whether the element was functional, we conducted transient expression assay in N. benthamiana leaves with a GUS reporter gene driven by tandem repeats of the SURE box (Fig. 8D). The result showed that the expression of GUS in 4 × SURE-box infiltrated leaves was induced by exogenous sucrose, implying the involvement of this cis-acting element in sucrose-induced SlMYB76 expression (Fig. 8E).
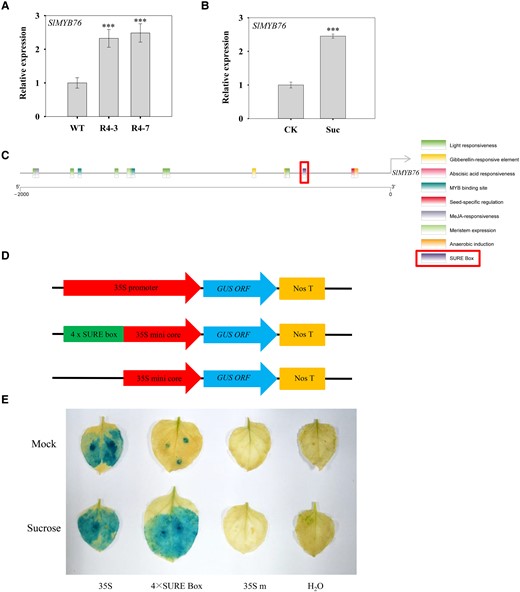
Expression of MYB transcription factor SlMYB76 and response of the cis-acting element SURE box to sucrose. A)SlMYB76 expression in SlSUT4-silenced plants. B) Effect of exogenous sucrose on SlMYB76 expression. The gene expression was analyzed by RT-qPCR, and actin and ubiquitin were used as internal controls. Data are means ± Sd (n = 3). The data were subjected to Student's t-test, and asterisks above bars indicate significant differences compared with the wild type (A) or control (B). ***P < 0.001. WT, wild type; R, RNAi line; CK, control; Suc, sucrose. C)Cis-acting elements in SlMYB76 promoter. The promoter sequence was obtained from the Solanaceae Genomics Network (https://solgenomics.net/), analyzed in PlantCARE (http://bioinformatics.psb.ugent.be/webtools/plantcare/html/), and visualized using TBtools (https://github.com/CJ-Chen/TBtools/releases). D) Schematic representation of vector structure used in transient GUS expression assay. The 46-bp core fragment of CaMV 35S promoter was used as a minimal promoter to replace the 35S promoter of pBI121 and to control the GUS expression as the background. E) Effect of SURE in SlMYB76 promoter on GUS expression activity in N. benthamiana leaves. The 35S promoter-driven vector was used as a positive control, H2O as a negative control, and 35S mini core-driven vector as the background. SURE, sucrose response element.
Next, we examined whether SlMYB76 could directly bind the promoters of SlKO and SlGA20ox1. Our result of yeast one-hybrid (Y1H) assay preliminarily proved the interactions (Fig. 9, A and B). Meanwhile, dual-luciferase assay showed that co-expression of SlMYB76 inhibited the expression of the SlKO and SlGA20ox1 pro-LUC reporter genes compared with the empty vector (Fig. 9, C and D). Furthermore, the electrophoretic mobility shift assay (EMSA) result also demonstrated that SlMYB76 bound the promoters of SlKO and SlGA20ox1 in vitro (Fig. 9, E and F). In addition, the interaction was also confirmed by chromatin immunoprecipitation qPCR (ChIP-qPCR) (Fig. 9, G and H).
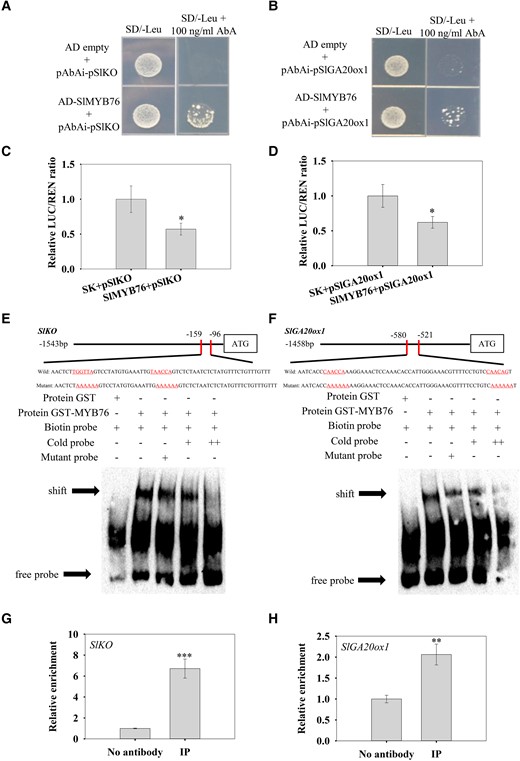
Verification of the interaction between SlMYB76 and the promoters of SlKO and SlGA20ox1. A, B) Yeast one-hybrid assay verifying the interaction between SlMYB76 and the promoters of SlKO(A) and SlGA20ox1(B). C, D) Dual-luciferase assay showing that the co-expression of SlMYB76 inhibited the expression of SlKO and SlGA20ox1 pro-LUC reporter genes. The ratio of LUC to REN in the empty vector plus promoter was used as a calibrator (set as 1). The data were subjected to Student's t-test, and asterisks above bars indicate significant differences. *P < 0.05. Data are means ± Sd (n = 3). E, F) EMSAs showing that SlMYB76 bound to the promoter of SlKO and SlGA20ox1 in vitro. The GST-SlMYB76 fusion protein was incubated with biotin-labeled probe, cold probe, and mutant probe, respectively. The GST protein incubated with biotin-labeled probe served as a negative control. − indicates absence. + indicates presence. ++ indicates increasing amounts of unlabeled probes for competition. The shifted bands are indicated by arrows. G, H) ChIP-qPCR analysis of SlMYB76 binding to the promoter of SlKO and SlGA20ox1. No antibody served as negative controls. Data are means ± Sd (n = 3). The data were subjected to Student's t-test, and asterisks above bars indicate significant differences compared with the control. **P < 0.01 and ***P < 0.001.
To further verify the function of SlMYB76, we performed virus-induced gene silencing (VIGS) on tomato plants. The results showed that the VIGS-silenced plants had higher plant height (Fig. 10, A and B) and the SlMYB76 expression was reduced by 90% (Fig. 10C), suggesting that VIGS was effective in silencing SlMYB76 expression. The downregulation of SlMYB76 expression significantly upregulated the SlKO and SlGA20ox1 expression as well as the GA levels in the shoot apex (Fig. 10, D to F). These results indicate that sucrose-induced SlMYB76 negatively regulates GA biosynthesis through a direct binding to the promoters of SlKO and SlGA20ox1 to repress their expressions.
![Effect of transient silencing SlMYB76 on GA biosynthesis in tomato. A) Plant growth phenotype. B) Plant height. C to E) Expression of SlMYB76, SlKO, and SlGA20ox1. The gene expression was analyzed by RT-qPCR, and actin and ubiquitin were used as internal controls. F) Shoot apex GA concentration. Data are means ± Sd [n = 5 to 7 for plant height (B) and 3 for gene expression and GA analysis (C to F)]. The data were subjected to Student's t-test, and asterisks above bars indicate significant differences compared with the control (empty vector). *P < 0.05 and ***P < 0.001. FW, fresh weight.](https://oup.silverchair-cdn.com/oup/backfile/Content_public/Journal/plphys/192/2/10.1093_plphys_kiad162/2/m_kiad162f10.jpeg?Expires=1747913373&Signature=Kh0-mggp02jG6Cmf7irQ0RyKEF6gzM2x88WNFYihxarzKzIKBjJ5xxD09EZIdEJJsKFwKyy1J3Pnq3betn4YzqIHFVggtAg6QjIscjQlf0GwTDvYYM77l6WeB6vJA8EpPEDqaLFhk7lgBiZ58kT2QzRlpBbOywWhI5xhV1YWE0DOXldPCZ7bCe103VZ0Jr8o-cs-kNXGE56jgHPdjQV75GJC6ZDX3NkJZrknzha9ieghoCMszQ2MX8hIsg1C3J8KnO2fDGs1y6B1M6B3XdB4sVXfYzc3-TAcpYIu6f14dMK6Wo0Qfz0wg62ZlhJhUAb~gNAIeR22IjXVa7rFFCQPyQ__&Key-Pair-Id=APKAIE5G5CRDK6RD3PGA)
Effect of transient silencing SlMYB76 on GA biosynthesis in tomato. A) Plant growth phenotype. B) Plant height. C to E) Expression of SlMYB76, SlKO, and SlGA20ox1. The gene expression was analyzed by RT-qPCR, and actin and ubiquitin were used as internal controls. F) Shoot apex GA concentration. Data are means ± Sd [n = 5 to 7 for plant height (B) and 3 for gene expression and GA analysis (C to F)]. The data were subjected to Student's t-test, and asterisks above bars indicate significant differences compared with the control (empty vector). *P < 0.05 and ***P < 0.001. FW, fresh weight.
Discussion
SlSUT4 is a functional SUT in tomato
SUTs are involved in cellular H+-coupled sucrose transport (Williams et al. 2000). The functions of SUTs differ among the family members. The physiological function of SUT1 has been intensively studied, while that of SUT4 was less understood in many plant species including tomato. In this study, we found that the expression of SlSUT4, AtSUC2, or AtSUT4 could rescue the invertase-deficient SUSY7/ura3 yeast cells to normal growth (Fig. 1, A and B), and SEY6210 yeast cells expressing either of these genes could take up esculin, an analog of sucrose (Fig. 1, C to H), suggesting the functionality of SlSUT4 in sucrose transport. Weise et al. (2000) previously reported that SlSUT4 was not functional in sucrose transport when expressed in yeasts, whereas we have provided convincing evidence here showing that SlSUT4 acts as a functional SUT in tomato, like AtSUC2 (Sauer and Stolz 1994) and AtSUT4 (Weise et al. 2000) in Arabidopsis. The reason for this inconsistency is unknown. Different tomato genotypes were used in the two studies - “UC82b” in Weise et al. (2000) and “M82” in this study, and there is one amino acid difference at the position of 203 - proline in “M82” and leucine in “UC82b” (Supplemental Fig. S1B). However, 3D structure prediction did not show an obvious difference in the topological structure between the two proteins (Supplemental Fig. S7). The importance of this amino acid for sucrose transport activity needs to be investigated in future.
The results for subcellular localization of SUT4-type transporters have been mixed in different plants and even in the same plant species, with most of the members being reported to possess at least two different compartments (Chincinska et al. 2013). For SlSUT4 from tomato, Weise et al. (2000) reported its localization at the plasma membrane. Here, we observed that the fluorescence signal of SlSUT4-GFP was not as clear as that of GFP-SlSUT4. This may be due to the trapping of the former fusion protein with the secretory machinery membranes (Romsicki et al. 2004). Therefore, we used the GFP-SlSUT4 construct for the localization. With the introduction of corresponding markers, our results confirmed that SlSUT4 was localized at both plasma membrane and tonoplast (Fig. 2). The plasma membrane localization of SlSUT4 was also supported by the data from the sucrose transport experiments in yeasts (Fig. 1, B, E, and H), where plasma membrane localization is a prerequisite for the entry of sucrose. The importance of the dual targeting of SUT4 in tomato as well as in potato is unknown and needs to be elucidated in future.
Silencing SlSUT4 promotes sucrose transport to the shoot apex by enhancing SlSUT1 targeting on the plasma membrane
In this study, we observed that silencing SlSUT4 promoted tomato flowering (Fig. 3, A to D), which corresponded with the increased sucrose efflux rate from source leaves and higher levels of soluble sugars in the shoot apex (Fig. 4, A to D). These results are consistent with those observed in potato (Chincinska et al. 2008). However, the reason for the increase of sucrose transport to the shoot apex of SUT4-silenced plants is unknown. SUT1, which is localized at the plasma membrane, is the most critical SUT for sucrose efflux from source leaves (Chincinska et al. 2008), and its activity can be regulated at transcriptional and posttranscriptional levels. Here, transcriptional regulation of SlSUT1 by SlSUT4 is unlikely, since silencing SlSUT4 did not affect the SlSUT1 expression (Supplemental Fig. S5A). Protein–protein interaction and oligomerization are two of the posttranscriptional regulation modes of SUTs (Garg et al. 2020). Oligomer formation can affect the subcellular targeting of SUTs, with differential responses among individuals (Garg et al. 2020; Garg and Kühn 2022). For example, both homodimer formation and heterodimer formation of potato StSUT1 increase its internalization, whereas the homodimers of SlSUT2 or its heteromeric complex with v-SNARE/VAMP711 increase plasma membrane targeting of SlSUT2. Previously, the yeast two-hybrid technique has shown that SlSUT4 can interact with SlSUT1 (Reinders et al. 2002). It is possible that SlSUT1–SlSUT4 heterodimer can form in the cells. In this study, co-expression of SlSUT1 and SlSUT4 in N. benthamiana leaves caused partial internalization of SlSUT1 from the plasma membrane (Fig. 5A), and the SlSUT1 protein proportion in the plasma membrane was increased in the SlSUT4-RNAi plants (Fig. 5B). These results may indicate that heterodimer formation of SlSUT1 and SlSUT4 increases internalization of SlSUT1, while in the SlSUT4-RNAi plants, the decreased level of SlSUT4 protein promoted SlSUT1 localizing at the plasma membrane and thus increased sucrose efflux, which contributed to the increased shoot apex sucrose level. Previous researchers have found that transgenic tobacco plants overexpressing spinach SoSUT1 demonstrated early flowering and lack of shade avoidance response phenotypes (Liesche et al. 2011), exactly as described for StSUT4-silenced potato plants (Chincinska et al. 2008). The lack of shade avoidance response in StSUT4-RNAi plants seems to be due to the far-red light sensitivity of StSUT4 mRNA stability (Liesche et al. 2011). This evidence also supports the idea that SUT4 acts as an inhibitor of SUT1. In addition, in this study, 2 SlSUT1-mCherry bands were recognized by the mCherry antibody (Fig. 5A). This could be caused by posttranscriptional regulation, such as phosphorylation modification, which can increase the molecular weight of SUT1, as has been observed in Arabidopsis SUT SUC2 (Xu et al. 2020).
Sucrose induces SlMYB76 expression to suppress GA biosynthesis
Although sucrose has been known to induce flowering in different plants (Cho et al. 2018; Quiroz et al. 2021), the molecular mechanism is still not very clear. Garg et al. (2021) found that miR172 is involved in the flowering induction of potato plants in a sucrose-dependent manner, and it seems to be a downstream signaling component of StSUT4 in regulating flowering. Recently, Garg et al. (2022) published the protein interaction partners of StSUT4 in potato, and it is interesting to note that StSUT4 can physically interact with the ethylene receptor ETR2. Haydon et al. (2017) found that sucrose together with ethylene can regulate the protein stability of GIGANTEA, which gates GA signaling through stabilizing DELLA (Nohales and Kay 2019). Therefore, both sucrose and SUT may regulate flowering through the GA pathway. In potato, Chincinska et al. (2008) found that the expression of GA20ox1 was decreased in the StSUT4-RNAi plants compared with the wild type, implying the possibility of the effect of SUT4 expression or sucrose on GA biosynthesis. In this study, silencing SlSUT4-induced increase of shoot apex sucrose level (Fig. 4A) corresponded with the decreased GA level and expression of genes encoding GA biosynthesis enzymes (Fig. 6, A to C). Moreover, exogenous sucrose treatment experiment further confirmed the inhibitory role of sucrose on GA biosynthesis (Fig. 7, F to H). These results suggest that sucrose induced tomato flowering by inhibiting GA biosynthesis.
A new question then arises - how sucrose inhibited the GA biosynthesis? In this study, we found that the transcription factor SlMYB76 expression was increased in the SlSUT4-RNAi plants and by sucrose spraying (Fig. 8, A and B). Promoter analysis on SlMYB76 showed that it has a SURE box (Fig. 8C), and GUS expression driven by this element demonstrated its responsiveness to sucrose (Fig. 8, D and E). Moreover, SlMYB76 negatively regulated the expressions of SlKO and SlGA20ox1 (Fig. 9, C and D), which encode the key enzymes in GA biosynthesis, by directly binding to their promoters (Fig. 9, A to H). The regulatory role of SlMYB76 on GA biosynthesis was further confirmed in the SlMYB76-silenced plants (Fig. 10, A to F). These results indicate that sucrose inhibited GA biosynthesis by inducing the expression of SlMYB76, a negative regulator of the expression of GA biosynthesis enzyme genes.
Up to date, family members of some types of transcription factors that regulate GA metabolism have been identified, such as OFP (Wang et al. 2007), DAG (Gabriele et al. 2010), KNOX, MADS-box, bHLH, TCP, and IDD/GAF (Hedden 2020). In tomato, several relevant transcription factors have also been identified. Li et al. (2012) reported that SlDREB binds to the promoter of SlCPS to repress its expression and thus downregulates GA biosynthesis. Chen et al. (2020) observed that SlbHLH95 represses the expression of SlGA20ox2 and SlKS5 by binding to their promoters. Wang et al. (2019) found that SlHY5 binds to the promoter of GA inactivation enzyme gene SlGA2ox4. Recently, Su et al. (2022) reported that SlBES1.8 targets the promoters of two GA inactivation enzyme genes, SlGA2ox2 and SlGA2ox6. In Arabidopsis, Qi et al. (2021) found that AtMYB62 can also bind to the promoter of GA inactivation enzyme gene AtGA2ox7. However, few reports are available on the regulation of MYB transcription factor on GA biosynthesis genes. In this study, we demonstrated that SlMYB76 directly targeted the promoters of SlGA20ox1 and SlKO, which will help us understand the regulatory mechanism of GA biosynthesis.
In conclusion, SlSUT4 is a functional SUT at the plasma membrane and tonoplast in tomato. Downregulation of SlSUT4 expression enhances sucrose transport to the shoot apex, which promotes tomato flowering. Sucrose-induced early flowering is attributed to the repression of GA biosynthesis. This study will help us understand the function of SlSUT4 and the molecular mechanism of sucrose in promoting flowering.
Materials and methods
Cloning of SlSUT4
Preparation of 3-leaf tomato (S. lycopersicum cv. M82) plants, and leaf RNA extraction and cDNA synthesis were as described in Jia et al. (2020). To obtain the CDS of SlSUT4, a pair of primers was designed (Supplemental Table S1) based on the CDS in tomato reference genome database (Solyc04g076960.2.1). PCR was performed with Primerstar max polymerase (Takara, Kusatsu, Japan). A product of 1503 bp was obtained, cloned into pGEM-T Easy vector (Promega, Madison, WI) and sequenced by Sangon Biotech (Shanghai, China). The nucleotide acid and protein sequences of SlSUT4 from different genotypes were aligned with DNAMAN v.6 (Lynnon Biosoft, CA, USA).
Transport activity of SlSUT4
The CDS of SlSUT4, AtSUC2, and AtSUT4 was respectively cloned into vector pDR196 at the SmaI and EcoRI sites. The primers used were listed in Supplemental Table S1. Drop test assay of yeast SUSY7/ura3 mutant was performed according to Wang et al. (2020). Uptake experiment of esculin (a sucrose analog, Wang et al. 2020) by SEY6210 yeast (S. cerevisiae) strain was performed according to Gora et al. (2012) and Garg et al. (2022). The esculin fluorescence was quantified on a Tecan Infinite M200pro full-wavelength multifunctional enzyme labeling instrument (TECAN, Hombrechtikon, Switzerland) with excitation and emission wavelengths of 367 and 454 nm, respectively.
Subcellular localization of SlSUT4
The CDS of SlSUT4 without stop codon was cloned into pART27-GFP at the XhoI and HindIII sites to generate SlSUT4-GFP construct and at the EcoRI and KpnI sites to generate GFP-SlSUT4 construct. The CDS of γ-tonoplast intrinsic protein (TIP; AT2G36830) without stop codon was amplified from Arabidopsis (A. thaliana) “Col-0” and cloned into pCAMBIA1301-mCherry at the XbaI and KpnI sites to generate Atγ-TIP-mCherry construct as a tonoplast marker (Saito et al. 2002). The myr-mCherry (a myristoylation site fused to the N-terminus of mCherry) was used as a plasma membrane marker (Du et al. 2021). The primers used were listed in Supplemental Table S1. The plasmids were transferred into Agrobacterium tumefaciens GV3101 using the freeze–thaw method (Dityatkin et al. 1972). Transient transformation in epidermal cells of N. benthamiana leaves was performed according to Champouret et al. (2009). The fluorescence was observed under a confocal laser scanning microscope (LEICA TCS SP8, Germany) with a 40×/1.4 water immersion objective. GFP excitation was performed using a 488-nm solid-state laser, and the intensity and gain were 4.9% and 800, respectively. The GFP fluorescence was detected at 498 to 540 nm. mCherry excitation was performed using a 552-nm solid-state laser, and the intensity and gain were 5% and 800, respectively. The mCherry fluorescence was detected at 590 to 640 nm. The images were postprocessed using the Leica LAS X software (Version 3.7.2). The fluorescence signal strength was generated by analyzing the gray value using ImageJ software.
Generation of SlSUT4-overexpressing and -RNAi transgenic tomato lines, growth phenotype and gene expression
The CDS of SlSUT4 was amplified from tomato “M82” and cloned into pMBP-1 at the BamHI and KpnI sites to construct the overexpression vector. SlSUT4-RNAi plasmid was constructed according to Song et al. (2013). The primers used were listed in Supplemental Table S1. The constructs were transferred into A. tumefaciens GV3101 as described above. Tomato genetic transformation was conducted following the method of Park et al. (2003), except that 2 mg L−1 zeatin was added in the preculture medium instead of 6-benzyl-aminopurine and α-naphthalene acetic acid. The transgenic plants were genotyped by PCR for examining the presence of vector with specific primers (Supplemental Table S1), and the PCR products were sequenced by Sangon Biotech (Shanghai, China). The transgenic plants were grown in a greenhouse of Northwest A&F University to harvest seeds.
The 3-leaf plants of T2 generation transgenic lines and wild type were prepared according to Jia et al. (2020), and they were then transplanted in pots filled with a mixed substrate (peat:vermiculite:perlite = 2:1:1; Tianfeng, Shandong, China). When the first floral bud appeared, the days from germination and leaf number were recorded. The second fully expanded leaves (from the top) were harvested at 10:00 Am, 3:00 Pm, and 9:00 Pm, and shoot apexes were collected at 9:00 Pm on the 45-d-old seedlings. The expressions of SlSUT4 and flowering-related genes were analyzed by RT-qPCR. The RNA extraction and the first strand cDNA synthesis were performed according to Jia et al. (2020). The RT-qPCR was conducted using ChamQ SYBR qPCR Master Mix (711-1, Vazyme, Nanjing, China) with specific primers (Supplemental Table S2) on a QuantStudio 5 Real-Time PCR System (ABI, Carlsbad, CA). Actin (Solyc03g078400.3.1) and ubiquitin (Solyc01g068045.1.1) were used as internal controls (Sang et al. 2017). The gene expression was calculated using the 2−ΔΔCt method (Pfaffl 2001). The plant height and the second internode length (from the bottom) were measured on the 64-d-old seedlings.
Measurement of sugar concentration and sucrose export
Soluble sugars in the leaves and shoot apex were extracted according to Xu et al. (2018) and determined with an ion chromatograph equipped with integrated pulse amperometric detector (ICS-5000+, Thermo Fisher, CA, USA). CarboPac PA1 chromatographic column (4 × 250 mm i.d., 10 µm) was used as the separation column, and 2 M NaOH was used as the mobile phase at 1 ml min−1. The soluble sugar concentrations were calculated by the peak area normalizing method using Chromeleon 7 software (Thermo Fisher, CA, USA). The residue left after soluble sugar extraction was used for starch extraction and determination according to Lin et al. (1988). The export rate of sucrose was analyzed using the EDTA-facilitated exudation method (Xu et al. 2018).
Co-expression of SlSUT1 and SlSUT4 in N. benthamiana leaves and western blotting analysis
The CDS of SlSUT1 without stop codon was cloned into pART27-mCherry at the XhoI and HindIII sites to generate SlSUT1-mCherry construct. The primers used were listed in Supplemental Table S1. This vector and the GFP-SlSUT4 vector constructed for the subcellular localization were transferred into A. tumefaciens GV3101 individually, and transient expression in N. benthamiana leaf epidermal cells was performed according to Champouret et al. (2009).
The infiltrated N. benthamiana leaves were harvested for membrane protein extraction and western blotting analysis. Microsomal membrane and plasma membrane proteins were prepared using isolation kits (BB-3152 and BB-3155; BestBio, Shanghai, China). Ten-microgram microsomal membrane proteins and 3-µg plasma membrane proteins were separated by 10% (w/v) sodium dodecyl sulfate-polyacrylamide gel, and western blotting analysis on mCherry and GFP was followed the procedures of Du et al. (2021). The specific anti-GFP antibody (ABclonal, Wuhan, China) or anti-mCherry antibody (Proteintech, Wuhan, China) was added into the blocking buffer at 1:2,000 dilution, and the secondary antibody (HRP-conjugated goat anti-rabbit IgG antibody, HS101-01, TransGen, Beijing, China) was diluted at 1:5,000. The protein bands were detected using an Immobilon western blotting kit (Millipore, MA, USA) and visualized on ChemiDoc MP (Bio-Rad, CA, USA). The band of SlSUT1-mCherry protein was quantified with the ImageJ software.
Analysis of SlSUT1 protein abundance in wild-type and SlSUT4-RNAi plants
Five-leaf-old wild-type and SlSUT4-RNAi plants were harvested for membrane protein extraction. Microsomal membrane and plasma membrane proteins were extracted according to Gupta et al. (2020). Fifty-microgram microsomal membrane proteins and 30-µg plasma membrane proteins were separated by 10% (w/v) sodium dodecyl sulfate-polyacrylamide gel, and the SlSUT1 protein abundance was analyzed using western blotting assay with a specific antibody against SlSUT1 (Hackel et al. 2006; Xu et al. 2018).
GA concentration analysis
GAs in the shoot apex tissue were extracted following the method of Cong et al. (2020), and the concentrations were determined by HPLC–MS/MS (AB SCIEX Triple TOF 5600+, MA, USA).
Exogenous GA and sucrose treatment
At-2-leaf stage, the tomato “M82” plants were applied with GA (10 µ M GA3) by watering or sucrose (50 mM) by spraying the shoot apex. The treatment was applied every other day for 2 wk. The used GA and sucrose concentrations were referred to Sun et al. (2017) and Silva et al. (2019). The days taken for the first floral bud appearance were recorded, and the plant height was measured. After 6 h or 2 wk of treatments, the shoot apex was collected for analysis of gene expression and GA concentration, respectively, using the methods as described above.
Promoter analysis of SlKO and SlGA20ox1
The promoter sequences of SlKO and SlGA20ox1 were obtained from the Solanaceae Genomics Network (https://solgenomics.net/), analyzed in PlantCARE (http://bioinformatics.psb.ugent.be/webtools/plantcare/html/), and visualized using TBtools (https://github.com/CJ-Chen/TBtools/releases).
Histochemical GUS activity assay
To test the response of SURE box (AAAAAATAA) in the promoter of SlMYB76 to sucrose, the CaMV 35S promoter of pBI121 was replaced with the 35S minimal promoter fragment driven by 4×SURE box at the HindIII and BamHI sites with primers listed in Supplemental Table S1. The 46-bp core fragment of 35S promoter alone was used to check the background expression of GUS. The plasmids were transferred into A. tumefaciens GV3101 and transient expression in N. benthamiana epidermal cells was conducted as described above. After 4 d, the infiltrated leaves were incubated in 6% (w/v) sucrose or water for 16 h, followed by an incubation in GUS reaction buffer (1 mM 5-bromo-4-chloro-3-indolyl-beta-d-glucuronide acid, 100 mM phosphate buffer, pH 7.0, 5 mM K3[Fe(CN)6], 5 mM K4[Fe(CN)6], and 10 mM EDTA) for 16 h at 37°C. The leaf chlorophyll was removed through rinses in a series of ethanol before being photographed.
Interaction analysis between SlMYB76 and both SlKO and SlGA20ox1
Y1H assay was performed according to the protocol for the Matchmaker Gold Yeast One Hybrid System (Clontech, CA, USA). The CDS of SlMYB76 was cloned into pGADT7 at the NdeI and EcoRI sites to construct AD-prey vector. To construct baits, the 1,543-bp promoter fragment of SlKO and 1,458-bp promoter fragment of SlGA20ox1 were respectively cloned into pAbAi at the KpnI and XhoI sites. The primers used were listed in Supplemental Table S1. The bait plasmids were linearized and transformed into the Y1HGold yeast strain. The minimal inhibitory concentration of aureobasidin A (AbA) was screened to avoid self-activation. The AD-prey vector was transformed into the bait yeast strain, which was then grown on synthetic dextrose medium lacking leucine (SD/–Leu) with or without 100 ng ml−1 AbA at 30°C for 3 d and photographed.
For dual-luciferase reporter assay, the CDS of SlMYB76 was cloned into the pGreenII 62-SK vector at the HindIII and BamHI sites to act as an effector, and the promoters of SlKO (1,543-bp) and SlGA20ox1 (1,458-bp) were cloned into pGreenII 0800-LUC at the HindIII and BamHI sites to serve as reporter genes. The primers used were listed in Supplemental Table S1. The plasmids and pSoup helper were transferred into A. tumefaciens GV3101, and transient expression in N. benthamiana leaf epidermal cells was as described above. After 2 d, the activities of LUC and REN luciferase were measured using the Dual-Luciferase Assay Kit (TransGen, Beijing, China) on a Tecan Infinite M200pro full-wavelength multifunctional enzyme labeling instrument (TECAN, Hombrechtikon, Switzerland).
For EMSA, the CDS of SlMYB76 was cloned into pGEX-6P-1 at the SalI and BamHI sites, which contains a glutathione-S-transferase (GST) tag. The primers used were listed in Supplemental Table S1. The recombinant plasmid was transferred into the Escherichia coli strain BL21 (DE3) to obtain SlMYB76-GST fusion protein, which was purified using the GST-tagged protein purification kit (Beyotime, Shanghai, China). The probes were labeled with an EMSA probe biotin-labeling kit (Beyotime, Shanghai, China), and the EMSA reaction was performed using the Chemiluminescent EMSA Kit (Beyotime, Shanghai, China) according to the protocol from the manufacturer. The unlabeled probes and mutated probes were used as competitor and negative controls, respectively. The bands were detected on a ChemiDoc MP system (Bio-Rad, CA, USA).
For ChIP-qPCR analysis, about 3-g leaf samples from 35S:SlMYB76-GFP-expressed plants (see “Overexpression of SlMYB76 in tomato” section) were collected and fixed in 1% (v/v) formaldehyde for 20 min under vacuum, after which they were sonicated to obtain DNA with an average length of 500 to 1,000 bp. The SlMYB76 cross-linked DNA was purified using a ChIP Assay Kit (Beyotime, Shanghai, China). No antibody was used as a negative control, and a fragment of actin (Solyc03g078400.3.1) was amplified as an internal control. The enrichment of DNA regions was analyzed by quantitative real-time PCR using specific primers (Supplemental Table S2).
Overexpression of SlMYB76 in tomato
The CDS of SlMYB76 without stop codon was cloned into pART27-GFP at the XhoI and HindIII sites to generate SlMYB76-GFP construct, which was then transferred into A. tumefaciens GV3101. Tomato genetic transformation and genotyping were described above.
VIGS of SlMYB76 in tomato
For VIGS of SlMYB76 in tomato, a 300-bp CDS fragment of SlMYB76 was inserted into pTRV2 at the XbaI and SacI sites to generate pTRV2-SlMYB76. The primers used were listed in Supplemental Table S1. A fragment of SlPDS1 (Solyc03g123760.3) was cloned into pTRV2 to generate pTRV2-SlPDS1 as a positive control, and the empty vector served as a negative control. The VIGS experiment was performed according to Liu et al. (2002). The shoot apexes of TRV2:SlMYB76 plants were harvested 30 d after infiltration for gene expression and GA concentration analysis. Simultaneously, the plant height was measured.
3D structure prediction of SlSUT4
The 3D structure prediction of SlSUT4 from different tomato genotypes was performed in AlphaFold2 (https://colab.research.google.com/github/sokrypton/ColabFold/blob/main/AlphaFold2.ipynb) and visualized using PyMOL software (DeLano Scientific LLC, CA, USA).
Statistical analysis
Data were subjected to one-way ANOVA using SPSS v.20 or Student's t-test in Excel 2010. Differences between treatments were considered to be significant at P < 0.05.
Accession numbers
Sequence data from this article can be found in the Solanaceae Genomics Network (https://solgenomics.net/) with the accession numbers listed in Supplemental Table S2.
Acknowledgments
We thank Prof. Yu Du from Northwest A&F University for kindly providing the pART27-GFP, pART27-mCherry, and plasma membrane marker myr-mCherry vectors; Prof. Zhenxian Zhang from China Agricultural University for kindly providing the vector pDR196; Prof. Peng Zhang from CAS Center for Excellence in Molecular Plant Sciences for kindly providing the yeast strain SUSY7/ura3; and Prof. Chaorong Tang from Hainan University for kindly providing the yeast strain SEY6210. We thank Yanchun Fan for the technical assistance in the determination of soluble sugars, Jing Zhao and Luqi Li for the assistance in the GA analysis, Yangyang Yuan for the assistance in the use of confocal laser scanning microscope, and Beibei He for the assistance in the use of a fluorescence microscope. We thank Prof. Johannes Liesche from the College of Life Sciences, Northwest A&F University, for kindly providing the anti-SlSUT1 antibody and giving valuable suggestions for the study. We also thank the anonymous reviewers for providing valuable suggestions to improve the manuscript.
Author contributions
H.G. and Yufei L. conceived and designed the research; Yufei L., J.B., Z.X., Z.L., J.G., and F.Z. performed the experiments; Yufei L., Yan L., H.H., and H.G. analyzed the data; Yufei L. wrote the manuscript; H.G. and H.H. revised the manuscript.
Supplemental data
The following materials are available in the online version of this article.
Supplemental Figure S1. SUT4 nucleotide acid and amino acid sequences.
Supplemental Figure S2. Subcellular localization of SUT4-GFP vs GFP-SUT4.
Supplemental Figure S3. Sucrose and starch concentrations.
Supplemental Figure S4. SUT1 and SUT2 expression in SUT4-RNAi plants.
Supplemental Figure S5. Phenotype of SlSUT4-RNAi plants.
Supplemental Figure S6. Promoters of SlKO and SlGA20ox1.
Supplemental Figure S7. 3D structure of SlSUT4.
Supplemental Table S1. Primers used for plasmid construction and transgenic genotyping.
Supplemental Table S2. Primers used for reverse transcription quantitative PCR.
Funding
This work was supported by the National Natural Science Foundation of China (32272706).
References
Author notes
The author responsible for distribution of materials integral to the findings presented in this article in accordance with the policy described in the Instructions for Authors (https://dbpia.nl.go.kr/plphys/pages/General-Instructions) is Haijun Gong ([email protected]).
Conflict of interest statement. The authors have no conflict of interest to declare.
