


Abstract
Cell wall synthesis and protein glycosylation require the import of nucleotide diphosphate–sugar conjugates into the Golgi that must be counterbalanced by phosphate (Pi) export. Numerous Golgi nucleotide-sugar transporters have been characterized, but transporters mediating Golgi Pi export remain poorly understood. We used plant and yeast genetics to characterize the role of 2 Arabidopsis (Arabidopsis thaliana) proteins possessing an EXS domain, namely ERD1A and ERD1B, in Golgi Pi homeostasis. ERD1A and ERD1B localized in cis-Golgi and were broadly expressed in vegetative and reproductive tissues. We identified ERD1 putative orthologs in algae, bryophytes, and vascular plants. Expressing ERD1A and ERD1B in yeast complemented the erd1 mutant phenotype of cellular Pi loss via exocytosis associated with reduced Golgi Pi export. The Arabidopsis erd1a mutant had a similar phenotype of apoplastic Pi loss dependent on exocytosis. ERD1A overexpression in Nicotiana benthamiana and Arabidopsis led to partial mislocalization of ERD1A to the plasma membrane and specific Pi export to the apoplastic space. Arabidopsis erd1a had defects in cell wall biosynthesis, which were associated with reduced shoot development, hypocotyl growth, cell wall extensibility, root elongation, pollen germination, pollen tube elongation, and fertility. We identified ERD1 proteins as Golgi Pi exporters that are essential for optimal plant growth and fertility.
Introduction
Phosphorus is one of the most limiting plant nutrients in natural and agricultural ecosystems. Plants acquire phosphorus from the environment as free inorganic phosphate (Pi), which is present at low concentrations in most soils (Poirier et al. 2022). Pi import into plants is primarily mediated by plasma membrane-localized H+-Pi co-transporters belonging to the phosphate transporter 1 (PHT1) family expressed in roots (Nussaume et al. 2011). Beyond the plasma membrane, transporter-mediated Pi flux across various membranes of organelles, such as plastids, mitochondria, and vacuoles, plays an important role in cellular Pi homeostasis (Liu et al. 2015, 2016; Poirier and Jung 2015; Versaw and Garcia 2017; Xu et al. 2019).
The Golgi system produces carbohydrate precursors for cell wall hemicellulose and pectin biosynthesis and for protein and lipid glycosylation (Verbancic et al. 2018; Zhang et al. 2021). Monosaccharides are imported into the Golgi as nucleotide diphosphate (NDP)–sugar conjugates. Once in the Golgi, the sugar moiety is released and the free NDP is de-phosphorylated by apyrases to give nucleotide monophosphate (NMP) and Pi (Chiu et al. 2015). The Golgi membrane contains numerous nucleotide sugar transporters (NSTs) that exchange cytosolic NDP-sugars for NMP from the Golgi lumen (Orellana et al. 2016). This exchange results in a net accumulation of sugars and Pi into the Golgi. Considering the large flux of NDP-sugars required for glycosylation and cell wall biosynthesis, a mechanism to export Pi out of the Golgi is needed to maintain cellular Pi homeostasis. Previous studies have identified Phosphate Transporter 4; 6 (PHT4;6) as a potential Pi exporter. PHT4;6 is distinct from other members of the PHT4 family in localizing to the trans-Golgi (Guo et al. 2008; Hassler et al. 2012). Heterologous expression of PHT4;6 in yeast vacuoles led to Pi export, indicating that PHT4;6 transports Pi out of the Golgi in plants (Cubero et al. 2009). The Arabidopsis (Arabidopsis thaliana) pht4;6 mutant has a strong rosette growth defect, altered senescence, changes in cell wall monosaccharide composition, and increased sensitivity to salt stress (Cubero et al. 2009; Hassler et al. 2012, 2016).
Phosphate 1 (PHO1) is a Pi exporter involved in Pi loading into the root xylem for Pi transport to the shoot (Poirier et al. 1991; Hamburger et al. 2002). PHO1 contains an N-terminal domain named SPX (from Syg1, Suppressor of Yeast G Protein 1/Pho81, Phosphate 81/Xpr1, Xenotropic Polytropic Retrovirus Receptor 1) involved in inositol pyrophosphate binding and a C-terminal domain named EXS (from ERD1, Endoplasmic Reticulum Defective 1/Xpr1/Syg1) shown to be essential for its Pi export activity (Wege et al. 2016; Wild et al. 2016; Jung et al. 2018). In addition to members of the PHO1 family, the Arabidopsis genome contains 2 other genes, namely At5g35730 and At2g32295, encoding EXS domain-containing proteins (Wang et al. 2004). The yeast Saccharomyces cerevisiae has 2 EXS domain-containing proteins: SYG1, which also harbors an SPX domain, and ERD1 (Spain et al. 1995; Wang et al. 2004). The yeast erd1 mutant was initially characterized as deficient in luminal endoplasmic reticulum (ER) protein retention (Hardwick et al. 1990). An independent screen later reported that erd1 has cell wall composition and/or structural defects, which affect its ability to bind Alcian blue dye; this phenotype may be associated with the mis-localization of Golgi glycosyltransferases (Corbacho et al. 2004; Okamoto et al. 2008; Sardana et al. 2021). Subsequently, yeast ERD1 was defined as a Golgi Pi exporter required to balance Pi import associated with NDP-sugar transport into the Golgi (Snyder et al. 2017). In the yeast erd1 mutant, failure to export Golgi Pi to the cytosol resulted in increased apoplastic Pi export, which was dependent on the activity of the Golgi NDP-sugar transporter Vanadate-Resistant Glycosylation 4 (VRG4), as well as on exocytosis (Snyder et al. 2017).
In this work, we characterized the functions of the A. thaliana genes ERD1A (At5g35730) and ERD1B (At2g32295) in Pi homeostasis. We show that ERD1A and ERD1B are cis-Golgi proteins with overlapping functions in Pi transport that are distinct from the trans-Golgi PHT4;6, and that play important roles in plant growth and fertility.
Results
Arabidopsis ERD1A and ERD1B are broadly expressed in the cis-Golgi and have similar functions
Alignment of the S. cerevisiae ERD1 sequence with those of the Arabidopsis proteins encoded by At5G35730 and At2g32295 revealed 20.5% identity and 45.2% similarity between At5g35730 and ScERD1, and 18.1% identity and 40% similarity between At2g32295 and ScERD1 (Supplemental Fig. S1). In contrast, At5g35730 and At2g32295 showed 59.8% identity and 81.9% similarity with each other. The sequence similarity between ScERD1 and its Arabidopsis orthologs was higher in the carboxy half of the protein harboring the EXS domain. Therefore, we named At5g35730 and At2g32295 as ERD1A and ERD1B, respectively.
Phylogenic analysis revealed ERD1 putative orthologs in a broad spectrum of evolutionarily distant plants, including monocotyledons (Zea mays, Triticum aestivum, and Oryza sativa) and dicotyledons (Medicago truncatula and Populus trichocarpa), fern (Ceratopteris richardii), lycophyte (Selaginella moellendorffii), moss (Physcomitrium patens), liverwort (Marchantia polymorpha), and unicellular algae (Ostreococcus tauri and Chlamydomonas reinhardtii) (Supplemental Figs. S2 and S3, Supplemental Data Set S1).
A homozygous mutant with a T-DNA insertion in the sixth exon of ERD1A (the erd1a mutant) that abolished its expression had stunted growth and was sterile due to the absence of viable pollen, as observed by Alexander's staining (Fig. 1, A–J). The erd1a rosette growth and male sterility phenotypes were complemented by expressing an ERD1A-GFP fusion construct under the control of the ERD1A promoter (Fig. 1A, right). In contrast, 2 independent T-DNA insertions in the fourth and fifth exons of ERD1B that abolished its expression did not lead to visible growth phenotypes (Fig. 1, K–M).
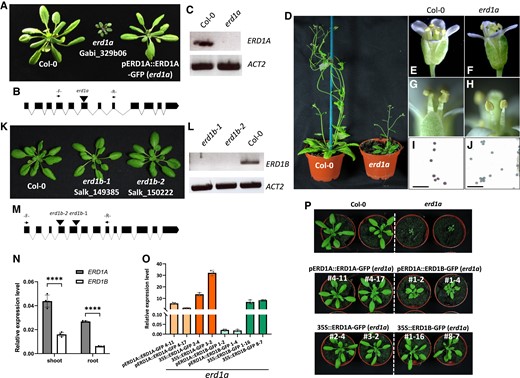
Phenotypes of erd1a and erd1b T-DNA mutants. Phenotypes of T-DNA insertion mutants in the ERD1AA), D) and ERD1BK) genes are shown along with corresponding diagrams of the gene exon-intron structures with the location of the T-DNA insertion sites B), M) and the RT-PCR analysis using oligos that span the insertion sites, showing disruption in gene expression C), L). The erd1a mutant phenotype was complemented by the pERD1A::ERD1A-GFP construct (A, right). In contrast to Col-0 E), G), I), stamens of erd1a flowers failed to release mature pollen F), H), and Alexander's staining showed that erd1a pollen was not viable J). For I) and J), scale bars represent 100 µm. N)ERD1A and ERD1B expression level in roots and shoots of 10-d-old plants was measured by RT-qPCR. Student's t-test, error bars, ± Sd, n = 4, ****P < 0.0001. O) Expression of the ERD1-GFP and ERD1B-GFP transgenes was analyzed by RT-qPCR with primers targeting GFP. Expression is shown relative to ACTIN2 (ACT2). Error bars, ± Sd, n ≥ 3. P) The erd1a mutant was complemented by expressing ERD1A via its native promoter (pERD1A::ERD1A-GFP) or the CaMV35S promoter (35S::ERD1A-GFP), or by expressing ERD1B-GFP with the CaMV35S promoter (35S::ERD1B-GFP). ERD1B-GFP expression via the ERD1A promoter (pERD1A::ERD1B-GFP) partially complemented the erd1a mutant (middle right). Four-week-old plants of 2 independent lines for each complementation are shown.
We examined the ERD1A and ERD1B expression patterns in transgenic plants transformed with the β-glucuronidase (GUS) reporter fused in-frame at the 3′ end of each gene using genomic DNA fragments that included 1.2 kb of the promoter region. The pERD1A::gERD1A-GUS construct, which complemented the erd1a mutant (Supplemental Fig. S4), showed a broad GUS expression pattern after 6 h incubation with the substrate 5-bromo-4-chloro-3-indolyl glucuronic acid (X-GlcA), including in the root meristem and vascular cylinder, the rosette leaf vasculature and lamina, and the stamen filament, pistil, and pollen grains (Fig. 2, A–J). In contrast, plants transformed with the pERD1B::gERD1B-GUS construct had a similar but much weaker staining profile after 16 h of X-GlcA incubation in the cotyledon, root, rosette leaf, and pistil, but failed to show staining in the stamen and pollen (Fig. 2, K–T). Analysis of published RNA-seq data from Arabidopsis roots and leaves revealed that ERD1A expression was 3.8- and 2.9-fold higher than ERD1B in roots and leaves, respectively (Deforges et al. 2019; Supplemental Table S1). The higher level of ERD1A expression relative to ERD1B in both roots and leaves was further confirmed by reverse transcription quantitative PCR (RT-qPCR) (Fig. 1N). In summary, although ERD1A and ERD1B expression profiles largely overlap in numerous tissues, except in the pollen, ERD1A showed a consistently higher level of expression than ERD1B.
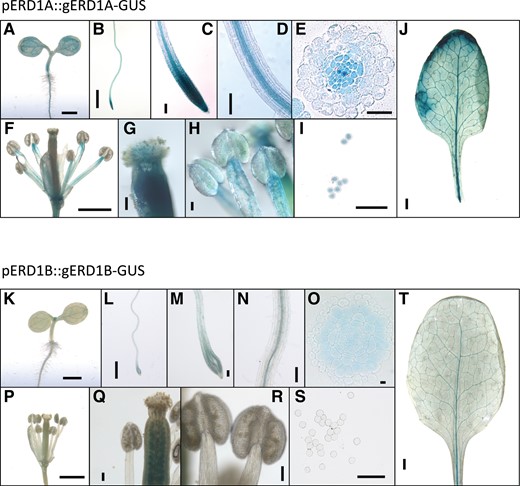
ERD1A and ERD1B are widely expressed in various tissues. The β-glucuronidase (GUS) staining profile for the erd1a mutant complemented by the pERD1A::ERD1A-GUS construct and incubated for 6 h in X-GlcA A)–J) and for WT plants transformed with the pERD1B::ERD1B-GUS construct and incubated for 16 h in X-GlcA K)–T). The GUS profile is shown for 3-d-old seedlings A), K) and 7-d-old roots B)–E), L)-O); flowers F), P); pistils G), Q); stamens H), R); pollen grains I), S); and mature leaves J), T). Scale bars, 1 mm A), B), F), J), K), L), P), and T); 100 µm C), D), G), H), I), M), N), Q), R) and S); and 10 µm E) and O).
Considering the relatively weak expression level of ERD1B and the amino acid homology between ERD1A and ERD1B, we aimed to determine if ERD1B could have a similar function as ERD1A and could complement the erd1a mutant if its level of expression was increased. This was analyzed by generating homozygous erd1a mutants expressing the ERD1A-GFP and ERD1B-GFP constructs under the control of either the ERD1A or CaMV35S promoter. Following analysis of approximately 10 independent lines for each construct, 2 lines expressing the highest level of each transgene were analyzed and compared. Analysis of transgene expression by RT-qPCR showed that maximal expression of the ERD1B transgene under the ERD1A and CaMV35S promoter was substantially lower than the homologous constructs using the ERD1A gene, indicating a potential role for posttranscriptional regulation in the level of ERD1A and ERD1B expression (Fig. 1O). While partial complementation of erd1a was obtained by the relatively weak expression of ERD1B using the pERD1A::ERD1B-GFP construct, full erd1a complementation was obtained via the stronger expression of ERD1B-GFP using the CaMV35S promoter (Fig. 1, O and P). These results indicate that ERD1B-GFP can complement the erd1a mutant when expressed at levels similar to those of pERD1A::ERD1A-GFP lines and, thus, that ERD1A and ERD1B have similar functions. The lack of phenotype of the erd1b mutant is likely due to the weaker expression of ERD1B relative to ERD1A.
We tested whether ERD1A could complement PHT4:6 activity. Transforming the 35S::ERD1A-GFP construct into the pht4:6 mutant failed to complement its rosette growth phenotype. Although the 35S::PHT4:6-GFP construct complemented the pht4:6 mutant, it failed to complement the erd1a mutant phenotypes (Supplemental Fig. S5). This indicates that ERD1A and PHT4:6 have distinct functions in plants.
We examined the subcellular localization of ERD1A and ERD1B using GFP fusions. Expressing the cis-Golgi marker ManI fused to red fluorescent protein (ManI-RFP) in erd1a complemented with pERD1A::ERD1A-GFP resulted in a high level of RFP and GFP co-localization in the root (Fig. 3A). We observed similar co-localization between ManI-RFP and ERD1A-GFP or ERD1B-GFP in transiently transformed Nicotiana benthamiana leaves (Fig. 3B), but a poor overlap between ERD1A-GFP or ERD1B-GFP and the trans-Golgi network (TGN)/early endosome marker VTI12-mCherry (Fig. 3C). Furthermore, we observed strong co-localization when ERD1A-RFP and ERD1B-GFP were co-expressed (Supplemental Fig. S6). PHT4:6 localizes to the trans-Golgi (Hassler et al. 2012), and we observed a low level of co-localization between PHT4:6-GFP and ERD1A-RFP in N. benthamiana leaves (Fig. 3D). In summary, ERD1A and ERD1B localize in the cis-Golgi, while PHT4;6 localizes in the trans-Golgi.
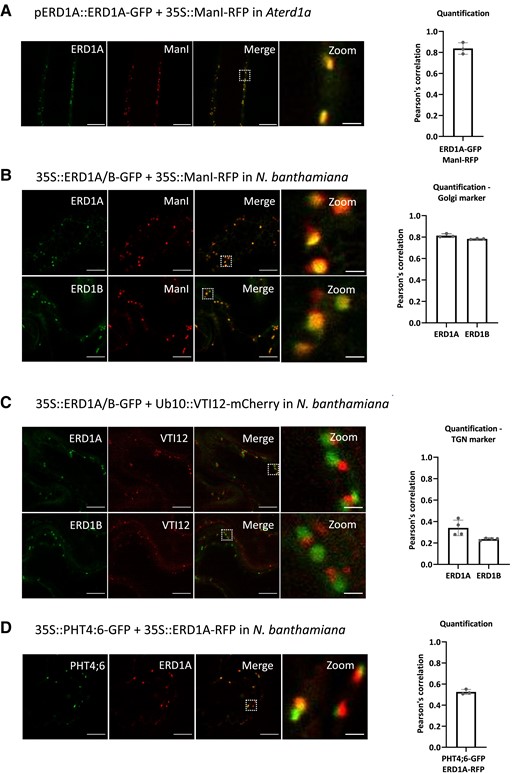
Subcellular localization of ERD1A and ERD1B. A) Fluorescent signals from the root of the transgenic line co-expressing ERD1A-GFP with the cis-Golgi marker ManI-RFP in the erd1a mutant. Epidermal cells from N. benthamiana leaf discs transiently expressing ERD1A-GFP or ERD1B-GFP with ManI-RFP B) and the trans-Golgi network (TGN)-early endosome marker VTI12-mCherry C). D) Co-expression of PHT4;6-GFP and ERD1A-RFP in an N. benthamiana leaf. The white-dashed square in the merged pictures indicates the zoomed-in area. The Pearson's correlation indicating the colocalization level for each combination is shown on the right. Scale bars for the 3 left panels = 10 µm, while scale bar for the right panel representing a zoomed-in area = 1 µm. Error bars, ±sd, n ≥ 3.
Arabidopsis ERD1A and ERD1B complement the yeast erd1 mutant's defect in Pi homeostasis
Next, we assessed the ability of ERD1A and ERD1B to complement yeast erd1 mutant phenotypes. We expressed codon-optimized ERD1A and ERD1B as well as native ScERD1 under the control of the ScERD1 promoter in the yeast erd1 mutant. ERD1A, ERD1B, and ScERD1 complemented the reduced cell wall Alcian blue staining observed in the empty vector-transformed erd1 mutant (Fig. 4A). Furthermore, the yeast erd1 cell wall had reduced mannan contents relative to the wild type (WT), but ERD1A, ERD1B, and ScERD1 complemented this phenotype in transgenic yeast (Fig. 4B). However, ERD1A and ERD1B did not complement the erd1 mutant phenotype of increased export of the ER luminal protein BiP to the apoplastic space (Supplemental Fig. S7).
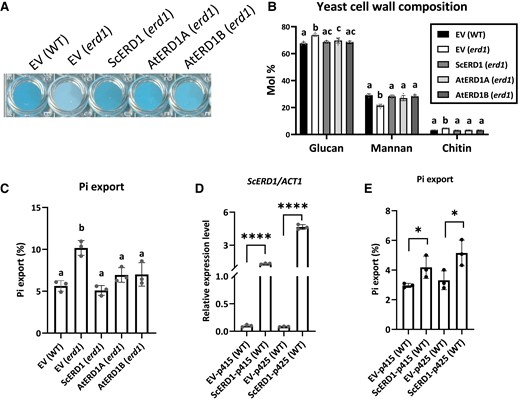
ERD1A and ERD1B complemented the yeast erd1 phenotypes. Native S. cerevisiae ERD1 and codon-optimized Arabidopsis ERD1A and ERD1B were expressed under the native ScERD1 promoter. The empty vector (EV) was transformed into the WT and the erd1 mutant as controls. ScERD1, AtERD1A, and AtERD1B complemented the erd1 Alcian blue staining phenotype A), cell wall composition B), and increased Pi export after 4 h of incubation C). For B) and C), different letters indicate significant differences by 1-way ANOVA and Tukey's multiple comparisons test, Error bars, ±Sd, n ≥ 3. ScERD1 expression level measured by RT-qPCR D) and Pi export after 6 h incubation E) of WT S. cerevisiae cells transformed with ScERD1 under the control of the strong GPD promoter present in the low- and high-copy vectors p415 and p425, relative to the EV controls. Values in D) are relative to ACT2. For D and E, Student's t-test, *P < 0.05; ****P < 0.0001, Error bars, ±Sd, n ≥ 3.
The yeast erd1 mutant has previously been shown to transport excessive amounts of Pi from the Golgi to the apoplastic space via exocytosis (Snyder et al. 2017). Consistent with these data, expression of ERD1A, ERD1B, and ScERD1 under the control of the ScERD1 promoter restored apoplastic Pi export to WT levels (Fig. 4C). Remarkably, ScERD1 overexpression in WT yeast using the strong GPD promoter, present in the low-copy centromeric plasmid p415 or the high-copy 2 µ plasmid p425, also resulted in increased apoplastic Pi export relative to the empty vector control (Fig. 4, D and E).
ERD1A inactivation and overexpression in plants are associated with Pi export to the apoplast
We assessed the role of Arabidopsis ERD1A in Pi homeostasis in the erd1a mutant. Similar to the yeast erd1 mutant, we observed 2-fold higher apoplastic Pi export activity in the Arabidopsis erd1a mutant compared to the Col-0 WT and the 2 pERD1A::ERD1A-GFP-complemented erd1a lines (complemented lines 4–11 and 4–17) (Fig. 5, A and C). Pi export to the apoplast was unaffected in the Arabidopsis pht4;6 mutant and was similar to the Col-0 WT control. In contrast to Pi export, sulfate export to the apoplast was similar in all lines tested, indicating the specificity of ERD1A for Pi export (Fig. 5, B and D).
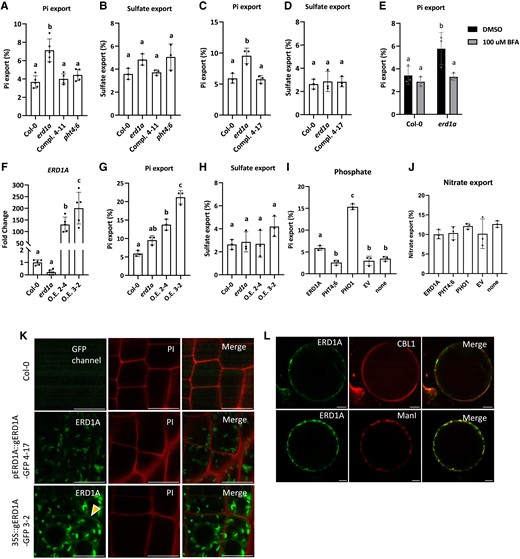
Pi export in the erd1a mutant and ERD1A overexpression lines. 33Pi export to the apoplast in 7-d-old seedlings of Col-0 A, C, E, G), the erd1a mutant A, C, E, G), erd1a complemented by pERD1A::ERD1A-GFP in lines 4–11 A) and 4–17 C), the pht4;6 mutant A), and erd1a overexpressing ERD1A from the p35S::ERD1A-GFP construct in lines O.E. 2–4 and O.E. 3–2 G). For the same lines, 35SO4 export was tested as controls B, D, H). The effect of adding 100 µ M BFA on 33Pi export was tested in Col-0 and erd1aE). Level of ERD1A transcript in the overexpression lines O.E. 2–4 and O.E. 3–2 compared to Col-0 and the erd1a mutant F). 33Pi export to the apoplast in N. benthamiana leaf discs overexpressing ERD1A-GFP, PHT4;6-GFP, or PHO1-GFP was compared to the empty vector (EV) control and un-infiltrated plants after a 6-h incubation I). The nitrate export level was tested as a control in the same samples J). For A) to J), different letters indicate significant differences by 1-way ANOVA and Tukey's multiple comparisons test. Error bars, ±Sd, n ≥ 3. K) Seedlings of Col-0, erd1a line 4–17 complemented with pERD1A::ERD1A-GFP, and line O.E. 3–2 overexpressing ERD1A from the p35S::ERD1A-GFP construct were stained with propidium iodide (PI) to delineate the plasma membrane. The same confocal laser settings were applied in all images. The yellow arrowhead indicates the partial colocalization of the ERD1A-GFP signal with the PI stain. L) Transiently overexpressed ERD1A-GFP in N. benthamiana protoplasts showed partial colocalization with CBL1-OFP, a plasma membrane marker, and with ManI-RFP, a cis-Golgi marker. Scale bars for K and L, 10 µm.
In the yeast erd1 mutant, increased apoplastic Pi export was found to be dependent on exocytosis (Snyder et al. 2017). Similarly, the increased Pi export observed in the Arabidopsis erd1a mutant was abolished by treatment with Brefeldin A (BFA) (Fig. 5E). BFA inhibits exocytosis as well as other aspects of the Golgi vesicular trafficking, including retrograde transport, in part through interfering with Guanine nucleotide exchange factors (GEF) and ADP-ribosylation factor 1 (Arf1) (Niu et al. 2005; Huang and Zhang 2020). These results suggest that the increased Pi export observed in the Arabidopsis erd1a mutant is dependent on components of vesicular trafficking implicating the Golgi.
Next, we examined the effect of ERD1A overexpression on Pi export in 1-wk-old seedlings of 2 independent erd1a lines transformed with 35S::ERD1A-GFP; these overexpression (O.E) lines showed 100- to 200-fold O.E of ERD1A relative to Col-0 (Fig. 5F). The O.E lines had a 2-fold (line O.E 2–4) and 3-fold (line O.E 3–2) increase in Pi export relative to Col-0, while sulfate export remained unchanged (Fig. 5, G and H). Next, we examined Pi export dynamics via transient expression in N. benthamiana leaves. Transient expression of PHT4;6-GFP did not alter Pi export relative to the empty vector (EV) control or un-infiltrated leaves, but transient expression of ERD1A-GFP led to a 3-fold increase in Pi export, and transient expression of PHO1-GFP led to a 7-fold increase in Pi export relative to the EV control (Fig. 5I). However, transient expression of ERD1A-GFP, PHT4;6-GFP, and PHO1-GFP did not alter nitrate export (Fig. 5J).
The increase in Pi export activity observed in the Arabidopsis erd1a transgenic lines overexpressing ERD1A-GFP from the CaMV35S promoter but not in erd1a lines expressing ERD1A-GFP from the native ERD1A promoter suggested that overexpression results in mislocalization of ERD1A. Indeed, a close examination of GFP localization in the 35S::ERD1A-GFP-overexpression line 3–2 revealed a weak fluorescent signal at the plasma membrane in addition to the previously observed signal in the Golgi (Fig. 5K). In contrast, the GFP signal in line 4–17 complemented with pERD1A::ERD1A-GFP appeared to be restricted to the Golgi. Similarly, protoplasts from a section of the N. benthamiana leaf infiltrated with the 35S::ERD1A-GFP construct showed a partial GFP co-localization with the plasma membrane marker Calcineurin B-like calcium sensor 1-orange fluorescent protein (CBL1-OFP) in addition to the co-localization with the Golgi marker ManI-RFP (Fig. 5L).
The erd1a mutant has altered cell wall composition as well as reduced hypocotyl and primary root elongation
Since Pi flux in the Golgi is associated with NDP-sugar import, we analyzed the cell wall monosaccharide composition in rosette leaves. The erd1a and pht4;6 mutants showed limited but distinctive changes in cell wall monosaccharide composition (Fig. 6A). Compared to Col-0, the erd1a mutant cell wall had small decreased content of rhamnose, fucose, xylose, and galacturonic acids, whereas the pht4;6 mutant had small increased content of arabinose, fucose, methylglucuronic acid, and glucuronic acids, and decreased mannose content. When we calculated the sum of the 10 sugars analyzed per dry leaf weight, the erd1a mutant had a lower value for this parameter, which remained unchanged in the pht4;6 mutant (Fig. 6A insert). We did not observe a significant change in the crystalline cellulose content in erd1a relative to the WT but did observe a small decrease in this parameter in pht4;6 (Fig. 6B). Furthermore, we observed only minor changes in the nucleotide sugar content in erd1a leaves compared with Col-0, with a small increase in UDP-GalA and UDP-GlcNAc as well as a small decrease in UDP-Gal (Supplemental Fig. S8).
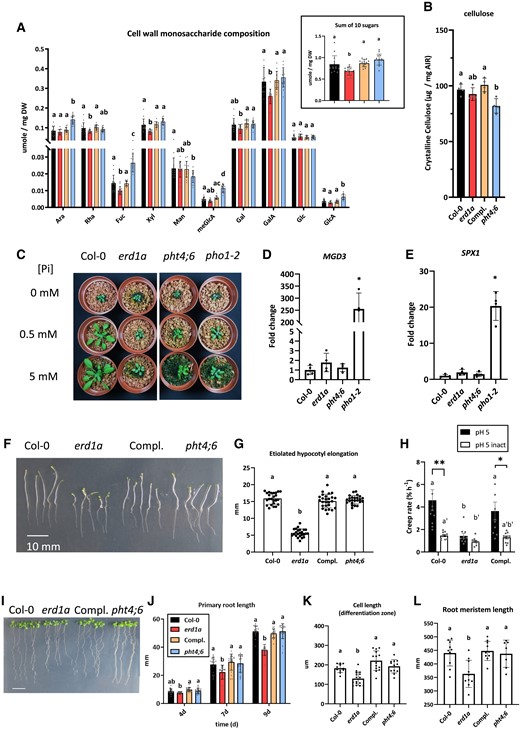
Impact of the erd1a mutation on cell wall composition, hypocotyl elongation, and root growth. The cell wall monosaccharide composition A) and crystalline cellulose content B) from 4-wk-old mature leaves of Col-0, erd1a, erd1a complemented with the pERD1A::ERD1A-GFP construct (Compl.), and pht4;6. Monosaccharides analyzed are arabinose (Ara), rhamnose (Rha), fucose (Fuc), xylose (Xyl), mannose (Man), methylglucuronic acid (meGlcA), galactose (Gal), galacturonic acid (GalA), glucose (Glc), and glucuronic acid (GlcA). For A) and B), different letters indicate significant differences by 1-way ANOVA and Tukey's multiple comparisons test. Error bars, ±Sd, n ≥ 14. Inset in A) shows the sum of all 10 sugars for the 4 genotypes. C) Four-week-old plants grown in soil-free clay substrate with different Pi concentrations. RT-qPCR analysis of Pi starvation-responsive markers MGD3D) and SPX1E) in 4-wk-old soil-grown plants. Expression levels show the fold change relative to Col-0, which was set to 1. For D) and E), Student's t-test to Col-0, error bars, ±Sd, n ≥ 4 (*P < 0.05). F) and G) Etiolated hypocotyls were measured 6 d after incubation in the dark. Scale bar, 10 mm. Different letters indicate significant differences by 1-way ANOVA and Tukey's multiple comparisons test. Error bars, ±Sd, n ≥ 24. H) Differences in creep rates of equivalent length (7 mm) dark-grown hypocotyls of Col-0, erd1a, and erd1a complemented with the pERD1A::ERD1A-GFP construct (Compl.) under a 1-g load. To attain the equivalent length, hypocotyls of Col-0 and Compl lines were grown for 3 d, while erd1a hypocotyls were grown for 7 d. Abbreviations: pH 5, frozen/thawed hypocotyls extended at pH 5; pH 5 inact, frozen/thawed heat-inactivated hypocotyls extended at pH 5; asterisks indicate significant differences (*P < 0.05; **P < 0.01, Student's 2-tailed t-test) for a given line between pH 5 and pH 5 inact; different letters a, b, and c indicate significant differences (P < 0.05, Bonferroni-corrected Student's t-test) between different lines at pH 5; the letters a′ and b′ indicate significant differences (P < 0.05, Bonferroni-corrected Student's t-test) between different lines at pH 5 inact. Error bars, ±Se, n ≥ 10. I)–L) Growth of primary roots on MS medium for Col-0, erd1a, erd1a complemented with the pERD1A::ERD1A-GFP construct (Compl.), and pht4;6 (I, scale bar, 10 mm). J) Root length was measured 4, 7, and 9 d after germination (DAG). Roots of 9 DAG seedlings were analyzed for cell length in the differentiation zone K) and the length of the meristem zone L). For J) to L), different letters indicate significant differences by 1-way ANOVA and Tukey's multiple comparisons test. Error bars, ±Sd, n ≥ 18.
We further examined the link between ERD1A and Pi homeostasis by growing erd1a, pht4;6, and pho1 mutants in a clay-based substrate fertilized with half-strength Murashige and Skoog (MS) with no Pi, 0.5 mM Pi, or 5 mM Pi. Increasing the Pi content of the medium did not rescue the reduced shoot and root growth phenotypes of erd1a, and the effect was also limited in pht4;6 and pho1 (Fig. 6C, Supplemental Fig. S9, A and B). Despite the strong reduction in root and shoot growth, the erd1a mutant had a similar shoot and root Pi content as WT plants under all tested conditions (Supplemental Fig. S9, C and D). Analysis of the vacuolar Pi content of plants grown in soil by in vivo nuclear magnetic resonance spectroscopy also revealed no significant differences between WT and erd1a plants (Supplemental Fig. S9E). While 2 phosphate starvation-regulated genes, MGD3 and SPX1, were strongly upregulated in the Pi-deficient shoots of soil-grown pho1–2, we did not observe a significant difference in their expression in erd1a and pht4;6 compared to the WT (Fig. 6, D and E). This indicates that the erd1a and pht4;6 mutant phenotypes are not associated with a strong perturbation in whole-plant Pi homeostasis that would lead to phosphate starvation responses.
In addition to the strong reduction of rosette and root growth of erd1a grown under phototrophic conditions, hypocotyl growth of seedlings grown in the dark on MS media containing 1% sucrose was also strongly reduced in erd1a but not in pht4;6 (Fig. 6, F and G). When compared at the equivalent length of 7 mm, the creep rate (an estimate of cell wall extensibility) of erd1a hypocotyls was one-third than that of Col-0 and erd1a complemented with pERD1A::ERD1A-GFP at pH 5, the condition when expansins, the most potent cell wall-loosening proteins, are active. This difference was diminished after heat inactivation to eliminate the activities of endogenous cell wall-loosening proteins (Fig. 6H).
When grown in an agar-supplemented medium containing 1% sucrose, the erd1a mutant had shorter primary roots compared to the WT and erd1a complemented with pERD1A::ERD1A-GFP, while pht4;6 roots were similar to WT roots (Fig. 6, I and J). The reduction in erd1a primary root growth was associated with reduced cell size in the differentiation zone and reduced size of the root meristematic zone, indicating an effect on meristematic cell division and cell elongation in the root (Fig. 6, K and L).
ERD1A affects pollen fitness, and absence of ERD1A and ERD1B abolishes male but not female gamete transmission
A segregating population of 120 seedlings from the self-fertilization of a heterozygous ERD1A/erd1a parent had 9 erd1a/erd1a homozygous mutant plants, significantly deviating from the expected 1:3 ratio (χ2 test, P < 0.01). We did not observe embryo lethality in developing seeds from siliques of ERD1A/erd1a plants (Supplemental Fig. S10). Furthermore, the progeny from reciprocal crosses between ERD1A/erd1a and ERD1A/ERD1A parents had reduced transmission of the erd1a allele only through the pollen, and this phenotype was complemented by the pERD1A::ERD1A-GFP construct (Table 1).
Analysis of the transmission of the erd1a allele in the male and female gametes
| Parental genotype | Progeny genotype at the ERD1A locus | P-value (Fisher's exact test) | |||
|---|---|---|---|---|---|
| Pollen donor | Ovule donor | ERD1A/erd1a | ERD1A/ERD1A | ||
| (a) | ERD1A/erd1a | ERD1A/ERD1A | 10 (23%) | 33 (77%) | 0.014 |
| ERD1A/ERD1A | ERD1A/erd1a | 18 (49%) | 17 (51%) | 1 | |
| ERD1A/erd1a | ERD1A/ERD1A | 52 (58%) | 37 (42%) | 0.32 | |
| ERD1A-GFP/ERD1A-GFP | |||||
| (b) | ERD1A/erd1a | ERD1A/ERD1A | 0 (0%) | 36 (100%) | <0.001 |
| erd1b/erd1b | erd1b/erd1b | ||||
| ERD1A/ERD1A | ERD1A/erd1a | 15 (43%) | 20 (57%) | 0.40 | |
| erd1b/erd1b | erd1b/erd1b | ||||
Based on Alexander staining, we did not observe a significant difference in the viability of pollen isolated from ERD1A/erd1a qrt/qrt compared to the qrt/qrt control (Fig. 7A). To analyze the pollen germination rate and pollen tube elongation, we harvested pollen from homozygous erd1a/erd1a plants that were heterozygous for the complementing construct pERD1A::ERD1A-GFP, which is expressed in pollen grains. The germination rate and tube elongation of GFP-negative pollen grains (erd1a) were reduced compared to GFP-positive pollen grains (erd1a complemented with pERD1A::ERD1A-GFP) (Fig. 7, B and C). These results reveal that, although erd1a pollen produced from heterozygous ERD1A/erd1a plants is viable, it has reduced fitness compared to WT pollen due to reduced pollen germination and elongation, explaining the skewed progeny segregation ratio from ERD1A/erd1a parents.
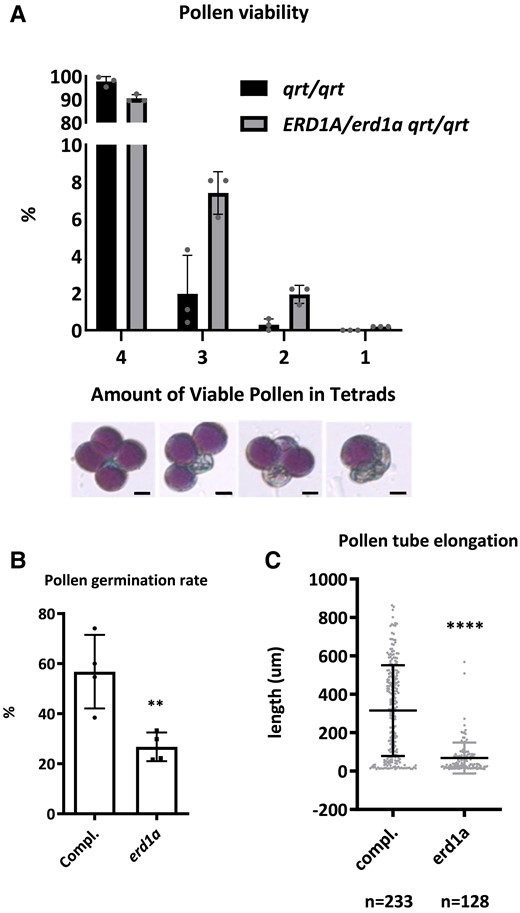
Analysis of pollen viability, germination, and elongation. A) The percentage of viable pollen in each tetrad from qrt/qrt and ERD1A/erd1a qrt/qrt plants. Three independent experiments were performed, and more than 200 tetrads were counted for each genotype in each experiment. Statistics: Chi-square, error bars ± Sd, n = 300 pooled into 3 sets. Scale bars in the lower panel represent 10 µm. B) Pollen was collected for in vitro germination from the erd1a mutant heterozygous for the complementing construct pERD1A::ERD1A-GFP (ERD1A-GFP/- erd1a/erd1a). After 5 h of incubation in the germination solution, the elongated pollen tubes were checked under a confocal microscope to distinguish between pollen expressing pERD1A::ERD1A-GFP (GFP positive) and erd1a pollen without the construct (GFP negative). The germination rate B) and pollen tube elongation C) were then measured. Pollen was determined as germinated when the length of the pollen tube exceeded the pollen radius. For B) and C), Student's t-test, **P < 0.01; ****P < 0.0001, Error bars, ±Sd. For B), n = 100 pollen pooled into 4 sets. For C), n ≥ 128.
We did not recover a double mutant (erd1a/erd1a erd1b/erd1b) from our analysis of over 300 progenies from self-fertilized ERD1A/erd1a erd1b/erd1b plants, and there was no evidence of embryo lethality in developing siliques (Supplemental Fig. S10), indicating a likely defect in the erd1a erd1b gametophytes. Therefore, we analyzed progeny from reciprocal crosses between ERD1A/erd1a erd1b/erd1b and ERD1A/ERD1A erd1b/erd1b plants to assess the requirement of ERD1A in the erd1b/erd1b background in male and female gametophytes for gamete transmission. Transmission of the erd1a erd1b and ERD1A erd1b alleles via the female gametophyte was equal, but we only detected transmission of the ERD1A erd1b alleles via pollen (Table 1). Thus, while the absence of ERD1A and ERD1B was not deleterious to the female gametophyte, the presence of ERD1A or ERD1B is necessary for pollen development and/or viability, although the absence of only ERD1A leads to reduced pollen fitness.
Discussion
The EXS domain is found in 2 groups of eukaryotic proteins (Wang et al. 2008). The first group includes PHO1 homologs, which harbor EXS and SPX domains, with SPX involved in inositol pyrophosphate binding (Wild et al. 2016; Jung et al. 2018). Plants, fungi, and animals contain PHO1 orthologs; plant PHO1 and its mammalian ortholog XPR1 export Pi to the apoplastic space (Arpat et al. 2012; Giovannini et al. 2013; Wege and Poirier 2014). The structure–function analysis of PHO1 revealed that its EXS domain is essential for Pi export activity (Wege et al. 2016). The second group of proteins possessing the EXS domain includes ERD1. Although fungi and a broad spectrum of plants, ranging from unicellular algae to bryophytes and vascular plants, contain ERD1 putative orthologs, none are present in mammals (human and mouse), insects (Drosophila melanogaster), and nematodes (Caenorhabditis elegans), indicating that the ERD1 was lost in the metazoan lineage.
Gene expression profiles using the GUS reporter as well as protein subcellular localization using fluorescent protein fusions indicated that ERD1A and ERD1B are broadly expressed cis-Golgi proteins. Proteomics of isolated Golgi from Arabidopsis confirmed the presence of ERD1A in this organelle (Parsons et al. 2012), and the S. cerevisiae ERD1 ortholog resides in cis-Golgi (Miyasaka et al. 2020; Sardana et al. 2021). Furthermore, the complementation of the erd1a mutant by overexpression of ERD1B using the CaMV35S promoter revealed that ERD1A and ERD1B proteins have similar functions. Characterization of Arabidopsis ERD1A and ERD1B as Golgi Pi exporters is supported by several lines of evidence. First, expression of either ERD1A or ERD1B using the S. cerevisiae ERD1 promoter complemented the defective Golgi Pi export (Pi loss to the external media via exocytosis) in the S. cerevisiae erd1 mutant (Snyder et al. 2017). We observed a similar phenotype of excessive loss of Pi to the apoplast in the Arabidopsis erd1a mutant; this phenotype was also dependent on BFA, indicating the participation of Golgi-associated vesicular transport processes such as exocytosis. Second, ERD1A-GFP overexpression with the CaMV35S promoter in plants led to Pi export to the apoplast, while sulfate and nitrate export was unaffected. We also observed Pi export to the apoplast via transient ERD1A-GFP expression in N. benthamiana and stable ScERD1 overexpression in yeast.
In Arabidopsis and N. benthamiana overexpressing ERD1A-GFP, we observed a small proportion of the corresponding fusion protein in the plasma membrane in addition to the major proportion in the Golgi. Excess ERD1A-GFP accumulation may overwhelm the Golgi protein retrieval system in charge of maintaining resident Golgi proteins within the organelle, resulting in some ERD1A-GFP associating with exosomes that fuse with the plasma membrane. Thus, the increased apoplastic Pi export activity triggered by ERD1A-GFP overexpression would be mediated by a sub-population of ERD1A-GFP mislocated to the plasma membrane. In contrast, the increased apoplastic Pi export observed in both the yeast and plant erd1 mutants is likely a result of the reduction of Pi export out of the Golgi, which would lead to excess Pi content in Golgi-derived vesicles. The fusion of Golgi-derived vesicles with high Pi content to the plasma membrane in the process of exocytosis would result in excessive apoplastic Pi export. For both the erd1a mutant and ERD1A-GFP-overexpression lines, the specificity observed for Pi export but not for nitrate or sulfate export indicates that the Pi export activity is mediated by a transporter and is not a consequence of membrane leakage.
The Pi content in roots and shoots and the vacuolar Pi concentration remained unchanged in the erd1a mutant relative to the WT. There was also no activation of phosphate starvation-responsive genes. Furthermore, increasing the external Pi supply did not rescue the erd1a mutant phenotype. Together, these results indicate that the aberrant Golgi Pi homeostasis observed in the erd1a mutant did not affect the whole-plant Pi content.
ERD1 disruption alters the cell wall composition in yeast and plants. The cell wall of the yeast erd1 mutant had reduced amounts of mannan, suggesting that the lack of ERD1 affects mannan elongation requiring GDP-mannose and the action of Golgi-localized Man-transferases (Orlean 2012). The erd1a mutant cell wall had a small but significant reduction in several monosaccharides, including rhamnose, fucose, xylose, galactose, and galacturonic acid, which reduced the sum of all 10 monosaccharides measured in the cell wall. This phenotype indicates that loss of ERD1A broadly affects the import of a variety of UDP-sugars into the Golgi, which may in turn affect the biosynthesis of several cell wall hemicellulose and pectin components and that of other glycosylated molecules, including lipids. Surprisingly, there was a minimal change in total (cytosolic and organellar) NDP-sugars, although this may not represent NDP-sugar levels in the Golgi. Limited changes in cell wall monosaccharide composition can be associated with strong developmental defects and are likely to contribute to the overall growth defect of erd1a rosettes and to the reduction in hypocotyl growth and cell wall extensibility, root elongation, pollen germination, and pollen tube elongation. For example, the null Arabidopsis mur3-3 mutant, which is deficient in galactosyltransferase activity and contains cell walls with lower amounts of galactosylated xyloglucans, has strongly reduced rosette growth and shorter hypocotyls with reduced cell wall extensibility (Madson et al. 2003; Pena et al. 2004; Tamura et al. 2005; Kong et al. 2015). Similarly, deficiency in cell wall rhamnogalacturonan-II dimerization reduces root cell elongation (Dumont et al. 2015), while perturbed homogalacturonan biosynthesis leads to defects in pollen germination, pollen tube elongation, and male fertility (Lund et al. 2020).
An increase in the Golgi Pi concentration resulting from defective Pi export may directly or indirectly affect numerous pathways involving glycosylation. For example, an in vitro assay using potato (Solanum tuberosum) apyrase revealed that the addition of 125 µ M Pi resulted in a 50% reduction in apyrase ATPase activity (Karamohamed and Guidotti 2001). Since NDP-sugar import into the Golgi is directly coupled to NMP export, inhibiting the conversion of NDP (liberated by glycosyltransferases) to NMP by Golgi apyrases would decrease the flux of NDP-sugars into the Golgi. The Arabidopsis genome contains 7 apyrases (APY1 to APY7), of which 5 localize in the Golgi (Chiu et al. 2015). Although it is currently unknown if any of these Golgi apyrases are inhibited by Pi, it is interesting to note that the Arabidopsis double-mutant apy1 apy2 has reduced pollen germination, while the apy6 apy7 mutant has defective pollen exine formation and reduced male fertility, supporting a role of apyrases in Golgi polysaccharide biosynthesis, including in the pollen (Steinebrunner et al. 2003; Yang et al. 2013).
Although ERD1A and PHT4;6 are not homologs, both are implicated in Golgi Pi homeostasis. The failure to complement the erd1a and pht4:6 mutants with the 35S::PHT4;6-GFP and 35S::ERD1A-GFP constructs, respectively, and the distinct erd1a and pht4:6 phenotypes relating to cell wall monosaccharide composition, apoplastic Pi export, as well as root and hypocotyl growth suggest that erd1a and pht4:6 have distinct functions. This may be related to their distinct sub-cellular localization, with ERD1A localized primarily in the cis-Golgi, while PHT4;6 is localized to the trans-Golgi. Protein and lipid glycosylation, as well as pectin and hemicellulose glycan biosynthesis, are highly dynamic processes, during which sugar addition, removal, and modification alter carbohydrate structures as they progress from the cis-Golgi to the trans-Golgi. Consequently, various glycosyltransferases, glycosidases, sugar epimerases, and NSTs are differentially localized and maintained in the various Golgi stacks (Stanley 2011; Fisher and Ungar 2016; Parsons et al. 2019). The Arabidopsis genome encodes more than 40 putative nucleotide-sugar transporters, and their cis- and trans-Golgi localization supports the existence of NDP-sugar and Pi transport across the various Golgi stacks (Ebert et al. 2018; Parsons et al. 2019). Thus, the perturbed Pi export in the cis-Golgi caused by the absence of ERD1A would impact enzymes and glycan biosynthesis differently than the perturbed Pi export caused by the absence of PHT4;6 from the trans-Golgi. The absence of an apoplastic Pi export phenotype for the pht4;6 mutant is puzzling and perhaps suggests that the quantitative export of Pi from the cis-Golgi via ERD1A/B is higher than in the trans-Golgi via PHT4;6. Clearly, further experiments are needed to distinguish the relative contributions of ERD1A/B and PHT4;6 to Golgi Pi transport dynamics.
Materials and methods
Yeast growth, cloning, transformation, and biochemical analysis
The yeast S. cerevisiae strain BY4742 (MATα his3Δ1 leu2Δ0 lys2Δ0 ura3Δ0) and the erd1 mutant (YDR414c::kanMX4) were obtained from EUROSCARF (http://www.euroscarf.de). Genes were amplified and inserted via In-Fusion or restriction enzymes into the p415-GPD, p425-GPD, or p423-GPD vector containing the TDH3 promoter or their derivatives in which the TDH3 promoter was replaced with the ScERD1 promoter (Mumberg et al. 1995). The plasmids were introduced into S. cerevisiae using the lithium acetate procedure before selection for growth at 28 °C on synthetic medium (SM) containing 6.7 g L−1 yeast nitrogen base without amino acids, 5 g L−1 ammonium sulfate, 20 g L−1 glucose, and 0.69 g L−1 of the appropriate amino acid dropout supplement (Formedium) (Gietz et al. 1992).
For Alcian blue staining, cells were washed once with 50 mM acetic acid, resuspended in 1% (w/v) Alcian blue in 50 mM acetic acid for 5 min, and washed twice with 50 mM acetic acid (Corbacho et al. 2004). Analysis of apoplastic BiP secretion was performed as previously described using immunoblotting with anti-KAR2 (BiP) antibodies.
For the Pi export assay, yeast cells were inoculated overnight in SM-His medium and diluted into fresh SM-His low-Pi (500 µ M Pi) medium supplemented with 0.5 µCi/mL 33Pi. After incubating overnight at 28 °C, cells reaching the exponential growth phase were washed with ice-cold SM-His low-Pi medium 4 times and resuspended in fresh SM-His low-Pi medium. At the indicated time points, the supernatant was taken by centrifugation at 15,000 × g for 1 min. The ratio of 33Pi measured in the supernatant relative to the total intracellular 33Pi at time 0 was considered the Pi export percentage. Radioactivity was measured using Ultima Gold scintillation liquid in the Perkin Elmer tri-carb 2800TF scintillation counter.
The composition of yeast cell wall polysaccharides was analyzed from a cell wall hydrolysate as previously described (François 2006). Briefly, mannan, chitin, β-(1,3)-glucan, and β-(1,6)-glucan in the purified cell walls were determined by acid hydrolysis, and the released sugar monomers (mannose, glucose, and N-acetylglucosamine) were quantified by high-performance anion-exchange chromatography with pulsed amperometric detection (Dallies et al. 1998) (Supplemental Fig. S11).
Arabidopsis growth conditions, cloning, and transformation
All Arabidopsis (Arabidopsis thaliana) plants used in this study, including mutants and transgenic plants, were in the Columbia (Col-0) background. For in vitro experiments, plants were grown in half-strength Murashige and Skoog (MS) salts (Duchefa M0255) containing 1% (w/v) sucrose and 0.7% (w/v) agar. For the Pi-deficient medium, MS salts without Pi (Caisson Labs, MSP11) were used. Pi buffer pH 5.7 [93.5% (w/v) KH2PO4 and 6.5% (w/v) K2HPO4] was added to obtain different Pi concentrations. Plants were also grown in soil or in a clay-based substrate (Seramis) supplemented with half-strength MS with different Pi concentrations. Growth chamber conditions were 22 °C, 60% humidity, and a 16-h-light/8-h-dark photoperiod with 100 μE/m2 per second of white light.
ERD1A, ERD1B, and PHT4:6 genomic sequences were amplified and inserted into the pENTR2B-Amp vector by In-Fusion technology before being cloned into the destination vector pMDC107 [green fluorescent protein (GFP) C-fusion], pMDC164 [β-glucuronidase (GUS) C-fusion], or pMDC83 (GFP C-fusion with the CaMV 35S promoter) (Curtis and Grossniklaus 2003) via recombination between the attL and attR sites (Invitrogen). The ManI-red fluorescent protein (RFP) (Golgi), VTI12-mCherry (trans-Golgi network), and CBL1-OFP (plasma membrane) markers were previously described (Nelson et al. 2007; Geldner et al. 2009; Batistič et al. 2010). The constructs were introduced into Agrobacterium tumefaciens pGV3101 and used for stable transformation in Arabidopsis by floral dipping (Clough and Bent 1998) or transient expression in Nicotiana benthamiana (Arpat et al. 2012).
Staining and microscopy
β-Glucuronidase (GUS) staining was performed by reaction with the substrate 5-bromo-4-chloro-3-indolyl glucuronic acid (X-GlcA) as previously described (Stefanovic et al. 2007). For the root sections, the seedlings were stained and fixed in an agarose block, then cut with a microtome. Photos were taken with a Leica MZ16 or DM5500 microscope. All fluorescent images in Arabidopsis seedlings and N. benthamiana leaves for subcellular localization were taken with a Leica Stellaris or a Zeiss LSM700 confocal microscope. Quantification of co-localization was performed using the intensity correlation analysis method implemented in the ImageJ plug-in (http://www.macbiophotonics.ca/imagej/).
Nicotiana benthamiana infiltration and Pi export assay
An overnight culture of A. tumefaciens was pelleted and resuspended in infiltration buffer [10 mM MES-KOH (pH 5.6), 10 mM MgCl2, and 150 µ M acetosyringone]. The leaves of 4- to 5-wk-old N. benthamiana plants were used for infiltration with diluted cultures of A. tumefaciens. After 3 d, the leaves were randomly cut into 1-cm-diameter discs and soaked in a buffer containing 5 mM glucose, 10 mM MES-KOH (pH 5.6), 1 mM KCl, 0.5 mM CaCl2, 0.5 mM MgSO4, and 0.01% (v/v) Triton X-100. Pi and nitrate released in the buffer were measured by the molybdate assay (Ames 1966) and nitrate reductase assay (Barthes et al. 1995), respectively.
33Pi and 35SO4 export in Arabidopsis seedlings
Seven-day-old seedlings were washed in a buffer containing half-strength MS without Pi and with 0.05% (w/v) MES (pH 5.6) and 1% (w/v) sucrose and then incubated with 4.5 µCi/mL 33Pi in the same buffer supplemented with 10 µ M Pi for 2 h at room temperature with shaking. The seedlings were washed in ice-cold water and buffer with 1 mM Pi and then incubated in the same buffer (1 mM Pi) for 33Pi export at room temperature with shaking. The medium was collected and seedlings were incubated at 55 °C for 1 h with 10% (w/v) SDS. Radioactivity in the media and seedlings was measured using Ultima Gold scintillation liquid and the Perkin Elmer tri-carb 2800TF scintillation counter.
In the 35SO4 export experiment, the same procedure was applied but using a buffer without sulfate for washing and buffer supplemented with 10 µ M MgSO4 and 4.5 µCi/mL 35SO4 for isotope labeling and 50 µ M for 35SO4 export.
Etiolated hypocotyl biomechanics
Dark-grown Arabidopsis seedlings were frozen in liquid nitrogen. Some seedlings were heat-inactivated after thawing to eliminate the activity of endogenous cell wall-loosening/tightening enzymes. In vitro extension of frozen/thawed hypocotyls was measured with a custom-built constant load extensometer (Suslov and Verbelen 2006). A 3-mm-long hypocotyl segment was secured between clamps of the extensometer located 1.5 mm below cotyledons and preincubated in 20 mM sodium acetate buffer (pH 5.0) in the relaxed state for 2 min. Then, its time-dependent extension (creep) was measured in the same buffer under 1,000- or 2,000-mg loads for 15 min. The relative creep rate was calculated as previously described (Vandenbussche et al. 2011).
Pollen viability, germination, and pollen tube elongation
Pollen viability was analyzed using Alexander's staining solution, as previously described (Alexander 1969). Pollen from flowers of Col-0 or heterozygous erd1a mutants (ERD1A/erd1a) in the quartet (qrt) genetic background was released on a slide with the staining solution and analyzed under a light microscope. The qrt mutant produces tetrad pollen in which the 4 microspores fail to separate (Rhee and Somerville 1998). Pollen from homozygous erd1a/erd1a plants was released by pressing the pollen sac with tweezers on a slide.
Pollen germination and tube elongation were analyzed as previously described with slight modifications (Johnson-Brousseau and McCormick 2004). Pollen from the heterozygous complementation line (pERD1A::gERD1A-GFP/-, erd1a/erd1a) was incubated for 5 h in a medium containing 0.01% (w/v) boric acid, 5 mM CaCl2, 1 mM K(NO3), 5 mM KCl, 1 mM MgSO4, and 18% (w/v) sucrose, with the pH adjusted to 7.5 with KOH. The medium with the pollen was transferred to a slide and examined under a confocal microscope to differentiate the pollen genotype based on GFP fluorescence. Pollen exhibiting GFP fluorescence was considered the erd1a mutant complemented with ERD1A-GFP, whereas nonfluorescent pollen was considered the erd1a mutant. Pollen with pollen tubes longer than the radius of the pollen was considered to have germinated.
A more detailed description of the material and methods can be found in the Supplemental Data section.
Accession numbers
Sequence data from ERD1 proteins and putative orthologues described in this article can be found in the GenBank/EMBL data libraries under accession numbers: Saccharomyces cerevsisiae, NP_010702.4; Aspergillus nidulans, XP_663286.1; Arabidopsis thaliana ERD1A, NP_568530.1; Arabidopsis thaliana ERD1B, NP_001318333.1; Oryza sativa, EEC69602.1; Zea mays, ONM01771.1; Triticum aestivum, XP_044379600.1; Populus trichocarpa, XP_002310465.2; Physcomitrium patens, XP_024384771.1; Medicago truncatula, XP_003597031.1; Ostreococcus tauri, XP_003083286.2; Selaginella moellendorffii, XP_024524268.1; Chlamydomonas reinhardtii, XP_042928479.1; Marchantia polymorpha, PTQ36909.1; and Ceratopteris richardii, KAH7422254.1.
Acknowledgments
The authors are grateful to Junko Takahashi Schmidt from the Biopolymer Analytical Plateform of the Swedish University of Agricultural Sciences-Umeå Plant Science Center, Sweden, for Arabidopsis cell wall monosaccharide composition analysis, as well as to the Chromas Core Facility of the Research Park of Saint-Petersburg State University. The authors are also very grateful to Jean-Marie François (Toulouse Biotechnology Institute) and Joshua L. Heazlewood (University of Melbourne) for sharing their expertise and commenting on the manuscript. The authors also thank Aime Jaskowloski and Joaquín Clúa for help with the pollen germination assay and analysis of primary root growth, respectively.
Author contributions
Y.-F.H. and Y.P. conceived the project. Y.-F.H. performed all experiments with the exception of the measurement of hypocotyl extension properties performed by D.S.; in vivo NMR by L.E.; analysis of the yeast and plant cell composition performed by M.S., A.G.-O., and C.V.; and the analysis of nucleotide sugars by C.R. Y.-F.H. and Y.P. wrote the manuscript and all authors provided feedback on it and approved the final manuscript. Y.P. agrees to serve as the author responsible for contact and ensures communications.
Supplemental data
The following materials are available in the online version of this article.
Supplemental Figure S1. Alignment of protein sequences of ScERD1, AtERD1A, and AtERD1B.
Supplemental Figure S2. Unrooted phylogenetic tree of ERD1 orthologs in plants.
Supplemental Figure S3. Multiple sequence alignment of ERD1 orthologs in plants.
Supplemental Figure S4. Expression of the pERD1::gERD1A-GUS construct in erd1a.
Supplemental Figure S5. ERD1A and PHT4;6 are genes with distinct functions.
Supplemental Figure S6. Co-localization of ERD1A-RFP and ERD1B-GFP.
Supplemental Figure S7. Lack of complementation of BiP secretion phenotype of the erd1 mutant expressing the Arabidopsis ERD1A and ERD1B proteins.
Supplemental Figure S8. Analysis of nucleotide-sugar levels.
Supplemental Figure S9. The erd1a mutant shows no systemic changes in Pi level in whole plants.
Supplemental Figure S10. No evidence of embryo lethality in siliques of erd1a/ERD1A lines.
Supplemental Figure S11. Chromatograms obtained by the high-performance anion-exchange chromatography with pulsed amperometric detection (HPAEC-PAD).
Supplemental Table S1. RNA-seq data for the expression of AtERD1A and AtERD1B.
Supplemental Material and Methods.
Supplemental Data Set S1. Amino acid of ERD1A putative orthologues in plants and fungi.
Funding
This work was supported, in part, by a grant from the Swiss National Science Foundation (31003A-182462) to Y.P, as well as by funding from the University of Lausanne.
References
Author notes
The author responsible for distribution of materials integral to the findings presented in this article in accordance with the policy described in the Instructions for Authors (https://dbpia.nl.go.kr/plphys/pages/General-Instructions) is Yves Poirier.
Conflict of interest statement. None declared.
