


Abstract
The induction and progression of leaf senescence are effectively changed according to the light environment. The leaf senescence response is enhanced when plants are grown under a dense shade cast by neighboring vegetation. Although the fluence rate of the red and blue regions in the light spectrum is strongly attenuated under shade, photosensory mechanisms that underpin the blue light response are still unclear. In this study, we analyzed leaf senescence in response to blue light in Arabidopsis (Arabidopsis thaliana). We found that leaf senescence was promoted by the elimination of active phytochrome Pfr by pulsed far-red (FR) light, whereas irradiation with blue light suppressed leaf senescence in the wild type but not in the cryptochrome (CRY)-deficient mutant, cry1 cry2. Hence, two light-sensing modes contributed to the suppression of leaf senescence that was dependent on light spectrum features. First was the leaf senescence response to blue light, which was mediated exclusively by cryptochromes. Second was the phytochrome-mediated leaf senescence response to red/FR light. Physiological analysis of transgenic plants expressing green fluorescent protein (GFP)-tagged CRY2 revealed that photo-activation of cryptochromes was required to suppress leaf senescence in response to blue light. Transcriptomic analysis further uncovered the molecular and cellular processes involved in the regulation of leaf senescence downstream of cryptochromes. Furthermore, analysis of cryptochrome-downstream components indicated that ELONGATED HYPOCOTYL 5 (HY5) and PHYTOCHROME INTERACTING FACTOR (PIF) 4 and PIF5 were required for suppression and promotion of leaf senescence, respectively.
Introduction
Light provides important information to plants that enables them to adjust their growth and development. The quantity, quality, and direction of light are recognized through multiple families of photoreceptors, including red- and far-red (FR)-light-absorbing phytochromes (Quail et al. 1995), blue light-absorbing phototropins, cryptochromes, ZEITLUPE (ZTL)/FLAVIN-BINDING, KELCH REPEAT, F-BOX 1 (FKF1)/LOV KELCH PROTEIN2 (LKP2) (Suetsugu and Wada 2003), and UV-B light-absorbing UVR8 (Rizzini et al. 2011). Cryptochromes mediate various physiological and developmental processes, such as de-etiolation, the shade avoidance syndrome, the circadian clock, and floral induction in response to blue light (Wang and Lin 2020). A photolyase homologous region (PHR) domain, which is similar in structure to DNA photolyase, resides at the N-terminal moiety of cryptochromes. The PHR domain functions in blue light sensing by binding a flavin adenine dinucleotide chromophore. Upon absorption of light, the cryptochrome C-terminal tail domain is phosphorylated and released from the inhibitory PHR domain to trigger physiological responses.
Because leaves are the main photosynthetic organs, plants modify leaf senescence according to the surrounding light environment. For example, leaf senescence is promoted for reducing the cost of respiration when plants are exposed to prolonged periods of shade under dense canopies cast by neighboring vegetation (Brouwer et al. 2012). During senescence, leaves turn yellow because of chlorophyll degradation and carotenoid retention. Because cellular nitrogen contained in leaves is mostly located within mesophyll chloroplasts (Makino and Osmond 1991), nitrogen salvage from chloroplasts is one of the most important events during leaf senescence. Cellular components and biomolecules in senescing leaves are broken down, and the resulting nutrients are salvaged and relocated to newly developing organs. For cellular degradation and nutrient recycling, autophagy contributes to the progression of leaf senescence through transcriptional activation of AUTOPHAGY (ATG) genes (Yoshimoto et al. 2004). Finally, leaf senescence leads to programmed cell death and is, therefore, thought to constitute the terminal phase of leaf development.
Molecular genetic analyses in Arabidopsis (Arabidopsis thaliana) have identified key factors and uncovered signaling pathways involved in leaf senescence (Woo et al. 2019; Sakuraba 2021). For instance, the induction and progression of leaf senescence are accompanied by changes in the expression of SENESCENCE-ASSOCIATED GENE (SAG) and YELLOW-LEAF-SPECIFIC GENE (YLS) (Hensel et al. 1993; Yoshida et al. 2001). In addition, genes encoding NAM, ATAF, and CUC (NAC) transcription factors, such as NAC-LIKE, ACTIVATED BY AP3/PI (NAP)/ARABIDOPSIS NAC DOMAIN CONTAINING PROTEIN (ANAC) 29, and ORESARA1 (ORE1)/ANAC092, play an important role in controlling leaf senescence by directly activating the transcription of chlorophyll catabolic genes and SAGs (Guo and Gan 2006; Kim et al. 2009). Furthermore, several reports described the involvement of phytohormones in promoting leaf senescence. Notably, the role of ethylene in leaf senescence has been prominently explored. Endogenous ethylene is elevated in the shade (Pierik et al. 2004). In Arabidopsis, leaf senescence in darkness is strongly inhibited in the ethylene-insensitive mutants, ethylene insensitive (ein) 2 and ein3 (Oh et al. 1997), indicating that ethylene signaling is crucial for the promotion of leaf senescence.
The red light signal is the most studied light signal during leaf senescence (Sakuraba 2021). Induction of leaf senescence is strongly suppressed by red light irradiation, and this effect is reversed by a pulse of FR light (De Greef and Fredericq 1972). The reversible red to FR photoreaction is mediated by phytochrome photoreceptors, which exist as two photo-interconvertible forms: the red-absorbing Pr form and the FR-absorbing Pfr form (Whitelam and Smith 1991). Whereas phytochrome Pr is evenly distributed in the cytosol, phytochrome Pfr accumulates in the nucleus (Yamaguchi et al. 1999). Nuclear phytochrome Pfr directly interacts with basic helix–loop–helix (bHLH) transcriptional factors called phytochrome-interacting factors (PIFs) to module their transcription (Cheng et al. 2021). Among the eight Arabidopsis PIFs, PIF4 and PIF5 are known to function as positive regulators of leaf senescence (Sakuraba et al. 2014). The absence of phytochrome Pfr under shade allows PIF4 and PIF5 to activate the expression of genes involved in the leaf senescence pathway (Song et al. 2014). PIF5 directly activates the transcription of ORE1 and STAY-GREEN 1 (SGR1), which encode a NAC transcription factor and chlorophyll degradation enzyme (Qiu et al. 2015), respectively. Several studies report that PIF4 and PIF5 are involved in the transcriptional activation of EIN3 (Zhang et al. 2015), which is required for promoting leaf senescence in an ethylene-dependent manner.
In contrast to red light, less is known about the blue light signaling pathway in leaf senescence. In wheat (Triticum aestivum) and grape (Vitis vinifera), blue light irradiation delays leaf senescence (Causin et al. 2015; Wang et al. 2016). Furthermore, Meng et al. (2013) report that natural aging senescence is delayed in transgenic soybean (Glycine max) overexpressing CRY2a grown under continuous white light, while chlorophyll degradation is promoted in CRY2a RNAi-based knockdown plants during the senescence stage. However, Sakuraba et al. (2014) showed that leaf senescence proceeds normally in an Arabidopsis cryptochrome-deficient mutant. Hence, it is unclear whether and how leaf senescence is suppressed by cryptochromes in response to blue light. Detailed analyses are necessary to characterize the spectral dependence of the leaf senescence response.
In this study, we identified cryptochromes to be the photoreceptor that suppresses leaf senescence under blue light in Arabidopsis. Irradiation of monochromatic blue light at 5 µmol m−2 s−1 suppressed leaf senescence in the wild type (WT) but not in the cry1 cry2 mutant. In addition, the blue light response of transgenic lines overexpressing GFP-fused C-terminal CRY2 (CRY2-GFP) or N-terminal CRY2 (GFP-CRY2) was examined. Leaf senescence was suppressed by CRY2-GFP, which showed constitutive activity in darkness, but not by GFP-CRY2. The transcriptomic analysis further revealed that the expression of senescence-related genes was downregulated under blue light in a cryptochrome-dependent manner.
Results
Suppression of leaf senescence under blue light
The effect of monochromatic blue light on the suppression of leaf senescence was examined by quantifying changes in chlorophyll content in WT leaves incubated in darkness or under blue light (peak at 450 nm) at 5.0 µmol m−2 s−1 for 3 d (Fig. 1A). Only slight differences in chlorophyll content between the dark and blue light treatments were observed. Leaf chlorophyll content between dark and blue light was similar for the first 2 d, but declined slightly in the dark at Day 3 (Fig. 1, C and D). The slow reversion of the active form of phytochrome Pfr to inactive Pr in darkness is a possible explanation for the chlorophyll retention and leaf senescence suppression. We, therefore, treated the leaves with a pulse of FR light, which rapidly eliminates phytochrome Pfr during the subsequent dark incubation (Fig. 1B). We found that FR-pretreated leaves incubated in the dark rapidly turned yellow and exhibited a reduction in chlorophyll content that was evident after 2 d (Fig. 1, E and F). Therefore, leaves subjected to an FR light pulse were used for the subsequent experiments.
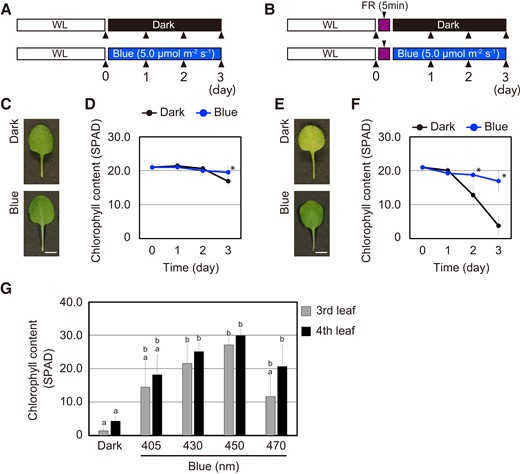
Suppression of leaf senescence in response to blue light. A) and B) Schematic illustration of the light regimes. The fourth leaves collected from WT plants grown under short days (white light for 10 h/dark for 14 h: WL) were pretreated without A) or with B) 50.0 µmol m−2 s−1 FR light for 5 min followed by incubation in darkness (Dark), or under 5.0 µmol m−2 s−1 blue light (Blue) for 3 d. Leaf chlorophyll content was measured on the day indicated by the arrowheads. C) Representative images of the fourth leaf which were incubated under the condition described in A). Scale bars = 5 mm. D) Changes in chlorophyll content of leaves that were incubated under the condition described in A) at 0–3 d. The data are means ± SD (n ≥ 8). Asterisks indicate significant differences between dark and blue light treatment on the indicated days (*P < 0.01, Student's t-test). E) Representative images of the fourth leaf incubated under the condition described in B). Scale bars = 5 mm. F) Changes in chlorophyll content of FR-pretreated leaves that were incubated under the condition described in B) at 0–3 d. The data are means ± SD (n ≥ 8). Asterisks indicate significant differences between dark and blue light treatment on the indicated days (*P < 0.01, Student's t-test). G) Chlorophyll content of the WT third and fourth leaves that were pretreated with 50.0 µmol m−2 s−1 FR light for 5 min followed by incubation in darkness or under the different blue light wavelength at 5.0 µmol m−2 s−1 for 3 d. The data are means ± SD (n = 4). Different letters indicate statistically significant differences (P < 0.01, Tukey–Kramer test).
In leaves treated with a pulse of FR light, chlorophyll content was higher under blue light than in darkness (Fig. 1, E and F). Blue light at 450 nm, which is the peak absorbance of blue light photoreceptors (Suetsugu and Wada 2003), was most effective in suppressing leaf senescence based on changes in chlorophyll content (Fig. 1G and Supplemental Fig. S1). Hence, leaf senescence was likely suppressed by blue light photoreceptors, such as cryptochromes.
In Arabidopsis, the two cryptochromes, CRY1 and CRY2, function redundantly (Wang and Lin 2020). Therefore, the leaf senescence response of the cry1 cry2 double mutant was compared with that of WT under darkness and blue light for 8 d (Fig. 2A). We found that blue light failed to suppress senescence in cry1 cry2 based on the onset of leaf yellowing (Fig. 2B). Consistent with the observed leaf yellowing phenotypes, chlorophyll content declined in a similar manner in dark-incubated WT and cry1 cry2. By contrast, blue light treatment delayed the onset of chlorophyll degradation in WT, but not in cry1 cry2 (Fig. 2C). These results suggest that suppression of leaf senescence is mediated by cryptochromes in response to blue light.
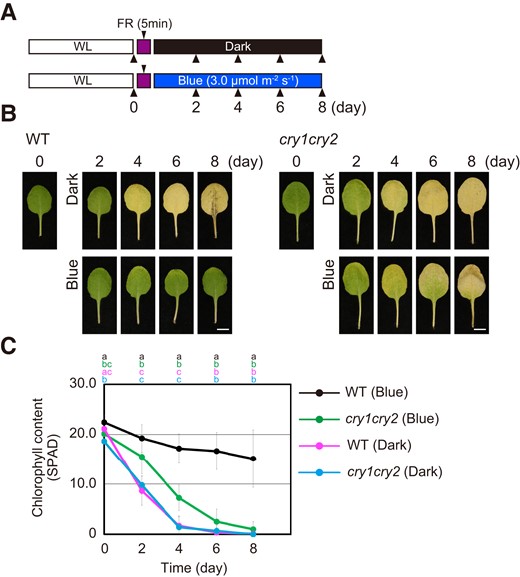
Suppression of leaf senescence by cryptochromes. A) Schematic illustration of the light regimes. The fourth leaves collected from WT and cry1 cry2 plants grown under short days (white light for 10 h/dark for 14 h: WL) were pretreated with 50.0 µmol m−2 s−1 FR light for 5 min followed by incubation in darkness (Dark) or under 3.0 µmol m−2 s−1 blue light (Blue) for 8 d. B) Representative images of the fourth leaves of WT and cry1 cry2 that were incubated under the condition described in A) for 0–8 d. Scale bars = 5 mm. C) Chlorophyll content of the leaves at the time points corresponding to the images in B). The data are means ± SD (n ≥ 8). Different letters indicate statistically significant differences at the indicated days (P < 0.01, Tukey–Kramer test). Letters are represented on top of graphs in order of corresponding to chart's legend.
CRY2 is primarily responsible for regulating leaf senescence under low blue light
CRY2 is known to be more sensitive to blue light than CRY1 (Wang and Lin 2020). Therefore, the photosensitivity of the leaf senescence response was investigated by comparing the effects of low light intensities on chlorophyll content among WT, cry1 cry2 double mutant, and cry1 and cry2 single mutants (Fig. 3A). Changes in chlorophyll content were determined in leaves incubated for 4 d under blue or red light fluence rates ranging from 0.2 to 5.0 µmol m−2 s−1. No significant differences in chlorophyll content among WT, cry1, cry2, and cry1 cry2 were observed under red light. By contrast, chlorophyll content in cryptochrome mutants was lower than that in the WT in response to blue light at all fluence rates examined (Fig. 3A). Furthermore, chlorophyll content in cry2 was significantly lower than that in cry1 under 2.0 µmol m−2 s−1 blue light (P < 0.01, Tukey–Kramer test). No significant differences between cry2 and cry1 cry2 were observed in chlorophyll content under 2.0 and 5.0 µmol m−2 s−1 blue light treatments (Fig. 3A). We also determined the PSII-maximum yield Fv/Fm, which is a photosynthesis quantum parameter, in leaves incubated for 4 d in darkness or under 3.0 µmol m−2 s−1 blue light (Fig. 3B). The Fv/Fm values of WT and cry1 leaves under blue light were higher than those in darkness. It seems to be reasonable that a similar level of Fv/Fm was observed in the WT and cry1 mutant under blue light, because the Fv/Fm values decreased more slowly during leaf senescence than chlorophyll content. On the other hand, Fv/Fm values of cry2 and cry1 cry2 under blue light were almost indistinguishable from those in darkness (Fig. 3B). Taken together, these results indicate that suppression of leaf senescence under low blue light is mainly dependent on CRY2.
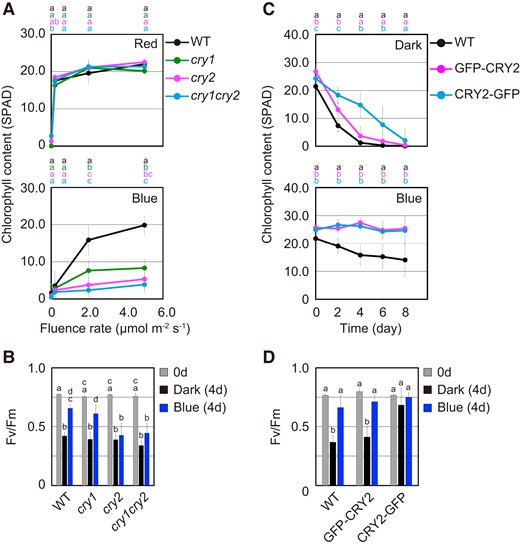
Blue light-dependent activities of cryptochromes in the regulation of leaf senescence. A) Chlorophyll content of the fourth leaves of WT, cry1, cry2, and cry1 cry2 that were pretreated with 50.0 µmol m−2 s−1 FR light for 5 min followed by incubation under different monochromatic red or blue light fluence rates for 4 d. The data are means ± SD (n ≥ 6). Different letters indicate statistically significant differences at the indicated fluence rates (P < 0.01, Tukey–Kramer test). Letters are represented on top of graphs in order of corresponding to chart's legend. B) Fv/Fm values in the fourth leaves of WT, cry1, cry2, and cry1 cry2 that were pretreated with 50.0 µmol m−2 s−1 FR light for 5 min followed by incubation in darkness or under 3.0 µmol m−2 s−1 blue light for 4 d. The data are means ± SD (n ≥ 5). Different letters indicate statistically significant differences (P < 0.01, Tukey–Kramer test). C) Changes in chlorophyll content of the fourth leaves of WT, GFP-CRY2, and CRY2-GFP that were pretreated with 50.0 µmol m−2 s−1 FR light for 5 min followed by incubation in darkness or under 3.0 µmol m−2 s−1 blue light for 8 d. The data are means ± SD (n ≥ 8). Different letters indicate statistically significant differences at the indicated days (P < 0.01, Tukey–Kramer test). Letters are represented on top of graphs in order of corresponding to chart's legend. D) Fv/Fm values in WT, GFP-CRY2, and CRY2-GFP leaves that were incubated under the condition described in C) for 4 d. The data are means ± SD (n ≥ 5). Different letters indicate statistically significant differences (P < 0.01, Tukey–Kramer test).
We further examined the involvement of CRY2 photoactivation in suppressing leaf senescence using CRY2-GFP (C-terminal fusion) and GFP-CRY2 (N-terminal fusion) transgenic plants. Although GFP-CRY2 is normally activated by light, CRY2-GFP induces physiological responses without a light stimulus because of constitutive phosphorylation of its C-terminal tail domain (Yu et al. 2009). The fourth leaves of GFP-CRY2 and CRY2-GFP transgenic plants were incubated in darkness or under 3.0 µmol m−2 s−1 blue light for 8 d, and chlorophyll content during leaf senescence was determined. In GFP-CRY2 and CRY2-GFP transgenic lines, the reduction of chlorophyll content was suppressed more than that in WT under blue light (Fig. 3C). Furthermore, chlorophyll degradation was significantly delayed in CRY2-GFP relative to that of WT in darkness. By contrast, no differences in chlorophyll degradation were observed between GFP-CRY2 and WT during leaf senescence (Fig. 3C). The Fv/Fm value of CRY2-GFP was also retained at high levels regardless of light conditions (Fig. 3D). These results suggest that the suppression of leaf senescence is dependent on cryptochrome photoactivation in response to blue light.
Comparative transcriptomic analysis of leaf senescence in WT and cry1 cry2
To gain insights into how cryptochromes regulate the leaf senescence response, transcriptomic analysis using the cap analysis of gene expression (CAGE) was conducted on WT and cry1 cry2 leaves incubated in darkness or under blue light for 24 h. CAGE, which provides the amount of transcript arising from a transcriptional starting site, enables high-throughput gene expression analysis.
Blue light-responsive genes were defined for each of the genotypes as those that showed at least a 1.5-fold statistically significant difference between dark and blue light treatment. Transcriptomic profiling uncovered blue light-induced and blue light-repressed genes in WT and cry1 cry2 (Fig. 4A and Supplemental Data Set S1), with some of these genes overlapping between genotypes (Fig. 4B). The occurrence of overlapping genes in WT and cry1 cry2 indicates the involvement of photoperception systems other than cryptochromes in altering blue light-triggered gene expression profiles. Nonoverlapping blue light-induced and blue light-repressed genes were also detected in WT and cry1 cry2. Notably, 1,163 blue light-induced and 703 blue light-repressed genes were exclusive to WT and were, therefore, referred to as the CRY-upregulated and CRY-downregulated genes, respectively (Fig. 4B and Supplemental Data Set S2).
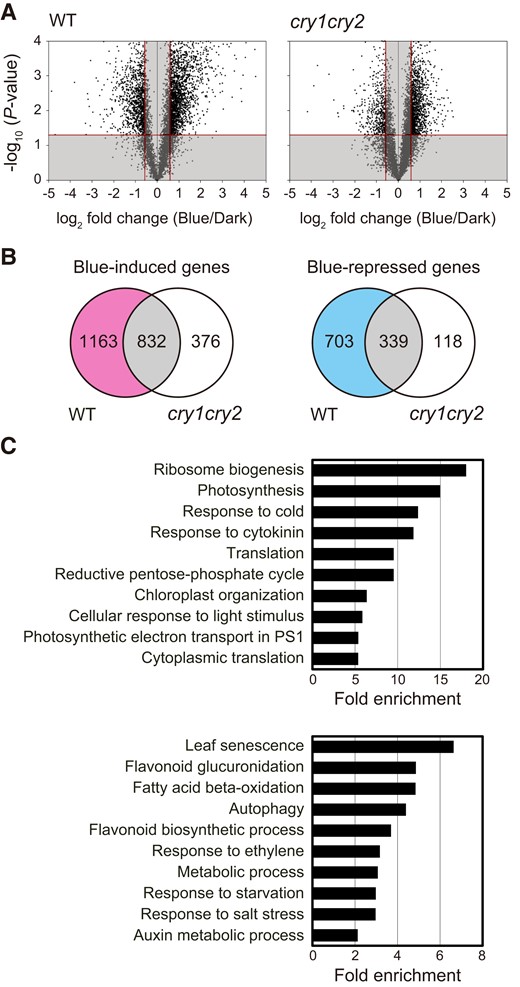
Transcriptome analysis of WT and cry1 cry2 leaves under dark and blue light conditions. A) Volcano plots displaying statistical significance (P-value) versus fold changes (Blue/Dark) in WT and cry1 cry2. The fourth leaves of WT and cry1 cry2 were pretreated with 50.0 µmol m−2 s−1 FR light for 5 min followed by incubation in darkness or under 3.0 µmol m−2 s−1 blue light for 24 h. The X-axis represents log2-fold change differences between dark and blue light conditions. The Y-axis represents statistical significance as the negative log10 of P-values. Blue-induced and blue-repressed genes by blue light were selected as described in the Materials and methods section, whereas the nonsignificant genes (indicated by the gray shade) were excluded. B) Venn diagrams displaying the number of overlapping and nonoverlapping genes between WT and cry1 cry2 in blue-induced and blue-repressed genes based on the Volcano plots in A). C) GO enrichment of CRY-upregulated (upper) and CRY-downregulated (lower) genes, which were selected by removing the overlapping genes from blue-induced and blue-repressed genes as described in the Venn diagram B), respectively. The top 10 GO terms under the biological process category are shown. GO analyses were performed using DAVID 6.8 (https://david.ncifcrf.gov/home.jsp).
Gene ontology (GO) enrichment analysis was performed on CRY-upregulated and CRY-downregulated genes to determine whether senescence-related genes were modulated downstream of cryptochromes in response to blue light. The 10 GO categories for biological processes that had the largest fold enrichment were selected and arranged from highest to lowest (Fig. 4C and Supplemental Data Set S3). The GO terms associated with photosynthesis and photosynthetic electron transport in photosystem I (PSI) were frequently represented in CRY-upregulated genes (Fig. 4C).
Hierarchical clustering heatmap analysis was performed to further investigate light-dependent gene expression patterns (Fig. 5). As expected, these photosynthesis-related genes were upregulated in WT responding to blue light, but not in cry1 cry2 (Fig. 5A). Because a decline in photosynthetic activity induces the expression of SAG genes (Hensel et al. 1993), cryptochromes might suppress leaf senescence through the promotion of photosynthetic efficiency under blue light.
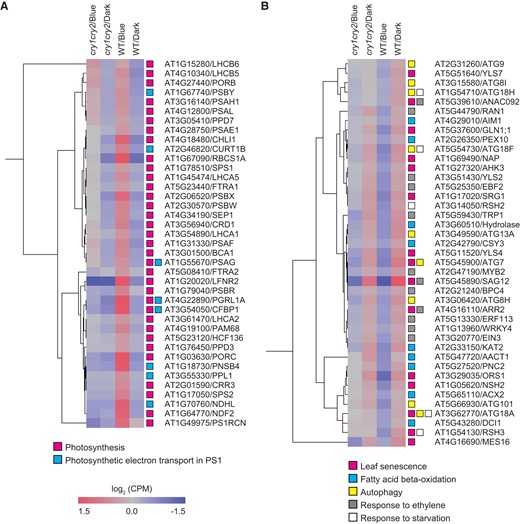
Alteration of CRY-regulated gene expression. A) and B) Heatmaps representing the expression levels of CRY-upregulated A) and CRY-downregulated B) genes selected from GO enrichment data in Fig. 4C. GO terms involved in leaf senescence are shown. Each column indicates a sample (3 biological replicates), and each row indicates a gene. The color scale indicates the processed CPM value. Colored boxes represent the GO terms classification.
GO terms associated with leaf senescence were overrepresented in CRY-downregulated genes (Fig. 4C). The GO terms related to leaf senescence, such as fatty acid beta-oxidation (Troncoso-Ponce et al. 2013), autophagy (Yoshimoto et al. 2004), response to ethylene (Sakuraba 2021), and response to starvation (Himelblau and Amasino 2001), were highly enriched in the CRY-downregulated gene set (Fig. 4C). In addition, expression levels of the NAC family genes, such as ORE1, ORE1 SISTER1 (ORS1), NAP, and ANAC046, which are key regulators of leaf senescence, were downregulated in response to blue light in a cryptochrome-dependent manner (Fig. 5B). These data clearly emphasize that the leaf senescence response was significantly downregulated by cryptochrome under blue light.
Gene expression response to blue light in WT and cry1 cry2
To better understand the enhanced leaf senescence phenotype of cry1 cry2, expression levels of senescence-related genes were examined in WT and cry1 cry2 after incubation in darkness and blue light for 3 d. WT and cry1 cry2 leaves were subjected to the light treatments shown in Fig. 1B, and senescence-related genes were analyzed by reverse transcription-quantitative PCR (RT-qPCR) analysis. These analyses revealed that the expression of SAG12 and YLS4 in WT increased in darkness, but not under blue light (Fig. 6). In addition, the expression of genes encoding positive regulators of leaf senescence (ORE1, ORS1, NAP, and ANAC046), chlorophyll degradation enzymes (SGR1 and NYC1), and autophagic components (ATG7 and ATG18A) were analyzed in WT. The expression levels of these genes in darkness were higher than those under blue light in WT (Fig. 6). By contrast, blue light irradiation did not repress the expression of these genes in cry1 cry2 (Fig. 6). These results were consistent with the observation that leaf senescence is inhibited under blue light in WT, but not in cry1 cry2 (Fig. 2C). Although the marker genes for senescence, SAG12 and YLS4, were upregulated in cry2, but not in cry1 under blue light, expression levels of other genes decreased similarly in cry1 and cry2 (Supplemental Fig. S2). Hence, leaf senescence was redundantly regulated by CRY1 and CRY2 in response to blue light. Taken together, the results thus far indicate that leaf senescence is suppressed by blue light by inhibiting the expression of senescence-related genes downstream of cryptochromes.
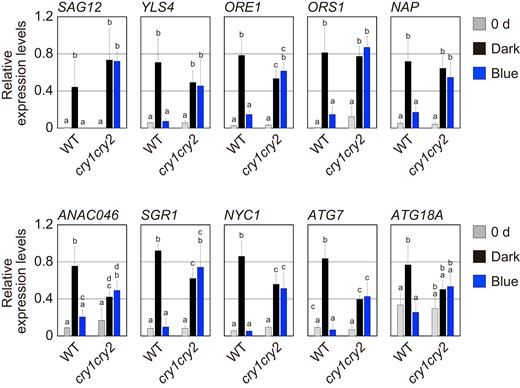
Downregulation of senescence-related genes by cryptochromes. The mRNA levels of SAG12, YLS4, ORE1, ORS, NAP, ANA046, SGR1, NYC1, ATG7, and ATG18A in the WT and cry1 cry2 fourth leaves before (0 d) and after the pretreatment with 50.0 µmol m−2 s−1 FR light for 5 min followed by incubation in darkness (Dark) or under 3.0 µmol m−2 s−1 blue light (Blue) for 3 d. The data are means ± SD (n ≥ 3). Different letters indicate statistically significant differences (P < 0.01, Tukey–Kramer test).
Analysis of the cryptochrome signaling pathway during leaf senescence
Transcriptional factors, such as CRYPTOCHROME-INTERACTING BHLH1 (CIB1) and HY5, function in Arabidopsis flowering and growth responses downstream of cryptochromes, respectively (Wang and Lin 2020). To address whether CIB1 and HY5 are involved in the leaf senescence response, changes in chlorophyll content of cib1 cib3 cib5 CIB4-RNAi quasi-quadruple and hy5 single mutants under darkness and blue light were examined. Results showed that cib1 cib3 cib5 CIB4-RNAi had a higher chlorophyll level than that of WT under 3.0 µmol m−2 s−1 blue light, but was similar to that of WT in darkness (Fig. 7A). Because of possible redundant functions among members of the CIB family, cib2 and cib4 mutations using CRISPR/Cas9-mediated gene editing in cib1 cib3 cib5 CIB4-RNAi background were generated (Supplemental Fig. S3). However, the cib multiple mutants exhibited similar leaf senescence response under different blue light fluence rate as those of WT (Fig. 7C). These data suggest that, in addition to CIBs, other factors act as cryptochromes signaling components for suppressing leaf senescence under blue light.
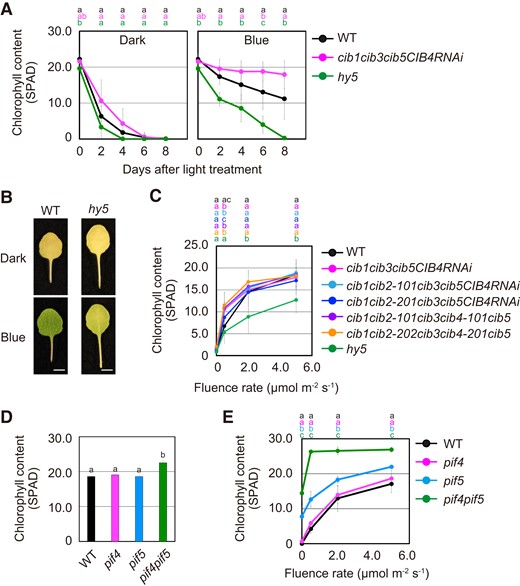
Promotion of leaf senescence in CIB family and HY5 mutants. A) Chlorophyll content of the fourth leaves of WT, cib1 cib3 cib5 CIB4-RNAi quasiquadruple, and hy5 that were incubated under the condition described in Fig. 2A. The data are means ± SD (n ≥ 8). Different letters indicate statistically significant differences at the indicated days (P < 0.01, Tukey–Kramer test). Letters are represented on top of graphs in order of corresponding to chart's legend. B) Representative images of the fourth leaves of WT and hy5 that were pretreated with 50.0 µmol m−2 s−1 FR light for 5 min followed by incubation in darkness (Dark), or under 5.0 µmol m−2 s−1 blue light (Blue) for 4 d. Scale bars = 5 mm. C) Chlorophyll content of the fourth leaves of WT, cib1 cib2 cib3 cib5 CIB4-RNAi quasiquintuple, cib1 cib2 cib3 cib4 cib5 quintuple, and hy5 that were pretreated with 50.0 µmol m−2 s−1 FR light for 5 min followed by incubation under different blue light fluence rates for 4 d. The data are means ± SD (n ≥ 8). Different letters indicate statistically significant differences at the indicated fluence rates (P < 0.01, Tukey–Kramer test). Letters are represented on top of graphs in order of corresponding to chart's legend. D) Chlorophyll content of the fourth leaves of WT, pif4, pif5, and pif4 pif5 before the treatment with experimental light conditions. Different letters indicate statistically significant differences (P < 0.01, Tukey–Kramer test). E) Chlorophyll content of the fourth leaves of WT, pif4, pif5, and pif4 pif5 was determined as for C). The data are means ± SD (n ≥ 6). Different letters indicate statistically significant differences at the indicated fluence rates (P < 0.01, Tukey–Kramer test). Letters are represented on top of graphs in order of corresponding to chart's legend.
In contrast to cib1 cib3 cib5 CIB4-RNAi, reduction in leaf chlorophyll content occurred more rapidly in hy5 than in WT under blue light (Fig. 7, A and B). Furthermore, similar to cryptochrome-deficient mutants (Fig. 3A), the photosensitivity to blue light in the leaf senescence response was attenuated in the hy5 mutant (Fig. 7C, Supplemental Fig. S4). Because the HY5 protein positively regulates photomorphogenesis, as evident from blue light inhibition of hypocotyl elongation, HY5 is partly required for the suppression of leaf senescence downstream of cryptochromes.
We further examined the function of PIF4 and PIF5 in the leaf senescence response to blue light. In the pif4 mutant, the leaf senescence phenotype was almost comparable to that of the WT (Fig. 7, D and E). Although inhibition of leaf senescence was observed in pif5 regardless of blue light fluence rates, leaf senescence was strongly inhibited in pif4 pif5 under low blue light (Fig. 7, D and E). It has been reported that both PIF4 and PIF5 are responsible for blue light-regulated growth responses through the direct interaction with photoactivated cryptochromes (Pedmale et al. 2016). Hence, PIF4 and PIF5 might be able to promote leaf senescence redundantly in the absence of the blue light signals.
Discussion
Regulation of leaf senescence by cryptochromes in the shade
The leaf senescence response is regulated by phytochromes (De Greef and Fredericq 1972). However, phytochromes are not the only photoreceptors that control this response because the eliminating phytochrome Pfr was unable to promote leaf senescence under blue light (Fig. 1F). Sakuraba et al. (2014) reported that cry1 cry2 leaves exhibit normal senescence when incubated in the dark for 3 d. Consistent with this report (Sakuraba et al. 2014), WT and cry1 cry2 showed similar reductions in leaf chlorophyll content in darkness for 8 d (Fig. 2C). Furthermore, leaf senescence under blue light was suppressed in WT, but not in cry1 cry2 (Fig. 2, B and C), suggesting that cryptochromes are essential for inhibition of leaf senescence in response to light conditions. Because chlorophyll degradation of cry1 cry2 was significantly delayed under blue light compared to in darkness (Fig. 2C), it remains possible that the other blue light photoreceptors, in addition to cryptochromes, are involved in the suppression of leaf senescence.
Under the canopy shade cast by neighboring vegetation, the ratio of red-to-FR light is decreased, and the fluence rate of blue light is attenuated because of the absorbance of blue and red wavelengths by chlorophyll. Plants utilize multiple photoreceptors, such as phytochromes and cryptochromes, to adapt to the shade. The change in the ratio of red-to-FR light is recognized by phytochromes, which regulate signaling pathways that lead to shade avoidance responses (Whitelam and Smith 1991). Responses to the shade include the promotion of petiole and stem growth, and leaf senescence. In addition, attenuation of blue light under shade is perceived by the blue light photoreceptors, cryptochromes, to elicit the shade avoidance responses (Kozuka et al. 2005, Keller et al. 2011, Keuskamp et al. 2011). Hence, the involvement of cryptochromes in the regulation of leaf senescence supports the view that the promotion of leaf senescence is particularly pronounced under dense canopies, in which both phytochromes and cryptochromes are strongly inactivated.
It is notable that the cooperative regulation of phytochromes and cryptochromes in leaf senescence provides substantial adaptation to the various shade environments. For example, the edge of a bush or gaps in the forest floor are called open shade. Under the open shade, there is a larger incidence of blue and FR light, whereas red light levels are lower (Stoutjesdijk 1974). Even if phytochrome Pfr is eliminated under open shade, cryptochromes might be able to suppress leaf senescence through the absorption of sufficient blue light. Because the blue wavelength is highly effective for photosynthesis, regulation of leaf senescence by cryptochromes provides an adaptive growth advantage under open shade. This idea is not surprising given the relationship between phytochromes and cryptochromes. As discussed below, signaling pathways downstream of these photoreceptors might converge on shared molecular components to regulate the leaf senescence response.
Signaling mechanisms of cryptochromes in leaf senescence
Photoactivated CRY2 physically interacts with CIB1, which promotes transcription of FLOWERING LOCUS T (FT) for accelerated flowering in Arabidopsis (Liu et al. 2011). The CRY2a–CIB1 interaction also represses WRKY53b transcription to delay senescence in soybean (Meng et al. 2013). However, we found that leaf senescence was hardly delayed in cib1 cib2 cib3 cib4 cib5 quintuple mutants in darkness (Fig. 7A). Furthermore, in Arabidopsis, although WRKY53 expression levels strongly decreased under darkness and blue light in WT and cry1 cry2, the extent of its downregulation was similar between the two light conditions and genotypes (Supplemental Fig. S5). Because CIB1-related proteins, such as CIL1, BEE2, and HBI1, also interact with cryptochromes in Arabidopsis (Wang et al. 2018), it is likely that the physiological function of the CRY–CIB module varies among different plant species.
Cryptochromes interact with PIFs, which have roles in phytochrome-regulated photomorphogenesis. Photoactivated CRY1 and CRY2 proteins directly interact with PIF4 and PIF5, affecting their function and accumulation (Pedmale et al. 2016). A double mutant lacking PIF4 and PIF5 showed a delayed senescence phenotype (Sakuraba et al. 2014). Similarly, the leaf senescence response was strongly suppressed by the pif4 and pif5 mutations under blue light (Fig. 7, D and E). Furthermore, PIF4 and PIF5 proteins are stabilized in darkness and activate the transcription of genes involved in leaf senescence. Hence, similar to the phytochrome-PIF system, it is possible that cryptochromes regulate leaf senescence by suppressing the function of PIFs under blue light.
It is noteworthy that HY5 acts as a negative regulator of leaf senescence under blue light (Fig. 7A, Supplemental Fig. S4). The HY5 protein is stabilized by light. Furthermore, photoactivated cryptochromes interact with SUPPRESSOR OF PHYA-105 (SPA) 1 to disrupt the CONSTITUTIVE PHOTOMORPHOGENIC 1 (COP1) ubiquitin ligase complex, which mediates HY5 protein degradation (Saijo et al. 2003). In addition, 30% of putative HY5 target genes are related to senescence (Ay et al. 2014). Taken together, these results suggest that cryptochromes regulate leaf senescence by inhibiting HY5 degradation under blue light. HY5 has a homologous gene, called HY5-HOMOLOG (HYH), in the bZIP family of transcription factor genes. Therefore, functional redundancy could explain why the hy5 single mutant showed a weaker senescence phenotype than that of cry1 cry2. The transcriptional regulation of senescence-related genes by HY5 and HYH provides a possible mechanism for the suppression of leaf senescence.
Leaf senescence is proposed to be under the control of several NAC transcription factors, which activate genes encoding chlorophyll-degrading enzymes and other senescence-associated transcription factors (Sakuraba 2021). The cryptochrome-dependent downregulation of ORE1, ORS1, NAP, and ANAC046 in response to blue light observed here (Fig. 6) is consistent with the NAC-mediated modulation of leaf senescence. Moreover, SGR1 and NYC1 expression was dramatically suppressed by blue light in WT, but not in cry1 cry2 (Fig. 6). Therefore, transcriptional regulation of these NAC genes downstream of both phytochromes and of cryptochromes may be crucial for the induction of leaf senescence.
Transcriptomic analysis of blue light-repressed leaf senescence
Transcript profiling has been used to elucidate how phytochrome controls leaf senescence (Sakuraba et al. 2014; Song et al. 2014). The transcriptomic data presented here provide insights into the mechanisms by which cryptochromes regulate leaf senescence in response to blue light. Enriched GO categories for cryptochrome-downregulated genes included leaf senescence, response to ethylene, fatty acid beta-oxidation, autophagy, and response to starvation (Figs. 4 and 5).
The above GO pathways are known to be involved in leaf senescence. For example, perception of the shade stimulus leads to elevated ethylene, whereas ethylene production is inhibited by phytochrome (Pierik et al. 2004). The observation that ethylene release in WT, but not in cry1 cry2, was lower under blue light than that in darkness (Supplemental Fig. S6) shows that ethylene biosynthesis may be controlled by cryptochromes. In addition, the turnover of fatty acids through beta-oxidation accompanies the progression of leaf senescence (Troncoso-Ponce et al. 2013). Consistent with previous reports, ACETOACETYL-COA THIOLASE 1 (AACT1) and 3-KETOACYL-COA THIOLASE 2 (KAT2), which encode major enzymes that catalyze steps in fatty acid beta-oxidation (Ahumada et al. 2008), were downregulated under blue light in a cryptochrome-dependent manner (Fig. 5B).
Autophagy is responsible for cellular recycling during leaf senescence (Yoshimoto et al. 2004), including nonspecific bulk and organelle-specific degradations (Wada et al. 2009). Autophagy-associated gene expression is activated by light-to-dark transition through histone modification-mediated dissociation of HY5 (Yang et al. 2020). Because ATG gene expression was repressed by blue light in WT, but not in cry1 cry2 (Fig. 6), the activation of autophagy during leaf senescence might be modified by transcriptional regulation downstream of cryptochromes. Alternatively, it is possible that autophagy is activated by starvation during leaf senescence. This possibility is supported by the previous report that induction of autophagy by nitrogen- and carbon-starvation leads to nutrient recycling during leaf senescence (Yoshimoto et al. 2004). Furthermore, photosynthetic activity in cry1 cry2 was lower than that of WT under blue light (Fig. 3B) and photosynthesis-related genes were not upregulated in this mutant (Fig. 5A). Declined photosynthetic activity and gene expression likely resulted in leaf starvation (Fig. 5B). Taken together, these results presented here point to the possibility that cryptochromes are involved in the regulation of autophagy-mediated turnover during leaf senescence. Further analysis is needed to reveal the signaling networks and cellular process that govern the leaf senescence response to light environments.
Materials and methods
Plant materials
The Arabidopsis (A. thaliana) Columbia (Col-0) accession was used as the WT. The cry1-304 (Mockler et al. 1999); cry2-1 (Guo et al. 1998); cry1-304 cry2-1 (Lascève et al. 1999); hy5-215 (Oyama et al. 1997); pif4-102, pif5-3, and pif4-102 pif5-3 (Sun et al. 2013); and cib1 cib3 cib5 CIB4-RNAi (Liu et al. 2011) mutants were in the Col-0 background. The transgenic plants expressing GFP-CRY2 and CRY2-GFP were in the cry1-304 cry2-1 background (Yu et al. 2009). Generation of cib2 and cib4 mutations was performed using the CRISPR/Cas9 system, as essentially described previously (Yamatani et al. 2022). The oligonucleotides designed for genome editing are listed in Supplemental Table S1.
Growth conditions and light sources
Seeds were sown on moistened soil, which consisted of Jiffy-Mix (Sakata Seed Corporation) and vermiculite at a ratio of 3:1, and kept at 4 °C in darkness for 3 d. The seeds were then placed under a 10-h white light (70 µmol m−2 s−1)/14-h dark short-day cycle at 23 °C. White light was provided by cool white light fluorescence tubes (FL20SEX-N-HG; NEC). Monochromatic blue, red, and FR light were provided by light-emitting diodes with maximum wavelengths of 452, 662, and 734 nm, respectively (ISL-150X150-FRB45; CCS). The spectrums of these monochromatic light sources are shown in Supplemental Fig. S7.
Analysis of leaf senescence
Leaves were numbered beginning with the first rosette leaves that emerged after the cotyledons. Senescence parameters were measured on mature fourth leaves, which were detached by cutting along the basal part of the petiole. The temporal pattern of the leaf formation varied among genotypes (Supplemental Fig. S8). Leaves at an equivalent development stage were collected at 7 d after young leaf blades emerged from the shoot apex. The fourth leaves of WT, cry1, cry2, and cry1 cry2 seedlings grown under the short days became macroscopically visible at 17, 18, 19, and 20 d after germination, respectively (Supplemental Fig. S8). A single detached leaf was placed into each well of a 24-well plate and incubated at high humidity in darkness or under different light wavelengths. Chlorophyll content was determined with a SPAD-502 chlorophyll meter (Konica-Minolta) on different days after light treatment. Measurements of Fv/Fm value and ethylene concentration were performed as described previously (Ueda and Kusaba 2015).
Statistical analysis
Statistical analysis was performed with a 2-tailed Student's t-test using Microsoft Excel for one comparison and with Tukey–Kramer test using R (version 4.1.2) for pairwise multiple comparison. Details of data representation and the number of replicates were indicated in the relevant Figure legends.
CAGE-seq analysis
Biological triplicates for each light condition were subjected to CAGE-seq analysis. Total RNA was prepared from the fourth leaves, which were collected from 3 individual plants, using TRI Reagent (Sigma-Aldrich, St. Louis, MO, USA) following the manufacturer's instructions. The samples were further purified using the ISOSPIN Plant RNA kit (Nippon Gene). The total RNA quality was assessed with a Bioanalyzer to ensure that the RNA integrity number (RIN) was above 7.0. CAGE libraries were constructed using a CAGE library preparation kit, following the manufacturer's instructions (DNAFORM). CAGE libraries were sequenced using single-end reads of 75 nt on a NextSeq 500 instrument (Illumina). The obtained reads (CAGE tag) were mapped to the Arabidopsis genome (TAIR 10) using Burrows–Wheeler aligner (BWA version 0.5.9). CAGE tag clustering was performed by the RECLU pipeline (Ohmiya et al. 2014). Clusters with count per million (CPM) <0.1 were discarded. Regions that had 90% overlap between replicates were extracted, and the clusters with irreproducible discovery rate >0.1 and clusters longer than 200 bp were discarded. The sum of the CAGE tags clustered in each corresponding gene was considered the gene-level expression value, and expression values were normalized to CPM data (Supplemental Data Set S4).
Transcriptomic data analysis
The CPM data were processed and analyzed using the Subio Platform (ver. 1.24.5849) and Subio Basic Plug-in (https://www.subioplatform.com). The raw value data were processed with Log Transformation (base 2), Low Signal Cutoff (mean raw signal <5.0, Replace), Fill Missing Value (replaced with 1.5), and Centering (with mean value in each sample). To verify the reliability of the data, genes in which raw values were more than 5 in >70% of the samples in each group were selected and filtered. Next, genes in which the mean values of processed signals at each sample group displayed a range between −0.3 and 0.3 were filtered out as unreliable data. Subsequently, subsets of the triplicate samples with statistically different or similar expression levels between dark and blue light treatment were compared. Genes that displayed more than a 1.5-fold increase and decrease by blue light with the false discovery rate (P < 0.05; Student's t-test) were collected as blue-induced and blue-repressed genes, respectively. The lists of these genes in the WT and cry1 cry2 were considered as robust sets of differentially expressed genes in response to the blue light. GO analysis was performed using the Database for Annotation, Visualization, and Integrated Discovery (DAVID) ver. 6.8 (https://david.ncifcrf.gov/) with GOTERM_BP_ALL.
RT-qPCR analysis
Total RNA was prepared from the fourth leaves, which were collected from 3 individual plants, using TRI Reagent (Sigma-Aldrich). Complementary DNA (cDNA) was synthesized with the oligo (dT) primer using the ReverTra Ace qPCR Master Mix (Toyobo) and DNase I RNase free grade (Nippon Gene), following the manufacturer's instructions. RT-qPCR analysis was performed using the KAPA SYBR FAST qPCR kit (Nippon Genetics) and the Roter-Gene Q 2PLEX (Qiagen). The primers designed for RT-qPCR are listed in Supplemental Table S2. Because the transcript data of Actin8 (ACT8) obtained from the CAGE analysis showed no significant differences among samples (Supplemental Fig. S9), ACT8 was used as a reference to normalize the expression levels of each gene.
Data availability
Sequence data from this article can be found in the GenBank/EMBL data library under the following accession numbers: AT4G08920 (CRY1), AT1G04400 (CRY2), AT5G11260 (HY5), AT4G34530 (CIB1), AT5G48560 (CIB2), AT3G07340 (CIB3), AT1G10120 (CIB4) AT1G26260 (CIB5), AT2G43010 (PIF4), AT3G59060 (PIF5), AT5G45890 (SAG12), AT5G11520 (YLS4), AT5G39610 (ORE1), AT3G29035 (ORS1), AT1G69490 (NAP), AT3G04060 (ANAC046), AT4G22920 (SGR1), AT4G13250 (NYC1), AT5G45900 (ATG7), AT3G62770 (ATG18A), and AT4G23810 (WRKY53). The CAGE data are deposited at the GenBank BioProject under accession number PRJNA846134.
Acknowledgments
We are grateful to Drs. Chentao Lin (UCLA), Hongtao Liu (Chinese Academy of Science), Tomonao Matsushita (Kyoto University) and Jun Hidema (Tohoku University) for providing plant materials, and Mr. Shinya Sudo (Hiroshima University) for helpful support. This work was supported by NIBB Collaborative Research Experiment for the Okazaki Large Spectrograph (14-511) to K.K.
Author contributions
T.K., K.K., and M.K. conceived the research. T.K. designed the research and wrote the article. T.K. performed the experiments. Y.O. provided technical support and suggestions. T.K. and M.K. supervised the research.
Supplemental data
The following materials are available in the online version of this article.
Supplemental Figure S1. Effect of monochromatic light on leaf senescence.
Supplemental Figure S2. RT-qPCR analysis for the expression of senescence-related genes in cry1 and cry2.
Supplemental Figure S3. Generation of CIB2 and CIB4 mutants by the CRISPR/Cas9 system.
Supplemental Figure S4. Leaf senescence response to blue light in cry1 cry2 and hy5 mutants.
Supplemental Figure S5. Expression pattern of WRKY53 under different light conditions.
Supplemental Figure S6. Effect of blue light on ethylene production in WT and cry1 cry2.
Supplemental Figure S7. Spectral photon irradiance of light sources.
Supplemental Figure S8. Time course of leaf emergence in wild type, cry1, cry2, and cry1 cry2.
Supplemental Figure S9. Transcript abundance of ACT8.
Supplemental Table S1. Oligo sequences designed for genome editing.
Supplemental Table S2. Primer sequences designed for RT-qPCR analysis.
Supplemental Data Set S1. Lists of blue-induced and -repressed genes in wild type and cry1 cry2.
Supplemental Data Set S2. Lists of overlapping and non-overlapping blue-responsive genes between wild type and cry1 cry2.
Supplemental Data Set S3. Lists of the functional annotation records in the CRY-upregulated and downregulated genes.
Supplemental Data Set S4. Lists of the raw CAGE data and counts normalized to CPM.
Funding
This work was supported by Grant-in-Aid for Scientific Research C from the Japan Society for the Promotion of Science [grant numbers 16K07405 and 21K06232 (to T.K.), Fund for the Promotion of Joint International Research from the Japan Society for the Promotion of Science [grant number 18K19964 (to Y.O.)], and the Core Research for Evolutional Science and Technology (to M.K.).
References
Author notes
Present address: Astrobiology Centre, National Institutes of Natural Sciences, Mitaka, Japan/Department of Biological Sciences, Graduate School of Science, The University of Tokyo, Tokyo, Japan.
The author responsible for distribution of materials integral to the findings presented in this article in accordance with the policy described in the Instructions for Authors (https://dbpia.nl.go.kr/plcell) is: Toshiaki Kozuka ([email protected]).
Conflict of interest statement. The authors declare that they have no conflict of interest with this article.
