


Abstract
DNA–protein interaction is one of the most crucial interactions in biological processes. However, the technologies available to study DNA–protein interactions are all based on DNA hybridization; however, DNA hybridization is not highly specific and is relatively low in efficiency. RNA-guided DNA recognition is highly specific and efficient. To overcome the limitations of technologies based on DNA hybridization, we built a DNA-binding protein capture technology based on the clustered regularly interspaced palindromic repeats (CRISPR)–dead Cas9 (dCas9) system and transient genetic transformation, termed reverse chromatin immunoprecipitation based on CRISPR–dCas9 system (R-ChIP–dCas9). In this system, dCas9 was fused with Strep-Tag II to form a fusion protein for StrepTactin affinity purification. Transient transformation was performed for the expression of dCas9 and guide RNA (gRNA) to form the dCas9–gRNA complex in birch (Betula platyphylla) plants, which binds to the target genomic DNA region. The dCas9–gRNA–DNA complex was crosslinked, then the chromatin was sonicated into fragments, and purified using StrepTactin beads. The proteins binding to the target genomic DNA region were identified using mass spectrometry. Using this method, we determined the upstream regulators of a NAM, ATAF, and CUC (NAC) transcription factor (TF), BpNAC090, and 32 TFs potentially regulating BpNAC090 were identified. The reliability of R-ChIP–dCas9 was further confirmed by chromatin immunoprecipitation, electrophoretic mobility shift assays, and yeast one-hybrid. This technology can be adapted to various plant species and does not depend on the availability of a stable transformation system; therefore, it has wide application in identifying proteins bound to genomic DNA.
Introduction
The interaction between DNA and proteins plays a dominant role in genome maintenance, gene expression regulation, DNA replication, DNA repair, DNA packing, recombination, and RNA transport, as well as in epigenetic regulation and signal transduction. In addition, DNA-binding proteins, such as transcription factors (TFs), polymerases, methyltransferases, and histones, are ubiquitous in organisms. The average organism has about 2,000 DNA-binding proteins, which comprise on average 10% of the proteome/genome of land plants and animals, and can bind to short stretches of DNA to regulate gene expression and chromatin structure (Brand et al., 2013). DNA-binding proteins play a central role in DNA replication, transcription, recombination, repair, and various other cellular activities. Thus, the investigation of DNA–protein interactions is very important to understand these fundamental cellular processes.
Several methods to identify DNA–protein interactions have been developed. These methods can be classified into two complementary methods, that is the TF-centered or protein to DNA approach, and gene-centered or DNA to protein approach, according to their study aims. In the TF-centered approach, a set of TFs or a single TF of interest is used to investigate the DNA sequences bound by these TFs or TF. These methods include the systematic evolution of ligands by exponential enrichment (Zhao, et al., 2009), chromatin immunoprecipitation (ChIP), DNA adenine methyltransferase identification (Van Steensel et al., 2001), and protein-binding microarrays (Berger et al., 2006). In contrast, the gene-centered approach refers to one or more DNA sequences used as preys to investigate TFs that bind to these DNA elements. These methods mainly include yeast one-hybrid (Y1H), proteomics of isolated chromatin segments (PICh) (Déjardin and Kingston, 2009), and Reverse ChIP (R-ChIP; Wen et al., 2020). The most widely used gene-centered approach is Y1H. In Y1H, the proteins are exogenously expressed in yeast cells, the expressed proteins interact with the DNA bait in vivo to activate the downstream reporter gene, and the target proteins are selected according to the product of the reporter gene. The PICh and R-ChIP methods analyze the interaction between DNA and protein in vivo. In these technologies, specific DNA sequences are used as probes to isolate chromatic DNA with its associated proteins, followed by mass spectrometry analysis to identify all the proteins binding to the targeted DNA locus. Both PICH and R-ChIP can isolate the targeted DNA locus-associated proteins and, especially, they can identify the TFs that bind to the known DNA elements. Therefore, these methods are of great value in the determination of DNA–protein interaction and isolation of targeted DNA-binding proteins. However, both PICH and R-ChIP are dependent on in vitro DNA hybridization, which is complex, inefficient, and unspecific. There is still lack of in vivo gene-centered approach for identifying DNA-binding proteins.
The clustered regularly interspaced palindromic repeats (CRISPR)–CRISPR-associated sequence (Cas) system can store memory of the infected viral DNA in bacterial host chromosomes to prevent phage infection. This system includes viral DNA separated by repetitive nucleotide sequences. These repetitive nucleotide sequences are surrounded at the near end by the DNA sequences encoding Cas proteins (Jiang and Doudna, 2017). The RNA-guided DNA recognition features high specificity and high efficiency, making the CRISPR–Cas system a perfect choice for gene editing applications (Verwaal et al., 2018; Khan et al., 2019).
In the type II CRISPR–Cas9 system, Cas9 has two nucleolytic domains (RuvC and HNH) that cleave target DNA strands to generate double-stranded breaks (Jinek et al., 2012). When point mutations were introduced into each domain (D10A and H840A, correspondingly), the nucleolytic activity of Cas9 is blocked, but its target binding is not impacted (Qi et al., 2013). This mutant protein, lacking Cas9 endonuclease activity and known as dead Cas9 (dCas9), has substantially expanded the application of the CRISPR–Cas9 system. The CRISPR/dCas9 system can be used as a programmable vector to deliver transcriptional effectors to target sites at the genome for targeted transcriptional activation (CRISPR activation, CRISPRa) or transcriptional repression (CRISPR interference, CRISPRi). In addition, previous studies indicated that dCas9 could interfere with the transcriptional machinery or hinder RNA PolII to function as a transcriptional repressor (Qi et al., 2013). Piatek et al. (2015) fused dCas9 with the EDLL domain (dCas9:EDLL) and the TAL activation domain (TAD; dCas9:TAD), which can serve as synthetic transcriptional activators. At the same time, they also generated a synthetic transcriptional repressor by fusing dCas9 with the ERF-associated amphiphilic repression (EAR) SRDX repression domain from the ETS2 repressor factor (ERF) TF. In theory, the CRISPR–dCas9 system can specifically recognize the DNA site and without the nucleolytic activity, it can be used to capture the DNA region of interest to investigate the proteins that bind to this region. However, methods based on CRISPR–dCas9 to capture DNA fragments have been rarely reported.
The technology available for studying proteins bound by a certain DNA sequence has been limited. In addition, these technologies are all based on DNA hybridization, that is single-stranded DNA (ssDNA) probes used to hybridize with the target DNA sequence. This kind of technology requires high temperature for DNA denaturing and hybridization. However, the efficiency of DNA hybridization is low and may cause protein degradation when under high-temperature conditions. At the same time, DNA hybridization is not very specific, especially when under low-temperature conditions. As RNA-guided DNA recognition is highly specific and efficient (Verwaal et al., 2018; Khan et al., 2019), the CRISPR system is specific and efficient in binding to the target DNA compared with DNA hybridization. In the present study, we explored a system that can bind to the target site of a genome based on CRISPR–dCas9, termed reverse chromatin immunoprecipitation based on CRISPR–dCas9 system (R-ChIP–dCas9). When combined with transient genetic transformation, this method can capture the DNA region of interest in the genomes of plant species quickly and specifically. This method might have great potential in DNA–protein interaction studies.
Results
The principle of R-ChIP–dCas9
When dCas9 (dead Cas9) is fused with the Strep-Tag II in frame (termed as dCas9–Strep), it can be affinity purified using StrepTactin beads. Dead Cas9 can bind to the target DNA specifically without cleaving the DNA strand; therefore, it can be used to bind to the target DNA locus. In addition, dCas9 can be made to bind to the target genomic region by designing the guide RNA (gRNA) sequences according to target genomic sequence. After designing the gRNA and transient transformation, the dCas9–Strep protein will bind to the target genomic DNA region (Figure 1). Formaldehyde was used to crosslink dCas9–Strep fusion protein and chromatin; at the same time, the proteins bound to the chromatin were also crosslinked together. The crosslinked chromatin was then fragmented by sonication (Figure 1). After sonication, the truncated chromatins bound by dCas9–Strep were purified using StrepTactin beads. The beads were washed to remove background noise, and the proteins binding to the target genomic DNA region were enriched (Figure 1). After collection, the proteins bound by target genomic DNA region can be analyzed using mass spectrometry.
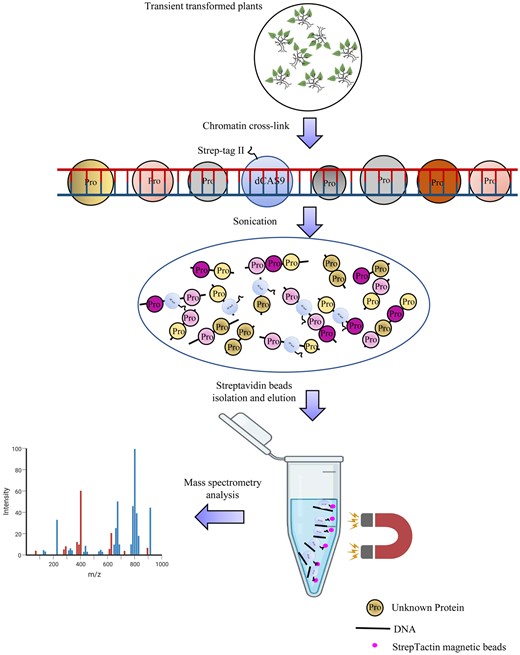
The principle of R-ChIP–dCas9. Dead Cas9 (dCas9) is fused with Strep-Tag II to generate a dCas9–Strep fusion gene (still termed as dCas9 in this figure), and the gRNA is designed to bind to the target genomic DNA region. After transient transformation, the dCas9–gRNA complex binds to the target DNA site and is then crosslinked using formaldehyde. After crosslinking, the chromatin is sonicated into short fragments, and then is purified using StrepTactin beads to isolate the DNA fragments bound by dCas9–Strep. The proteins bound to the target DNA region are enriched in the purified DNA fragments and are directly analyzed using mass spectrometry.
The procedure of R-ChIP–dCas9
As a first step, the gRNAs were synthesized according to the experimental requirement. The dCas9–Strep-Tag II vector harboring the gRNA was then constructed. Transient transformation was performed, enabling the dCas9–Strep protein to be expressed in the plants and bind to the target DNA site recognized by the gRNA. At 24 h after transformation, the transformed plants were treated with abiotic stress or not, according to the requirements of the experiment. Within 72 h of transformation, the plants were harvested and treated with formaldehyde to crosslink proteins and DNA. At the same time, an aliquot of sample was taken for analysis of the binding of dCas9 to the target DNA. If dCas9 was shown to bind to the target DNA region, the experiment was continued. Nuclei were then purified to isolate chromatin, and the chromatin was sonicated into 200-1,000-bp fragments. The sonicated chromatin was purified using StrepTactin beads. The beads were washed to remove the background noise, and the enrichment efficiency was calculated. Finally, the proteins bound by chromatin were analyzed using mass spectrometry (Figure 2).
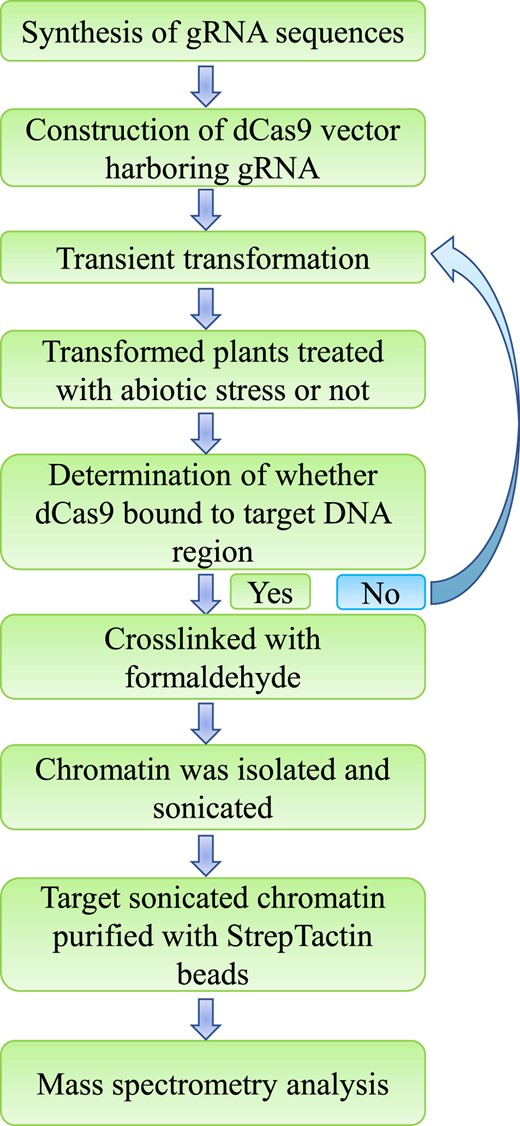
The procedure of R-ChIP–dCas9. The experiment was designed and gRNA were synthesized according to the experiment as required. dCas9 was fused with Strep-Tag II to form the dCas9–Strep fusion gene (termed as CRISPR–dCas9 system here). DNA sequences of gRNA were artificially synthesized to construct the CRISPR–dCas9 plant expression vector harboring dCas9–Strep fusion gene and sgRNA. Transient transformation was performed on the host plants, and the transformed plants were treated with abiotic stress or not (according to the need of the experiment) after transformation for 24 h. For instance, in this study, the plants were treated with 20% PEG6000 for 3 h. If no treatment was needed, the plant material could be used directly for study. The detection of transformation was first performed to ensure that the dCas9–gRNA complex had bound to the target DNA site. If the transgene was not expressed successfully, the transient transformation procedure was repeated until the transgene was successfully expressed. The protein–DNA were crosslinked with formaldehyde, and the cell nuclei were harvested. Chromatin was isolated from nucleus and sonicated into fragments. After sonication, StrepTactin beads were used to isolate the genomic DNA bound by dCas9. The proteins bound by target genomic DNA site were enriched and were directly analyzed using mass spectrometry.
Detection of dCas9–Strep transient expression
When dCas9 is transformed into plants and binds to the promoter region of a gene, it might induce gene expression silencing. Therefore, we can determine the expression of the studied gene to detect whether dCas9 had bound to the target DNA region. In this study, we used the promoter of BpNAC090 in birch (Betula platyphylla) for study. First, four gRNAs that target different regions of the BpNAC090 promoter were designed. Then, transient transformation was performed using the different gRNAs. At the same time, the empty vector dCas9 (without gRNA) was also transiently transformed as a control (Figure 3). At 24 h after transformation, these transiently transformed plants were treated with polyethylene glycol (PEG) 6000 for 24 h. Total RNA was extracted from the plants and was reverse transcribed into cDNA. Primers were designed in the coding sequences (CDS) region of BpNAC090 (Genbank number: MW202042) and were used for expression analysis using reverse transcription–quantitative polymerase chain reaction (RT–qPCR). The expression of BpNAC090 was markedly decreased by transformation with dCas9 and each gRNA (Figure 3), indicating that dCas9–Strep was successfully expressed and bound to the target DNA region of BpNAC090. Therefore, the experiment continued.
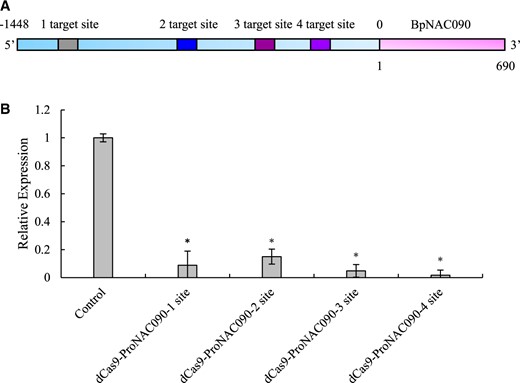
Detection of the binding of dCas9–gRNA complex to the target genomic DNA region. Four target DNA sites for dCas9 binding were designed, gRNAs were synthesized accordingly to construct the CRISPR–dCas9 plant expression vector for each gRNA, and the constructed CRISPR–dCas9 vector was transformed into Agrobacterium tumefaciens. Then, transient transformation was performed for each constructed CRISPR–dCas9 vector, respectively. At the same time, dCas9–Strep without gRNA was also transiently transformed as the negative control. Silenced expression of BpNAC090 induced when dCas9 bound to the promoter of BpNAC090 was detected using RT–qPCR. Three independent experiments were performed. Error bar indicates standard deviation (Sd) from the three experiments. A t test was performed. Asterisk indicates significant (*P < 0.05, t test) difference from the negative control. In panel A, 0 indicates translation initiation site (TIS).
Determination of enrichment efficiency
To determine the upstream regulators of BpNAC090, two samples were set. One was the test sample, in which dCas9–Strep harboring the gRNA target to different BpNAC090 promoter sites was used. The other was the control sample, in which dCas9–Strep without the gRNA was used. Before mass spectrometer analysis, the enrichment of R-ChIP–dCas9 was determined. The relative abundance of the target DNA site was detected by using qPCR. The enrichment was calculated by the relative abundance of the target DNA in test sample (sample 2) divided by that in input (sample 1). The four target DNA sites were detected, respectively. The result showed that the enrichment of the four truncated promoter (DNA sites) of BpNAC090 ranged from 1,000- to 1,500-fold (Figure 4A), indicating that the target genomic DNA region had been successfully enriched.
![Enrichment of R-ChIP–dCas9 and gene ontology (GO) analysis of the proteins identified. A, Determination of the enrichment of the truncated promoter of BpNAC090 using R-ChIP–dCas9 technology. The abundance of the target genomic DNA region (i.e. truncated promoter of BpNAC090) was calculated using the product of R-ChIP–dCas9 (sample 2, test) and input (sample 1, control) as real-time PCR templates. The relative enrichment was calculated as 2−{[Ct(tar/test) − Ct(int/test)] − [Ct(tar/input) − Ct(int/input)]}. Ct: the cycle threshold. Ct (int/input): the Ct value of internal reference in input sample; Ct (tar/input): the Ct value of the truncated promoter of BpNAC090 in input sample; Ct (int/test): the Ct value of internal reference in test sample; Ct (tar/test): the Ct value of the truncated promoter of BpNAC090 in test sample. Three independent experiments were performed. Error bar indicates standard deviation (Sd) from the three experiments. A t test was performed. Asterisk indicates significant (***P < 0.001, t test) difference from the input sample. B, GO analysis of the identified proteins bound to the promoter of BpNAC090 captured by using R-ChIP–dCas9. The proteins captured by R-ChIP–dCas9 were identified using mass spectrometry, and then were functionally annotated with GO terms.](https://oup.silverchair-cdn.com/oup/backfile/Content_public/Journal/plphys/191/3/10.1093_plphys_kiac506/1/m_kiac506f4.jpeg?Expires=1747952348&Signature=0eYs0TskNVwlZOTp5H3cQbvNFAyXXsqzbYx85BQhRdvupWVk5ley4qJ~Jfko40-Qe60JcZRlINt~zAqmpMnIaMhgoWN~t9FueAyJsLhDN8bu4BFAlAc5JMsDNnAxrSwxME5GIrBL~Pw4hUzPsc-jjUPXvOrVEd-vwpsncfcovoTTCyMWza7824dFstQ0H3Rol106v2TQL4-iLoDbTn1jPG5jW~82PXN4k3bO7FC0uYJHJ8AgxYnnfGDtqssCTtdBt7mRley5BtjXtEehaTKc2J-EXj2kc23vIVllLd1lgjuxg~eixu6iC4RZD3zpVpHoE7rUjg7jyqUwzGudtHJmZw__&Key-Pair-Id=APKAIE5G5CRDK6RD3PGA)
Enrichment of R-ChIP–dCas9 and gene ontology (GO) analysis of the proteins identified. A, Determination of the enrichment of the truncated promoter of BpNAC090 using R-ChIP–dCas9 technology. The abundance of the target genomic DNA region (i.e. truncated promoter of BpNAC090) was calculated using the product of R-ChIP–dCas9 (sample 2, test) and input (sample 1, control) as real-time PCR templates. The relative enrichment was calculated as 2−{[Ct(tar/test) − Ct(int/test)] − [Ct(tar/input) − Ct(int/input)]}. Ct: the cycle threshold. Ct (int/input): the Ct value of internal reference in input sample; Ct (tar/input): the Ct value of the truncated promoter of BpNAC090 in input sample; Ct (int/test): the Ct value of internal reference in test sample; Ct (tar/test): the Ct value of the truncated promoter of BpNAC090 in test sample. Three independent experiments were performed. Error bar indicates standard deviation (Sd) from the three experiments. A t test was performed. Asterisk indicates significant (***P < 0.001, t test) difference from the input sample. B, GO analysis of the identified proteins bound to the promoter of BpNAC090 captured by using R-ChIP–dCas9. The proteins captured by R-ChIP–dCas9 were identified using mass spectrometry, and then were functionally annotated with GO terms.
Capture of proteins binding to the BpNAC090 promoter using R-ChIP–dCas9
After affinity purification using StrepTactin beads and washing, the proteins bound by the target chromatin were eluted and analyzed by mass spectrometry (Supplemental Table S1). The results showed that 1,741 proteins in total were identified in the test sample; while only 79 proteins were identified from the control sample (Table 1). In addition, the test sample contained 390 nuclear proteins, including 32 TFs, accounting for 22.4% and 1.8% of the total identified protein, respectively. However, only one nuclear protein and no TFs were identified from the control sample (Table 1). These results suggested that the nuclear proteins had been successfully enriched by R-ChIP. In addition, gene ontology analysis of the identified proteins indicated that the proteins involved in “nucleic acid binding transcription factor activity,” “transcription factor activity, protein binding,” and “molecular function regulator” were enriched (Figure 4B), suggesting that all of them were nuclear proteins involved in transcription regulation. These results suggested that the transcription regulators had been successfully enriched.
Summary of the captured proteins using R-ChIP–dCas9
| Category | The study sample | The control sample | ||
|---|---|---|---|---|
| Number of proteins | Percentage (%) | Number of proteins | Percentage (%) | |
| Total proteins | 1741 | 100.00 | 79 | 100.00 |
| Nuclear proteins | 389 | 22.34 | 1 | 1.27 |
| TFs | 32 | 1.84 | 0 | 0 |
| Category | The study sample | The control sample | ||
|---|---|---|---|---|
| Number of proteins | Percentage (%) | Number of proteins | Percentage (%) | |
| Total proteins | 1741 | 100.00 | 79 | 100.00 |
| Nuclear proteins | 389 | 22.34 | 1 | 1.27 |
| TFs | 32 | 1.84 | 0 | 0 |
Verification of R-ChIP results using ChIP-PCR and ChIP-qPCR
Mass spectrometry analysis had identified 32 TFs that potentially bound to the promoter of BpNAC090, such as basic (region-leucine) zipper (bZIP), CCCH-Type Zinc finger protein 14 (C3H14), AGAMOUS-LIKE 11 (AGL11), Whirly (WHY1), and GLABROUS1 enhancer-binding protein-like 2 (GeBP; Supplemental Table S2), which are potential upstream regulators of BpNAC090. To determine whether the identified TFs were genuine upstream regulators of BpNAC090, we selected five TFs for ChIP-PCR study. The promoter of BpNAC090 contains the cis-acting elements bound by bZIP16 (Genbank number: OP056335) protein, and we then selected the bZIP16 for verification. We further randomly selected four TFs for verification, whose binding sites in the promoter of BpNAC090 were not known, and these selected TFs were C3H14, WHY1, GeBp, and AGL11 (Genbank number: OP056340, OP056336, OP056337, OP056338). These TFs were fused separately with a Flag tag to generate TF-Flag fusion genes. These fusion genes were transiently transformed into birch plants separately. RT–qPCR was first performed to determine the expression level of the transgene. Compared with the control (transformed with empty pROKII), the expression levels of the five TFs were all significantly increased (Figure 5A), suggesting that transgenic plants were successfully generated and could be used for ChIP analysis.
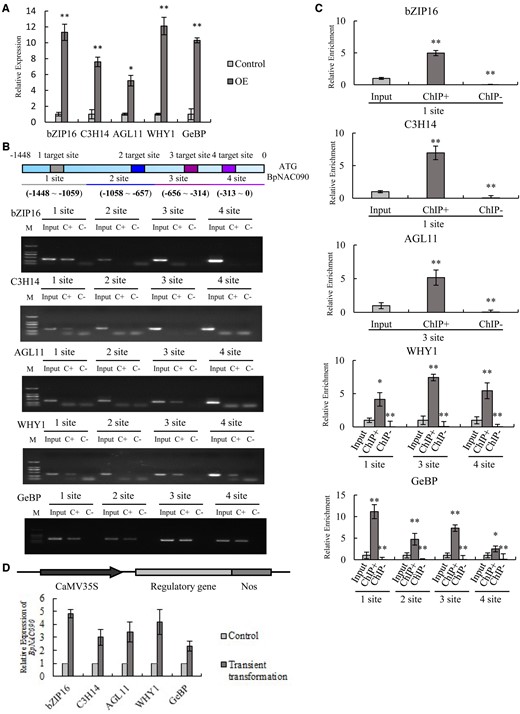
Analysis of the TFs binding to the BpNAC090 promoter and their regulation of BpNAC090. A, Expression levels of the studied TFs. Vectors expressing the studied TFs were transiently transformed into birch for overexpression, and the empty pROKII vector was transiently transformed into birch as a control. The expression levels of the TFs were studied using RT–qPCR. B, ChIP-PCR analysis of the binding of the five studied TFs to the promoter of BpNAC090. The ChIP-PCR products were analyzed using gel electrophoresis. C, ChIP-qPCR assay. The truncated promoter of BpNAC090 bound by the studied TFs according to ChIP-PCR (B) were used for ChIP-qPCR analysis. Relative enrichment: the enrichment of target DNA in ChIP+ or ChIP− relative to input. The ratio of target and internal reference in input was set as 1 to normalize that in ChIP+ or ChIP−. B and C, Input, input sample; ChIP+/C+: sample was immunoprecipitated with anti-Flag antibody; ChIP−/C−: sample was immunoprecipitated with H2O (i.e. no antibody was used, and served as negative control). 1–4 target site/site: Four gRNA target sites (1–4) in the promoter of BpNAC090 that were used for R-ChIP–dCas9 capture, and four truncated regions respectively containing each target site were further used for ChIP-PCR amplification. D, Determination of the regulation of the studied TFs on BpNAC090. The studied TFs were transiently transformed into birch, and RT-qPCR was carried out to study the regulation of BpNAC090 by the studied TFs (Genbank number of bZIP16, C3H14, WHY1, GeBp, AGL11: OP056335, OP056340, OP056336, OP056337, OP056338). A, C, and D, Three independent experiments were performed. Error bar indicates standard deviation (Sd) from the three experiments. A t test was performed. Single and double asterisks, respectively, indicate significant *P < 0.05 and **P < 0.01 (t test) differences from the input.
The ChIP-PCR results indicated that bZIP16, C3H14, AGL11, WHY1, and GeBp could all bind to the promoter of BpNAC090 (Figure 5B). Based on the ChIP-PCR results, ChIP-qPCR of the truncated promoter of BpNAC090 enriched by the studied TFs was carried out. The results showed that the above five TFs can indeed bind to the promoter of BpNAC090 (Figure 5C), which is consistent with the results of ChIP-PCR. These results indicated that bZIP16, C3H14, AGL11, WHY1, and GeBp TFs bind to the birch BpNAC090 promoter in vivo.
To further study whether the studied TFs can regulate the expression of BpNAC090, these TFs were separately transformed into birch for overexpression. The results showed that the overexpression of all five TFs could induce the expression of BpNAC090, suggesting that bZIP16, C3H14, AGL11, WHY1, and GeBp can regulate the expression of BpNAC090 by binding to its promoter (Figure 5D).
Electrophoretic mobility shift assay analysis
To further verify the binding of these five TFs to the promoter of BpNAC090, electrophoretic mobility shift assay (EMSA) was performed. The truncated promoters of BpNAC090 bound by the studied TFs according to ChIP-qPCR (Figure 5) were labeled with biotin and used as probes for EMSA. The five TFs were expressed in a prokaryotic expression system and purified using maltose binding protein (MBP) affinity beads. The EMSA results showed that the five TFs could all form DNA–protein bands with the BpNAC090 promoter, and the DNA–protein bands gradually weakened with the addition of unlabeled competitive probes (Figure 6). The results indicated that these five TFs can bind specifically to the promoter of BpNAC090, further demonstrating the reliability of R-ChIP–dCas9 technique.
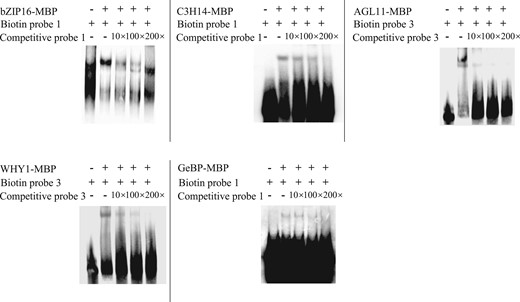
EMSA analysis of the binding of the studied TFs to the promoter of BpNAC090. The TFs bound by the BpNAC090 promoter, as determined by ChIP-PCR, were used as probes for EMSA analysis. bZIP16-MBP, C3H14-MBP, WHY1-MBP, GeBp-MBP, AGL11-MBP: the protein of bZIP16, C3H14, WHY1, GeBp, and AGL11, respectively, fused with maltose-binding protein (MBP) that were expressed in Escherichia coli ER2523. Biotin probe 1, 3: target sites 1 and 3 (shown in Figure 5B) were labeled with biotin and used as probes for EMSA. Competitive probe 1, 3: target sites 1 and 3 (shown in Figure 5B) without label were used as competitive probes for EMSA. 10×, 100×, 200×: Competition for the same labeled probe was tested by adding 10-, 100-, and 200-fold excess of the unlabeled probes (competitive probes).
Study of the reproducibility of R-ChIP–dCas9
To investigate the reproducibility of R-ChIP–dCas9, Y1H was performed. The promoter of BpNAC090 was cloned into pHIS2 (Clontech) and hybridized with the cDNA library constructed from the same sample used for R-ChIP–dCas9. All the positive clones of Y1H were pooled together, and the plasmid was isolated from these positive clones (Y1H pool). Correspondingly, the empty pHIS2 was also used as bait to hybridize with the cDNA library, and the plasmid was also isolated from the positive clone pool (control pool). The cDNA library used for Y1H was served as the input control. The genes identified from R-ChIP–dCas9 were used for polymerase chain reaction (PCR) amplification with the templates of Y1H pool, control pool, and cDNA library (input control). The results showed that all the studied genes can be amplified from Y1H pool and input, but cannot be amplified from the control pool (Figure 7). Therefore, Y1H results showed these proteins all can bind to the promoter of BpNAC090, which is consistent with R-ChIP–dCas9. These results suggested that the R-ChIP–dCas9 is reproducible.
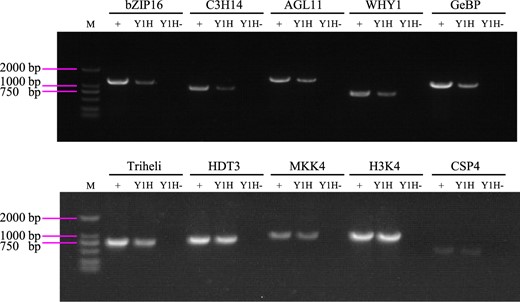
Verification of the reproducibility of R-ChIP–dCas9 using Y1H. The genes identified from R-ChIP–dCas9 were PCR amplified from the Y1H product. The cDNA library was constructed (with the sample used for R-ChIP–dCas9) using SMART technology. Then Y1H was performed using the promoter of BpNAC090 as bait and hybridized with the cDNA library. Y1H: the promoter of BpNAC090 was cloned into pHIS2 and hybridized with the cDNA library, all the positive clones were pooled together for isolating the plasmids and were used as PCR template (Y1H pool). Y1H−: The empty pHIS2 was hybridized with the cDNA library (Y1H pool), and the plasmids were isolated from all the positive clone pool and were used as PCR template (Control pool). +: Input, cDNA library used for Y1H was used as PCR template (Input pool). M: DNA Marker.
Discussion
The CRISPR–dCas9 system captures protein-binding DNA efficiently
In plants, nuclear proteins account for a low percentage of total proteins. For instance, only 20% of the genome-encoded proteins are nuclear proteins in Arabidopsis (Arabidopsis thaliana). However, nuclear proteins only accounted for 15% of experimentally identified proteins. It is difficult to detect nuclear proteins in the global proteome using mass spectrometry because of their low abundance (Xing et al., 2016). In addition, the abundance of TF proteins is lower than that of other nuclear proteins, making their identification using mass spectrometry even more difficult (Xing et al., 2016). Our results showed that 79 proteins were identified from the negative control, which contained only one nuclear protein. However, 1,741 proteins were identified from the products of R-ChIP–dCas9 (Table 1), indicating that the protein capture based on CRISPR–dCas9 was successful. Among them, 22.4% were nuclear proteins, suggesting that the nuclear proteins had been substantially enriched by R-ChIP–dCas9. Furthermore, our results indicated that the target DNA fragments had been enriched by more than 1,000-fold (Figure 4A), suggesting that this method is efficient to isolate the target protein-binding DNA fragment. Moreover, we randomly selected five TFs to determine whether they genuinely bind to the target DNA region. The results showed that all five studied TFs could bind to the target DNA in vivo (Figures 5 and 6). Furthermore, we further employed Y1H to confirm the reproducibility of R-ChIP–dCas9. The Y1H result showed that the proteins identified by R-ChIP–dCas9 all can bind to the promoter of BpNAC090 (Figure 7). These results together suggested that R-ChIP–dCas9 has high reproducibility with credible results.
The R-ChIP–dCas9 system employs a mechanism not based on DNA hybridization to capture protein-binding DNA
Previously, some technologies had been developed to study the proteins binding to a defined genomic DNA sequence in plant species, such as R-ChIP and PICh (Déjardin and Kingston, 2009; Wen et al., 2020). However, these technologies all depend on DNA sequence hybridization in vitro, that is denaturation and then renaturation of DNA. In those technologies, ssDNA probes were synthesized and then bound to the target DNA sequence in vitro by denaturation of chromatin DNA into ssDNA and then DNA hybridization. The DNA-binding proteins were then isolated via the affinity of the DNA probes. However, the methods based on DNA hybridization have many limitations. For instance, (1) the affinity of DNA pairing is relatively weak, resulting low efficiency in isolation; (2) DNA pairing is not very specific, especially under low temperature; and (3) DNA hybridization needs high temperature, and high temperature will reduce DNA renaturation efficiency, and may also lead to decrosslinking of DNA–protein and degradation of protein. However, low temperature may lead to low specific DNA pairing.
To overcome these limitations, an affinity method instead of “DNA hybridization” needs to be used. RNA-guided DNA recognition in CRISPR system is highly specific and efficient (Verwaal et al., 2018; Khan et al., 2019), which can overcome the limitations of DNA hybridization and have more advantages. Compared with the methods based on DNA hybridization, RNA-guided DNA recognition does not need the procedures of DNA denaturation and renaturation, which not only can avoid the decrosslinking of protein and DNA and nonspecific DNA hybridization due to incorrect DNA pairing, but also can save operation time and cost. In addition, as Cas9 protein had bound to the target DNA site in cells, the efficiency of capture target DNA will be substantially improved compared with DNA hybridization. Taken together, R-ChIP–dCas9 is an in vivo capture method, while the methods based on DNA hybridization are in vitro capture method. Compared with in vitro capture methods, in vivo capture method has high specificity and efficiency in capturing the target DNA.
In the present study, we combined the CRISPR–dCas9 system with transient genetic transformation to develop a DNA capture method (R-ChIP–dCas9), which depends on the Cas9 protein and gRNA complex binding to the target DNA in vivo. The binding of dCas9–gRNA complex to chromatin is more stable than the double strand of DNA formed by pairing of probe and target DNA. Our results showed that R-ChIP–dCas9 can specifically and efficiently capture target DNA (Figures 4–6), and has a high reproducibility (Figure 7). Therefore, R-ChIP–dCas9 should be a breakthrough technology in capturing target DNA and will have a wide application.
Transient genetic transformation is important for R-ChIP–dCas9 system
In theory, the transient genetic transformation technology of R-ChIP–dCas9 can be used in all plant species that can be transformed using Agrobacterium tumefaciens. This method has advantages of being rapid and reliable, with wide application prospects. Using this transient genetic transformation, the CRISPR–dCas9 system can be transiently transformed into plants. After transformation, gRNA–dCas9 complex will bind to the target genomic DNA region, and is then crosslinked by formaldehyde. The chromatin DNA–protein complex can be isolated using StrepTactin magnetic beads and DNA-binding proteins can be identified using mass spectrometry. In this procedure, an important step is to determine whether dCas9–gRNA had bound to the target DNA site. If the target DNA region is a gene promoter, dCas9 protein binding will silence the gene’s expression (Qi et al., 2013). Therefore, dCas9 binding to the promoter can be determined by assessing the expression of the target gene (Figure 3). Alternatively, it also can isolate the nuclei of the transiently transformed plants, extract RNA from nuclei, and analyze the transcript level of gRNA or dCas9 in nucleus using RT–qPCR.
The key step for the success of R-ChIP–dCas9 is whether transient transformation is successfully performed. Only when highly efficient transient genetic transformation is performed can the gRNA–dCas9 complex be formed in the plant cells to execute its function. There are slight differences in the procedures for transient transformation among different plant species. The main concern is that the plants should not suffer severe wilt when soaked with the infection buffer containing Agrobacterium. Insufficient soaking will avoid wilt, but the quantity of Agrobacterium cells infiltrating into the plant cell space will not be enough to achieve highly efficient transformation. If too many Agrobacterium cells infiltrate into the plant cell space, serious wilt or even death of leaves will occur, resulting in failure of transient transformation. Therefore, the appropriate infection time for a particular plant species should be determined using preliminary experiments.
The key factors for successful R-ChIP–dCas9
One key factor is that it is better to conduct crosslinking within 24–72 h after transient transformation because dCas9 and gRNA can maintain high expression within 24–72 h of transient transformation. After 72 h, the transcript levels of dCas9 and gRNA begin to decrease, thus reducing the protein capture efficiency.
Another factor related to the success of R-ChIP–dCas9 is the density of the gRNA probes distributed on the target genome region. If the density of gRNA probes is low, it is difficult to detect the proteins completely. The density of the gRNA probes also depends on the length of the sonicated chromatin, and long fragment chromatin may need low-density probes. However, the length of sonicated chromatin should not be longer than 1 kb to ensure capture efficiency. The desirable probe distribution density is 2–3 per kb.
Another factor is the quantity of samples used. In the present study, the material used in each R-ChIP–dCas9 experiment is 5 g (sampled from the pool of the transient transformants of the four gRNAs), which is sufficient to detect the TF proteins bound by the target genome region. However, as the abundance of TFs is low, more material can be used to improve the results. If more material is used, the R-ChIP–dCas9 experiments can be performed in different batches, such that each experiment uses no more than 7 g of materials.
The applications of R-ChIP–dCas9
In the previous study, we found that BpNAC090 is in the top layer of the gene regulatory network (GRN) of birch in response to drought, whose expression is highly induced by drought (Jia et al., 2022). At the same time, the overexpression of BpNAC090 confers substantial drought tolerance to transgenic birch (Jia et al., 2022). Therefore, the determination of the upregulators of BpNAC090 will further find the upstream regulators of the birch GRN in response to drought, which is important for the identification of key regulators in drought tolerance of birch.
R-ChIP–dCas9 can be used to detect those proteins that bind to a certain genomic region; especially it is suitable for determining the upstream regulators of gene. At the same time, this technology can also be used to study protein modifications of a certain genome region and the modification of chromatin DNA. In addition, the R-ChIP–dCas9 might even be used to investigate the chromosome conformation like high-throughput chromosome conformation capture (HiC). The experiment of R-ChIP–dCas9 can be completed within 1 week, including transient transformation and isolation of the DNA-binding proteins. One limitation of this method is that it cannot be used in plants that are not infected by Agrobacterium.
Conclusion
In the present study, we developed a reverse ChIP technique based on the CRISPR–dCas9 system (R-ChIP–dCas9) and transient genetic transformation. This method enables binding to the target DNA to be completed in vivo and does not depend on in vitro DNA sequence complementation, with the advantages of reliability, accuracy, and simplicity. Theoretically, this method can be used in various plants and thus might have a wide application in the analysis of DNA-binding proteins in plants.
Materials and methods
Plant material
Wild-type (WT) birch (Betula platyphylla) plants were used as the study material. The birch tissue culture plantlets were grown in woody plant medium (WPM) supplemented with 2.5% (w/v) sucrose and 0.6% (w/v) agar. The plants were grown in the tissue culture room at 25°C with a 14-h/10-h light/dark cycle.
Construction of the expression vector and transient transformation
The pYLCRISPR/Cas9P35S-N (GenBank number: KR029112) was used for introducing dCas9 fused with Strep-Tag II, and the detail of construction procedure was shown in Supplemental Figure S1. CRISPR/nuclease-dead Cas9 (CRISPR/dCas9) was generated by mutation of D10A and H840A (Jusiak et al., 2016). PCR was performed using the primers of dCas9-D10A-F and dCas9-D10A-R (Supplemental Table S3) and pYLCRISPR/Cas9P35S-N as a template to introduce D10 mutation in the first truncated Cas9 (termed dCas1, 2,562 bp in length, containing N-terminal of Cas9). At the same time, PCR was performed using the primers of dCas9-H840A-F and dCas9-H840A-R (Supplemental Table S3) and pYLCRISPR/Cas9P35S-N as a template to introduce the mutation of H840 in the second truncated Cas9 (termed dCas2, 3,022 bp in length, containing C-terminal of Cas9). The intact coding sequence of dCas9 was cloned into pYLCRISPR/Cas9P35S-N in homologous recombination way by incubating the dCas1 and dCas2 together with the linearized pYLCRISPR/Cas9P35S-N (digested with NcoI) using In-Fusion HD Cloning (TAKARA). The constructed vector was termed pYLCRISPR/dCas9P35S-N. For introducing Strep-Tag II into pYLCRISPR/dCas9P35S-N, the oligonucleotides of Strep-Tag II sequence together with two flank sequences of pYLCRISPR/dCas9P35S-N at BamHI site (Supplemental Table S3) was incubated with the linearized pYLCRISPR/Cas9P35S-N (digested with BamHI) using In-Fusion HD Cloning (TAKARA), and the constructed vector was termed p35N-dCas9-Strep (Supplemental Figure S1). The program CRISPR-GE (http://skl.scau.edu.cn/) was employed to select four gRNA target sites in the promoter of BpNAC090 to exclude low-score or low-CG-content (lower than 45%) (Supplemental Figure S2). The gRNA target site sequence was cloned into p35N-dCas9-Strep following the construction of Ma et al. (2015). The transient genetic transformation procedure followed the method described by Zang et al. (2017) with minor modification. In brief, Agrobacterium cells harboring the constructed p35N-dCas9-Strep and each gRNA target were cultured overnight at 28°C and 120 rpm. When the optical density 600 (OD600) reached 0.6–0.8, the overnight culture was diluted to 1:50 and then cultured again until the OD600 reached 0.8, and then was centrifuged at 3,000g for 10 min to harvest the cells. The Agrobacterium cells were adjusted to OD600 = 0.8 using an infection solution (2-mM 2-morpholinoethanesulphonic acid [pH 6.0] +150-mM acetosyringone + 200-mg·L−1 dithiothreitol+ 40-mM CaCl2 + 2% [w/v] sucrose + 270-mM mannitol) and used as the transformation buffer. The whole birch plantlets (about growing for 4 weeks) were soaked into the transformation buffer and cultured at 90 rpm at 25°C for 2.5 h. The plants were moved to a fresh infection solution for washing within 30 s, wiped with sterile filter paper to remove excess bacterial cells, and then the plantlets were cultured vertically in WPM solid medium (supplied with 1% sugar) for 24 h. At 24 h after transformation, the transiently transformed plants were treated with 20% PEG6000 for 3 h. After treatment, the samples were harvested and then pooled together in equal quantities for study.
R-ChIP procedure based on CRISPR–dCas9 system
The detailed procedures were as follows:
Material collection (about 5 min)
(1) After drought stress, the whole transient-transformed birch plants were dried as soon as quickly and put on ice.
Crosslinking (about 30 min)
(2) About 5 g of sample were cut properly and incubated in a 50-mL beaker with 30 mL of buffer A under a vacuum at room temperature for a total of 20 min. During 20 min, the vacuum was terminated, the sample was mixed well every 5 min four times, and then 2 mL of 2-M glycine was added for 5 min to terminate the crosslinking. The sample was rinsed two times with precooled ddH2O and dried with paper towels. The crosslinked needed to be ground into a fine powder under liquid nitrogen immediately. The ground material could store for one month at −80°C or be used for further analysis.
Nucleus isolation and chromatin purification (about 80 min)
All steps should be performed at 4°C and all buffers should be precooled unless otherwise indicated. (3) The ground material was incubated in a 50-mL centrifuge tube with 20 mL of buffer B, mixed well using a vortex oscillator for 5 min, filtered through three layers of miracloth to a new 50-mL centrifuge tube, and centrifuged at 350g at 4°C for 15 min to collect the nuclei. (4) The precipitate was resuspended slowly in 30 mL of buffer C, shook in a 4°C shaker at 120 rpm for 3 min; then centrifuged at 400g for 15 min to collect the nuclei. (5) Precipitate was resuspended in 300 μL of buffer D. Then, 1,500 μL of buffer D was added to a new 2-mL centrifuge tube, and then the above dissolved nuclei were added to the 1500 μL buffer D slowly, followed by centrifugation at 12,000g at 4°C for 45 min. (6) The supernatant and impurity were removed. The precipitate was resuspended with 400 μL of nucleic acid dissolution buffer and mixed carefully with a pipettor. Avoid producing bubbles during the procession of pipetting the suspension up and down.
Sonication treatment (about 30 min)
(7) The chromatin was treated with sonication, starting for 3 s and stopping for 15 s, with 100 W power for 15 min in total. The lengths of DNA fragments were in a range of 0.2–1 kb. The chromatin solution was centrifuged at 12,000g for 10 min at 4°C, and then the supernatant was transferred to a new centrifuge tube. Add 3600 µL of binding/washing buffer to the supernatant, and mixed well. Then ultrafiltration column (100 kDa cutoff) was used to concentrate the supernatant to 300 ul. Twenty microliters of the supernatant were used as the Input, that is sample 1.
Pre-cleaning of magnetic beads (about 5 min)
(8) 200 μL of StrepTactin magnetic beads (BeaverBeads Magrose Strep-Tactin; (BEAVER Biomedical, Suzhou, China) were added to a 2-mL tube, which was put on the magnetic frame for 1 min, and then the supernatant was discarded by aspiration using a pipette. Eight hundred microliters of binding/washing buffer was added to the tube, mixed well with a vortex mixer, and then put on the magnetic frame for 1 min to wash the beads. Repeat this step two to three times.
Affinity of dCas9–Strep-Tag II using StrepTactin magnetic beads (about 245 min)
(9) The chromatin solution from step 7 was added to the washed magnetic beads, incubated slowly with a rotating incubator at room temperature for 4 h, placed in the magnetic frame for 1 min, and the supernatant was then discarded by aspiration with a pipette.
Washing the beads (about 5 min)
(10) One milliliter of binding/washing buffer was added to the beads, which were suspended by vertexing the tube several times. The tube was then placed on the magnet stand, left for 1 min, and then the supernatant was discarded by aspiration with a pipette. This process was repeated two times.
Elution (about 130 min)
(11) Add desthiobiotin to binding/washing buffer for 2.5-mM concentration. Two hundred microliters of desulfurization biotin elution buffer was added to the washed beads, incubated slowly with a rotating incubator at room temperature for 2 h, and then placed on the magnet stand for 1 min. The supernatant was collected. One hundred microliters of new desulfurization biotin elution buffer was added to the beads and the elution process was repeated. The two supernatants were pooled together with a total volume of 300 μL and 36 μL was retained as sample 2 (test sample).
Protein concentration and mass spectrometry:
(12) The supernatant containing the elution product was concentrated with 50-kDa ultrafiltration column to 50 μL for mass spectrometry analysis.
Analysis of hybridization efficiency
(13) Samples 1 and 2 were added with 10-μg proteinase K (Sigma-Aldrich, St. Louis, MO, USA) separately and incubated at 52°C for 2 h. After incubation, the chromatin DNA was purified using a PCR purification kit (Qiagen) and used as a PCR template for hybridization efficiency determination with qPCR as shown in the section “Quantitative PCR analysis”. The promoter of the BpTubulin (Genbank number: MT163278) gene was used as an internal reference control, and the DNA in samples 1 and 2 were used as templates to analyze the enrichment of the truncated BpNAC090 promoter. Sample 1 was input, and sample 2 was test sample. In the input sample, the cycle threshold (Ct) of internal reference was termed as Ct (int/input), and Ct value of the truncated promoter of BpNAC090 was termed as Ct (tar/input). In sample 2 (test sample), the Ct of internal reference was termed as Ct (int/test), and Ct value of the truncated promoter of BpNAC090 was termed as Ct (tar/test). The enrichment folds were calculated as 2−{[Ct(tar/test) − Ct(int/test)] − [Ct(tar/input) − Ct(int/input)]}.
Mass spectrometry
Proteins were digested with trypsin, and mass spectrometric (nano liquid chromatography–tandem mass spectrometry) analyses were performed using an Eclipse LC/MS (Thermo Fisher Scientific, Waltham, MA, USA). The genome of birch has been sequenced completely, and the proteins encoded by the birch genome have been annotated as a protein database (Chen et al., 2021). The peptide sequences identified by mass spectrometry were searched against the protein database of birch using Mascot v. 2.2 (Matrix Science, Boston, MA, USA) to obtain the qualitative identification information of the target protein and peptide molecules. Their CDS were further retrieved from the birch genome.
ChIP analysis
The CDS of the TFs identified by mass spectrometry were fused separately with DNA encoding a Flag tag to form fusion genes. The vectors carrying fusion genes were transiently transformed into birch for expression. The ChIP procedure was carried out according to Zhao et al. (2021). In brief, chromatin and proteins were crosslinked using 3% (w/v) formaldehyde. After the nuclei were isolated, the chromatin was sonicated into 0.2–0.5 kb fragments. The target chromatin (ChIP+) was immunoprecipitated with anti-FLAG antibodies, and the chromatin without antibody immunoprecipitation was used as the negative control (ChIP−). After reverse crosslinking, the immunoprecipitated DNA was purified using a Qiaquick rotating column (Qiagen, Hilden, Germany). All the primers used are shown in Supplemental Table S3.
Y1H analysis
The promoter of BpNAC090 was cloned into pHIS2. Total RNA was isolated from the sample used for R-ChIP–dCas9 using a Total RNA Extraction Kit (Bioteke, Beijing, China). The cDNA library was constructed using a SMART method following the user manual of BD Matchmaker Library Construction & Screening Kits (PT3529-1). The Y1H was performed using pHIS2 harboring the BpNAC090 promoter as bait and the cDNA library harboring in pGADT7-Rec2 as prey following the user manual of BD Matchmaker Library Construction & Screening Kits (PT3529-1). The transformed cells were selected on medium of SD/–His/–Leu/–Trp + 30 mmol·L 3-aminotriazole (3-AT) with 30 plates (12 cm in diameter). The positive clones were harvested by washing each plate using yeast extract peptone dextrose (YPD) Plus liquid medium and pooled together to form the Y1H pool (300 mL in total). At the same time, the empty pHIS2 was used as bait to hybrid with the prey cDNA, and the positive clones were washed and pooled together to form the control pool (300 mL in total). The plasmid was respectively isolated from YH1 pool (1 mL) and control pool (1 mL) using an Easy Yeast Plasmid Isolation Kit (Takara, Dalian, China) with a final volume of 50 μL. The cDNA library (from SMART PCR) was diluted 50-fold and was used as PCR template serving as input. The PCR was performed using Y1H pool, control pool, and cDNA library (input). The PCR reaction system is 200 μmol·L−1 dNTP each, 1.5U ExTaq polymerase (Takara), 0.5 μmol·L−1 each forward and reverse primers, 0.5 μL of plasmid template or cDNA library (with 50-fold dilution), in a total volume of 20 μL. The thermal profile is as follows: 94°C for 2 min, followed by 29 cycles of 94°C for 15 s, 59°C for 20 s, and 72°C for 60 s. The PCR products were analyzed using agarose gel electrophoresis.
Quantitative PCR analysis
All quantitative PCR was carried out using qtower 2.0 (Analytik Jena AG, Jena, Germany). The following procedures were used for all the (RT–)qPCR in the present study, including enrichment of R-ChIP–dCas9, ChIP-qPCR, and RT–qPCR. The reaction system included 10 μL of SYBR green real-time PCR Master Mix (Toyobo), forward and reverse primers (0.5 μmol·L−1 each), using cDNA or DNA as template, in a total volume of 20 μL. The reaction conditions were as follows: 94°C for 30 s, followed by 45 cycles of 94°C for 10 s, 59°C for 20 s, and 72°C for 30 s. Three independent biological replicates were performed. All the primers used are shown in Supplemental Table S3.
EMSA
The CDS of the TF was fused with the MBP in the pMAL-C5x vector (NEB, Ipswich, Ma, USA) to generate the recombinant TF-MBP protein. The constructed recombinant expression vector was introduced into Escherichia coli ER2523 and induced using IPTG (isopropyl β-D-1-thiogalactoside) at 37°C for 2 h. The fusion protein was purified according to the instructions of the pMAL fusion purification system (NEB). The probe was labeled with biotin. The same probe sequence without biotin labeling was used as a competitor. The interaction between the probe and the protein was detected using a chemiluminescence EMSA Kit (Beyotime, Jiangsu, China). The primers used to construct recombinant pMAL-c5x vector and to amplify the EMSA DNA probe are shown in Supplemental Table S4.
Statistical analysis
Student’s t test was used for statistical analysis. Statistical analysis was carried out using SPSS21.0 software (IBM Corp., Armonk, NY, USA), and P < 0.05 was considered statistically significant.
Reagents
a: Formaldehyde solution 37% (w/v) (Sigma-Aldrich); b: Tris base (Promega); c: Sucrose (Sigma-Aldrich); d: MgCl2 (Sigma-Aldrich); e: PMSF, aprotinin, leupeptin, and pepstatin A (Sigma-Aldrich); f: Hydrochloric acid (HCl; Sigma-Aldrich); g: Proteinase inhibitor cocktail (Roche); h: Glycine (Fisher Scientific); i: Miracloth (Calbiochem, San Diego, CA, USA); j: Triton X-100 (Solarbio); k: β-Mercaptoethanol (Sigma-Aldrich); l: NaCl (Sigma-Aldrich); m: anti-FLAG antibody (Sigma-Aldrich, SAB4301135); n: EDTA disodium salt (Solarbio); o: Proteinase K (Promega); p: RNase A solution (Promega); q: SDS (Sigma-Aldrich); r: Desthiobiotin (Sigma-Aldrich)
ChIP buffers
Buffer A comprised 10-mmol·L−1 Tris HCl (pH 7.5), 0.4-mol·L−1 sucrose, 3.0% w/v formaldehyde.
Buffer B comprised 10-mmol·L−1 Tris-HCl (pH 8.0), 0.4-mol·L−1 sucrose, 1.5-mmol·L−1 MgCl2, 1-mmol·L−1 DTT, 1-mmol·L−1 PMSF, 1× proteinase inhibitor cocktail.
Buffer C comprised 10-mmol·L−1 Tris-HCl (pH 8.0), 0.25-mol·L−1 sucrose, 1% Triton X-100, 1.5-mmol·L−1 MgCl2, 1-mmol·L−1 DTT, 1-mmol·L−1 PMSF, 1× proteinase inhibitor cocktail.
Buffer D comprised 10-mmol·L−1 Tris HCl (pH 8.0), 1.7-mol·L−1 sucrose, 0.15% Triton X-100, 1.5-mmol·L−1 MgCl2, 1-mmol·L−1 DTT, 1-mmol·L−1 PMSF, 1 × proteinase inhibitor cocktail.
Nucleic acid dissolution buffer comprised 50-mmol·L−1 Tris–HCl (pH 8.0), 10-mmol·L−1 EDTA, 1% SDS, 1 × proteinase inhibitor cocktail.
Binding/washing buffer comprised 10-mM Tris–HCl (pH 8.0), 150-mmol·L−1 NaCl, 1-mmol·L−1 EDTA.
Desulfurization biotin elution buffer comprised 10 mmol·L−1 Tris HCl (pH 8.0), 150-mmol·L−1 NaCl, 1-mmol·L−1 EDTA, 2.5-mmol·L−1 desthiobiotin.
Accession numbers
Sequence data from this article can be found in the GenBank/EMBL data libraries under accession numbers in Supplemental Table S5.
Supplemental data
The following materials are available in the online version of this article.
Supplemental Figure S1. The procedure for construction of p35N-dCas9-Strep and its vector information.
Supplemental Figure S2. The distribution of four gRNA sites in the promoter of BpNAC090.
Supplemental Table S1. The total proteins identified using R-ChIP–dCas9.
Supplemental Table S2. The nuclear proteins captured by R-ChIP–dCas9.
Supplemental Table S3. The primer sequences used for genes studied in vector construction, RT-qPCR, and ChIP-PCR.
Supplemental Table S4. The primer sequences used for genes studied in vector construction and using DNA probes (EMSA).
Supplemental Table S5. The GenBank accession numbers of sequence data from this article.
Funding
This work was supported by National Natural Science Foundation of China (No. 31971684) and Heilongjiang Touyan Innovation Team Program (Tree Genetics and Breeding Innovation Team).
References
Author notes
Yucheng Wang Senior author.
Zhibo Wang and Zihang He contributed equally.
Zhibo Wang, Zihang He, Zhujun Liu, and Ming Qu performed the experiments.
Yucheng Wang conceived and designed the research.
Zhibo Wang, Zihang He, Caiqiu Gao, Chao Wang, and Zhujun Liu analyzed the data.
Yucheng Wang supervised the work.
Yucheng Wang, Zhibo Wang, and Zihang He wrote the paper and Yucheng Wang contributed and supervised the final article version.
Yucheng Wang agrees to serve as the author responsible for contact and ensures communication.
The author responsible for distribution of materials integral to the findings presented in this article in accordance with the policy described in the Instructions for Authors (https://dbpia.nl.go.kr/plphys/pages/general-instructions) is: Yucheng Wang ([email protected]).
Conflict of interest statement. All authors declared there are no confilcts of interest.
