


Abstract
Fructokinase (FRK) activates fructose through phosphorylation, which sends the activated fructose into primary metabolism and regulates fructose signaling capabilities in plants. The apple (Malus × domestica) FRK gene MdFRK2 shows especially high affinity to fructose, and its overexpression decreases fructose levels in the leaves of young plants. However, in the current study of mature plants, fruits of transgenic apple trees overexpressing MdFRK2 accumulated a higher level of fructose than wild-type (WT) fruits (at both young and mature stages). Transgenic apple trees with high mRNA MdFRK2 expression showed no significant differences in MdFRK2 protein abundance or FRK enzyme activity compared to WT in mature leaves, young fruits, and mature fruits. Immunoprecipitation–mass spectrometry analysis identified an skp1, cullin, F-box (SCF) E3 ubiquitin ligase, calcyclin-binding protein (CacyBP), that interacted with MdFRK2. RNA-sequencing analysis provided evidence for ubiquitin-mediated post-transcriptional regulation of MdFRK2 protein for the maintenance of fructose homeostasis in mature leaves and fruits. Further analyses suggested an MdCacyBP–MdFRK2 regulatory module, in which MdCacyBP interacts with and ubiquitinates MdFRK2 to facilitate its degradation by the 26S proteasome, thus decreasing the FRK enzyme activity to elevate fructose concentration in transgenic apple trees. This result uncovered an important mechanism underlying plant fructose homeostasis in different organs through regulating the MdFRK2 protein level via ubiquitination and degradation. Our study provides usable data for the future improvement of apple flavor and expands our understanding of the molecular mechanisms underlying plant fructose content and signaling regulation.
Introduction
Sugars not only play central roles as substrates in carbon and energy metabolism but also act as signal molecules in plant growth and development (Ruan, 2014). Soluble sugars, mainly sucrose, glucose, and fructose, act as the signal molecules to regulate the expression of various metabolic (including sugar biosynthesis, utilization, and storage) and defense-related genes (Koch, 1996; Smeekens, 2000; Rolland et al., 2006). Importantly, sugar homeostasis is largely determined by transport and metabolic processes, and further exploration of its regulatory mechanisms is a potential strategy to increase crop quality.
In most plants, sucrose is produced by photosynthesis in source leaves and then transported through the phloem (Ph) to sink tissues (Patrick, 1997). Once unloaded into the cytosol, sucrose is degraded into UDP-glucose (UDPG) and fructose by sucrose synthase (SUSY, EC 2.4.1.13) or into fructose and glucose by neutral invertase (NINV, EC 3.2.1.26) (Li et al., 2012). Fructose is an important signaling molecule that regulates plant growth, development, and defense (Pego and Smeekens, 2000; Kato et al., 2005; Stein and Granot, 2018). In Arabidopsis (Arabidopsis thaliana), a fructose-specific signaling pathway includes the enzyme fructose 1-6-bisphosphatase/fructose-insensitive 1 (FBP/FINS1), which is associated with the fructose-sensing QTL allele 6/NAC-containing protein 89 (FSQ6/ANAC089) (Cho and Yoo, 2011; Li et al., 2011). Fructose can be phosphorylated by fructokinase (FRK; EC 2.7.1.4) to generate fructose-6-phosphate (F6P), which then enters the glycolysis/TCA cycle to generate energy (Li et al., 2012). It is estimated that 50% of the total carbon flux goes through fructose in plants (Ruan, 2014), in which means that plants must need high FRK activity and that FRK may be the gateway to fructose metabolism and may regulate sugar metabolism and homeostasis in plant cells. Accumulating evidence indicates that FRK is involved in many biological processes associated with sensing fructose signals and regulating fructose levels in plants such as tomato (Solanum lycopersicon) and poplar (Populus clone 717) (Odanaka et al., 2002; Su et al., 2021).
Sugars act as crucial signal molecules in living cells, and their metabolism depends on multiple aspects, such as transcriptional and post-transcriptional regulation. As reported recently, the plant-specific AT-hook motif containing nuclear localized transcription factors (TFs) such as PtrAHL14 and PtrAHL17 induces greater activation of the cold-induced alkaline/neutral INV gene PtrA/NINV7 for cold-induced sucrose metabolism in trifoliate orange (Poncirus trifoliata L. Raf.) (Dahro et al., 2022). Other reports have highlighted the importance of post-transcriptional modifications in the regulation of sugar metabolism (Sato et al., 2011; Ma et al., 2019; Wang et al., 2020). Ubiquitination is an important post-transcriptional modification that contributes extensively toward the regulation of carbon response in plants (Xu et al., 2020). This process is accomplished through the actions of three different enzymes, including ubiquitin-activating enzyme (E1s), ubiquitin-conjugating enzyme (E2s), and ubiquitin ligase enzymes (E3s) (Moon et al., 2004; Guo et al., 2017). E3 ubiquitin ligases are central in determining the target protein specificity and can be primarily divided into four main types: HECT (homologous to E6-associated protein C-terminus), RING/U-Box (really interesting new gene/U-Box), SCF (Skp1, CDC53, and F-box protein), and APC (anaphase-promoting complex) (Furniss et al., 2018; Kelley, 2018; Julian et al., 2019). One E3 ligase is calcyclin-binding protein (CacyBP), an SCFTBL1 E3 ubiquitin ligase of ∼30 kDa that contains the Siah-1-interacting protein (SIP) and CacyBP domains and was found in ascites tumor cells (Filipek and Wojda, 1996). Moreover, CacyBP has been shown to enhance proteasomal degradation of β-catenin in eukaryote cells (Matsuzawa and Reed, 2001; Filipek, 2006). While regulation of plant homeostasis has been studied previously, our understanding of the molecular mechanisms involved in the transduction of internal signals by which regulating sugar homeostasis in plants remains rather limited.
In apple (Malus × domestica Borkh.) and many other fruit trees in the family Rosaceae, sorbitol is a major photosynthetic end product, accounting for 60% to 80% of the photosynthates produced in leaves and then transferred to sink organs through the Ph (Cheng et al., 2005). After being transported into sink tissues, almost all the sorbitol and half of the sucrose are metabolized to fructose. It is estimated that >80% of the total carbon flux goes through fructose for metabolism (Li et al., 2012), further emphasizing how much fructose is available for metabolism in apple. In earlier work, we demonstrated that MdFRK2 was highly expressed in apple sink tissues, that the MdFRK2 protein not only had a high affinity for fructose but also a high enzymatic activity because of sorbitol, and that overexpressing MdFRK2 decreased the concentration of fructose in the leaves of young plants (Yang et al., 2018). However, in this study, we found some surprising results: (1) Fruits of the transgenic apple trees with overexpressing of MdFRK2 accumulated a higher level of fructose than WT fruits at the young and mature stages and (2) although the mRNA expression pattern of MdFRK2 was significantly upregulated in the transgenic apple trees, mature leaves (ML), young fruits (YF), and mature fruits (MF) showed no substantial differences in either FRK enzyme activity or MdFRK2 protein abundance between MdFRK2-overexpressing lines and WT. We hypothesized that a mechanism regulating MdFRK2 protein levels in ML and MF might operate through post-transcriptional regulation. Further investigation of the mechanism by which MdFRK2 regulates fructose homeostasis in apple plants is essential for the improvement of fructose levels in apple fruits.
In our report, we performed an immunoprecipitation–mass spectrometry (IP–MS) analysis that identified the SCFTBL1 E3 ubiquitin ligase MdCacyBP. RNA-seq analysis provided evidence that ubiquitin-mediated post-transcriptional regulation of MdFRK2 protein influences fructose homeostasis in ML and MF. Further research showed that MdCacyBP interacted with and ubiquitinated MdFRK2 to facilitate its degradation by the 26S proteasome pathway, decreasing the FRK enzyme activity to elevate fructose concentration in transgenic apple trees. This proposed MdCacyBP–MdFRK2 regulatory module is an important mechanism by which plant fructose homeostasis is controlled at the organ level by regulating MdFRK2 protein levels through ubiquitination and degradation.
Results
Physiological changes in different organs of transgenic apple trees overexpressing MdFRK2
We used two previously described transgenic apple lines overexpressing MdFRK2, OE-4 and OE-9 that have now grown to 5-year-old trees. Earlier work showed that these OE lines had elevated FRK activity that caused a decline in fructose concentrations in the leaves of young plants (Yang et al., 2018). In transgenic apple trees overexpressing of MdFRK2, YF and MF accumulated higher levels of fructose as compared to fruit on the WT trees. Similar results were also obtained in ML (Figure 1A). Concentrations of sucrose and glucose did not show obvious differences between the MdFRK2-OE transgenic lines and the WT (Supplemental Figure 1). Although the MdFRK2 mRNA levels were significantly higher in the transgenic apple trees (Figure 1B), there were no significant differences in the activity of FRK in the ML, YF, and MF between the MdFRK2-OE transgenic lines and the WT (Figure 1C). Western blots using anti-MdFRK2 antibodies showed that MdFRK2 protein abundance was not substantially different between MdFRK2-overexpressing and WT plants, in line with the data of the FRK activity (Figure 1D). In stark contrast, the young leaves (YL), shoot tips (ST), Ph, and roots (R) of the MdFRK2-OE lines did show enhanced FRK activity and reduced fructose levels (Supplemental Figure 2). These findings together indicate that there is a mechanism that regulates MdFRK2 protein levels or activity in ML and MF that occurs after transcription, possibly through post-transcriptional modifications.
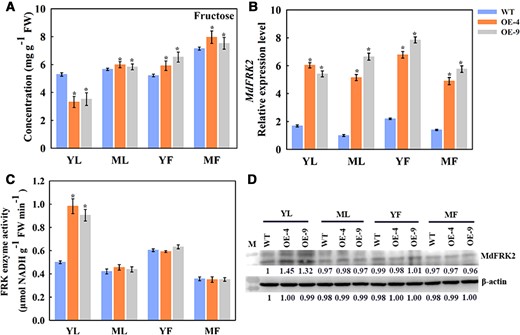
Levels of fructose, MdFRK2 transcript, FRK enzyme activity, and MdFRK2 protein in the YL, ML, YF (40 days after bloom), and MF (130 days after bloom) of WT and transgenic apple overexpressing MdFRK2 (OE-4 and OE-9). (A) Concentration of fructose in the YL, ML, YF, and MF of the WT and transgenic lines. (B) MdFRK2 expression levels in the YL, ML, YF, and MF of WT and transgenic apple trees were measured via RT-qPCR. The transcript levels were normalized to those of MdActin. The relative expression level for MdFRK2 was obtained via the 2−ΔΔCT method, setting its expression in ML-WT as 1. (C) Activity of FRK enzyme in the YL, ML, YF, and MF of WT and MdFRK2-OE lines. (D) The abundance of MdFRK2 protein in the YL, ML, YF, and MF of WT and transgenic OE lines. The MdFRK2 protein level was detected by western blotting using anti-MdFRK2 antibodies. The number below each protein band indicates the relative protein abundance measured using density scanning, with that from WT of YL set as 1. M: protein marker. β-Actin was used as the reference protein. Bars represent the mean value ± Se (n ≥ 3). The asterisks in A, B, and C indicate significant differences based on independent t tests (*P < 0.05).
Identification of MdCacyBP as an MdFRK2-interacting protein
Post-transcriptional regulation is a stable regulatory mechanism and plays vital roles in maintaining protein homeostasis in planta (Serrano et al., 2018; Chua et al., 2020). We hypothesized that there might be a factor interacting with MdFRK2, contributing to the regulation of MdFRK2 protein levels. Therefore, we screened for proteins that interacted with MdFRK2 using IP–MS. We identified 23 candidate proteins related to the ubiquitination pathway (Figure 2, A and B; Supplemental Figure 3). These candidates were compared to the transcriptome of transgenic ML (Figure 2, C and D; Supplemental Figure 4). Only a SCFTBL1 ubiquitin ligase was significantly upregulated in the transgenic ML compared to WT. The amino acid sequence of this SCFTBL1 ubiquitin ligase showed similarities to AtCacyBP (AT1G30070.1) and SlCacyBP (XP_004244806.1), which contains the SIP (3–63 aa) and CacyBP (69–157 aa) domains (Supplemental Figure 5A) and was therefore named MdCacyBP. The combined results of the IP–MS and RNA-seq experiments prompted further in-depth analysis of MdCacyBP. MdCacyBP was located in both the cytoplasm and the nucleus (Supplemental Figure 5B), which was similar to the pattern of MdFRK2 (Yang et al., 2018). Overall, these findings indicated that a regulatory mechanism that controlled MdFRK2 protein level was most likely through the ubiquitination pathway and would involve MdCacyBP.
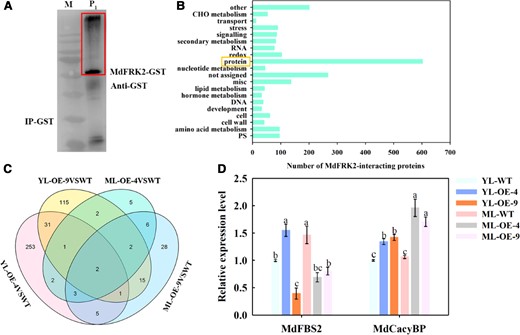
Identification of MdFRK2-interacting proteins by IP–MS. (A) M, marker. P1, total proteins were extracted from ML of MdFRK2-OE transgenic apple plants and incubated with purified MdFRK2-GST protein for 2 h. The protein complexes were immunoprecipitated with anti-GST agarose beads. The immunoprecipitated proteins (red box) were analyzed by liquid chromatography–tandem mass spectrometry (LC–MS/MS). (B) Functional category enrichment of the MdFRK2-interacting proteins. After annotation, 602 candidate-interacting proteins were found to relate to protein post-transcriptional modification (yellow box). PS, photosynthesis; CHO metabolism, carbohydrate metabolism. (C) Venn diagram of co-upregulated DEGs involved in the MdFRK2 post-transcriptional regulation in ML and YL of WT and MdFRK2-OE lines. Total RNA from ML and YL was extracted and subjected to RNA-sequencing (RNA-seq). For this purpose, we used FPKM and identified genes with Fold Change (∣log2 (FC)∣≥ 1.5) and FDR <0.05. Four pairwise comparisons (YL-OE-4 versus YL-WT, YL-OE-9 versus YL-WT, ML-OE-4 versus ML-WT, and ML-OE-4 versus ML-WT) from different tissues indicated a considerable number of DEGs. (D) Relative expression levels of MdFBS2 (MD05G1325400) and MdCacyBP (MD05G1283600) were measured using RT-qPCR. For RT-qPCR, the transcript levels were normalized to those of MdActin. The relative expression levels for MdFBS2 and MdCacyBP were obtained via the 2−ΔΔCT method, setting their expression in YL-WT as 1. Bars represent the mean value ± Se (n ≥ 3). Different letters indicate significant differences at P < 0.05 based on one-way ANOVA.
MdCacyBP interacted with MdFRK2
To further verify the interaction between MdCacyBP and MdFRK2, three interaction assays were conducted. Firstly, we used the yeast two-hybrid (Y2H) system to test this interaction (Figure 3A). The coding sequence of MdCacyBP and MdFRK2 was fused to the pGADT7 and pGBKT7 vectors, respectively. The pGBKT7-p53 and pGADT7-T pair was used as a positive control, whereas the empty vectors were used as negative controls. These constructs were transformed into the Y2H Gold yeast. The results showed that yeast cells expressing both MdFRK2 and MdCacyBP grew normally on media lacking Leucine, Tryptophan, Histidine, and Adenine (-Leu/-Trp/-His/-Ade), suggesting a direct interaction between the two proteins. Secondly, bimolecular fluorescence complementation (BiFC) was performed in Nicotiana benthamiana leaves to provide further evidence for the interaction between MdCacyBP and MdFRK2 (Figure 3B). MdCacyBP was fused to the N-terminus of yellow fluorescent protein (YFPN), and MdFRK2 was fused to the C-terminal fragment of YFP (YFPC). YFP signal was detected in N. benthamiana leaves co-transformed with MdFRK2-YFPC and MdCacyBP-YFPN, demonstrating the potential for direct interaction. Finally, the interaction was further demonstrated with an in vivo coimmunoprecipitation (Co-IP) assay (Figure. 3C). Consistent with the results of the Y2H and BiFC assay, MdCacyBP-Flag was immunoprecipitated using anti-Flag antibody from MdFRK2-GFP and MdFRK2-GFP/MdCacyBP-Flag combinations, and anti-GFP detected MdFRK2 only in the precipitate from leaves that expressed both MdFRK2-GFP and MdCacyBP-Flag.
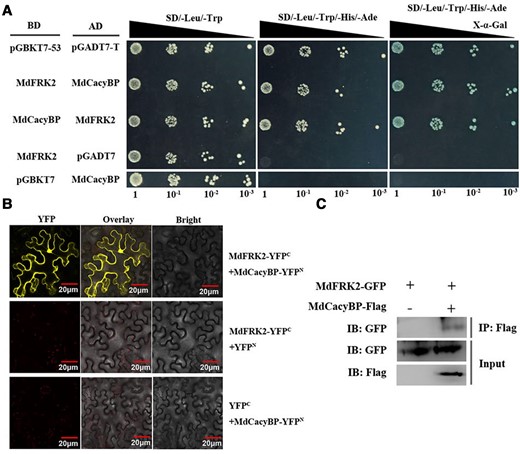
MdCacyBP interacted with MdFRK2. (A) Interaction between MdCacyBP and MdFRK2 as determined by the Y2H assay. The pGBKT7-p53 and pGADT7-T pair were used as positive controls. Pairs of BD-MdFRK2 and AD-pGADT7, and BD-pGBKT7 and AD-MdCacyBP were used as negative controls. Each colony was dissolved in 5 μL sterile NaCl and then diluted to 10−1–10−3. Yeasts were grown on SD/-Leu/-Trp, SD/-Leu/-Trp/-His/-Ade, and SD/-Leu/-Trp/-His/-Ade + X-α-gal media. (B) MdCacyBP interacted with MdFRK2 in a BiFC assay. MdFRK2 was fused to the C-terminus of yellow fluorescent protein (YFPC), and MdCacyBP was fused to the N-terminus of YFPN. Pairs of MdFRK2-YFPC + YFPN and YFPC + MdCacyBP-YFPN were used as negative controls. Different pairs of constructs were co-expressed in N. benthamiana. After 3 days, YFP fluorescence was detected by confocal microscopy. Scale bars = 20 μm. (C) Detection of the interaction between MdCacyBP and MdFRK2 proteins by Co-IP assays. MdFRK2-GFP and MdCacyBP-Flag were transiently expressed in N. benthamiana leaves. MdFRK2-GFP protein was immunoprecipitated using an anti-GFP antibody. The eluted solution was examined using an anti-Flag antibody.
Together, the above data suggested that MdCacyBP directly interacted with MdFRK2 both in vivo and in vitro.
MdCacyBP ubiquitinated MdFRK2 and accelerated its degradation
The CacyBP homologs form E3 ubiquitin ligase complexes with the SIAH-interacting protein (SIP), which then targets proteins for ubiquitination (Matsuzawa and Reed, 2001). This prompted us to examine whether MdCacyBP could ubiquitinate MdFRK2 using an in vivo ubiquitination assay. We co-expressed MdCacyBP-Flag and MdFRK2-GFP in N. benthamiana leaves and analyzed the ubiquitination level of MdFRK2. The ubiquitinated form of MdFRK2-GFP protein was detected using anti-Ubi and anti-GFP antibodies, respectively. When probed with the anti-ubiquitin antibody, MdFRK2 with a higher molecular mass was found to be substantially increased (Figure 4, A and B), indicating that ubiquitination of MdFRK2 was mediated by MdCacyBP.
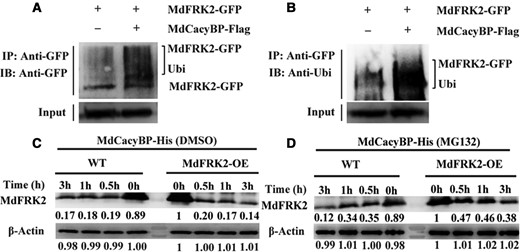
MdCacyBP mediates the ubiquitination and degradation of MdFRK2. (A, B) MdCacyBP ubiquitinated MdFRK2 in N. benthamiana leaves. MdFRK2-GFP was expressed alone or co-expressed with MdCacyBP-Flag in N. benthamiana, and proteins were extracted from N. benthamiana leaves. Immunoprecipitation was performed using anti-GFP antibody, proteins were separated by sodium dodecyl sulfate–polyacrylamide gel electrophoresis (SDS–PAGE), and the proteins were detected by western blotting using anti-GFP and anti-ubiquitin antibodies. IP, immunoprecipitate; IB, immunoblot; Ubi, ubiquitin. (C, D) Cell-free degradation assay shows that MdCacyBP promotes the degradation of MdFRK2 by the 26S proteasome. Total protein was extracted from WT and MdFRK2-OE apple leaves and incubated with MdCacyBP-His protein with 50 μM MG132 (proteasome inhibitor) or its solvent DMSO for 0, 0.5, 1, or 3 h at 22°C. The number below each protein band indicates the relative protein abundance measured using density scanning, with that from 0 h of MdFRK2-OE set as 1. M, protein marker. MdFRK2 protein level was detected by western blotting using anti-MdFRK2 antibody. β-Actin was used as the reference protein.
Because proteins modified by ubiquitination enter the 26S proteasome for degradation (Smalle and Vierstra, 2004), it was reasonable to suspect that the degradation of MdFRK2 by MdCacyBP is dependent on the 26S proteasome pathway. To confirm this, we conducted a cell-free degradation assay. Total protein extracted from WT and MdFRK2-OE apple leaves were incubated with purified MdCacyBP-His (Supplemental Figure 6) in the presence of MG132 or its solvent dimethyl sulfoxide (DMSO). At the indicated time points, the proteins were subjected to immunoblot analysis with anti-MdFRK2 antibody. As shown in Figure 4, C and D, the MdFRK2 protein was degraded faster in MdFRK2-OE extracts than WT extracts, suggesting that MdCacyBP accelerated the degradation of MdFRK2 protein. Concomitantly, the application of the proteasome inhibitor MG132 inhibited the degradation of MdFRK2 protein, suggesting that MdFRK2 degradation might be mediated by the 26S proteasome.
MdFRK2 degradation was mediated via the 26S proteasome pathway
The ability of MdCacyBP to ubiquitinate MdFRK2 was confirmed using an in vivo ubiquitination assay, with the proteasome inhibitor treatment (MG132) further used to validate whether MdFRK2 degradation was mediated by the 26S proteasomal pathway (Figure 5A). In two OE lines, the MdFRK2 protein abundance was increased in response to MG132 treatment but was not affected by DMSO (Figure 5B). In contrast, MdFRK2 protein levels were similar with either treatment in WT. These findings proved that MdFRK2 protein was degraded through a 26S proteasome manner.
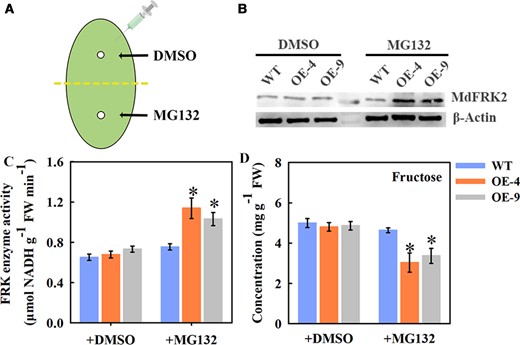
MdFRK2 degradation was mediated via the 26S proteasome pathway. (A) Agroinfiltration of apple leaves. Black arrows point to sites of infiltration of MG132-containing MES buffer into subcultured ML of WT and MdFRK2-overexpressing transgenic apple, with DMSO as a control. (B) Protein levels of MdFRK2 assayed by western blotting after agroinfiltration. Three days after injection, total protein was extracted from the leaves and MdFRK2 protein level was detected by western blotting with a specific MdFRK2 antibody. β-Actin was used as the reference protein. (C) FRK enzyme activity and (D) fructose concentration were also detected from the collected samples after injection. Bars represent the mean value ± Se (n ≥ 3). Different asterisks in (C) and (D) indicate significant differences based on independent t tests (*P < 0.05).
In line with the increase in MdFRK2 protein abundance, the FRK activity in the transgenic lines was significantly increased, by ∼41% to 68%, when treated with MG132 (Figure 5C). In stark contrast, the relative fructose concentration was significantly lower than in WT after treatment with MG132 (Figure 5D). Considering these analyses, there is a possibility that post-transcriptional regulation of MdFRK2 for the maintenance of fructose homeostasis by regulating FRK activity.
MdCacyBP facilitated the degradation of MdFRK2 via the ubiquitin–proteasome pathway
To further acknowledge the putative role of MdCacyBP in fructose regulation, a virus-induced gene silencing (VIGS) method was used to determine if the MdFRK2 protein was affected by manipulating MdCacyBP gene expression in WT and OE lines. The pTRV2–MdCacyBP construct was obtained and used to infiltrate ML, with the empty vector pTRV2 as a control (Figure 6A).
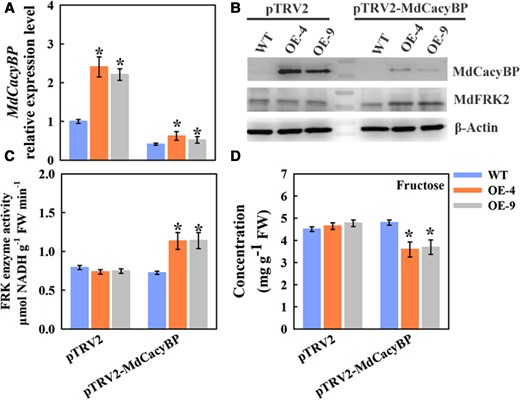
Virus-induced silencing of MdCacyBP decreased the fructose level in apple leaves. (A) MdCacyBP expression was investigated by RT-qPCR. The transcript levels were normalized to those of MdActin. The relative expression level for MdCacyBP was obtained via the 2−ΔΔCT method, setting its expression in WT leaves infiltrated with the empty vector pTRV2 as 1. (B) Abundances of MdCacyBP and MdFRK2 proteins in ML of the WT and MdFRK2-OE lines inside the injection areas 3 days after VIGS treatments. The leaf tissues at the injection region were used for protein detection. Proteins were extracted and probed with anti-MdCacyBP and anti-MdFRK2 antibodies, respectively. β-Actin was used as the reference protein. (C) FRK enzyme activity and fructose (D) measurements using three biological replicates. The empty pTRV2 vector was used as a control. Bars represent the mean value ± Se (n ≥ 3). The asterisks in A, C, and D indicate significant differences based on independent t tests (*P < 0.05).
RT-qPCR analysis revealed that the relative expression level of the MdCacyBP gene was significantly decreased by ∼59%–76% in the VIGS leaves compared with an empty vector, confirming that the infiltration assay was successful (Figure 6A). Consistent with this result, the MdCacyBP protein abundance was sharply decreased (Figure 6B, upper panel). Inversely, MdCacyBP silencing increased the abundance of MdFRK2 protein (Figure 6B, middle panel). This observation, together with the findings from the interactions assays and the MG132 treatment assay, strongly demonstrated that MdCacyBP interacted with and ubiquitinated MdFRK2, leading to its degradation at the protein level via the 26S proteasome pathway.
Since MdFRK2 overexpression modulated fructose metabolism by changing the FRK activity, we analyzed the FRK activity and fructose concentration in ML (Figure 6, C and D). Infiltration of pTRV2–MdCacyBP resulted in increased FRK activity and decreased fructose concentration compared with infiltration with the empty control. These measurements indicated that the MdCacyBP–MdFRK2 pathway possibly participates in modulating fructose concentrations.
MdCacyBP–MdFRK2 regulatory model is crucial for regulating fructose accumulation
To gain further evidence for the MdCacyBP–MdFRK2 regulatory module of fructose, a similar silencing experiment was conducted in WT and MdFRK2-OE apple fruits. Recombinant plasmid pTRV2–MdCacyBP was injected into young fruits (40 days after bloom) individually, with the empty vector pTRV2 injected into other fruits as a control. The flesh around each injection site was sampled 3 days after injection and used in the analysis (Figure 7A). MdCacyBP transcript levels were lower in OE fruits than in empty vector-transformed control fruits (Figure 7B). The immunoblot analysis of detached fruits confirmed that the silencing was successful. Silencing of MdCacyBP increased the MdFRK2 protein abundance compared with fruit injected with the empty vector pTRV2 (Figure 7C), similar to the results in leaves.
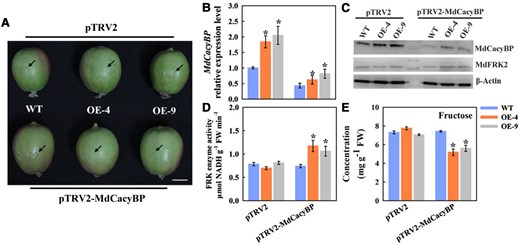
Virus-induced silencing of MdCacyBP decreased the fructose level in apple flesh. (A) Black arrows show the injection sites of Agrobacterium solution into the flesh of the WT and MdFRK2 overexpression transgenic apple at 40 days after bloom (DAB). Scale bars = 20 µm. (B) The RT-qPCR analysis of the relative expression levels of MdCacyBP around the injection sites. The transcript levels were normalized to those of MdActin. The relative expression level for MdCacyBP was obtained via the 2−ΔΔCT method, setting its expression in WT infiltrated with the empty vector pTRV2 as 1. The flesh infiltrated with an empty vector pTRV2 was used as a control. (C) Abundance of the MdCacyBP and MdFRK2 proteins in WT and MdFRK2-OE transgenic apple flesh inside the injection areas 3 days after VIGS treatments. The flesh at each injection region was used for protein detection. Proteins were extracted and probed with anti-MdCacyBP and anti-MdFRK2 antibodies, respectively. β-Actin was used as the reference protein. (D) FRK enzyme activity and (E) fructose measurements using three biological replicates. The empty pTRV2 vector was used as a control. Bars represent the mean value ± Se (n ≥ 3). The asterisks in B, D, and E indicate significant differences based on independent t tests (*P < 0.05).
However, we were still curious whether FRK activity and fructose concentration around the injection sites were affected by the transient expression assay. In fruit, similar results were obtained, that is, the promotion of MdFRK2 protein degradation caused low FRK activity, which consequently increased the concentration of fructose (Figure 7, D and E). Together, these results demonstrated that MdCacyBP promotes the degradation of MdFRK2 through a proteasome pathway, which decreases the FRK enzyme activity to elevate fructose concentration in transgenic apple trees.
Discussion
Plants, due to their sessile nature, have to withstand any hostile environments, such as various abiotic and biotic stresses, that can lead to adverse effects on cells (Zhang et al., 2022). Scientists have explored various response mechanisms that allow plants to cope with environmental stress via transgenic experiments (Zhu et al., 2021; Wang et al., 2022). However, the insertion of foreign genes into the plant genome can cause secondary effects, with some inhibiting plant growth to ensure survival (Lisch, 2012). Plants have a self-defense system composed of multi-gene regulatory networks and signal transduction pathways that have evolved to regulate and maintain cell homeostasis. Fructose acts as an important signaling molecule controlling plant growth and development, and regulation of its homeostasis has been reported previously (Cho and Yoo, 2011; Li et al., 2011). For example, in tomato transgenic lines, inhibiting the expression of SlFRK2 had negative effects on growth, yield, and active xylem development but had no significant effect on fructose levels (German et al., 2003; Davies et al., 2005; Damari et al., 2009). However, little is known about the molecular mechanism involved in the internal control of this fructose homeostasis.
FRK is a main metabolic enzyme and signal regulator of fructose and is vital for sensing fructose signals and regulating fructose levels (Kanayama et al., 1997; Cho and Yoo, 2011; Li et al., 2011; Yang et al., 2018). In earlier work, we found that overexpressing of FRK encoded by MdFRK2 in apple resulted in lower concentrations of fructose in the leaves of young plants (Yang et al., 2018). This is consistent with the fructose concentrations measured in ST, YL, Ph, and R of the transgenic lines and WT (Supplemental Figure 2A), with the lower levels detected largely related to the increased FRK enzyme activity in the transgenic apple lines (Supplemental Figure 2C). A possible explanation for this might be that the high catalytic capability of MdFRK2 phosphorylates a great deal of fructose in these four organs, making the rapid metabolism of fructose possible to supply the energy and metabolic intermediates needed by cell division and growth during plant development. Conversely, as the cell expansion continues, fructose accumulation is not able to provide the substrate and energy for sustaining growth of these organs, resulting in leaf wilting and root growth inhibition (German et al., 2003; Damari et al., 2009). The above analyses concur with previous findings that MdFRK2 plays a pivotal role in the efficient utilization of fructose at least in these organs.
However, in ML, YF, and MF of the transgenic apple trees, fructose concentration was significantly increased compared with WT (Figure 1A). The exact reason for this difference was unknown, but the YL, ST, Ph, and R are actively growing sink organs, and fructose concentrations are very low level compared with those in fruits. It is possible that in these tissues, there is a weak sense system to changed fructose levels. Our results on the concentration of fructose in ML and MF are not in agreement with those reported by Yang et al. (2018). We believe that the discrepancy might be important for two reasons. First, from an evolutionary perspective, the accumulation of fructose in apple fruits could ensure the sweetness of MF, helping to attract animals and humans for seed dispersal, because fructose is the sweetest soluble sugar found in fleshy fruits (Li et al., 2012). Second, this increase fructose in ML and MF could be attributed specifically to the reduction of FRK enzyme activity (Figure 1, B and C), because the abundance of MdFRK2 protein was substantially decreased (Figure 1D), implying that a system that operates to maintain the homeostasis of fructose among different organs might help avoid the negative effects associated with fluctuations in fructose concentration. Following this analysis, we postulated that the mechanism for regulating MdFRK2 protein levels in ML and MF through post-transcriptional regulation might exist.
Several previous reports have described post-transcriptional modifications have major impacts on protein function (Serrano et al., 2018; Chua et al., 2020). In general, multiple protein post-transcriptional modifications modulate protein stability, including ubiquitination, methylation, and phosphorylation (Yamanaka et al., 2003; Szweykowska-Kulinska and Jarmolowski, 2018; Yu et al., 2021). Our work based on IP–MS analyses identified an SCFTBL1 E3 ubiquitin ligase, MdCacyBP (Figure 2, A and B; Supplemental Figure 3; Supplemental Data Excel File 1), whose transcript was dramatically enhanced in ML and MF of the transgenic apples overexpressing MdFRK2 (Supplemental Figure 5C). Concomitantly, the results of our RNA-seq analysis (Figure 2, C and D; Supplemental Figure 4; Supplemental Data Excel File 2) provide evidence that ubiquitination-mediated post-transcriptional regulation of MdFRK2 protein influences fructose homeostasis in ML and MF. As a well-studied post-transcriptional modification, ubiquitination plays an important role in controlling the abundance of proteins (Vierstra, 2009). Likewise, CacyBP, an SCFTBL1 E3 ubiquitin ligase, has also been found to mediate the degradation of β-catenin through ubiquitin–proteasome in eukaryotic cells (Matsuzawa and Reed, 2001). Thus, this notion prompted us to consider a regulatory mechanism in which MdCacyBP controls the MdFRK2 protein levels, most likely through the ubiquitin–proteasome pathway.
Several E3 ubiquitin ligases involved in the degradation of target protein have been discussed in relation to the ubiquitin–proteasome pathway (Mazzucotelli et al., 2006; Julian et al., 2019; An et al., 2021). It is therefore plausible that MdCacyBP ubiquitinates MdFRK2 and leads to its degradation by 26S proteasome. Herein, several lines of evidence support the idea. First, MdCacyBP interacted with MdFRK2 both in vivo and in vitro (Figure 3). Second, the hypothesis is supported by the observed increase in the accumulation of MdFRK2 ubiquitinated forms in N. benthamiana when transiently co-expressed with MdCacyBP (Figure 4A). Third, the rapid degradation of in vitro MdCacyBP-mediated degradation of MdFRK2 relative to wild-type MdFRK2 in the cell-free degradation assay is consistent with this view. Fourth, VIGS-mediated transient silencing of MdCacyBP expression in ML and MF of the transgenic apple lines increased the level of MdFRK2 protein (Figures 6and 7), further revealing that MdCacyBP is required for the degradation of MdFRK2. Usually, proteins modified by ubiquitination enter the 26S proteasome for degradation to alter the protein levels, which affects various cellular activities including gene expression and signaling (Smalle and Vierstra, 2004). If this is the case, it was reasonable to suspect that MdCacyBP-mediated degradation of MdFRK2 through the proteasome pathway. More importantly, the application of proteasome inhibitors MG132 inhibited the degradation of the MdFRK2 protein in vitro (Figures 4D and5), demonstrating that ubiquitinated MdFRK2 can be degraded through the proteasome. Similar results have been found in eukaryotic cells, with CacyBP serving as an SCFTBL1 E3 ubiquitin ligase that enhanced proteasomal degradation of β-catenin (Matsuzawa and Reed, 2001). In view of the above analyses, our results reported here allow us to propose a working mechanism in which MdCacyBP interacts with MdFRK2 and targets its degradation by the ubiquitin–proteasome pathway.
As detailed above, the transgenic apple trees overexpressing MdFRK2 are likely to increase fructose concentrations in ML and MF through the MdCacyBP–MdFRK2 pathway. Similar post-transcriptional mechanisms have also been observed in controlling sucrose use and plant development (Kühn, 2016; Li et al., 2017; Chua et al., 2020). However, whether the degradation pathway functions to regulate fructose concentration requires further investigation. In the present study, we used the VIGS approach to silence MdCacyBP expression in MdFRK2-OE transgenic apple ML and MF, and, as expected, the mRNA level (Figures 6Aand 7B) and protein abundance (Figures 6Band 7C) decreased substantially due to the reduction of MdCacyBP expression. One remarkable observation from this study is that silencing MdCacyBP led to a reduction of fructose content in both ML (Figure 6D) and MF (Figure 7D) of the transgenic lines. This is likely due to increased fructose cleavage in the cells overexpressing MdFRK2. Importantly, support for this possibility comes from our study showing that silencing MdCacyBP expression increased FRK enzyme activity by 52%–57% in ML (Figure 6C) and by two-fold in young fruits (Figure 7D) since elevated FRK activity could significantly decrease the fructose content (Yang et al., 2018). The data obtained from this study provides further evidence for the observed increased fructose phenotype in ML and MF of transgenic apple overexpressing MdFRK2. Because of this, it is believed that MdCacyBP attenuates FRK enzyme activity by promoting MdFRK2 degradation, consequently decreasing the concentration of fructose. Accordingly, our study provides further evidence supporting the notion that the MdCacyBP–MdFRK2 pathway is involved in fructose homeostasis in different organs of apple plants.
Conclusions
Taken together, we crafted a model to summarize our findings (Figure 8). MdCacyBP physically interacted with MdFRK2 and directly targeted this protein for degradation by the ubiquitin–proteasome pathway, reducing the FRK enzyme activity to elevate fructose concentration and functioning as a braking mechanism for the regulation of fructose homeostasis in different organs. This study considerably advances our mechanistic understanding of how protein post-transcriptional regulation governs sugar homeostasis in plants.
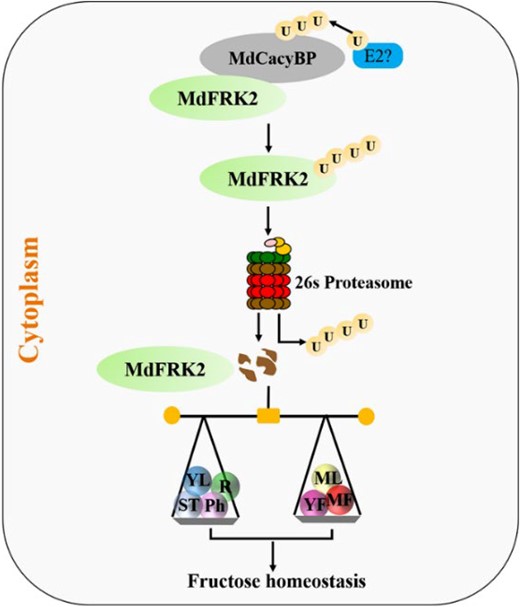
A dynamic regulatory module for the MdCacyBP–MdFRK2 regulation of fructose homeostasis in apple plants. MdCacyBP interacts with MdFRK2, promoting its degradation via the ubiquitin–proteasome pathway, which reduces the FRK enzyme activity to elevate fructose concentration and functioning as a braking mechanism for the regulation of fructose homeostasis in apple plants. U, Ubiquitin. Green ellipses indicate the MdFRK2 protein. Gray ellipses indicate the MdCacyBP protein. Different colored circles indicate the levels of fructose in seven different apple tissues. ST, shoot tips. YL, young leaves. ML, mature leaves. Ph, phloem; R, roots. YF, young fruits. MF, mature fruits. Black arrows indicate positive regulation.
Materials and methods
Plant materials and growth conditions
The wild-type (WT) and two previously described transgenic apple lines overexpressing MdFRK2 (OE-4 and OE-9) of cultivar “Royal Gala” (Malus × domestica) (Yang et al., 2018) were used in this study. All trees were grafted onto M.26 rootstocks and grown outside at the Horticultural Experimental Station of Northwest A&F University, Yangling, Shaanxi Province, China (34°20′N, 108°24′E) in 7.6-L plastic pots. The standard horticultural management was conducted using the method described by Li et al. (2018).
RNA extraction and RT-qPCR
Samples of ST, YL, ML, Ph, R, YF (40 days after bloom), and MF (130 days after bloom) were collected from the WT and transgenic (OE-4 and OE-9) apple plants and immediately placed into liquid nitrogen. Total RNA was extracted from frozen tissues as described by Su et al. (2021). We used total RNA to generate cDNA using PrimeScript II Reverse Transcriptase according to the manufacturer's instructions (Takara, Dalian, China). The detailed method for reverse transcription-quantitative polymerase chain reaction (RT-qPCR) was provided in Zhu et al. (2021). Actin (CN938023) was used as an internal control. The RT-qPCR was performed on three biological replicates containing three technical replicates each. The primers are listed in Supplemental Table 1.
Western blot analysis
Total protein samples were extracted as described previously (Sun et al., 2018), and the total concentrations were determined with protein assay kits (Bio-Rad, Hercules, CA, USA) using bovine serum albumin (BSA) as a standard. Western blotting assays were conducted as previously described (Yang et al., 2018). β-Actin was monitored with a monoclonal antibody (CWBIO, Beijing, China). The antigen–antibody complexes were detected using Clarity Western ECL Substrate (Bio-Rad, Hercules, CA, USA), and the protein bands were quantified using Alliance Q9 (UVI tec Ltd. Cambridge, UK) according to the manufacturer's instructions.
Determination of FRK enzyme activity and fructose concentration
The FRK enzyme activity was extracted and assayed according to a previously described method (Li et al., 2012) with minor modification. In brief, a 0.1-g sample was homogenized in 1 mL lysis buffer (50 mmol/L; 5 mM MgCl2, 2 mM EDTA, 2.5 mM DTT, 2 mM benzamidine, 0.1 mM leupeptin, 0.1% (w/v) BSA, 2% (v/v) glycerol, and 1% (v/v) Triton X-100). The extract was centrifuged at 8000 g for 20 min at 2°C. The activity of FRK was determined by monitoring the formation of NADH. A 1-mL reaction mixture contained 50 mM Tris (pH 8.5) buffer, 4 mM MgCl2, 2.5 mM ATP, 0.33 mM NAD, 1 U G6PDH, 1 U PGI, 4 mM fructose, and 60 μL extracted enzyme solution. After reaction for 3 min at 37°C, the NADH production was determined spectrophotometrically at 340 nm (UV-2600, Shimadzu).
To determine the concentration of fructose, the extraction steps were carried out as described previously (Li et al., 2012). The concentration of fructose was determined using a Shimadzu GC/MS-2010SE system (Shimadzu Corporation, Kyoto, Japan). The data were tested for three biological replicates and three technical replicates.
RNA-seq analysis
YL and ML were collected from WT and transgenic apple plants for total RNA extraction, with three biological replicates. RNA was sequenced using an Illumina HiSEq 2500 sequencer (Illumina, San Diego, CA, USA) by Biomarker (Beijing, China). The sequences were aligned to the GDDH13 Genome Version 1.1 by TopHat. Differentially expressed genes (DEGs) were determined by DEseq2 using a fold change ≥1.5 and a false discovery rate (FDR) of <0.05. Fragments Per Kilobase of transcript per Million fragments mapped (FPKM) was used to show transcript levels. Venn diagrams were created by Tbtools.
Immunoprecipitation with mass spectrometry (IP–MS)
IP–MS was conducted to screen for proteins that interact with MdFRK2. Briefly, the coding sequence of MdFRK2 gene was cloned into pGEX-4T-1 (GST tag) to generate the MdFRK2-GST construct. The construct was then transformed into Escherichia coli BL21 (DE3). The recombinant MdFRK2-GST protein was expressed with 0.5 mM IPTG at 16°C for 16 h and affinity-purified using GST-Resin (Glutathione Sepharose 4B). The absorbance of purified protein was measured at 595 nm. BSA was used to make a standard curve. Additionally, 30 μg of purified MdFRK2-GST protein was separated by sodium dodecyl sulfate–polyacrylamide gel electrophoresis (SDS–PAGE) and stained with Coomassie Brilliant Blue (CBB) to examine the purity.
Total proteins of MdFRK2-OE transgenic apple ML were prepared using IP buffer (25 mM Tris–HCl, pH 7.4, 150 mM NaCl, 1 mM EDTA, 1% (w/v) NP40, and 5% (v/v) glycerol) and incubated with purified MdFRK2-GST protein for 2 h. Immunoprecipitation was carried out according to the instructions of the Pierce Crosslink Magnetic IP/Co-IP Kit (Thermo Scientific, MA, USA). Then, the protein complexes were immunoprecipitated by anti-GST beads and finally the eluate was analyzed by LC–MS/MS (OE Biotech, Shanghai, China). The primers are listed in Supplemental Table 1.
Y2H assay
The coding sequence of MdCacyBP was cloned into the pGADT7 vector (for GAL4 AD fusion), resulting in MdCacyBP-AD. The coding sequence of MdFRK2 was cloned into the pGBKT7 (for GAL4 BD fusion) to form MdFRK2-BD. The pGBKT7-p53 and pGADT7-T pair was used as a positive control, whereas the empty vectors were used as negative controls. Various combinations were co-transformed into Y2H Gold strain (Clontech), followed by selection on SD/-Leu/-Trp media and SD/-Leu/-Trp/-His/-Ade media. The positive clones were transferred to SD/-Leu/-Trp/-His/-Ade/X-α-Gal. The primers are listed in Supplemental Table 1.
BiFC analysis
The coding sequences of MdFRK2 and MdCacyBP were cloned into pSYPCE and pSYPNE vectors to form the MdFRK2-YFPC and MdCacyBP-YFPN constructs, respectively. The plasmids were transformed into Agrobacterium strain GV3101. Pairwise infiltrations of MdFRK2-YFPC and MdCacyBP-YFPN were used to test interactions, while the combinations of MdFRK2-YFPC and YFPN or YFPC and MdCacyBP-YFPN were used as controls. These combinations were infiltrated into leaves of 3-week-old N. benthamiana. After 48–72 h, YFP fluorescence signals were then detected at the wavelength of 520–556 nm using a confocal laser scanning microscope (FV1000; Olympus, Tokyo, Japan) after excitation at the argon laser excitation of 514 nm. All primers used are shown in Supplemental Table 1.
Co-IP assay
The coding region of MdFRK2 and MdCacyBP was cloned into the pMDC83 vector (with a GFP tag) or the pGWB411 vector (with a Flag tag), respectively. These resulting constructs (MdFRK2-GFP and MdCacyBP-Flag) were transformed into Agrobacterium tumefaciens strain GV3101 and then co-infiltrated into 3-week-old N. benthamiana leaves. After 48–72 h, total proteins were extracted with IP buffer (25 mM Tris–HCl, pH 7.4, 150 mM NaCl, 1 mM EDTA, 1% (w/v) NP40, and 5% (v/v) glycerol). A coimmunoprecipitation experiment was carried out according to the instructions of the Pierce Crosslink Magnetic IP/Co-IP Kit (Thermo Scientific, MA, USA). The eluted proteins were subjected to Western blot detection with anti-GFP antibody (Abmart). The primers used for the Co-IP assay are listed in Supplemental Table 1.
Cell-free degradation assay
Protein degradation assays were performed as previously described, with minor modifications (Ma et al., 2022). Briefly, the coding sequence of MdCacyBP was cloned into the pET32a vector (with a His tag). The construct MdCacyBP-His was then transformed into E. coli BL21 (DE3) for expression. The recombinant MdCacyBP-His protein was purified using Ni-NTA His Bind Resin (New England Biolabs). Total proteins were extracted from WT or MdFRK2-OE apple leaves and incubated with MdCacyBP-His protein with 50 μM MG132 (Abmole Bioscience, Houston, TX, USA) or its solvent DMSO (Abmole Bioscience, Houston, TX, USA) for 0, 0.5, 1, or 3 h at 22°C. Western blots were incubated with anti-MdFRK2 (Genscript, Nanjing, China) or anti-β-Actin antibodies (CWBIO, Beijing, China). The primers used are listed in Supplemental Table 1.
Ubiquitination assay
In vivo ubiquitination assays were performed as previously described (Liu et al., 2010), with minor modifications. The coding regions of MdFRK2 and MdCacyBP were cloned into pMDC83 or pGWB411, resulting in MdFRK2-GFP and MdCacyBP-Flag plasmids. The plasmids were introduced into Agrobacterium strain GV3101. The Agrobacterium strains (MdFRK2-GFP or MdFRK2-GFP and MdCacyBP-Flag) were resuspended in the buffer containing 10 mM MgCl2, 10 mM MES-KOH, 180 μM acetosyringone, and 50 μM MG132 and co-infected into 3-week-old N. benthamiana leaves for 3 days. Immunoprecipitation was carried out according to the instructions of the Pierce Crosslink Magnetic IP/Co-IP Kit (Thermo Scientific, MA, USA). The immunoprecipitated proteins were detected using anti-GFP (Abmart) and anti-Ubi antibodies (Abmart). β-Actin (CWBIO, Beijing, China) was used as standardization. The primers are listed in Supplemental Table 1.
Proteasome inhibitor treatment
Healthy and uniform upper leaves of WT, OE-4, and OE-9 were selected for Agroinfiltration by an injection procedure used in apple plants (Meng et al., 2018) with some modifications. Briefly, 50 µM MG132 proteasome inhibitor solution was added into the MES buffer (10 mM MES-KOH, pH 5.2, 10 mM MgCl2, and 180 µM acetosyringone) and incubated at room temperature in the dark for 3 days. The mixture was injected at one site into attached ML per site using a syringe (by Figdraw, https://www.figdraw.com), with DMSO injected at another site on the same leaf as control. All combinations were performed in the same leaf. Three days after injection, the collected samples were used for FRK enzyme activity and fructose concentration determination with at least three biological replications in each case.
Virus-induced gene silencing of MdCacyBP in apple fruits and leaves
A 281-bp fragment of MdCacyBP (MD05G1283600) was amplified and cloned into pTRV2 to generate pTRV2–MdCacyBP. pTRV2-derived recombinant constructs were transformed into the A. tumefaciens strain GV3101 (pMP90) for VIGS experiments. Fruits and leaves infiltrations were performed as previously described (Lin et al., 2008). The injected samples were placed at room temperature in the dark for 3 days. Three days after injection, the collected samples were used for gene expression and fructose content detection with at least three biological replications in each case. All primers are shown in Supplemental Table 1.
Subcellular localization and sequence alignment
The coding sequence of MdCacyBP was fused into the modified CaMV35S-GFP vector pMDC83, generating the fusion construct 35S:GFP–MdCacyBP. 35S:GFP was used as a control. The 35S:GFP–MdCacyBP and 35S:GFP constructs were introduced into A. tumefaciens strain GV3101 and then infiltrated into N. benthamiana leaves as described (Zhu et al, 2021). GFP signals were detected at the wavelength of 500–530 nm using the FV1000 (Olympus, Tokyo, Japan) after excitation at the argon laser excitation of 488 nm (intensity 1%). All transient expression assays were repeated at least three times. All primers used are shown in Supplemental Table 1.
The MdCacyBP protein sequences of four different species were obtained from the NCBI database (https://www.ncbi.nlm.nih.gov/). The sequence alignment was performed using DNAMAN version 6.0 software (Lynnon Biosoft, San Ramon, CA, USA).
Statistical analysis
All data were analyzed using SPSS Statistics 21 (SPSS, Inc., Chicago, IL, USA) and graphed with Sigma Plot 12.5 (Systat Software, Palo Alto, CA, USA) software. Data were analyzed via independent t tests or one-way ANOVA, with a significance level accepted at P < 0.05. Values presented are means ± standard error (Se) of three independent experimental replicates.
Accession numbers
Sequence data from this work can be found in the GenBank/GDR data libraries under accession numbers MdFRK2 (MD04G1042400) and MdCacyBP (MD05G1283600).
Supplemental data
The following materials are available in the online version of this article.
Supplemental Figure S1. Levels of sucrose and glucose in ST (shoot tips), YL (young leaves), Ph (phloem), R (roots), ML (mature leaves), YF (young fruits), and MF (mature fruits) of wild-type (WT) and transgenic apple overexpressing MdFRK2 (OE-4 and OE=9).
Supplemental Figure S2. Levels of fructose, MdFRK2 transcripts, and FRK enzyme activities in ST (shoot tips), Ph (phloem), and R (roots) of wild-type (WT) and transgenic apple overexpressing MdFRK2 (OE-4 and OE-9).
Supplemental Figure S3. Select MdFRK2-associated proteins specifically identified by IP–MS.
Supplemental Figure S4. Candidate gene filtration via transcriptomics analysis.
Supplemental Figure S5. Functional characterization of MdCacyBP in apple.
Supplemental Figure S6. Expression analysis of MdCacyBP using pET32a vector.
Supplemental Table S1. Primers used in this study.
Supplemental Dataset S1. List of 603 proteins identified by IP–MS.
Supplemental Dataset S2. List of co-upregulated DEGs involved in the protein modification in mature leaves (ML) and young leaves (YL) of WT and MdFRK2-OE lines (OE-4 and OE-9).
Acknowledgments
We are grateful to Dr Jing Zhang, Dr Yangyang Yuan, and Miss Jing Zhao (Horticulture Science Research Center, Northwest A&F University, Yangling, China) for providing professional technical assistance with LC–MS/MS analysis.
Funding
This work was supported by the Program for the National Natural Science Foundation of China (Grant No. 31872043), the Shaanxi Science and Technology innovation team project (2022TD-12), and the Natural Science Foundation of Shaanxi Province (No. 2020JC-21).
References
Author notes
M.L., F.M., and B.M. designed the experiments. J.S., T.J., X.L., and L.Z. performed the research and analyzed the data. J.S. wrote the article. M.L., F.M., B.M., and J.S. discussed the manuscript.
The author responsible for distribution of materials integral to the findings presented in this article in accordance with the policy described in the Instructions for Authors (https://dbpia.nl.go.kr/plphys/pages/General–Instructions) is: Mingjun Li ([email protected]).
Conflict of interest statement. The authors declare that they have no competing interests.
