


Abstract
Identifying trait-associated genes is critical for rice (Oryza sativa) improvement, which usually relies on map-based cloning, quantitative trait locus analysis, or genome-wide association studies. Here we show that trait-associated genes tend to form modules within rice gene co-expression networks, a feature that can be exploited to discover additional trait-associated genes using reverse genetics. We constructed a rice gene co-expression network based on the graphical Gaussian model using 8,456 RNA-seq transcriptomes, which assembled into 1,286 gene co-expression modules functioning in diverse pathways. A number of the modules were enriched with genes associated with agronomic traits, such as grain size, grain number, tiller number, grain quality, leaf angle, stem strength, and anthocyanin content, and these modules are considered to be trait-associated gene modules. These trait-associated gene modules can be used to dissect the genetic basis of rice agronomic traits and to facilitate the identification of trait genes. As an example, we identified a candidate gene, OCTOPUS-LIKE 1 (OsOPL1), a homolog of the Arabidopsis (Arabidopsis thaliana) OCTOPUS gene, from a grain size module and verified it as a regulator of grain size via functional studies. Thus, our network represents a valuable resource for studying trait-associated genes in rice.
Introduction
Rice (Oryza sativa) is a major staple food for more than 3.5 billion people worldwide. To feed the increasing world population and meet their demand for healthier foods, it is critical to develop rice varieties with higher yield, better grain quality, and enhanced resilience to environmental stresses. In order to achieve such improvements, we need to understand the genetic basis of agronomic traits in rice.
Tremendous progress has been made in identifying rice trait genes over the past two decades. Over 2,000 genes that control important agronomic traits have now been cloned using methods such as map-based cloning, quantitative trait locus (QTL) analysis, or genome-wide association studies (Li et al., 2018b). For example, more than 100 genes that modulate grain size have been discovered, and they function in pathways like transcriptional regulation (e.g. GRAIN WIDTH 8 (GW8), GROWTH-REGULATING FACTOR 4 (OsGRF4)), G-protein (e.g. DENSE AND ERECT PANICLE 1 (DEP1), GRAIN SIZE 3 (GS3)), phytohormone (e.g. BIG GRAIN 1 (BG1), TILLERING AND SMALL GRAIN 1 (TSG1)), ubiquitination (e.g. GRAIN WEIGHT 2 (GW2), WIDE AND THICK GRAIN 1), and small RNA regulation (e.g. OsmiR396) (Fan et al., 2006; Song et al., 2007; Huang et al., 2009, 2017; Wang et al., 2012; Che et al., 2015; Duan et al., 2015; Liu et al., 2015; Li et al., 2018a; Guo et al., 2020). In addition, genes that regulate rice grain quality, leaf angle, stem strength, flowering time, nutrient-use efficiency, biotic/abiotic stress resistance/tolerance, and many other traits have also been identified (Li et al., 2018b; Chen et al., 2021). The identification of trait genes has boosted the effort to develop green super rice by pyramiding the superior alleles of these genes (Li et al., 2018b; Yu et al., 2022). However, despite the considerable progress that has been made, many trait genes still remain uncharacterized due to the complex nature of trait determinants. Additionally, our current understanding of rice trait genes is also fragmented. Although trait genes that control grain size have been discovered from diverse pathways, a systematic understanding of how these pathways might interconnect and whether these trait genes might form gene modules is still lacking. The same is true for the genes associated with many other traits. Therefore, we need a systematic method to connect and organize the known trait genes as well as to identify additional ones.
One key feature of biological systems is modularity: the genes fulfilling similar functions or participating in the same pathways tend to constitute gene modules within biological networks (Alon, 2003; Dong and Horvath, 2007). Gene co-expression network analysis is a powerful tool to identify such modules. For example, co-expression networks, which employ the Pearson correlation coefficient (PCC) to measure co-expression patterns between genes, have been constructed and used to identify gene modules that function in diverse pathways in Arabidopsis (Arabidopsis thaliana) (Mentzen and Wurtele, 2008; Mao et al., 2009; Bassel et al., 2011). Using expression profiles from anthers, a rice co-expression network RiceAntherNet was built to identify genes involved in anther and pollen development (Lin et al., 2017). For maize (Zea mays), a network was constructed via the PCC-based weighted gene co-expression network analysis method to identify development-related gene modules (Langfelder and Horvath, 2008; Walley et al., 2016). In addition to the networks based on the PCC, the graphical Gaussian model (GGM) is another method for building co-expression networks, which uses partial correlation coefficients (pcors) to infer correlation patterns between genes. The pcor between two genes is the correlation that remains after removing the effects of other genes. Partial correlation is considered to be a better choice than the PCC in gene network inference (Wille et al., 2004; Schafer and Strimmer, 2005). Previously, we used large-scale transcriptome datasets to build GGM gene co-expression networks for Arabidopsis and maize, which revealed a diverse array of gene modules functioning in various developmental, nutrient-use, and stress response pathways (Ma et al., 2007, 2015, 2017). However, no GGM network has been built for rice at present. Additionally, previous network studies have performed few or no in-depth and comprehensive analyses of trait-associated crop genes. How crop trait genes are distributed across co-expression networks remains largely unknown. It is worthwhile to ask, for example, whether rice trait genes form gene modules, and if so, how to identify such modules and use them to discover additional trait genes in rice.
We show in this study that rice trait genes tend to form modules within gene co-expression networks, and such trait-associated gene modules can facilitate the identification of additional trait genes through reverse genetics. By leveraging the information from large-scale RNA-seq datasets, we constructed a rice GGM gene co-expression network and identified 1,286 gene co-expression modules. A trait ontology (TO) enrichment assay revealed that a number of the modules are enriched with rice trait genes. These modules were therefore considered to be trait-associated gene modules. They dissect the genetic basis of agronomic traits like grain size, grain number, tiller number, grain quality, leaf angle, stem strength, and anthocyanin content. The modules can also be used to identify additional trait genes. As an example, we identified a candidate gene, OsOPL1, from a grain size module and verified that it is a regulator of grain size via functional studies. Thus, our analysis provides a valuable resource for studying rice trait-associated genes.
Results
A pipeline to identify trait-associated gene modules for rice
In this study, we developed a pipeline to test and identify trait-associated gene modules for rice (Figure 1A). We first constructed a rice gene co-expression network and identified gene co-expression modules. Publicly available rice RNA-seq transcriptomes were downloaded as of June 2021 from the National Center for Biotechnology Information (NCBI) Sequence Read Archive (SRA) database. After quality control, the transcriptomes from 8,456 high-quality RNA-seq runs were retained and processed using a uniform pipeline to obtain the counts per million (CPM) gene expression values. After filtering out genes that were expressed at low levels, a rice gene expression matrix with the expression values of 33,846 genes was generated. We then used the matrix to construct a rice gene co-expression network, RiceGGM2021, based on the GGM. Specifically, following a procedure published previously (Ma et al., 2007), we calculated the pcors between all genes and selected 612,752 gene pairs with pcor ≥ 0.035 to build the gene co-expression network (Supplemental Figure S1; Supplemental Table S1).
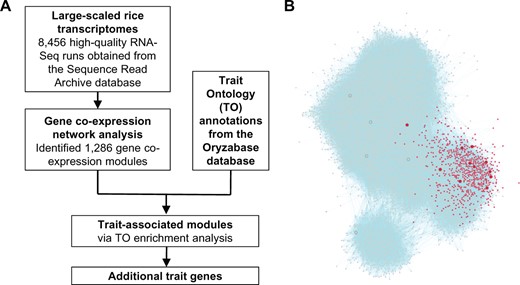
A pipeline for the identification of trait-associated gene modules in rice. A, An overview of the analysis workflow. B, An example showing that trait genes associated with stem strength are enriched in module M6. Shown here is the rice GGM gene co-expression network. Only genes from the top 15 largest modules are shown due to space limitation. Nodes represent genes, and connections between genes indicate that they are co-expressed. Nodes shown in red are the genes from module M6, while nodes of larger size are the genes possessing the TO annotation term stem strength. Compared to all background genes used for network construction, stem strength genes are enriched by 19.7-fold within module M6 (enrichment ratio, ER = 19.7).
Using the MCL clustering algorithm, the network was then clustered into 1,286 gene co-expression modules (Supplemental Table S2; van Dongen, 2000). We further expanded these modules by adding to them the outside genes that are connected to at least five genes within the original modules. The expanded modules contain genes that are highly interconnected and they should have similar co-expression patterns. Gene ontology (GO) analysis identified 198 gene modules with significantly enriched GO terms (Benjamini-Hochberg (BH) adjusted P-value, P ≤ 1E-03) (Table 1, see Supplemental Table S3 for a complete list); examples are modules M6 (cell wall organization or biogenesis), M49 (auxin-activated signaling pathway), M50 (nutrient reservoir activity), M70 (flower development), M82 (flavonoid biosynthetic process), and M128 (starch metabolic process). The identified modules effectively group together the genes that may participate in the same biological pathways, and they constitute the basis to test and search for trait-associated gene modules.
Enriched GO terms for selected gene modules
| Module | Enriched GO Term | P-value (BH Adjusted) |
|---|---|---|
| M3 | Chloroplast organization | 2.02E-55 |
| M5 | Chloroplast | 2.11E-60 |
| M6 | Cell wall organization or biogenesis | 4.64E-34 |
| M8 | Chloroplast | 7.33E-128 |
| M10 | Lipid metabolic process | 2.29E-13 |
| M21 | Seed germination | 1.32E-07 |
| M23 | Cellular response to phosphate starvation | 4.12E-35 |
| M32 | Response to aluminum ion | 5.15E-08 |
| M35 | Single-organism developmental process | 9.00E-16 |
| M37 | Suberin biosynthetic process | 5.53E-09 |
| M38 | Cell wall organization | 7.80E-14 |
| M45 | Phenylpropanoid metabolic process | 5.08E-31 |
| M46 | Pollen wall assembly | 1.32E-22 |
| M49 | Auxin-activated signaling pathway | 6.33E-42 |
| M50 | Nutrient reservoir activity | 5.09E-32 |
| M51 | Endoplasmic reticulum | 7.86E-45 |
| M55 | Response to nitrate | 2.22E-16 |
| M58 | Response to cytokinin | 1.44E-13 |
| M64 | Wax biosynthetic process | 1.84E-18 |
| M70 | Flower development | 1.55E-17 |
| M82 | Flavonoid biosynthetic process | 2.02E-20 |
| M88 | Circadian rhythm | 3.83E-18 |
| M94 | Iron ion homeostasis | 4.52E-18 |
| M95 | Cellular response to iron ion starvation | 1.00E-33 |
| M109 | Transcription, DNA-templated | 5.50E-17 |
| M127 | Transcription, DNA-templated | 7.50E-08 |
| M128 | Starch biosynthetic process | 2.80E-18 |
| M166 | Vegetative to reproductive phase transition of meristem | 1.14E-08 |
| M187 | Allantoin metabolic process | 9.75E-04 |
| M199 | Response to nitrate | 1.39E-06 |
After obtaining the gene co-expression modules, we tested to see whether any of them are associated with rice agronomic traits. For that purpose, we used the TO annotations obtained from the rice database Oryzabase (Kurata and Yamazaki, 2006). TO annotation terms are usually assigned to rice genes if their mutant or overexpression lines display trait-related phenotypes. A TO enrichment analysis (see “Material and methods” for details) was conducted to identify the gene modules that are enriched with trait-associated genes (Supplemental Table S4). The modules with enrichment P-values (P, BH-adjusted) ≤ 0.001 were considered to be trait-associated gene modules. As an example, among all 33,846 genes used for network construction, 30 were found to possess the TO term stem strength, while module M6 contains 11 genes with the same term among its 631 genes (Figure 1B). Thus, compared to the entire network, stem strength-related genes are enriched 19.7-fold in module M6 (P = 3.57E-10, enrichment ratio, ER = 19.7), and the module is considered to be associated with the trait stem strength. Using a similar procedure, we identified gene modules associated with a broad range of important rice agronomic traits, as discussed in detail below.
Modules associated with yield
Grain yield in rice is a complex trait determined by the number of panicles per plant, the number of grains per panicle, and grain weight. We identified yield-related gene modules covering all three aspects. Among them, modules M35, M49, and M70 are related to grain size, a major determinant of grain weight, while M109 regulates both tiller number and grain number.
Module M35 contains 354 genes in total. According to the two published rice developmental transcriptome datasets (Jain et al., 2007; Li et al., 2007a), the genes in M35 are mainly expressed in shoot apical meristems (SAMs) and young panicles, with some of them also expressed in the root, embryo, and ovary (Supplemental Figure S2). The module has 14 genes possessing the TO terms grain size or seed size, such as GW5/GRAIN SIZE ON CHROMOSOME 5 and IQ67-DOMAIN 14, which encode two IQ-domain proteins that regulate seed size; OsGRF4/GS2 and GRF-INTERACTING FACTOR 1, genes that encode two proteins that interact with one another and both regulate seed size; and DEP1, which encodes a G protein Gγ subunit that modulates both grain size and panicle architecture (Figure 2A, and see Supplemental Table S4 for details, same as below) (Huang et al., 2009; Che et al., 2015; Duan et al., 2015, 2017; Liu et al., 2017b; Sun et al., 2018; Yang et al., 2020). In comparison, the entire network contains only 138 genes with the same TO terms (for simplicity, we will refer to genes with the TO terms grain size or seed size collectively as grain size genes hereafter). Thus grain size genes are enriched 9.7-fold in module M35 (P = 3.54E-08, ER = 9.7), and the module is considered to be associated with grain size. We speculated that there might be more genes involved in the regulation of grain size within the module. Indeed, in addition to the 14 genes with the TO terms grain size or seed size, another three genes are also known regulators, including XIAO, which encodes a leucine-rich repeat receptor-like kinase that regulates seed size via the brassinosteroid (BR) pathway, as well as OsbZIP47 and WIDE GRAIN 1, two genes identified recently as seed size regulators (Jiang et al., 2012; Hao et al., 2021). In addition, another three genes are regulators of a related trait, grain length, including LONG GRAIN 1, GRAIN NUMBER, GRAIN LENGTH AND AWN DEVELOPMENT 1, and OsDOF15 (Jin et al., 2016; Morita et al., 2019; Qin et al., 2019). The module also contains other candidate genes for potential regulators, such as six GRFs (GRF2/3/5/9/10/12) and three IQ-domain-containing genes that are homologous to OsGRF4 and GW5, respectively. In addition to grain size, the module is also enriched with genes for inflorescence branching (P = 5.55E-06), grain number (P = 3.93E-04), and leaf angle (P = 1.93E-04) (Supplemental Table S4). Thus, consistent with its expression pattern, this module could be a key module that regulates development of the SAM, panicle, and early grains.
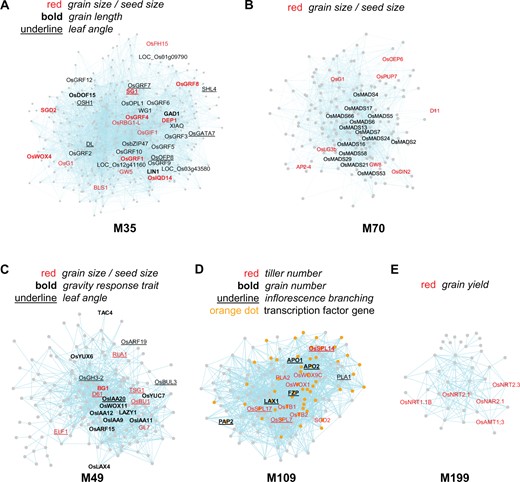
Gene modules associated with yield. A–C, Three modules, M35, 70, and 49, associated with grain size/seed size. Grain size/seed size genes are enriched 9.7-, 11.2-, and 10.5-fold in M35, M70, and M49, respectively. M35 is also associated with grain length (ER = 10.5) and leaf angle (ER = 9.2), and M49 with gravity response trait (ER = 58.0) and leaf angle (ER = 25.6). D, Module M109 associated with tiller number (ER = 13.3), grain number (ER = 23.8), and inflorescence branching (ER = 52.1). E, Module M199 associated with grain yield (ER = 24.3). Nodes represent genes, and connections between genes indicate that they are co-expressed. Gene names are shown for selected genes only due to space limitation. The genes possessing specific TO annotation(s) or belonging to a specific gene category are indicated by colored, bold, or underlined text, or colored dots. The same explanation applies to Figures 3 and 4.
Another module, M70, contains eight grain size genes (P = 7.00E-06, ER = 11.2), including GW8/OsSPL16 and LONG GRAIN 3b/OsMADS1 (Figure 2B; Wang et al., 2012; Yu et al., 2018). Compared to M35, most of the genes in M70 are expressed at a later stage of inflorescence development (i.e. throughout panicle and early seed development but not in the SAM) (Supplemental Figure S2). This module is also enriched with genes for lemma and palea anatomy and morphology trait (P = 3.20E-10, ER = 67.3) and flower development trait (P = 3.20E-10, ER = 48.1) ( Supplemental Table S4). It contains 16 MADS box genes that might play roles in specifying inflorescence organ identities.
M49 is another module that is enriched with seven grain size genes (P = 7.56E-05, ER = 10.5), such as BG1, TSG1/FISH BONE (FIB), and DWARF 61 (D61) (Figure 2C) (Morinaka et al., 2006; Liu et al., 2015; Guo et al., 2020). These trait genes mainly function through the auxin and BR pathways to regulate seed size. For example, BG1 encodes a regulator of auxin transport, and overexpression of this gene substantially increases grain size. TSG1 encodes a tryptophan aminotransferase that is required for local auxin biosynthesis, and plants carrying mutations in TSG1 have reduced grain size, while D61 encodes the BR receptor OsBRI1, and mutations in D61 cause pleotropic phenotypes including decreased seed size (Morinaka et al., 2006; Liu et al., 2015; Guo et al., 2020). In addition to grain size genes, M49 is also enriched with genes for auxin sensitivity (P = 4.67E-22, ER = 21.6) and brassinosteroid sensitivity (P = 4.46E-05, ER = 15.6). Unlike both M35 and M70, the genes in M49 are expressed broadly in various rice tissues (Supplemental Figure S2). Thus, M49 is considered to be a general hormone-related module that functions in auxin and BR pathways across multiple rice tissues, including regulating seed size in inflorescences. In summary, our analysis identified three modules in which the genes are expressed at different developmental stages and regulate grain size via different mechanisms.
Besides grain size, we also identified a module M109 that regulates both tiller number and grain number (Figure 2D). The module contains 150 genes, many of which have low but preferred expression in the SAM (Supplemental Figure S2). M109 is enriched with nine genes that control tiller number (P = 1.17E-06, ER = 13.3). Among them are three genes encoding SBP transcription factors (TFs): OsSPL7, OsSPL14, and OsSPL17. Knocking down the expression of both OsPL14 and OsSPL17 and overexpressing all three SBP genes changed tiller numbers in the mutant/over-expression plants (Wang et al., 2015). OsSPL14 is also known as IDEAL PLANT ARCHITECTURE 1, a gene that regulates optimal plant architecture for grain yield (Jiao et al., 2010; Miura et al., 2010). Also included are two TCP (OsTB1 and OsTB2) and three HB (OsWUS, OsHox3, and WUSCHEL-LIKE HOMEOBOX 9c (OsWox9c)) TF genes. OsTB1 and OsTB2 are homologs of the maize branching gene Teosinte branched 1, and they negatively and positively regulate rice tillering, respectively (Lyu et al., 2020). Interestingly, while tillering is a vegetative branching process, M109 is also enriched with nine genes that regulate inflorescence branching at the reproductive stage (P = 1.15E-11, ER = 52.0), including the three SBP genes (Figure 2D). The other six genes are FRIZZY PANICLE (FZP), LAX PANICLE 1 (LAX1), PANICLE PHYTOMER 2 (PAP2), ABERRANT PANICLE ORGANIZATION 1 (APO1), APO2, and PLASTOCHRON 1 (Itoh et al., 1998; Komatsu et al., 2001, 2003; Kobayashi et al., 2010; Huang et al., 2021). Additionally, among these nine inflorescence branching genes, six, including OsSPL14, FZP, PAP2, APO1, APO2, and LAX1, also regulate grain number (P = 6.04E-6, ER = 23.8). In total, 15 trait genes for tiller number, grain number, and inflorescence branching are found in this module, 12 of which are TF genes, highlighting the importance of TFs in the regulation of these traits. Since M109 also contains another 43 TF genes (Figure 2D), we speculate that among them there could be more potential regulator genes.
The yield modules discussed above are mainly modules that regulate development. We also identified another yield module, M199, that is related to nutrient use efficiency (Figure 2E). The module is enriched with five grain yield genes (P = 7.85E-05, ER = 24.3). Interestingly, four of these genes encode nitrate transporters (NRT1.1B, NRT2.1, NRT2.3, and NAR2.1), and the fifth encodes an ammonium transporter (AMT1;3), all of which function in nitrate or ammonium uptake and utilization (Xu et al., 2012; Hu et al., 2015; Lee et al., 2020). Thus, in agreement with the complex nature of the yield trait, we have identified yield-associated gene modules that function in multiple pathways.
Modules associated with grain quality
The endosperm, which makes up ∼90% of the rice grain after the hull is removed, plays an important role in determining rice grain quality. We identified a module, M50, with genes specifically expressed in the endosperm (Supplemental Figure S3). The module contains 76 genes annotated as endosperm-specific genes (Supplemental Table S2). M50 is enriched with genes possessing the GO terms “nutrient reservoir activity” (P = 5.09E-32) and “starch biosynthetic process” (P = 7.02E-15). TO enrichment analysis indicated that the module regulates three aspects of grain quality: eating and cooking quality (ECQ), grain protein content, and chalkiness (Figure 3).
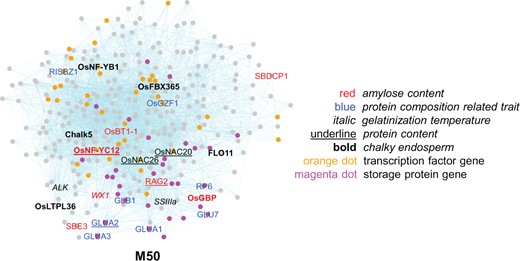
A gene module associated with rice grain quality. Module M50 is associated with multiple aspects of rice grain quality: amylose content (ER = 37.1), gelatinization temperature (ER = 47.7), protein content (ER = 29.3), protein composition-related trait (ER = 52.4), and chalky endosperm (ER = 31.2). For the explanation of terms and colors refer to Figure 2.
Grain ECQ is mainly determined by three physicochemical properties: amylose content, gel consistency, and gelatinization temperature (Tian et al., 2009). M50 is enriched with seven genes for amylose content (P = 9.65E-09, ER = 37.1), including BRITTLE1-1, GBSS-BINDING PROTEIN, and WAXY1 (WX1), and three genes for gelatinization temperature (P = 1.71E-04, ER = 47.7), ALKALI DEGENERATION (ALK), SOLUBLE STARCH SYNTHASE IIIA, and STARCH BRANCHING ENZYME 3 (Figure 3) (Tian et al., 2009; Li et al., 2017,Wang et al., 2020b). Most of these genes participate in starch biosynthesis. Among them, WX1, which encodes granule-bound starch synthase I, is responsible for amylose synthesis, and ALK, which encodes starch synthase IIa, is involved in amylopectin chain elongation. WX1 and ALK are two major loci known to control amylose content and gelatinization temperature, respectively (Tian et al., 2009). Interestingly, in addition to the endosperm-specific starch biosynthesis genes, we also identified another module, M128, that is enriched with 12 starch biosynthesis genes (P = 2.80E-18) (Supplemental Figure S4). Instead of being specific to endosperm, these genes have broad expression patterns in multiple rice tissues (Supplemental Figure S3). However, M128 does not have significant enrichment of genes related to amylose content and gelatinization temperature. Thus, there exist two modules for starch biosynthesis, with one being specific to endosperm and the other functioning in multiple tissues. The starch biosynthesis genes and their potential transcriptional regulators in module M50 might serve as better candidates for discovering additional ECQ-related genes than those in M128.
Grain protein content is a key determinant of rice grain nutritional quality. M50 is enriched with five genes for protein content (P = 4.53E-06, ER = 29.3) and eight genes for protein composition-related trait (P = 3.68E-11, ER = 52.4) (Figure 3). Among these trait genes, six encode storage proteins (globulin, glutelin, and prolamin) and five encode TFs (OsNAC20, OsNAC26, OsNF-YC12, OsRISBZ1, and OsGZF1) that regulate the expression of storage protein genes (Chen et al., 2014; Xiong et al., 2019; Wang et al., 2020a; He et al., 2021). Thus, storage proteins and their transcriptional regulators are important determinants of grain protein content. We found another 25 storage protein genes as well as 32 TF genes within the module, and these could serve as candidate genes for protein content regulators.
Chalk is the opaque area within the endosperm and chalkiness is the most important indicator of the rice appearance quality. The entire network contains only 25 genes related to chalky endosperm, and module M50 is enriched with seven of them (P = 2.21E-08, ER = 31.2), including Chalk5, OsNF-YC12, and FLOURY ENDOSPERM 11 (OsFLO11). Among these genes, Chalk5 encodes an endosperm-specific pyrophosphatase that regulates chalkiness, OsNF-YC12 encodes a TF that regulates storage protein expression and which results in chalky endosperm when the expression is knocked down, while flo11-2, a mutant allele of OsFLO11, is involved in temperature-dependent chalkiness in rice grain (Li et al., 2014; Xiong et al., 2019; Tabassum et al., 2020).
In addition to the endosperm-specific module M50, we also identified another module, M21, that is specific to the rice embryo and contains 25 genes encoding late embryogenesis abundant proteins (Supplemental Figure S3). However, M21 does not show significant enrichment for grain quality-related trait genes, indicating that the endosperm might play a more important role.
Modules associated with leaf angle
Leaf angle is a key factor for determining rice plant architecture. An erect leaf angle can increase plant density and light capture efficiency for photosynthesis, leading to an increase in grain yield (Sakamoto et al., 2006). We identified three gene modules involved in regulating leaf angle: M49, M38, and M35. M49 is enriched with nine genes for leaf angle (P = 2.91E-09, ER = 25.6), such as GRETCHENHAGEN 3-2 (OsGH3-2), Aux/IAA protein 12 (OsIAA12), TSG1/FIB, BRASSINOSTEROID UPREGULATED 1 (BU1), ERECT LEAF 1 (ELF1), and REDUCED LEAF ANGLE 1 (RLA1)/SMALL ORGAN SIZE 1 (Figure 2C). As discussed before, M49 mainly participates in the auxin and BR pathways. Similarly, among the trait genes, OsGH3-2, TSG1, and OsIAA12 function in the auxin pathway, and their overexpression (OsGH3-2 and OsIAA12) or loss of function (TSG1) cause increased leaf inclination angle, while BU1, ELF1, and RLA1 encode positive BR signaling regulators and their mutant or RNAi lines have erect leaves (Tanaka et al., 2009; Sakamoto et al., 2013; Qiao et al., 2017; Chen et al., 2018; Guo et al., 2020). It is interesting that the module also contains 12 genes for gravity response trait (P = 7.30E-17, ER = 58.0), and three of these 12 genes, LAZY1, TILLER ANGLE CONTROL 4, and OsWOX11, are also regulators of tiller angle (Li et al., 2007b, 2021; Zhang et al., 2018). Another two genes within the module, HOMEOBOX GENE 1 (OsHOX1) and OsHOX28, also regulate tiller angle by modulating auxin content (Hu et al., 2020). Thus, M49 could integrate auxin and BR signals to regulate rice plant architecture via both leaf and tiller angles.
In comparison, M38 mainly functions via the BR pathway to regulate leaf angle, since it is enriched with eight genes for leaf angle (P = 6.75E-05, ER = 9.9) and 10 genes for brassinosteroid sensitivity (P = 1.82E-06, ER = 11.3), and it does not have enrichment for auxin sensitivity genes (Figure 4A). Similar to M49, the genes in M38 also have broad expression patterns in rice plants (Supplemental Figure S2), indicating that they might regulate BR signaling in multiple tissues. In contrast, M35 is enriched with seven genes for leaf angle (P = 1.93E-04, ER = 9.2) (Figure 2A), but the genes in module M35 are mainly expressed in the SAM and young panicles (Supplemental Figure S2), as discussed above in the section “Modules associated with yield”, indicating that its functional scope is more specific.
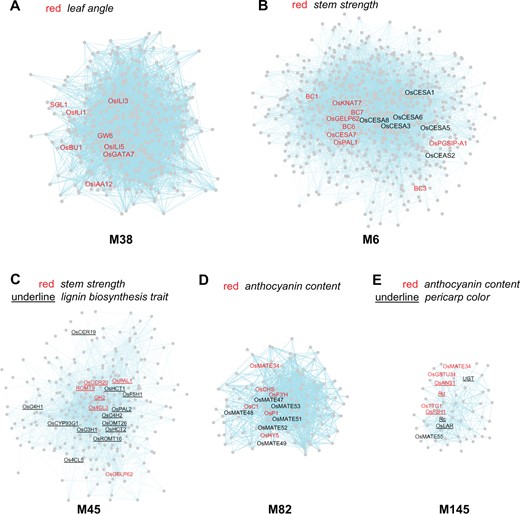
Gene modules associated with leaf angle, stem strength, and anthocyanin content. A, Module M38 associated with leaf angle (ER = 9.9). B and C, Modules M6 and 45 associated with stem strength (ER = 19.7 and 28.7, respectively). M45 is also associated with lignin biosynthesis trait (ER = 87.1). D and E, Modules M82 and 145 associated with anthocyanin content (ER = 105.7 and 217.2, respectively). M145 is also associated with pericarp color (ER = 369.2). For the explanation of terms and colors refer to Figure 2.
Modules associated with stem strength
Stem strength, defined as the bending or breaking strength of the culm, is important for the plant to resist lodging. We identified two gene modules that regulate stem strength, M6, and M45. The entire gene network contains 30 genes for stem strength, and M6 is enriched with 11 of them (P = 3.57E-10, ER = 19.7) (Figure 4B). Most of these 11 genes function in cell wall biogenesis, such as BRITTLE CULM 1, BC6/OsCESA9, and BC7/OsCESA4 (Li et al., 2003; Yan et al., 2007; Kotake et al., 2011). GO analysis indicated that M6 contains 50 cell wall-related genes (P = 1.41E-59), including nine genes encoding cellulose synthase A catalytic subunits 1–9. In comparison, M45 is enriched with six genes for stem strength (P = 1.59E-06, ER = 28.7), such as 4-COUMARATE:COENZYME A LIGASE 3, GOLD HULL AND INTERNODE 2, and GDSL ESTERASE/LIPASE PROTEIN 62 (Figure 4C; Gui et al., 2011; Ookawa et al., 2014; Zhang et al., 2019). The module mainly functions in lignin biosynthesis as it is enriched with 17 genes for lignin biosynthesis trait (P = 2.77E-28, ER = 87.1). Thus, our analysis identified two modules for cell wall and lignin biosynthesis that are associated with stem strength, consistent with the fact that cell walls and lignin play important roles in determining stem strength (Shah et al., 2019). Since these two modules contain many more genes involved in these two biosynthetic processes, there might be more potential regulators of stem strength among them.
Modules associated with anthocyanin content and other traits
Anthocyanins are a class of flavonoids with anti-oxidation activity that are beneficial to human health. They are the major metabolites that impart purple, brown, or red colors to various rice plant tissues, including the pericarp and aleurone. The anthocyanin biosynthesis pathway has been studied extensively in Arabidopsis and maize but less so in rice. Here, we identified two modules that regulate anthocyanin content, M82 and M145. M82 contains six anthocyanin content genes (P = 1.13E-09), including CHROMOGEN FOR ANTHOCYANIN and OsP1, which represents a 106-fold enrichment compared to the entire network (Figure 4D; Chin et al., 2016; Zheng et al., 2019). M145 contains six anthocyanin content genes as well (P = 2.12E-12, ER = 217.2), including Rd (RED PERICARP AND SEED COAT) and OsTTG1 (TRANSPARENT TESTA GLABRA 1) (Figure 4E; Furukawa et al., 2007; Yang et al., 2021). The M145 module is also enriched with six genes for pericarp color (P = 7.26E-14, ER = 369.2), two of which are Rc (BROWN PERICARP AND SEED COAT) and Rd (Zheng et al., 2019; Xia et al., 2021). The two modules contain 113 (M82) and 55 genes (M145), among which there might be more regulators of anthocyanin content. For example, in Arabidopsis a MATE efflux transporter called TT12 is involved in transporting anthocyanin or proanthocyanidins into vacuoles (Zhao and Dixon, 2009). We identified eight rice genes that encode MATE transporters within these two modules. Of these gene, a recent study has suggested that OsMATE34 encodes a putative anthocyanin transporter in black rice (Mackon et al., 2021). The other seven genes could serve as candidates for future studies to determine whether they also transport anthocyanin or related metabolites.
In addition to the traits discussed above, we also identified gene modules associated with other traits, such as leaf color (M3, M5, and M8), leaf shape (M64 and M127), leaf gloss (M10), male sterility (M46), floury endosperm (M51), flowering time (M88 and M166), cytokinin sensitivity (M58), iron sensitivity (M94 and M95), and nitrogen sensitivity (M187) (Supplemental Table S4). These modules provide ample information for studying the related traits in rice.
The trait-associated modules contain genes that overlap with QTL regions
QTL analysis is widely used to identify genomic regions that influence the phenotypic variation of rice agronomic traits. The QTL Annotation Rice Online (Q-TARO) database has cataloged QTLs for a diverse array of rice traits, but the causal genes behind many of these QTLs have yet to be identified (Yonemaru et al., 2010). We asked whether any of the genes within the trait-associated modules fall in known QTL regions. A comparison identified overlaps between the two datasets. For example, 132 genes from the grain size modules (M35, M49, and M70), 57 genes from the grain quality module (M50), and 8 genes from the flowering time modules (M88 and M166) locate within the QTL regions for seeds, ECQ, and flowering, respectively, in which the causal genes have yet to be determined (Supplemental Table S5). These genes overlap with QTL regions and can thus be considered as potential candidate genes for the corresponding traits. However, since the QTL regions contain a large number of genes, further studies are required to determine whether or not these candidate genes are the actual causal genes for the QTLs. Alternatively, in addition to analyzing their overlaps with QLTs, we can also use reverse genetic approaches to investigate whether the genes within the trait-associated modules, especially the uncharacterized ones, regulate the corresponding traits, as exemplified below.
The trait-associated modules facilitate the identification of a grain size regulator
The trait-associated gene modules discussed above contain genes with similar co-expression patterns that might function in the same pathways, and trait-associated genes are enriched between 9.2- and 369-fold within these modules. According to the “guilt-by-association” principle, the uncharacterized genes within these modules could also function in the same pathways to regulate the corresponding traits. They are ideal candidates for discovering additional trait-associated genes. As an example, in the grain size module M35, we identified an uncharacterized rice gene, LOC_Os01g63310, and named the gene OCTOPUS-LIKE 1 (OsOPL1) since it is homologous to the Arabidopsis OCTOPUS (OPS) gene (34% identity and 49% positive at the protein sequence level) and its homologs OPL1 and OPL2 (Figure 2A; Supplemental Figure S5). In Arabidopsis, OPS and OPL2 regulate phloem differentiation, root growth, and vascular patterning (Truernit et al., 2012; Rodriguez-Villalon et al., 2014; Anne et al., 2015; Ruiz Sola et al., 2017). We hypothesized that OsOPL1 might be a regulator of grain size in rice due to its inclusion in module M35.
We carried out functional assays on OsOPL1. To examine its tissue-specific expression patterns, we generated OsOPL1 promoter::GUS (proOsOPL1::GUS) transgenic rice plants in the japonica variety “Zhonghua11” (ZH11). β-glucuronidase (GUS) activity was detected in young panicles, roots, coleoptiles, and shoot tips, with the strongest expression observed in young panicles (Figure 5A). We also measured the expression level of OsOPL1 in ZH11 plants using reverse transcription-quantitative PCR (RT–qPCR), and found that the expression of OsOPL1 decreases during panicle development (Figure 5B). These results showed that the expression patterns of OsOPL1 are similar to that of the genes in module M35.

Identification of OsOPL1 as a regulator of grain size in rice. A, OsOPL1 expression was investigated using transgenic rice lines expressing proOsOPL1::GUS. GUS activity in proOsOPL1::GUS plants was detected in young panicles, roots, coleoptiles, and shoot tips. GS, germinating seeds; YP, young panicles of different lengths. B, RT–qPCR analysis of OsOPL1 expression in young ZH11 panicles 1 cm (YP1), 5 cm (YP5), 10 cm (YP10), 15 cm (YP15), and 20 cm (YP20) in length. Values are means ± se (n = 3). C, Two independent loss-of-function mutant lines, osopl1-1 and osopl1-2, were generated for OsOPL1 using CRISPR/Cas9-based genome editing. The gene structure of OsOPL1 and the mutated sites in osopl1-1 and osopl1-2 are shown. The two lines have different 1-bp insertions within the coding region of OsOPL1 that lead to translational frameshifts. D, Grain width (top) and length (bottom) in ZH11, osopl1-1, and osopl1-2. E and F, Statistical analyses of grain width, length, and 1,000-grain weight in ZH11, osopl1-1, and osopl1-2. G, Cross-sections through the middle of the spikelet hulls (left) and cell numbers in the outer parenchyma layer of the spikelet hulls (right) of ZH11, osopl1-1, and osopl1-2. H, Grain morphology of ZH11 and two rice OsOPL1 overexpression lines OE-2, and OE-6. I, Statistical analysis of grain width and length in ZH11, OE-2, and OE-6. Scale bars in (A, D, G, and H) correspond to 2 cm, 2 cm, 0.5 mm, and 2 cm, respectively. Values in (E, F, G, and I) represent means ± sd: n = 51/44/64 in (E); n = 5/9/13 in (F); n = 10/6/7 in (G); and n = 55/76/59 in (I). P-values were calculated using Student’s t test compared to ZH11 in (E, F, G, and I). ****P < 0.0001, ***P < 0.001, *P < 0.05.
To study its biological function, we used clustered regularly interspaced short palindromic repeats (CRISPR)/CRISPR-associated protein 9 (Cas9)-based genome editing to generate two independent OsOPL1 loss-of-function rice mutant lines, osopl1-1 and osopl1-2, in the ZH11 background (Figure 5C). These two lines were generated using different single-guide RNA (sgRNA) sequences to target OsOPL1. Both mutant lines have one base pair (bp) insertions within the coding region of OsOPL1 that cause translational frameshift mutations. Compared to ZH11, both grain width and 1,000-grain weight were significantly decreased in osopl1-1 and osopl1-2 plants, while grain lengths were not significantly different (Figure 5, D–F). They also had slightly but significantly fewer cell numbers in the outer parenchymal layer of the spikelet hulls compared to ZH11 (Figure 5G). Additionally, the mutant lines also displayed other phenotypes, such as reduced plant height, smaller panicle size, and a decreased number of vascular bundles in the stems (Supplemental Figure S6, A–G). The cell lengths in the mutant stems were shorter than those of ZH11, which might explain the reduced plant height (Supplemental Figure S6, H and I).
To further investigate its function, we also generated rice transgenic lines overexpressing OsOPL1 driven by the constitutive maize ubiquitin promoter in the ZH11 background (Supplemental Figure S7A). Compared to ZH11, the expression levels of OsOPL1 were 37- and 11-fold higher in plants of the two overexpression lines OE-2 and OE-6, respectively (Supplemental Figure S7B). The grain width and grain length of OE-2 and OE-6 plants were significantly increased compared to ZH11 (Figure 5, H and I). Electron microscopic observation showed that, within the center of the grain hull, the overexpression line OE-2 had increased cell numbers in the grain-width direction, while osopl1-1 mutant grains had decreased cell numbers (Supplemental Figure S7, C and D). The cell sizes in the OE-2 grains were similar to ZH11, but the cells were slightly smaller in the osopl1-1 mutant (Supplemental Figure S7, E and F). The larger grain size of the overexpression lines might be due to increased cell numbers, while the smaller grain size of the mutants could be attributed to both smaller cell size and reduced cell number. These results indicated that OsOPL1 is a positive regulator of grain size.
Additionally, the phenotypes of the mutant and overexpression line plants also provided clues to the possible molecular mechanisms of OsOPL1. Compared to ZH11, the overexpression lines have increased lamina joint angles for both the flag leaf and the second leaf from the top, while the osopl1-1 and osopl1-2 mutant lines show the opposite trend (Supplemental Figure S7, G–I). These phenotypes are similar to those observed in mutant or overexpression lines of BR-related genes such as BU1, BU1-LIKE3 (BUL3)/OsBHLH174, and D61 (Yamamuro et al., 2000; Tanaka et al., 2009; Dong et al., 2018), indicating that OsOPL1 might participate in the BR pathway. We next examined the expression of BR-related genes in leaves of the mutant and overexpression line plants. While the expression levels of these genes did not change much in the mutant plants, the overexpression plants had lower expression levels of the representative BR biosynthesis genes DWF4, CONSTITUTIVE PHOTOMORPHOGENESIS and DWARFISM 1 (CPD1), and CPD2, and higher expression levels of the BR-responsive genes BRASSINOLIDE ENHANCED GENE 2 and BUL3 (Supplemental Figure S7J). These results indicate that BR signaling is elevated in the leaves of the overexpression plants, which leads to negative feedback inhibition on the expression of BR biosynthesis genes.
Interestingly, Arabidopsis plants overexpressing OPS also display constitutive BR responses (Anne et al., 2015). In Arabidopsis, OPS physically interacts with BRASSINOSTEROID-INSENSITIVE 2 (BIN2), a key negative regulator of BR signaling (Li and Nam, 2002; Anne et al., 2015). The OPS protein mainly localizes to the plasma membrane; in Arabidopsis OPS overexpression plants, OPS binds and sequesters BIN2 from the nucleus to the plasma membrane, which relieves the BIN2-mediated repression of downstream BR signaling (Anne et al., 2015). One of the orthologs of BIN2 in rice is GSK2 (GSK3/SHAGGY-LIKE KINASE 2), which is also a grain size regulator (Tong et al., 2012; Che et al., 2015; Duan et al., 2017; Liu et al., 2017b). We tested whether OsOPL1 can interact with GSK2. Indeed, OsOPL1 interacted with GSK2 in a yeast two-hybrid assay, and this was confirmed by a bimolecular fluorescence complementation analysis (BiFC) (Supplemental Figure S7, K and L). Additionally, when transiently expressed individually in the leaves of Nicotiana benthamiana, GSK2 mainly localizes to the nucleus and OsOPL1 to the plasma membrane. However, when co-expressed with OsOPL1, most of the GSK2 protein re-localized to the plasma membrane, where its fluorescent signal overlapped with that of OsOPL1 (Supplemental Figure S7M). Thus, similar to its Arabidopsis homolog OPS, rice OsOPL1 can also interact with and re-localize GSK2 from the nucleus to the plasma membrane. The results provide evidence for a conserved pathway between Arabidopsis and rice, in which OPS/OsOPL1 elevate BR signaling by interacting with BIN2/GSK2 and sequestering them to the plasma membrane. Such a pathway would explain the BR-related phenotypes observed in rice OsOPL1 overexpression line plants, which included larger grains and increased lamina joint angles.
Based on the above results, we conclude that OsOPL1 is a bona fide regulator of rice grain size. This example demonstrates that the trait-associated gene modules can facilitate the identification of additional trait genes through reverse genetics.
Discussion
In this study, we developed a two-step pipeline to test and identify gene modules associated with agronomic traits in rice. We first used a large amount of RNA-seq transcriptomes, irrespective of their tissue origins and treatment conditions, to construct a GGM gene co-expression network. Unlike another rice network, RiceAntherNet, that is anther-specific (Lin et al., 2017), our network is tissue- and condition independent, and we were thus able to identify gene modules that cover a broad range of biological pathways (Supplemental Table S3). We then tested and identified among these gene modules those that were enriched with rice trait genes using TO enrichment analysis. On the one hand, our analyses focused on development- and metabolism-related traits such as yield, grain quality, leaf angles, stem strength, and anthocyanin content. On the other hand, there are also TO annotations for rice genes associated with tolerance to abiotic stresses such as salinity, drought, and cold, and also resistance to biotic stresses (Kurata and Yamazaki, 2006). However, we found that many of the genes with stress-related TO annotations do not have support from the corresponding mutant or overexpression lines, and they might just be genes that are upregulated or downregulated by these stresses. Due to their weak functional support, we did not include them in our detailed analyses, but the results can be found in Supplemental Table S4. Future analyses should collect stress-related TO genes with strong functional support to determine whether they also form modules. In addition to the modules that show enrichment for trait genes, we also identified modules that were enriched for specific biological pathways but under-represented for trait-associated genes; examples are M37 for “suberin biosynthesis” and M55 for “response to nitrate.” Future studies should investigate whether these modules contain genes associated with rice traits that might be difficult to detect.
Our analysis organized isolated and fragmented rice trait genes into coherent gene modules. These trait-associated gene modules further helped to dissect the genetic basis of rice agronomic traits. For example, three different modules associated with grain size were found: M35 with genes showing preferred expression in the early SAM; M70 with expression during panicle and early seed development; and M49 containing genes involved in the auxin and BR pathways. Interestingly, while M45 is a broadly expressed module functioning in auxin and BR pathways, some of the trait genes within the SAM module M35 also play roles in the BR pathway, such as GW5, OsGRF4, and XIAO (Jiang et al., 2012; Che et al., 2015; Liu et al., 2017b). These trait genes within M35 could encode tissue-specific BR regulators that function to adjust BR signaling locally. Our analyses also showed that some modules regulate multiple rice traits, such as M49 for both grain size and leaf/tiller angles and M50 for three grain-quality traits: ECQ, grain protein content, and chalkiness. Interestingly, our analysis also brought together traits that might not seem to be connected at first glance; an example is M109 for both tiller number and seed number, which also agrees with a previous report on the coordinated regulation of vegetative and reproductive branching in rice (Wang et al., 2015).
The trait-associated gene modules also facilitate the identification of additional trait-related genes. Our analysis indicated that known trait genes are enriched within these modules, and via the “guilt-by-association principle” we hypothesized that the uncharacterized genes within the modules might also be enriched with potential candidates. As an example, we identified OsOPL1 as a candidate regulator gene for grain size from the grain size module M35. Functional studies verified that OsOPL1 is a bona fide regulator of grain size (Figure 5). This example demonstrated the usability of our approach. We believe such an approach can be applied to other agronomic traits as well.
Further investigation indicated that OsOPL1 might participate in the BR signaling pathway. Rice OsOPL1 overexpression lines displayed typical phenotypes of elevated BR signaling, including enlarged grain size, increased lamina joint angle, and negative feedback inhibition of BR biosynthesis gene expression (Figure 5, H and I; Supplemental Figure S7, A–J). Similar to its Arabidopsis homolog, OsOPL1 interacts with GSK2 and re-localizes GSK2 from the nucleus to the plasma membrane (Supplemental Figure S7, K–M). Previous studies have shown that GSK2 plays important roles in regulating rice grain size (Tong et al., 2012; Che et al., 2015; Duan et al., 2017; Liu et al., 2017b). In OsOPL1 overexpression lines, OsOPL1 might regulate grain size by enhancing BR signaling through the sequestering of GSK2 to the plasma membrane. Conversely, we speculate that the smaller grain size observed in the opsl1-1 and ops1-2 mutants can be attributed to repressed BR signaling as well. Indeed, the mutants have typical phenotypes of deficiencies in BR signaling, including smaller grain size, decreased lamina joint angles, and reduced plant height, as well as fewer cell numbers along the grain-width direction in the spikelet hull (Figure 5, D and E; Supplemental Figure S6).
In conclusion, our rice network analysis has identified a broad range of trait-associated gene modules. Rice trait genes associated with important agronomic traits, such as grain size, grain number, tiller number, grain quality, leaf angle, stem strength, and anthocyanin content, are significantly enriched in these modules. These modules allow us to dissect the genetic basis of rice agronomic traits and facilitate the identification of additional trait genes. They provide a valuable resource for future studies on rice trait genes.
Materials and methods
Rice gene expression data and gene co-expression network analysis
We downloaded the raw data of all publicly available rice (O. sativa) RNA-seq runs from the NCBI SRA database as of June 2021 and processed them with a uniform pipeline similar to that described previously (Geng et al., 2021). Briefly, we first removed small RNA sequencing runs and all runs with less than 1,000,000 reads. The remaining runs were trimmed with Trimmomatic (version 0.36) and mapped against the rice genome (msu7) using STAR 34 (version 020201) to generate read counts for all annotated genes (Dobin et al., 2013; Bolger et al., 2014; Kawahara et al., 2013). The CPM expression values for each gene in all runs were calculated, and runs with the following criteria were removed: unique mapping rates <50%, total mapping rates <70%, or with <5,000 genes with a CPM ≥ 1. Genes with low expression levels (CPM ≥ 1 in fewer than 100 samples) were also removed. The expression values of the remaining 33,846 genes in 8,456 RNA-seq runs were merged into an expression matrix after log-transformation via log2(CPM + 1) and used for downstream network analysis.
Using the expression matrix, a rice gene co-expression network was constructed based on the GGM using a previously described method (Ma et al., 2007). Briefly, a procedure consisting of 20,000 iterations was used to calculate the pcors between all gene pairs. In each iteration, 2,000 genes were randomly selected and the pcors between them were calculated using the GeneNet package in R (Schafer and Strimmer, 2005). After 20,000 iterations, each gene pair was sampled on average 69.8 times with 69.8 pcors calculated, and the pcor with the lowest absolute value was chosen as the final pcor for that gene pair. The gene pairs with pcor ≥ 0.035 were chosen to construct a rice GGM gene co-expression network.
The rice GGM gene co-expression network was then clustered using the MCL algorithm (Enright et al., 2002), resulting in 1,286 gene modules containing five or more genes. These modules were expanded by adding to them the outside genes that are connected to at least five genes within the original modules. The modules were visualized in Cytoscape version 3.8 (Shannon et al., 2003). A rice TF gene list obtained from the Plant Transcription Factor Database was used to identify TF genes within the gene modules (Jin et al., 2017). We also obtained rice gene symbols, gene names, gene synonyms, and GO annotations from the Oryzabase database (accessed October 13, 2021) (Kurata and Yamazaki, 2006) and performed GO enrichment analysis for the modules using the hypergeometric distribution.
TO enrichment analysis
Overlaps between trait-associated gene modules and known QTL regions
A list of known QTL regions for rice agronomic traits was obtained from the Q-TARO database (http://qtaro.abr.affrc.go.jp/) as of June 2022 (Yonemaru et al., 2010). The genomic coordinates of the QTLs were compared to those of the genes from the trait-associated modules using the GenomicRanges package in Bioconductor (Lawrence et al., 2013). The comparison identified genes that have overlapped with the QTLs of the corresponding traits without known causal genes.
Phylogenetic and protein sequence alignment analyses
A phylogenetic tree was constructed for OsOPL1 and its homologs from rice and Arabidopsis (A. thaliana) using the neighbor-joining method in the MEGA6 software with 1,000 bootstrap replicates (Tamura et al., 2013). A multiple sequence alignment was also conducted for these sequences using the ClustalW program, and the results were visualized using ESPript version 3.0 (Thompson et al., 1994; Robert and Gouet, 2014).
Plant materials and growth conditions
The japonica rice cultivar “Zhonghua 11” (ZH11) was used as the wild-type in this study, and all transgenic plants were generated in that genetic background. For agronomic trait examination, ZH11, osopl1-1, osopl1-2, and OsOPL1-OE rice plants were grown in an experimental field from May to October in Hefei (Anhui province, China). For gene expression analysis, the plants were grown in a greenhouse with the temperature maintained at 30°C during the day and 28°C at night with a 16-h light/8-h dark photoperiod. The two independent mutant lines of OsOPL1, osopl1-1, and osopl1-2, were generated using CRISPR/Cas9 technology. The target sites and the corresponding sgRNAs used in generating the osopl1-1 and osopl1-2 mutants were different. Rice plants from calli were defined as the T0 generation. For CRISPR/Cas9 knock-out plants, multiple independent T1-generation lines with homozygous mutations were selected for self-pollination, and stable T2 lines were randomly chosen for trait measurements. All T1 and T2 homozygous mutants displayed similar phenotypes. For the OsOPL1 overexpression plants, two independent T1 lines with different OsOPL1 expression levels were chosen for phenotypic observations.
Phenotypic and microscopic observations
Plant height, panicle length, grain length, grain width, and 1,000-grain weight were measured at maturity. For the grain length and width measurements, rice grains collected from the main panicles were scanned using an Epson Perfection V370 Photo Scanner and analyzed with SmartGrain software (Tanabata et al., 2012). Other traits were investigated using conventional methods during development or at maturity.
Paraffin sectioning of fresh spikelets and stems was performed out as described previously (Cheng et al., 2018). Fresh spikelets and stems were sampled and fixed at 4°C overnight in formal–acetic–alcohol solution with the v/v ratio 5:10:50:35 of glacial acetic acid, formaldehyde, ethanol and distilled water, respectively. Dehydration and paraffin infiltration were performed using a tissue processor (Leica ASP2000), and the samples were then cut into sections ∼20-µm thick. After removing the paraffin in a xylene series and dehydrating in an ethanol series, the samples were stained using 1% (w/v) safranine/Fast Green. Cell size and cell number were examined using a TissueFAXS PLUS microscope.
For cell size measurements, dry mature grains were observed using a GeminiSEM 500 scanning electron microscope after gold spraying treatment. The width and length of the outer epidermal cells in the central part of the lemma were measured using ImagJ (Schneider et al., 2012), and the cell number was counted in the widest part of the grain along the grain-width axis.
Plasmid construction and plant transformation
All plasmid constructs were generated via recombination or Golden Gate assembly. Recombination was performed using the ClonExpress II One Step Cloning Kit (Vazyme, Nanjing, China). To generate the CRISPR/Cas9 knock mutants, a sgRNA1 targeting the open reading frame of OsOPL1 were designed using CRISPR-P (Liu et al., 2017a). The sgRNA was cloned into the CRISPR plasmid BGK032 to generate the osopl1-1 mutant line (Lu et al., 2017). After observing the phenotypes of the osopl1-1 mutant, in order to confirm the phenotypes again, two sgRNAs (sgRNA2 and sgRNA3) targeting an additional two different sites within the OsOPL1 open reading frame were designed and cloned into a single TKC plasmid simultaneously to generate the osopl1-2 mutant line (He et al., 2018). Among these two sgRNAs, only sgRNA2 successfully induced mutations after transformation into ZH11. To generate OsOPL1 overexpression transgenic plants, the full-length CDS of OsOPL1 was amplified and recombined into the linearized BGV07 vector digested with KpnI and BamHI, which placed the OsOPL1 CDS fragment downstream of the maize ubiquitin promoter. To generate OsOPL1pro::GUS transgenic plants, the 3,046-bp promoter region upstream of OsOPL1 was amplified and recombined into the linearized pCambia1391Z vector digested with PstI and EcorI. These vectors were used to transform ZH11 plants at the Biogle Gene Editing Center (Changzhou, China). The homozygous mutants of OsOPL1 were identified by PCR-based genotyping and confirmed by Sanger sequencing. The primers used for vector construction and genotyping are given in Supplemental Table S6.
GUS staining assay
Seedlings and different tissues of T2-generation OsOPL1pro::GUS transgenic plants were harvested and stained using GUS staining buffer overnight at 37°C, decolorized in an ethanol series of 30%, 50%, 70%, 95% (v/v) for 30 min at each step, and then transferred to 100% ethanol. The GUS staining buffer contained 50-mM NaHPO4 buffer (pH 7.2), 2-mM potassium ferrocyanide, 2-mM potassium ferricyanide, 0.2% (v/v) Triton X-100, and 2-mM X-Gluc.
RNA isolation, reverse transcription, and RT–qPCR assays
Total RNA was extracted from various rice tissues using TRIzol reagent (Invitrogen, Waltham, MA, USA), and the first-strand cDNAs were synthesized using the Hiscript III RT Supermix kit (Vazyme, Nanjing, China). ChamQ Universal SYBR qPCR Master Mix (Vazyme) was used to perform RT–qPCR assays in the StepOnePlus Real-Time PCR instrument (Applied Biosystems, Foster City, CA, USA). The names and sequences of the primers used are given in Supplemental Table S6.
Yeast two-hybrid assays
The CDS of OsOPL1 was cloned into the pGBKT7 vector, and the CDS of GSK2 was cloned into the pGADT7 vector. The vectors were then co-transformed into the yeast strain AH109. Co-transformed yeast clones were serially diluted (1:10) and spotted onto selective medium lacking Trp, Leu, His, and adenine for growth. The primers used to generate the constructs are given in Supplemental Table S6.
Transient expression in N. benthamiana
For BiFC analysis, regions of the rice OsOPL1 and GSK2 ORFs were cloned into pUC-SPYCE (aa 156–239) or pUC-SPYNE (aa 1–155), respectively. For subcellular localization analysis, we constructed OsOPL1-GFP and GSK2-RFP vectors by cloning the full-length CDS of OsOPL1 and GSK2 into the PFK-242 and pCambia2300-RFP vectors, respectively. Agrobacterium tumefaciens strain GV3101 carrying the indicated vectors were infiltrated into the leaves of 4-week-old N. benthamiana seedlings. Two days after agroinfiltration, fluorescence was detected using a confocal laser scanning microscope (Zeiss, LSM710). For eYFP imaging in BiFC analysis, samples were excited at 514 nm (laser power 20%), and 533–592-nm band-pass emission was detected using a PMT detector (master gain740, digital gain 1.0). For GFP and RFP imaging in subcellular localization analysis, samples were excited at 488 nm (laser power 40%) and 543 nm (laser power 50%), respectively, and 495–579 nm and 527–650-nm band-pass emissions were detected using a PMT detector (master gain 734 for GFP; master gain 802 for RFP; digital gain 1.0).
Supplemental data
The following materials are available in the online version of this article.
Supplemental Figure S1. Distribution of all pcors between all 33,846 genes.
Supplemental Figure S2. Tissue-specific expression patterns for the genes in modules M35, M70, M49, M109, and M38.
Supplemental Figure S3. Tissue-specific expression patterns for the genes in modules M50, M128, and M21.
Supplemental Figure S4. Module M128 for starch biosynthesis.
Supplemental Figure S5. OsOPL1 is homologous to Arabidopsis OPS.
Supplemental Figure S6. Additional phenotypes of OsOPL1 mutants.
Supplemental Figure S7. Characterization of OsOPL1 overexpression lines.
Supplemental Table S1. The 612,752 gene pairs used for RiceGGM2021 construction.
Supplemental Table S2. The 1,286 gene modules identified from the co-expression network.
Supplemental Table S3. GO enrichment analysis results for the 1,286 gene modules.
Supplemental Table S4. TO enrichment analysis results for the 1,286 gene modules.
Supplemental Table S5. Overlaps between the genes from selected trait-associated gene modules and QTL regions for the corresponding traits.
Supplemental Table S6. The primers used in this study.
S.M. designed and supervised the project. Y.Z., E.H., Y.P., Yu.W., Yi.W., Z.G., Y.X., H.G., and S.M. performed the experiments and analysis. Y.Q. provided rice transformation service. Y.Z. and S.M. wrote the manuscript. All authors reviewed and approved the final manuscript.
The author responsible for distribution of materials integral to the findings presented in this article in accordance with the policy described in the Instructions for Authors (https://dbpia.nl.go.kr/plphys/pages/general-instructions) is Shisong Ma ([email protected]).
Acknowledgments
We thank USTC Supercomputing Center and USTC School of Life Sciences Bioinformatics Center for providing the computing resources.
Funding
This work was supported by grants from the Strategic Priority Research Program of the Chinese Academy of Science (XDA24010303), the National Natural Science Foundation of China (31770268), the Fundamental Research Funds for the Central Universities (WK2070000091), and University of Science and Technology of China (Start-up fund to S.M.).
Data availability
All data of this study are available in the main text and supplementary information. The rice gene expression matrix used for network construct is available through Figshare (https://doi.org/10.6084/m9.figshare.20072177).
Conflict of interest statement. None declared.
