


Abstract
C4 photosynthesis optimizes plant carbon and water relations, allowing high photosynthetic rates with low stomatal conductance. Stomata have long been considered a part of the C4 syndrome. However, it remains unclear how stomatal traits evolved along the path from C3 to C4. Here, we examined stomata in the Flaveria genus, a model used for C4 evolutionary study. Comparative, transgenic, and semi-in vitro experiments were performed to study the molecular basis that underlies the changes of stomatal traits in C4 evolution. The evolution from C3 to C4 species is accompanied by a gradual rather than an abrupt change in stomatal traits. The initial change appears near the Type I intermediate stage. Co-evolution of the photosynthetic pathway and stomatal traits is supported. On the road to C4, stomata tend to be fewer in number but larger in size and stomatal density dominates changes in anatomical maximum stomatal conductance (gsmax). Reduction of FSTOMAGEN expression underlies decreased gsmax in Flaveria and likely occurs in other C4 lineages. Decreased gsmax contributes to the increase in intrinsic water-use efficiency in C4 evolution. This work highlights the stomatal traits in the current C4 evolutionary model. Our study provides insights into the pattern, mechanism, and role of stomatal evolution along the road toward C4.
Introduction
Stomata are small pores surrounded by a pair of guard cells on the plant surface, which control the passage of H2O and CO2 between leaf and atmosphere (Alistair and Hetherington, 2003). The emergence of C4 photosynthesis allows low stomatal conductance (gs) (i.e. reduced water loss) without compromising carbon assimilation (Taylor et al., 2010; Vogan and Sage, 2011; Osborne and Sack, 2012), which raises the possibility that C4 photosynthesis might have been selected as a water-conserving mechanism (Osborne and Sack, 2012) and that water limitation might be a primary driver of C4 evolution (Williams et al., 2013; Reeves et al., 2018; Zhou et al., 2018). A comparison study on multiple independent lineages of C4 grasses showed that the gs is substantially lower in C4 species relative to C3 relatives (Taylor et al., 2010, 2011), and that the higher intrinsic water-use efficiency (iWUE) of C4 plants compared with that of C3 plants can be attributed to both lower gs and higher photosynthetic CO2 uptake rate (A) (Taylor et al., 2010; Uzilday et al., 2014; Kocacinar, 2015; Aubry et al., 2016). The high carbon assimilation capacity of C4 plants contributes to their high biomass, while low gs is crucial for C4 plants to better adapt to saline land, and hot, arid and open habitat (Powell, 1978; Sage, 2004).
In a long-term adaptation, C3 plants generally adjust their anatomical maximal stomatal conductance (gsmax) (Beerling and Franks, 2009; Franks et al., 2009; Doheny-Adams et al., 2012). A phylogenetically controlled comparison showed that C4 grasses have lower gsmax compared with their closely related C3 grasses (Taylor et al., 2012). In line with this, C4 grasses also have lower operating gs (Taylor et al., 2010, 2012). gsmax is determined by stomatal density (SD) and stomatal size (SS). Although higher SD in C4 species compared with C3 species has been observed (Ocheltree et al., 2012), in some cases, C4 plants can have a lower SD compared with C3 plants (Santakumari, 1977). These differential changes in stomatal traits between photosynthetic types might be related to phylogenetic effects (Edwards et al., 2007; Edwards and Still, 2008; Taylor et al., 2010). As a reflection of this, a comparative study using plants from different C4 clades showed that lower gsmax in C4 plants is due to either a smaller SS for some C4 clades, or lower SD for other clades (Taylor et al., 2012), but after the phylogenetic effects are accounted for, SD in C4 species is lower than C3 species and there is no significant difference in SS between C3 and C4 grasses (Taylor et al., 2012). However, an earlier study suggested that the influence of photosynthetic pathway on SD and SS is only statistically marginally significant (Taylor et al., 2012), which might be because stomatal development is affected by many factors, especially environmental conditions such as soil moisture and fertility status (Sekiya and Yano, 2008; Xu and Zhou, 2008; Hamanishi et al., 2012; Cai et al., 2017). In addition, though the stomatal traits and gsmax might be regarded as an important feature in C4 evolution (Laetsch, 1974; Taylor et al., 2012), the changes in them during the transition from C3 to C4 have been much less studied (Way, 2012; Li et al., 2021). More study on stomatal traits is still needed for C4 evolution.
Stomatal development is controlled by a well-studied genetic program (Zoulias et al., 2018), which involves a series of ligands and transmembrane receptors. The ligands and receptors lead to downstream changes in mitogen-activated protein kinase (MAPK) and transcription factors (Zoulias et al., 2018). TOO MANY MOUTHS (TMM) and ERECTA (ER)-family (ERfs: ER, ERL1, and ERL2) are the transmembrane receptor-like kinases that negatively regulate stomatal development (Shpak et al., 2005; Lin et al., 2017), and TMM interacts with ERfs (Lee et al., 2012; Lin et al., 2017). The ligands that bind to ERfs and TMM receptors are mainly EPIDERMAL PATTERNING FACTOR/EPIDERMAL PATTERNING FACTOR-LIKE (EPF/EPFL) family peptides (Shimada et al., 2011). Overexpression of EPF1 decreases SD (Hara et al., 2007). EPF2 has a similar genetic effect as EPF1 (Hunt and Gray, 2009). STOMAGEN (EPFL9) peptide competes with EPF1 and EPF2 peptide for the binding of ERfs, and ultimately positively regulates stomatal development (Pillitteri and Torii, 2007; Hunt et al., 2010; Kondo et al., 2010; Sugano et al., 2010; Lee et al., 2015).
C4 plants evolved from C3 ancestors through a number of intermediate stages, which were shown in a number of genera (Heckmann et al., 2013; Williams et al., 2013; Mallmann et al., 2014; Schluter and Weber, 2016). Among these genera, we chose Flaveria genus as the model for this study. The Flaveria genus contains close species with multiple different photosynthetic types which cover the sequential stages of C4 evolution, that is, C3, C3–C4 type I, C3–C4 type II, C4-like, and C4 (McKown and Dengler, 2007; Vogan and Sage, 2011; Schulze et al., 2013; Mallmann et al., 2014; Lyu et al., 2015; Stata et al., 2016). This genus is the youngest genus in which C4 photosynthesis evolved (Christin et al., 2011) and have many intermediate species (Gowik et al., 2011). A close relationship between Flaveria species can minimize the impact of nonphotosynthetic type effects on stomatal traits (Gowik et al., 2011; Aubry et al., 2016). The species in Flaveria genus grow on similar growth habitats and also have similar morphologies (Powell, 1978; McKown et al., 2005; Sudderth et al., 2007, 2009; Kocacinar et al., 2008). These make Flaveria genus an ideal system to study the evolutionary process from C3 to C4 (Schluter and Weber, 2016). The physiology, structure, biochemistry, and molecular changes of the Flaveria genus along C4 evolution have been systematically evaluated (McKown and Dengler, 2007; Kocacinar et al., 2008; Gowik et al., 2011; Nakamura et al., 2013; Schulze et al., 2013; Mallmann et al., 2014; Lyu et al., 2015; Stata et al., 2016). In fact, the current C4 evolutionary model illustrating the path from C3 to C4 photosynthesis is largely based on the studies on Flaveria species (Schluter and Weber, 2016; Sage, 2017). The current model of C4 evolution includes multiple steps (McKown et al., 2005; Kocacinar et al., 2008; Gowik et al., 2011; Nakamura et al., 2013; Mallmann et al., 2014; Stata et al., 2016; Taniguchi et al., 2021). First, bundle sheath cells and vein density showed C4 characteristics (McKown and Dengler, 2007; Sage et al., 2014; Schluter and Weber, 2016). Then, glycine decarboxylase transfers from mesophyll cells to bundle sheath cells (Christopher et al., 1988), resulting in a modest CO2 concentrating mechanism (Sage et al., 2014), which bridges the formation of C4 metabolism (Mallmann et al., 2014; Schluter and Weber, 2016). Although stomata have long been thought as a part of C4 syndrome (Laetsch, 1974; Taylor et al., 2012), the evolutionary changes and roles of stomatal traits in current C4 evolutionary model remain unclear.
This study aims to answer the following questions: (1) In the context of the current C4 evolution model, will stomatal traits and gsmax change with the evolution of photosynthetic type? How and when do stomatal traits change along the path to C4? (2) What’s the molecular mechanism underlying the change in the stomatal traits during C4 evolution? (3) What are the roles and drivers of stomatal evolvement in the evolutionary process toward C4 photosynthesis?
Results
Anatomical maximum stomatal conductance and stomatal pattern during the evolution of C4 photosynthesis in Flaveria
As a model of C4 evolution, there are distinct evolutionary phases in Flaveria genus (Figure 1A). The C3Flaveria species tends to have a higher gs relative to C4 (Supplemental Figure S1a). The pore length of stomata was approximately equal to 0.41× stomatal length and the guard cell width was approximately equal to 0.33× stomatal length (Supplemental Figure S2). Whether growing under outdoor natural light or constant light in the phytotron, Flaveria showed gradually decreased gsmax from C3 to intermediate species to C4 species (Figure 1, B and C; Table 1; and Supplemental Figure S3, a and b). A significant correlation was found between gsmax and gs for the Flaveria species with different photosynthetic types (Figure 1D and Supplemental Figures S1b and S4e). Under a photosynthetic photon flux density (PPFD) of either 2,000 or 500 μmol m−2 s−1, the iWUE (A/gs) of rob (C3) was lower than that of bid (C4) (Figure 1F and Supplemental Figure S1c) and the gs of rob was higher than that of bid (Figure 1E and Supplemental Figure S1c).
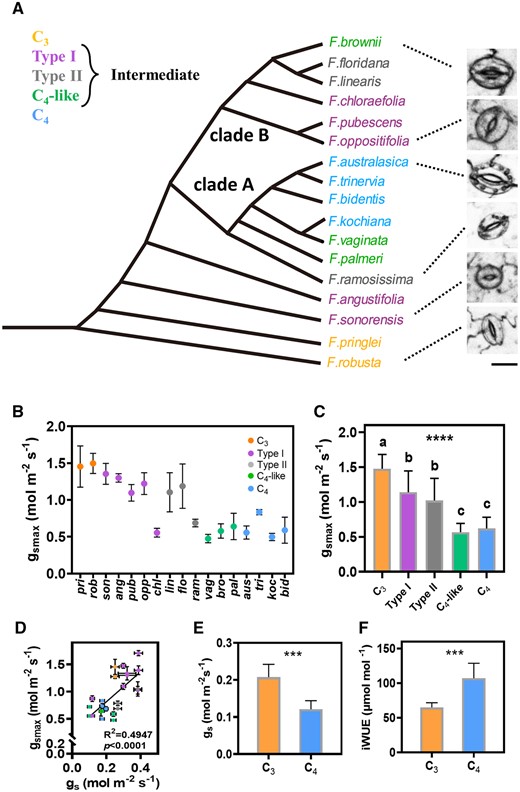
gsmax of Flaveria species. A, Phylogeny of the Flaveria genus according to McKown et al. (2005) and Lyu et al. (2015). Different colors represent different photosynthetic types, orange: C3, purple: Type I, gray: Type II, green: C4-like, blue: C4. Scale bar = 10 μm. B, The trend of gsmax on the abaxial surface in Flaveria species with different photosynthetic types from C3 to C4 grown in phytotron (C) (n = 4). The abbreviation of the species name is the first three letters of the species name. C, gsmax of the abaxial surface between species with different photosynthetic types in the Flaveria genus grown in phytotron. C3 (n = 8), Type I (n = 20), Type II (n = 12), C4-like (n = 12), and C4 (n = 16). D, Correlation of gsmax and gs for Flaveria species with different photosynthetic types. The data of gs were from Vogan and Sage (2011) (n ≥ 12). The species used are pri, pub, opp, flo, son, chl, ang, ram, flo, vag, bro, pal, tri, bid, and koc. The colors for photosynthetic types refer to (B). E, The difference in gs measured under 500 μmol m−2s−1 PPFD between C3 (rob) and C4 (bid) (n = 6). F, The difference in iWUE (A/gs) measured under 500 μmol m−2s−1 PPFD between C3 (rob) and C4 (bid) (n = 6). Specific experimental details are in the “Materials and method.” Error bar for gs (D) indicates se. Error bar in other graphs indicates sd. The asterisks represent statistically significant differences between different photosynthetic types (one-way ANOVA: *P < 0.05, **P < 0.01, ***P < 0.001, and ****P < 0.0001); different letters represent statistically significant differences between two groups (Tukey’s multiple test, α = 0.05). Pearson correlation coefficient and the significance were noted in each panel.
Summary of the statistical comparison of anatomic gsmax, SD, and stomatal length (l) between plants with different photosynthetic types either grown in phytotron or outdoors
| gsmax | SD | l | gsmax | SD | l | |
|---|---|---|---|---|---|---|
| Phytotron | Outdoors | |||||
| C3 versus Type I | 0.01 | <0.0001 | 0.01 | 0.6457 | 0.3958 | <0.0001 |
| C3 versus Type II | 0.0007 | <0.0001 | <0.0001 | 0.0051 | <0.0001 | <0.0001 |
| C3 versus C4-like | <0.0001 | <0.0001 | <0.0001 | <0.0001 | <0.0001 | <0.0001 |
| C3 versus C4 | <0.0001 | <0.0001 | <0.0001 | <0.0001 | <0.0001 | <0.0001 |
| Type I versus Type II | 0.62 | 0.23 | 0.002 | <0.0001 | 0.0004 | 0.9989 |
| Type I versus C4-like | <0.0001 | <0.0001 | <0.0001 | <0.0001 | <0.0001 | <0.0001 |
| Type I versus C4 | <0.0001 | <0.0001 | <0.0001 | <0.0001 | <0.0001 | <0.0001 |
| Type II versus C4-like | <0.0001 | 0.001 | <0.0001 | 0.0415 | 0.0478 | <0.0001 |
| Type II versus C4 | 0.0003 | 0.035 | 0.99 | 0.0791 | 0.2465 | 0.0001 |
| C4-like versus C4 | 0.98 | 0.56 | <0.0001 | 0.9487 | 0.7744 | 0.8903 |
The P-values are shown. The statistical test was performed by one-way ANOVA followed by Tukey’s multiple test.
There is a significant difference in SD and SS within Flaveria genus (Figure 2, A and B; Supplemental Figure S3, c and d; and Supplemental Data Set S1). With the progression from C3 to C4 species, there was a gradual and significant change in SD and SS (Figure 2, A and B; Table 1; and Supplemental Figure S3, c and d). The SD of C4 and C4-like species were similar and the difference was not statistically significant, although the SD of C4-like species was slightly lower than that of C4 (Figure 2B and Supplemental Figure S3d). For the adaxial leaf surface, the SD and gsmax of C3 species was higher than that of the C4 species, although the difference in SD and gsmax between some two Flaveria species was less significant (Supplemental Figure S4, a–e and g). There was a strong positive correlation between gsmax and SD either on abaxial leaves (R2 = 0.9063, P < 0.0001) (Figure 2C) or on adaxial leaves (R2 = 0.9165, P < 0.0001; Supplemental Figure S4f) and a significant negative correlation between gsmax and l on abaxial leaves (R2 = 0.2897, P < 0.005) (Figure 2D), indicating that SD play a stronger role than SS in determining the change of gsmax. SD and l showed a significant negative correlation on abaxial leaves (R2 = 0.5234, P < 0.0001) (Figure 2E) or on adaxial leaves (R2 = 0.2055, P < 0.05) (Supplemental Figure S4h). During the transition toward C4, SD tended to become smaller and stomata tended to become longer (Figure 2E and Supplemental Figure S4h).
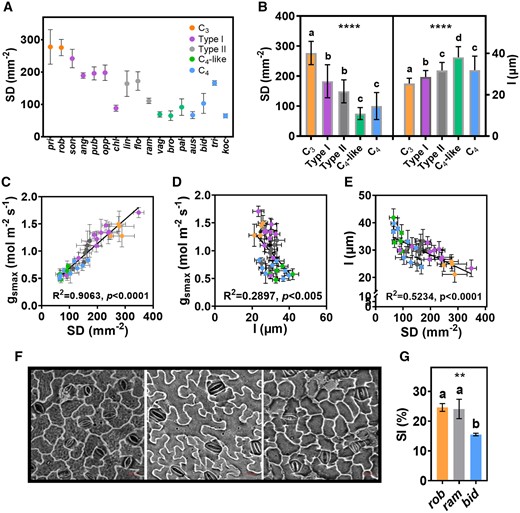
SD and its patterning. A, The trend of SD of abaxial surface from C3 to C4 in Flaveria species grown in phytotron. B, SD and guard cell length (l) of abaxial surface between species with different photosynthetic types in Flaveria genus grown in phytotron. C, Correlation of gsmax and SD for different Flaveria species. Different color indicates different photosynthetic type (see Figure 1 for details). D, Correlation of gsmax and l for different Flaveria species. E, Correlation of l and SD for different Flaveria species. F, The photographs of stomatal patterning on abaxial surface in rob (left), ram (middle) and bid (right). Scale bar = 20 μm. G, Comparison of SI between rob, ram, and bid. SD, (n = 4). l, (n = 20). SI, (n = 3). Error bar indicates sd. The asterisks represent statistically significant differences between different photosynthetic types (one-way ANOVA: *P < 0.05, **P < 0.01, ***P < 0.001, and ****P < 0.0001); different letters represent statistically significant differences between two groups (Tukey’s multiple test, α = 0.05). Pearson correlation coefficient and the significance are noted in each panel.
The stomatal index (SI) of rob was nearly 50% higher than bid in plants grown in either the phytotron or outdoors (Figure 2G and Supplemental Figure S3e). Grown outdoors, the SI of ram (intermediate species) lay between rob and bid (Supplemental Figure S3e). Grown under the phytotron, the SI of ram was similar to that of rob (Figure 2G). In addition to the Flaveria plants grown from cuttings, we also planted Flaveria germinated from seeds, and the SD of C3 species was also higher than C4 species, intermediate species lies between them (Supplemental Figure S5).
Comparison of the sequence and transcription abundance of genes related to stomatal pattern between C3 and C4Flaveria species
Based on the studies of stomatal development, a model for the molecular mechanism of stomatal development was built (Figure 3A). EPF/EPFL-family homologs were conserved at the C-terminal part of amino acid sequence (Supplemental Figure S6, a–c). Members of EPF/EPFL-family genes encode secretory proteins containing signal peptides at the N-terminus and functional domains at the C-terminus (Hara et al., 2007; Hunt and Gray, 2009; Ohki et al., 2011). The hydrophobicity of EPFs/EPFL homologs in Flaveria was similar to EPF/EPFL in Arabidopsis (Arabidopsis thaliana) (Supplemental Figure S6, d–f), implying that the homologs are also the secretory proteins. Analysis results revealed no differences within the functionally conserved region of amino acid sequence for STOMAGEN, EPF1, and EPF2 homologs between C3 and C4 species (Supplemental Figure S6, a–c), implying the change of amino acid sequence is unlikely to be a cause of the changed stomatal development in C4 evolution.
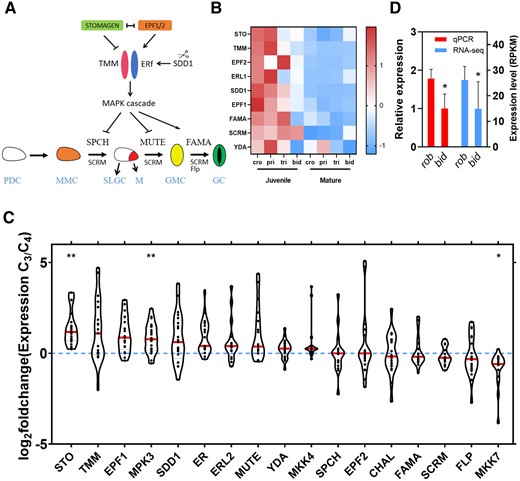
Transcript abundance of stomatal development-related genes between C3 and C4Flaveria species. A, A model of the signaling pathway for the stomatal development in Arabidopsis (Zoulias et al., 2018). In the signaling pathway, the arrow represents activation, other represents inhibition. A protodermal cell (PDC, white) becomes a meristemoid mother cell (MMC, orange), which divides asymmetrically into two daughter cells, with one being a meristemoid (M, red) and the other being a stomatal-lineage ground cell (SLGC). The M cell develops into a guard mother cell (GMC, yellow); the SLGC develops into a pavement cell (PC). The GMC conducts a symmetrical division to produce two equal-sized guard cells (GC, green). EPF1, EPF2, and STOMAGEN competitively bind to receptors ER and TMM, which can deliver a signal to the YDA MAPK cascade. SPCH, MUTE, and FAMA ultimately are inactivated through phosphorylation by the YDA MAPK cascade. A subtilisin-like protease SDD1 negatively regulates stomatal development. SCRM interacts with SPCH, MUTE, and FAMA to regulate stomatal development. Flp negatively regulates GMC cell division and delay the transition from GMC to GC. B, Comparison of the expression of stomatal developmental related genes between juvenile and mature leaves. Data are from 1KP (One Thousand Plant Transcriptomes, 2019). Each gene was standardized by z score. Cro, pri, tri, and bid, respectively, indicates Flaveria cronquistii (C3), Flaveria pringlei (C3), Flaveria trinervia (C4), and Flaveria bidentis (C4). C, The foldchanges of stomatal development-related genes between the C3 and C4Flaveria species. Foldchange means the ratio between the gene expression in a C3Flaveria species and gene expression in a C4Flaveria species under the same leaf development stage and growth condition as the C3Flaveria species. The expression data were from Billakurthi et al. (2018), Mallmann et al. (2014), Gowik et al. (2011), and 1KP (One Thousand Plant Transcriptomes, 2019). The asterisks represent statistically significant differences between C3 and C4Flaveria species (*P < 0.05, **P < 0.01, Mann–Whitney U test, two-tailed distribution, unpaired). The red lines indicate median. D, Relative expression level determined by RT-qPCR and expression level determined by RNA-seq of FSTO (FSTOMAGEN) in rob and bid. (n = 4, biologically independent replicates.) RPKM indicates reads per kilobase per million mapped reads. Error bar indicates sd. The asterisks represent statistically significant differences (P < 0.05, t test, two-tailed distribution, unpaired).
As upregulation of transcription has been a major approach to increase the expression of many genes participating in the building of C4 syndrome during C3 to C4 evolution in Flaveria (Supplemental Figure S7; Gowik et al., 2011; Mallmann et al., 2014), we compared the transcript abundance of stomatal development-related genes between C3 and C4Flaveria species. We found that the homologs of most stomatal development-related genes showed higher transcript abundance in developing tissues when compared with developed tissues (Figure 3B), which is consistent with their function of regulating stomatal differentiation in developing leaf (Hara et al., 2007; Hunt et al., 2010; Sugano et al., 2010; Hronkova et al., 2015). We re-analyzed publicly available transcriptome datasets from four studies (Gowik et al., 2011; Mallmann et al., 2014; Billakurthi et al., 2018; One Thousand Plant Transcriptomes, 2019), and STOMAGEN, EPF1, STOMATA DENSITY AND DISTRIBUTION (SDD1), MPK3, TMM, and ER, showed lower expression levels in C4 species than in C3 species (Figure 3C). Among these genes, STOMAGEN not only showed the significant difference but also was the one that changed the most (Figure 3C). EPF1, SDD1, MPK3, and TMM are negative regulators for stomatal development (Supplemental Table S1; Hara et al., 2007; Hunt and Gray, 2009; Shimada et al., 2011; Lee et al., 2015). Actually, SD in C4 species was lower than that in C3 (Figure 2, A and B and Supplemental Figures S3, c and d and S4, a and b), indicating these genes should not be responsible for the decrease in SD of C4 species. STOMAGEN is a positive regulator of SD (Supplemental Table S1; Kondo et al., 2010; Sugano et al., 2010; Shimada et al., 2011), whose lower expression in C4 species was in line with the decreased SD in C4 species (Figure 2, A and B and Supplemental Figures S3, c and d and S4, a and b). Reverse transcription quantitative PCR (RT-qPCR) quantification of the expression levels of STOMAGEN, EPF1, EPF2 homologs between C3 and C4 species grown under our conditions also confirmed the results from RNA-SEQ (Figure 3D and Supplemental Figures S8a and S14a). In this study, we renamed STOMAGEN in Flaveria as FSTOMAGEN.
There are differences in the amino acid sequences of signal peptides of STOMAGEN homologs, especially between species with large evolutionary distance (Figures 4A and 5A). The functional domain of STOMAGEN is, however, relatively conserved (Figures 4A and 5A). RNAi silencing of STOMAGEN homologs reduces SD in rice (Oryza sativa) (Yin et al., 2017; Lu et al., 2019), implying that STOMAGEN homologs also regulate stomatal development in other species besides Arabidopsis. A change in FSTOMAGEN expression levels was observed for rob when grown at different light conditions, in line with the change in SD (Supplemental Figure S8b).
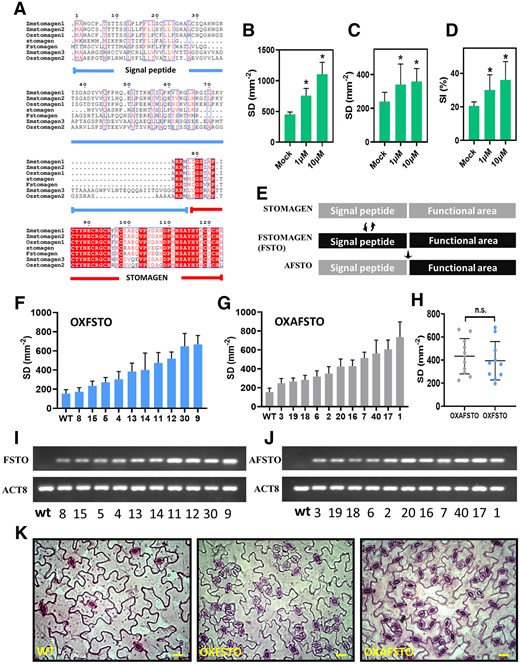
The Function of FSTOMAGEN in controlling the stomatal development. A, Protein conservation analysis of the homologs of FSTOMAGEN in different species. The amino acid regions marked by blue line and red line represent the signal peptide and the functional domain of FSTOMAGEN, respectively. Red letters represent conserved amino acids in most species, white letters with red backgrounds represent amino acid conserved across all species. B, The SD for Arabidopsis leaves with FSTOMAGEN applied at different concentrations (n = 8). C, The SD for bid leaves with FSTOMAGEN applied at different concentrations (n = 8). D, The SI for bid leaves with FSTOMAGEN applied at different concentrations (Mock and 10 μmol: n = 6, 1 μmol: n = 4). Error bar indicates sd. The asterisks represent statistically significant differences (P < 0.05, t test, two-tailed distribution, unpaired). E, The structure of recombinant genes used to transform Arabidopsis. AFSTO represents the recombination of the signal peptide of STOMAGEN from Arabidopsis and the functional domain of FSTOMAGEN from F. robusta. FSTO represents the intact STOMAGEN from F. robusta. F and I, The SD (F) and RNA-level (I) of the different transgenic Arabidopsis (FSTO) lines (n = 3). G and J, The SD (G) and RNA-level (J) of the different transgenic Arabidopsis (AFSTO) lines (n = 3). H, Comparison of SD between the transgenic FSTO lines and AFSTO lines. K, Photographs of stomata in a leaf from Arabidopsis with FSTO and AFSTO over-expressed. Scar bar represents 20 μm. Error bar indicates sd. The n.s. represent statistically no significant differences (P > 0.05, t test, two-tailed distribution, unpaired).
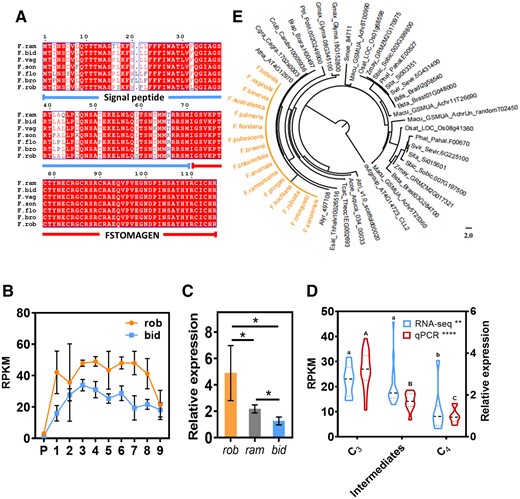
Expression level of FSTOMAGEN at different stages of C4 evolution. A, Protein conservation analysis of the homologs of FSTOMAGEN between different species in the Flaveria genus. The amino acid regions marked by blue line and red line represent the signal peptide and the functional domain of STOMAGEN, respectively. Red letters represent conserved amino acids in most species; white letters with red background represent amino acids conserved across all species. B, Expression levels of FSTOMAGEN determined by RNA-seq at the different developmental stages of leaves in rob and bid. RNA-seq data was from Billakurthi et al. (2018). P denotes leaf primordia. Approximate leaf length for the different leaf stages was 0.3 cm (stage 1), 0.5 cm (stage 2), 1.5 cm (stage 3), 2 cm (stage 4), 3 cm (stage 5), 4 cm (stage 6), 6 cm (stage7), 8 cm (stage 8), and 10 cm (stage 9). RPKM indicates reads per kilobase per million mapped reads (n = 4). C, Comparison of relative expression levels of FSTOMAGEN between rob, ram, and bid (n = 3) by RT-qPCR. The asterisks represent statistically significant differences (P < 0.05, t test, two-tailed distribution, unpaired). D, Comparison of the expression levels of FSTOMAGEN between different species with different photosynthetic types in Flaveria genus. For RT-qPCR, C3 species include pri (n = 5) and rob (n = 13), intermediate species includes ang (n = 3), ram (n = 5), and vag (n = 3), C4 species include tri (n = 4), aus (n = 3), bid (n = 4), and koc (n = 3). For RNA-seq, C3 species include pri (n = 4) and rob (n = 4), intermediate species includes ano (n = 4), pub (n = 4), chl (n = 4), bro (n = 4), C4 species include tri (n = 4) and bid (n = 4). RNA-seq data was from Mallmann et al. (2014). Dashed lines indicate median. Dotted lines indicate lower quartile and upper quartile. E, Phylogenetic tree for FSTOMAGEN. Orange represents the Flaveria species. The gene tree of STOMAGEN based on ML method. The relative expression indicates the measurements with RT-qPCR and the others were measured with RNA-seq. The geometric means of EF1a and ACT7 were used as the reference in the calculation of expression levels for other genes. Error bars indicate sd. The asterisks represent statistically significant differences, one-way ANOVA: *P < 0.05, **P < 0.01, ***P < 0.001, and ****P < 0.0001; different letters represent statistically significant differences, Tukey’s multiple test (α = 0.05).
To confirm that FSTOMAGEN can induce stomatal generation and evaluate the ability of FSTOMAGEN to regulate stomatal development, we overexpressed the FSTOMAGEN in Arabidopsis. Specifically, we recombined the signal peptide of STOMAGEN from Arabidopsis to the functional region of FSTOMAGEN and named the hybrid gene as AFSTO (Figure 4E). Overexpressing either the AFSTO or the intact FSTOMAGEN (FSTO) from Flaveriarobusta into Arabidopsis resulted in similar increased SD and could exceed 800 stomata mm−2 (Figure 4, F–J and Supplemental Figure S9), indicating the strong ability for FSTOMAGEN to positively regulate stomatal development, and that the signal peptide could not affect this ability of FSTOMAGEN. Identification of transcription showed successful transgenes and the expression level of AFSTO or FSTO increased with the increase in SD (Figure 4, F, G, I, and J). Overexpression of FSTOMAGEN induced clustered stomata (Figure 4K).
To further confirm that FSTOMAGEN can increase SD in Flaveria, we synthesized a peptide representing the FSTOMAGEN functional region, consisting of 45 amino acids. In order to confirm our synthesized peptides that have been folded were biologically active, the FSTOMAGEN peptides were applied in vitro on the leaves of Arabidopsis, and resulted in increased SD and clustered stomata (Figure 4B and Supplemental Figure S10b). Application of the peptides on leaves of bid also increased SD and SI and caused stomatal clustering (Figure 4, C and D and Supplemental Figures S10a and S11). These results demonstrate that, in addition to its in vivo function, in vitro application of FSTOMAGEN also directly positively regulates stomatal development in Flaveria. This is consistent with the notion that STOMAGEN is secreted out of cells to influence the stomatal development in the epidermal layer in Arabidopsis (Kondo et al., 2010; Sugano et al., 2010).
The characters of FSTOMAGEN during C4 evolution in Flaveria
We examined the copy number of FSTOMAGEN in Flaveria using blastn with the coding sequence of FSTOMAGEN as query sequence against the assembled contigs of each Flaveria species from 1KP, and there was only one hit sequence with e-value ˂10−5, indicating that there is a single copy of FSTOMAGEN in each species (Figure 5E and Supplemental Figure S12). The amino acid sequence of the functional region is identical between Flaveria species with different photosynthetic types (Figure 5A). A phylogenic tree constructed for STOMAGEN from different species suggested FSTOMAGEN homologs of species within the genus Flaveria are extremely conserved (Figure 5E and Supplemental Figure S13). Examination of the RNA-seq data of Flaveria showed that the expression levels of FSTOMAGEN in C3 species were markedly higher than those in C4 species along different developmental stages of leaves (Figure 5B). During leaf growth and development, the expression of FSTOMAGEN in both bid and rob increased first, reaching the highest level at leaf development stage 3 (leaf length 1.5 cm) or 4 (leaf length 2.0 cm), and then declined (Figure 5B). The expression level of FSTOMAGEN in bid (C4) was lower than that in rob (C3), and that of ram (intermediate species) lay between them (Figure 5C and Supplemental Figure S14, b–d). This encouraged us to test more Flaveria species with different photosynthetic types. Similar results were obtained with either RNA-seq or RT-qPCR (Figure 5D and Supplemental Figure S14, e and f), where we found the gradual decrease of FSTOMAGEN expression from C3 to intermediate species to C4 species.
The expression of FSTOMAGEN homologs for species with different photosynthetic types in multiple C4 lineages
The SD of abaxial leaf in C3 rice was 240% higher than that in C4 maize (Zea mays), consistent with the higher gs in rice compared with maize (Figure 6, A and C). The iWUE of maize was 324% higher than that of rice (Figure 6D). The stomatal length (l) of maize was 133% longer (Figure 6B). The transcript abundance of stomatal development-related genes gradually decreased as the leaf matured, suggesting they are responsible for stomatal development (Supplemental Figure S15c). The STOMAGEN homologs in rice had much higher transcript abundances than those in maize (Figure 6F). This result encouraged us to test more C4 lineages (Supplemental Figure S15a). We calculated the transcript abundances in the species with different photosynthetic types from these different C4 lineages through RNA-seq, and the raw data were from One Thousand Plants (1KP) Consortium (Supplemental Figure S15a; Supplemental Tables S2–S4; Carpenter et al., 2019; One Thousand Plant Transcriptomes, 2019). The details of the methods are shown in the “Materials and methods.” The expression of C4 photosynthesis-related genes was indeed higher in C4 species (Supplemental Figure S15b), suggesting the data and analysis pipeline can be used to compare the differences in expression of genes between C3 and C4 photosynthetic types. The expression levels of STOMAGEN homologs for C4 were lower than those for C3, while intermediate had expression between them (Figure 6G).
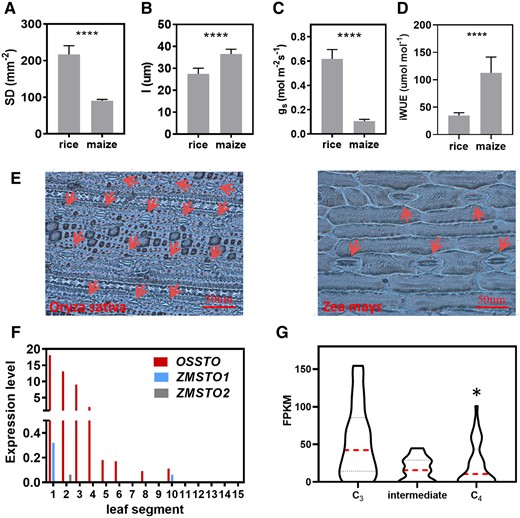
Comparison of stomatal pattern and expression levels of stomatal development-related genes in the C4 lineages other than Flaveria. A–D, Stomatal characteristics for rice and maize. SD (n = 8); B, stomatal length (l) (n = 25); C, gs (n = 8). D, iWUE (n = 8). Error bar indicates sd. The asterisks represent statistically significant differences (****P < 0.0001, t test, two-tailed distribution, unpaired). E, Photographs of stomatal pattern in rice and maize. Arrows point to stomata. Scale bars represent 50 μm. F, Comparison of the expression levels of STOMAGEN homologs between rice and maize. There are one and two putative paralogs of STOMAGEN in rice and maize, respectively. OsSTO represents the homologs of STOMAGEN in rice. ZmSTO represents the homologs of STOMAGEN in maize. The expression was determined by RNA-seq (RPKM) in rice and maize. The RNA-seq data were from Wang et al. (2014). G, Comparison of the expression of STOMAGEN homologs between C3 species, intermediate and C4 species from different C4 lineages (shown in Supplemental Figure S15a). Dashed lines indicate median. Dotted lines indicate lower quartile and upper quartile. The asterisks represent statistically significant differences (P < 0.05, t test, two-tailed distribution, unpaired).
Discussion
The evolutionary trajectory of stomatal traits along C4 evolution
Many recent studies have proposed that stomata may play an important role in the evolution of C4 photosynthesis (Taylor et al., 2010, 2012; Osborne and Sack, 2012; Brautigam and Gowik, 2016). In order to study the stomatal evolution during C4 evolution, we used Flaveria genus, which includes species with different photosynthetic types. Species within Flaveria have a close evolutionary distance, which can reduce the effects of factors other than photosynthetic types on stomatal traits. In addition, Flaveria represents a C4 evolutionary model that minimizes differences in habitat (Powell, 1978; Sudderth et al., 2007, 2009; Kocacinar et al., 2008; Supplemental Table S5). The short phylogenetic distance and similar growth habitats enabled us to better detect the differences in stomatal traits between species with different photosynthetic pathways (Figures 1 and 2). With data from species in the Flaveria genus, we consolidated the earlier notion that gsmax is associated with the evolution of photosynthetic pathway and there is a decrease in gsmax and SD in C4 plants compared with C3 plants (Taylor et al., 2012). Our data further showed that the decrease in gsmax and SD also occurred in dicotyledon and this decrease in SD is due to reduced stomatal generation (Figure 2G and Supplemental Figure S1e).
We showed that the changes in stomata traits along the path to C4 were gradual, not abrupt (Figures 1–3 and Supplemental Figure S1). The change of stomatal traits initially occurred at the Type I stage (Figure 2;Table 1; and Supplemental Figure S1). Previous studies have proposed that in C4 species the decrease in SD might be due to the restriction on stomatal development caused by the increased vein density (Taylor et al., 2012; Way, 2012). In this study, we found no change in SD in early stage in Flaveria (Figure 2 and Supplemental Figure S1c), for example, between Flaveriapringlei and Flaveriasonorensis, while the vein density at this stage was already greatly increased (McKown and Dengler, 2007). Therefore, the decreased SD in C4 evolution was not due to the constraint caused by vein development, at least during the early stage of C4 evolution.
On the road to C4, stomata become fewer in number (lower SD, SI) and larger in size (longer L) (Figure 2E). The opposite trends in SD and SS changes have been repeatedly shown in different conditions (Beerling and Franks, 2009; Franks et al., 2009). The opposite trend may help maintain relative constant allocation of epidermal space to stomata (Beerling and Franks, 2009; Franks et al., 2009). Transgenic experiments of genes related to stomatal development have shown that SS and SD are related, showing that changes in SD can directly cause opposite changes in SS (Tanaka et al., 2013b; Franks et al., 2015). Therefore, during C4 evolution, the opposite trends of changes in SD and SS could be caused by the same stomatal development-related genes, as shown here in the case of FSTOMAGEN (Figure 5, B–D). Here, it is worth mentioning that the SS was shown earlier to be related to the size of genome (Beaulieu et al., 2008). Since the genome sizes increased gradually along C4 evolution in Flaveria (Taniguchi et al., 2021), the increased genome size might be another factor for the increased SS during C4 evolution in this genus.
Co-evolution of stomatal traits and photosynthetic pathway during C4 evolution
In F. sonorensis and Flaveriaangustifolia, two Type I intermediate Flaveria species, gsmax were still similar to those in C3Flaveria species, that is, F. pringlei and F.robusta (Figure 1B and Supplemental Figure S1, a and b); while in contrast, the CO2 compensation points of these Type I species were already dramatically decreased (Maurice et al., 1991) compared with their C3 ancestors, as a result of a photorespiratory CO2 pump (C2 photosynthesis) (Keerberg et al., 2014). This is consistent with the notion (Way et al., 2014) that at the early stage of C4 evolution, the primary evolutionary driver should be to elevate CO2 levels around Rubisco, rather than saving H2O. After this early step, we found an initial decline in gsmax occurred near Type II (Figure 1, B and C and Supplemental Figure S1, a and b), which suggests that reducing water loss become crucial at this stage. This might be because the enhancement of photosynthetic capacity by C2 or C4 photosynthesis can increase CO2 uptake and evapotranspiration of canopies (Vogan and Sage, 2011), hence creating a higher water demand and raising the danger of embolism, especially in the arid, semi-arid, hot, and saline areas (Osborne and Sack, 2012).
A higher intercellular CO2 concentration could diminish the benefit of photorespiratory CO2 pump and photosynthetic capacity in bundle sheath. Indeed, under higher CO2, intermediate species will have no photosynthetic advantage over C3 plants (Vogan et al., 2007; Vogan and Sage, 2012). The decrease of gsmax represents a negative regulatory mechanism on intercellular CO2 concentration. Therefore, the gradual decline of gsmax is in agreement with the gradual establishment of photorespiratory C2 pump and the shifting of photosynthetic facilities from mesophyll tissue to bundle sheath tissue (Figure 7).
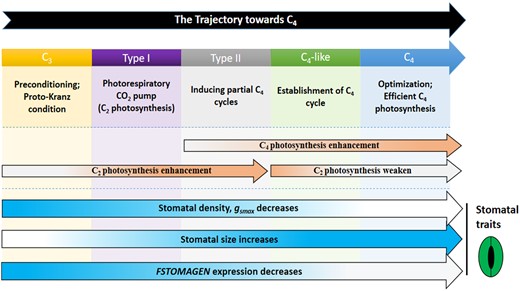
Schematic of the tactic change in the C4 syndrome in the current C4 evolution model. The positions of the C4 syndromes in the current C4 evolution model are shown. The arrows represent the gradual enhancement or weakening of features over the entire evolutionary gradient. Color deepening means enhancement, lighter color means weakening. The parts related to the stomatal traits are indicated by a pictorial stoma. The rest of the content originates from previous research on photosynthesis in Flaveria genus (McKown and Dengler, 2007; Kocacinar et al., 2008; Vogan and Sage, 2011; Schulze et al., 2013; Mallmann et al., 2014; Sage et al., 2014; Stata et al., 2016, 2019;Taniguchi et al., 2021).
The photorespiratory CO2 pump further magnified the ammonia imbalance, hence promoting the evolution of C4 metabolism (Mallmann et al., 2014). Although the C4 photosynthesis is incomplete and the activities of C4 enzymes are low in Type II (Maurice et al., 1983, 1991), the increased C4 cycle might alleviate the decrease in photosynthetic rate caused by the decreased gsmax. In particular, in C4-like and C4 species, a complete and highly active C4 cycle (Maurice et al., 1991), with the increased expression levels and enzymes activities of CA and PEPC, can enable maintenance of high photosynthetic rate even though the reduced intercellular CO2 concentration (Vogan and Sage, 2011; Taylor et al., 2010, 2012), which allows gsmax further decrease. This is consistent with the earlier finding that when the limitation on photosynthetic rate by CO2 supply becomes less, gsmax dominated by SD will reduce (Beerling and Franks, 2009). Photosynthetic pathway and stomata have been shown closely related (Wong, 1979; Franks and Beerling, 2009; Taylor et al., 2010; Taylor et al., 2012; Brautigam and Gowik, 2016), our work could provide an example for the co-evolution between photosynthetic pathway and stomata (Figure 7).
STOMAGEN homologs as a molecular trigger to alter gsmax during C4 evolution
Stomatal development is controlled by a molecular signaling network composed of many interacting components (Zoulias et al., 2018). In theory, any gene controlling stomatal development could be potentially selected to alter stomatal patterning and affect gsmax during the emergence of C4 photosynthesis (Doheny-Adams et al., 2012; Franks et al., 2015). In fact, the alterations of stomata patterning under different conditions are indeed caused by different molecular pathways (Hamanishi et al., 2012; Tanaka et al., 2013a; Engineer et al., 2014). However, during C4 evolution, the decreased expression of FSTOMAGEN (Figures 3, C and D and 5, B–D), a STOMAGEN-like gene, is selected as the strategy to decrease SD and gsmax in the Flaveria genus and likely in other lineage as well (Figure 6). Multiple evidences from this study support this notion. In our experiments, FSTOMAGEN strongly and positively regulated stomatal development when either synthetic FSTOMAGEN peptide was applied in vitro or FSTOMAGEN was over-expressed in vivo (Figure 4). That the alteration of amino acid sequence of FSTOMAGEN affected SD and gsmax during C4 evolution was not supported (Figure 5, A and E).
Besides FSTOMAGEN, we also noticed that some other genes related to stomatal development were differentially expressed between C3 and C4. However, these genes showed either less change or the pattern of changes could not result in the observed changes in SD (Figure 3C). For example, EPF1 homologs negatively regulate stomatal development (Hara et al., 2007; Wang et al., 2016; Hughes et al., 2017; Caine et al., 2018), but its expression was lower in C4, which contradicts with the lower SD in C4. The differential expression for these stomatal development-related genes between C3 and C4 may be due to the co-regulation and feedback between stomatal development-related regulators, as previous work showed that overexpression of STOMAGEN can increase the expression of other stomatal regulatory genes (Hronkova et al., 2015).
An approach to achieve high water-use efficiency for C4 plants
The short-term regulation of stomatal conductance (gs) depends on stomatal opening and closing, while the long-term change of gs always depends on stomatal development, which controls gsmax (Franks et al., 2009; Beerling and Franks, 2009; Doheny-Adams et al., 2012). Our analysis showed that gs is significantly correlated to gsmax during C4 evolution (Figure 1D). The gs of C3 species is higher than that of C4 species, which is consistent with their higher gsmax (Figures 1E and 6C and Supplemental Figure S2c). Therefore, stomatal development substantially contributed to the change of gs in C4 evolution. In some cases, the regulation of gs by the change of SD will be compensated by stomatal aperture (Schluter, 2003; Bussis et al., 2006), which suggests that the change of gs caused by gsmax might be compensated by stomatal aperture during C4 evolution. Therefore, whether stomatal aperture evolves during the evolution of C4 photosynthesis still needs further exploration.
The iWUE of C4 relative to that of C3 increased, partly or totally contributed by a lower gs (Supplemental Figure S2, c and d; Vogan and Sage, 2011). Because the decrease in gs is in line with the decrease in gsmax, the increased iWUE of C4 species can be at least partially attributed to the decreased gsmax (Figure 1 and Supplemental Figure S2, c and d). Therefore, the decreased FSTOMAGEN expression has contributed to the increased iWUE in C4 plants. The gradual decrease in gsmax mediated by FSTOMAGEN during C4 evolution may represent an approach to achieve high water-use efficiency in C4 evolution. This is important for improving WUE in C4 engineering. Results from this study suggest that FSTOMAGEN is one available gene to improve WUE in the C4 engineering, since FSTOMAGEN was already selected during the evolution of C4 photosynthesis.
Materials and methods
Plant materials, sample conditions, and data sources
All Flaveria species used in this study were kindly provided by Prof. Rowan F. Sage (University of Toronto). Plants used for stomatal phenotyping were re-grown from cuttings and placed in an environment humidified with humidifiers to generate roots. After plants generated roots, they were transferred outdoors (Institute of Plant Physiology and Ecology, Chinese Academy of Sciences, Shanghai, China) and transplanted into 4-L pots filled with topsoil in April. In July 2018, the stomatal traits on abaxial and adaxial surfaces of leaves were detected. Another batch of Flaveria, which was also grown from cuttings, was transferred to the phytotron (Center of Excellence for Molecular Plant Sciences, Chinese Academy of Sciences, Shanghai, China). Growth temperature of the phytotron was maintained at 25°C–28°C, photoperiod was maintained at 16-h light/8-h dark, relative humidity (RH) was at 60%–65%, and PPFD was maintained at about 180 µmol m−2 s−1. Two months later, the stomatal traits on the abaxial and adaxial surfaces of leaves were detected. RNA was extracted from 1.5 to 3.0 cm long young leaves on the axial shoot which were still expanding. At 3 h before sampling, we provided sufficient water to ensure that plants were not water limited, since drought and water status might affect expression levels of STOMAGEN (Xu and Zhou, 2008; Hamanishi et al., 2012). Gene expression was also examined in 1.5–3.0 cm young leaves under normal growth conditions by RT-qPCR for the rob, ram, and bid, which are representative of C3, intermediate and C4 species in the Flaveria genus. These three species were grown in the same phytotron with the same environmental conditions, except that we did not water plants before sampling. To test whether plants grown from cuttings or from seeds show difference in the SD, we further grew Flaveria species from seeds in phytotron and examined stomatal properties. Same environmental conditions were maintained for phytotron as above. Two months after the germination of seeds, we counted stomatal number.
All plants were well watered to avoid drought stress during their growth. We supplied the same amount of commercial nutrient solution (Peters Professional, SCOTTS, N:P:K = 20:20:20 + TE, at recommended dose for application) to the different species to avoid nutrient deficiency.
Rice (O.sativa Nipponbare) and maize (Z.mays B73) were grown in the greenhouse (Center of Excellence for Molecular Plant Sciences, Chinese Academy of Sciences, Shanghai, China) under a PPFD of 550 μmol/m2/s, a photoperiod of 12-h light/12-h dark, and a daytime temperature of around 31°C and a night-time temperature of around 22°C. The RH was maintained at around 50%–55%. The plants were regularly watered to avoid drought stress.
In addition to the expression data collected by this study, we also used public data for comparison of transcript abundance. Considering that stomatal development-related genes are mainly expressed in young tissues, in each of these used public data source, samples for young leaves were included. For the Flaveria, data from four sources for leaves of plants grown under normal condition were analyzed. The first data source is the 1KP Consortium, and we subsequently analyzed the data according to the methods described in previous work (Lyu et al., 2015, 2021; Supplemental Table S6). The second and third data sources were Mallmann et al. (2014), and Gowik et al. (2011). The fourth data source was Billakurthi et al. (2018). The last three data sources are all from Heinrich Heine University. For the second and third data source, the second and fourth visible leaves were sampled; the second leaf was not completely mature, and stomatal developmental related genes were still actively expressed. In addition to Flaveria, we also test the gene expression in many species with different photosynthetic types from other C4 lineages (Supplemental Figure S15a and Supplemental Tables S2–S4). The leaves of these species were sampled and the transcripts were sequenced by 1KP Consortium (Carpenter et al., 2019; One Thousand Plant Transcriptomes, 2019). Plants were grown in the greenhouse of University of Toronto and sampled between 9:00 and 12:00 in June 2010. The growth condition of plants and method of sampling was described in detail in previous work (Johnson et al., 2012; Kelly et al., 2017). The transcripts were assembled with Trinity (Grabherr et al., 2011) with default parameters. The N50 was shown in Supplemental Table S2. Transcript abundances were analyzed by mapping the reads to assembled contigs for corresponding samples using the RSEM package with mapping option of bowtie 1 (Li and Dewey, 2011), and mapping rate was shown in Supplemental Table S3. Outliers that less than Q1 (lower quartile) −1.5 interquartile range (IQR) and greater than Q3 (upper quartile) +1.5 IQR were removed. Expression levels for stomatal development-related genes in developing leaves for rice and maize were obtained from Wang et al. (2014).
Conservation and hydrophobicity analysis of proteins
Amino acid sequence of the homologs of STOMAGEN, EPF1, and EPF2 were aligned by clustalx, and graphs for the multiple alignments were drawn with ESPrit version 3.0 (Robert and Gouet, 2014) (http://espript.ibcp.fr/ESPript/cgi-bin/ESPript.cgi). Hydrophobicity of proteins was determined by ProtScale (Kyte, 1982) (https://web.expasy.org/protscale/).
Construction of the phylogenetic tree of STOMAGEN
In order to construct the gene evolutionary tree of STOMAGEN, we searched the putative orthologs of STOMAGEN in 28 representative species among Viridisplantae as demonstrated in Perveen et al. (2020). The protein sequences of representative species were downloaded from Phytozome (https://phytozome.jgi.doe.gov/). Orthologs of STOMAGEN were predicted applying OrthoFinder (version 0.7.1; Emms and Kelly, 2015) with default parameters. Proteins sequences of STOMAGEN putative orthologs were then aligned with MUSCLE (Edgar, 2004). We then inferred the gene phylogeny using both maximum-likelihood (ML) and Bayesian-inference (BI) methods. The ML tree was constructed with RAxML (version 2.2.3) (Stamatakis, 2006), where bootstrap scores were obtained by running 100,000 independent trees. BI tree was built with MrBayes package (version 3.2.1) (Ronquist et al., 2012), where posterior probabilities were calculated by running 2,000,000 generations with the first 2,000 generations being used as burn-in. In both cases, PROTGAMMAILG model (General Time Reversible amino acid substitution model with assumption that variations in sites follow gamma distribution) was used to infer the gene phylogeny. The protein sequence of AT4G14723 (CLL2) from Arabidopsis (A.thaliana) was used as outgroup as it showed the highest identity with STOMAGEN in A. thaliana, with a protein identity of 26.97% and e-value of 0.037 based on Blastp (Shiryev et al., 2007). Protein sequences for the Flaveria species were predicted using OrfPredictor (Min et al., 2005) based on de novo assembled transcripts as described in Ming-Ju et al. (2018).
Measurement of leaf gas exchange
The LI-6400 Portable Photosynthesis System (Li-Cor, Inc., Lincoln, Nebraska, USA) was used to measure gs, A, and iWUE (A/gs) on the youngest fully expanded leaves from approximately three-months-old Flaveria plants (Flaveria robusta and Flaveriabidentis) which were different from the groups used for measuring stomatal traits, but the growth condition was same as the plants grown in phytotron. The cuvette temperature was maintained at 25°C, the PPFD was at ∼500 µmol/m−2s−1, and the CO2 concentration was at around 400 ppm. Chamber humidity was matched to ambient air humidity. Leaf-to-air vapor pressure difference was maintained around 1.1 kPa. Before the measurements, Flaveria plants were maintained under constant light with a PPFD of ∼500 μmol m−2s−1 until A and gs reached a steady state. Our gas exchange experiment was analyzed together with previous work that measured gas exchange under 2,000 µmol m−2s−1 (Figure 1, D–F and Supplemental Figure S1, c and d; Vogan and Sage, 2011). Cuvette environments during the gs measurements for rice and maize were controlled to be their growth conditions. The gs measurements for rice and maize were performed from 14:00 to 18:00 in the greenhouse where they grew. In rice and maize, 16-day-old third leaves which were the youngest mature leaves were used for gas exchange measurements (Wang et al., 2014).
Phenotyping stomatal traits and the calculation of gsmax
The youngest fully expanded leaves (usually the third or fourth leaves from the apex in Flaveria) at the main stem were used to phenotype stomata-related traits. In Flaveria and maize, stomata-related traits were observed using both nail polish method and epidermis directly peeled from leaves (Franks et al., 2015; Reeves et al., 2018). For the first method, nail polish was painted on both leaf surfaces to produce the impressions of epidermis. After the nail polish was dried, the nail polish was peeled off the leaf and placed on a microscope slide for examination. For the second method, leaf epidermis was peeled off manually and transferred onto microscope slide. For the count of SD in Arabidopsis, the rosette leaves were soaked in 9:1 (V/V) ethanol:acetic acid overnight, washed with water and cleared in chloral hydrate solution (glycerol:chloral hydrate:water, 1:8:1) overnight, and then stomata of Arabidopsis were stained with Safranin-O, finally leaves were placed on a microscope slide for imaging. Light microscope (smarte; CNOPTEC), camera, and image processed software (OPTPRO; CNOPTEC) were used to observe and image epidermis at 100× magnification in Flaveria. Mid-section of leaves was chosen to count SD and measure stomatal length. Five stomata randomly chosen along a diagonal of the varnish peels or epidermis were measured for stomatal length.
The constants d is the diffusivity of H2O in air; the constant v is the molar volume of air; D is the SD; amax is the maximum stomatal pore area which is calculated as in Flaveria species, and the p is the stomatal pore length; e is the stomatal pore depth, which is known as equal to guard cell width.
RNA isolation, RT-PCR, and RT-qPCR
The young leaf samples taken from the main stem in Flaveria or the developing rosette leaves in Arabidopsis were immediately frozen in liquid nitrogen and used directly for RNA extraction. Total RNA was extract from the young leaves using the PureLink RNA Mini kit (Thermo Fisher Scientific, Waltham, Massachusetts, USA). The first-strand cDNA was synthesized by the TransScript One-step gDNA Removal and cDNA Synthesis SuperMix (TransGen biotech, Beijing, China). Semiquantitative RT-PCR was performed with Phanta Max Super-Fidelity DNA Polymerase (Vazyme, Nanjing, China). The actin8 was chosen as the loading control. RT-qPCR was performed on the CFX connect (Bio-Rad, Hercules, California, USA) with the UNICONTM qPCR SYBR Green Master Mix (YEASEN, Shanghai, China) according to the manufacturer’s instructions. The calculation of expression is according to the 2−△△CT.
The expression stability of internal reference genes for the RT-qPCR was assessed by the software: geNORM and NormFinder (Vandesompele et al., 2002; Andersen et al., 2004). Specifically, we first calculated the coefficient of variations (CVs) of all genes in different Flaveria species. After that, all genes were sorted according to the calculated CV values. About 150 genes with the lowest CV were selected as potential candidate reference genes. Among these, those with mean expression level >300 were chosen as candidate reference genes. We also included those commonly used house-keeping genes, which include UBC9 (AT4G27960), UBQ11 (AT4G05050), ACT7 (AT5G09810), GAPDH (AT1G13440), EF1a (AT5G60390), and CACMS (AT5G46630; Supplemental Figure S16, a, b, and d), as the internal reference genes in this study. The specificity of the primers (Supplemental Table S2) for all these candidate reference genes were identified by agarose electrophoresis (Supplemental Figure S16c). With Genorm (Supplemental Figure S16e) and Normfinder (Supplemental Figure S16f), we concluded that ACT7, EF1a, and HEME2 showed stable expression levels across rob, ram, and bid. EF1a and ACT7 are classic reference genes and they showed minor variations under different conditions. The geometrical means of the expression level of ACT7 and EF1a were finally used as normalization factors. All primers used for RT-qPCR are listed in Supplemental Table S7. For each gene, three experimental technical replicates and at least three plants replicates were performed.
Vector construction and transformation
A list of primer sequences for plasmid construction was shown (Supplemental Table S7). The STOMAGEN and FSTOMAGEN DNA sequences, named ATSTO-cDNA and FloSTO-cDNA, respectively, were PCR-amplified from cDNA in Arabidopsis and rob. To obtain the AFSTO fragment, the signal peptide region of STOMAGEN was cloned from ATSTO-cDNA by PCR-amplification, and the functional region of FSTOMAGEN was PCR-amplified from FloSTO-cDNA. The signal peptide and functional region were combined by fusion PCR. To obtain an intact FSTOMAGEN (FSTO) gene, the whole gene in rob, including the signal peptide and the STOMAGEN functional region, was amplified from the cDNA of rob. To over-express AFSTO and FSTO, the AFSTO and FSTO were cloned separately to a pcambia-3300 binary vector which has a CaMV 35S promoter. This construct was introduced into Agrobacterium tumefaciens strain GV3101, transformed into Arabidopsis using a floral dipping procedure. Transgenic lines were selected on soil that had been treated with a diluted solution of phosphinothricin (diluted 3,000 times) over night. About a month after the seeds were sowed on the soil, the stomata were observed on the biggest mature rosette leaf. The phenotype of Arabidopsis T1 and T2 generations was observed at the 400× magnification using the light microscope. For each epidermal peel, five fields were counted for density.
Refolding of synthetic FSTOMAGEN
Chemically synthesized peptide (Synthesized peptide sequence: IGSVKPTCTY NECRGCRSRCRAEQVPVEGNDPINSAYHYRCICHR; Sangon Biotech, Shanghai, China) was dissolved in 20 mM Tris–HCl, pH 8.8, and 50 mM NaCl and then dialyzed (Sangon Biotech, 0.5 KD-1 KD) for 1 day at 4°C against 0.5 mM glutathione (reduced and oxidized forms, Macklin) and 200 mML-arginine (meilunbio) at pH 8.0, which were further dialyzed three times against 20 mM Tris–HCl, pH 8.8, and 50 mM NaCl for 1.5 days to remove glutathione.
Stomata induction assay
When the first true leaf or cotyledons appeared in bid and Arabidopsis that had germinated in 0.5 MS sterilized solid medium, FSTOMAGEN peptide was applied on the plants. After the bid and Arabidopsis were further incubated in 0.5 MS liquid medium at 22°C for 5 days, stomatal numbers on the abaxial surfaces for the first true leaf and cotyledons were counted under a differential interference contrast microscope.
Plotting and statistical analysis
The correlation, linear regressions, t test (α = 0.05), and Mann–Whitney U test (α = 0.05) were performed by GraphPad Prism version 8. Differences between means of multi-groups were assessed with one-way analysis of variance (ANOVA) using the GraphPad Prism version 8 and Tukey’s multiple range test was performed to detect differences between two groups. The A and gs at the saturated light intensity were digitized from Figure 1 in Vogan and Sage (2011) using the OriginPro version 2018.
Accession numbers
The Flaveria read data have been submitted to the National Center for Biotechnology Information Short Read Archive under accession numbers: SRP036880, SRP036881, SRP036883, SRP036884, SRP036885, SRP037526, SRP037527, SRP037528, SRP037529, SRP006166, and SRP169568. The Flaveria RNA-Seq datasets from 1KP Consortium are available at National Center for Biotechnology Information (NCBI) Gene Expression Omnibus (GEO) under accession number: GSE54339. The rice and maize RNA-seq datasets under accession number: GSE54274. Accession numbers of genes in this study are shown in Supplemental Table S3.
Supplemental data
The following materials are available in the online version of this article.
Supplemental Figure S1.gs, net photosynthesis rate, and iWUE between different Flaveria species.
Supplemental Figure S2. Stomatal parameters in Flaveria species.
Supplemental Figure S3. The stomatal traits for the Flaveria species grown outdoors.
Supplemental Figure S4. Stomatal traits on the adaxial surface of leaves in Flaveria.
Supplemental Figure S5. SD in rob (C3), ram (intermediate), and bid (C4) grown from seeds.
Supplemental Figure S6. Conservative analysis of amino acid sequences for STOMAGEN, EPF1, and EPF2.
Supplemental Figure S7. Transcript abundance of genes in the C4 cycle and C4-related transporters in Flaveria genus.
Supplemental Figure S8. The expression of FEPF1 and FEPF2 in Flaveria species and the expression of FSTOMAGEN under different light conditions.
Supplemental Figure S9. SD of T2 generation of transgenic Arabidopsis (AFSTO and FSTO).
Supplemental Figure S10. Photographs show stomata on the leaves with FSTOMAGEN peptides applied.
Supplemental Figure S11. The increase of SD in cotyledons of F. bidentis (bid) with in vitro application of FSTOMAGEN.
Supplemental Figure S12. Alignment of the functional domain of STOMAGEN with transcripts from different Flaveria species by BLAST.
Supplemental Figure S13. Phylogenetic tree for FSTOMAGEN.
Supplemental Figure S14. The expression of stomatal development-related genes was tested by different primers.
Supplemental Figure S15. The information of C4 lineage other than Flaveria.
Supplemental Figure S16. Assessment of the stability of expression levels of reference genes.
Supplemental Table S1. The effects and accession number of genes related to stomatal development in Arabidopsis, rice, and maize.
Supplemental Table S2. The N50 of the mapping of RNA-seq data taken from the 1KP database for juvenile and mature leaves.
Supplemental Table S3. The mapping rates of the mapping of RNA-seq data taken from the 1KP database for juvenile and mature leaves.
Supplemental Table S4. The information for the species used in Figure 6G and Supplemental Fig. S15, b and c.
Supplemental Table S5. The natural habitats of Flaveria.
Supplemental Table S6. Statistics for the mapping of the RNA-seq data of the juvenile and mature leaves in different species of the Flaveria genus.
Supplemental Table S7. Primers used in this study.
Supplemental Data Set S1. The statistical tests for the comparison of gsmax and SD between different Flaveria species either grown in phytotron or outdoors.
Y.-Y.Z. and X.-G.Z. designed the study, interpreted the results, and wrote the article. Y.-Y.Z. observed and measured the stomatal characteristics. Y.-Y.Z. carried out the molecular experiment and the treatment of synthetic peptides in vitro. F.M. conducted the transgene experiment. G.C. guided the treatment of peptides in vitro. M.A.L. analyzed the 1KP RNA-seq data.
The author responsible for distribution of materials integral to the findings presented in this article in accordance with the policy described in the Instructions for Authors (https://dbpia.nl.go.kr/plphys/pages/general-instructions) is: Xin-Guang Zhu ([email protected]).
Acknowledgments
We thank Prof. Colin Osborne and Julie Gray for constructive comments. We also thank Dr Matt Stata for bringing us Flaveria and helping us cut plants.
Funding
This work was supported by the Strategic Priority Research Program of the Chinese Academy of Sciences (grant number: XDB27020105) and the general program of National Science Foundation of China (31870214).
Conflict of interest statement. The authors declare no competing interests.
References
Author notes
Senior author
