


Abstract
Leaf senescence can be induced by stress or aging, sometimes in a synergistic manner. It is generally acknowledged that the ability to withstand senescence-inducing conditions can provide plants with stress resilience. Although the signaling and transcriptional networks responsible for a delayed senescence phenotype, often referred to as a functional stay-green trait, have been actively investigated, very little is known about the subsequent metabolic adjustments conferring this aptitude to survival. First, using the individually darkened leaf (IDL) experimental setup, we compared IDLs of wild-type (WT) Arabidopsis (Arabidopsis thaliana) to several stay-green contexts, that is IDLs of two functional stay-green mutant lines, oresara1-2 (ore1-2) and an allele of phytochrome-interacting factor 5 (pif5), as well as to leaves from a WT plant entirely darkened (DP). We provide compelling evidence that arginine and ornithine, which accumulate in all stay-green contexts—likely due to the lack of induction of amino acids (AAs) transport—can delay the progression of senescence by fueling the Krebs cycle or the production of polyamines (PAs). Secondly, we show that the conversion of putrescine to spermidine (SPD) is controlled in an age-dependent manner. Thirdly, we demonstrate that SPD represses senescence via interference with ethylene signaling by stabilizing the ETHYLENE BINDING FACTOR1 and 2 (EBF1/2) complex. Taken together, our results identify arginine and ornithine as central metabolites influencing the stress- and age-dependent progression of leaf senescence. We propose that the regulatory loop between the pace of the AA export and the progression of leaf senescence provides the plant with a mechanism to fine-tune the induction of cell death in leaves, which, if triggered unnecessarily, can impede nutrient remobilization and thus plant growth and survival.
Introduction
Paradoxically, death is part of survival for multicellular organisms and the processes governing cellular or organismal longevity are still among the mysteries of biology. Plants, unlike most animals, can discard entire organs if they become inefficient or damaged. The most conspicuous example of this developmental adaptation is leaf senescence, which in addition to programmed cell death (Keech et al., 2010; van Doorn et al., 2011), involves a highly efficient dismantling of cellular components and the coordinated remobilization of essential nutrients such as nitrogen, phosphorus, and numerous ions from the senescing leaf to the rest of the plant (Smart, 1994; Himelblau and Amasino, 2001; Maillard et al., 2015). This mechanism thereby enables survival and reproduction under limiting conditions.
Leaf senescence is a highly regulated process that is triggered by, and proceeds in response to, the integration of internal factors and external cues, e.g. leaf age, pathogens, drought, or darkness (Lim et al., 2007; Schippers et al., 2015; Liebsch and Keech, 2016). It is known that the impact of a stress is more likely to trigger the initiation of senescence in older leaves than in younger ones (Sade et al., 2018; Berens et al., 2019). This is partly due to the progressive and age-dependent activation of an ethylene-coupled signaling cascade, leading to the induction of the NAC transcription factor ORESARA1 (ORE1)—a master regulator of senescence and cell death (Oh et al., 1997; Kim et al., 2009; Li et al., 2013; Qiu et al., 2015).
Among the factors inducing leaf senescence, darkening is an excellent experimental model that facilitates the rapid and synchronized initiation of the process (Weaver and Amasino, 2001; Keech et al., 2007). As harnessing of light energy is the fundamental task performed by leaves, deprivation of light renders the leaf ineffective, and it is thus advantageous to trigger its senescence (Liebsch and Keech, 2016). In addition to complete darkening, light deprivation through shading, which acts through similar mechanisms, is also a common stress triggering leaf senescence, e.g. among densely planted crops (Guiamet et al., 1989; Rousseaux et al., 2000; Brouwer et al., 2012). In earlier studies (Weaver and Amasino, 2001; Keech et al., 2007; Law et al., 2018), we and others have shown that a leaf from an entirely darkened plant (DP) can survive much longer than an individually darkened leaf (IDL, i.e. only one leaf is darkened while the rest of the plant remains illuminated), which undergoes rapid senescence. This demonstrates that senescence is not inevitably induced by darkness and related energy deprivation alone, but is in fact an actively triggered response, which upon the right signals can be repressed. Furthermore, the existence of genetic variants and mutants that fail to undergo senescence in response to stress and which are thus qualified as functional stay-green mutants clearly demonstrates that plants possess strategies to cope with these factors, therefore pushing further the boundaries of cell longevity (Woo et al., 2013; Thomas and Ougham, 2014) . However, studies about the repression of cell death in senescence-resistant genotypes have often focused on the genetic components of this phenomenon, while the actual metabolic adjustments that support the extension of life span downstream of gene expression remain largely unknown (reviewed in Kusaba et al., 2013; Großkinsky et al., 2018).
To shed light on the metabolic pathways conferring increased longevity in response to stress, we performed detailed physiological, metabolic, and transcriptomic analyses of functional stay-green mutants with extreme capacity for survival in response to prolonged darkness. We found that metabolic adjustments affecting the amino acid (AA) pool play an important dual role in longevity, by providing respiratory substrates as well as supporting the biosynthesis of polyamines (PAs), which in turn can delay senescence through interference with the ethylene signaling pathway. These findings reveal a crucial connection between primary metabolism and hormone signaling in leaf longevity.
Results and discussion
Identification of a stay-green allele with highly delayed dark-induced senescence
We screened an ethyl methanesulfonate (EMS)-mutagenized population of Arabidopsis thaliana (Arabidopsis) Col-0 plants for mutants displaying strongly delayed dark-induced senescence, when individual leaves were covered (IDL; Keech et al., 2007). One of the identified mutants displayed a strongly delayed loss of chlorophyll in IDLs over extended time periods (Figure 1, A–C) and was identified as a nonsense mutation in the PHYTOCHROME-INTERACTING FACTOR 5 (PIF5) gene (Supplemental Figure S1A). An immunoblot analysis performed with 10-day-old seedlings confirmed the absence of the PIF5 protein in this mutant, referred to as pif5-621, similarly as in pif5-3, a T-DNA insertion knock-out allele of PIF5 (Khanna et al., 2007; Supplemental Figure S1B). pif5-621 and pif5-3 revealed a similarly delayed dark-induced leaf senescence phenotype based on chlorophyll content and senescence marker gene expression (Supplemental Figure S1, C–E). Furthermore, analysis of heterozygous pif5-621+/- plants (Supplemental Figure S1F) and complementation of pif5-621 with the native PIF5 gene (Figure 1, B and C) confirmed that the delayed senescence phenotype of pif5-621, like in pif5-3, is caused by a recessive, loss-of-function allele of PIF5.
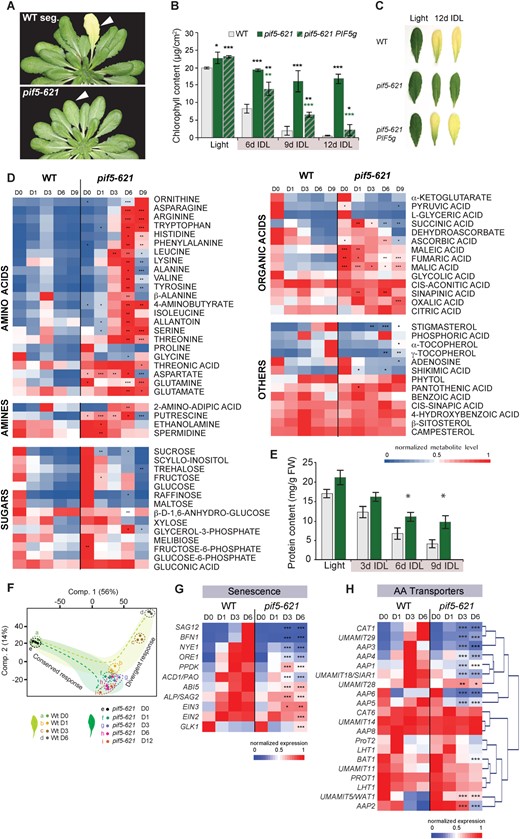
Phenotypic, metabolic, and transcriptomic characterization of pif5-621 during dark-induced senescence. A, Phenotype of the WT seg. and pif5-621 mutant after individually darkening single leaves (IDL) for 6 days. Background digitally removed to facilitate comparison. B, Chlorophyll content of Col-0 WT (WT), pif5-621, and the complemented pif5-621 PIF5g leaves in light, and after 6, 9, and 12 days of darkening treatment. *P < 0.05; **P < 0.01; ***P < 0.001 after Student’s t test with WT; n = 6 ±sd; colored asterisks highlight statistical differences between pif5-621 and pif5-621 PIF5g. C, Phenotype of IDLs of WT, pif5-621, and pif5-621 PIF5g line after 12 days of dark treatment. D, Relative metabolite levels in WT and pif5-621 leaves in light and after darkening treatment, where each metabolite's abundance is normalized to its maximum level detected within all samples. *P < 0.05; **P < 0.01; ***P < 0.001 after Student’s t test compared with WT; n = 4–5. D0 = light samples, D1, 3, 6, and 9 are samples from a darkening treatment of 1, 3, 6, or 9 days, respectively. For details, see Supplemental Dataset S1. E, Protein content. Significant differences between mutant and WT were assessed using a Student’s t test and are indicated as *P < 0.05, n = 4 ±se. F, PCA plot displaying component 1 versus component 2 and showing a conserved and divergent response pattern between WT IDL and pif5-621 IDL transcriptomes. G, Heatmaps for the normalized expression pattern of transcripts associated with senescence. H, HC analysis of transcripts coding for AAs transporters. For (G) and (H), statistically significant differences in expression are indicated according to adjusted P-values (limma), see Supplemental Material and Methods for details: *adj. P < 0.05; **adj. P < 0.01, and ***adj. P < 0.001. For detailed data, see Supplemental Datasets S4 and S5.
PIF5 loss of function has previously been reported to repress senescence upon prolonged darkness (Sakuraba et al., 2014). The strong stay-green phenotype of these mutants coupled to the knowledge of the transcriptional network downstream of PIF5 provides us with an ideal model for understanding the metabolic mechanisms of survival and their integration with genetic regulation. Furthermore, the overall growth habitus of pif5-3 and pif5-621 is very similar to wild-type (WT) plants (Supplemental Figure S1, G and H), indicating that pif5 mutants have a direct effect on senescence rather than an indirect effect via life cycle progression or overall growth, facilitating metabolic comparisons, and prompting us to proceed with pif5 as model for our analysis.
pif5 mutant leaves maintain their photosynthetic functionality during prolonged darkness while respiration and ATP levels are stable
Electron microscopy evidenced that, in comparison to WT, the two mutant lines had only slightly altered chloroplast ultrastructure even after 6 days of darkness (Supplemental Figure S1J) and that starch grains could be observed 24 h after the darkened leaf was returned to light (Supplemental Figure S1K), suggesting the ability to protect the light harvesting machinery from irreversible degradation in the pif5 lines. This functional maintenance was confirmed by measuring the CO2 assimilation rate at 250 μmol CO2 m−2 s−1 (A250). While WT darkened leaves lost their photosynthetic capacity entirely after 9 days, IDLs of pif5-621 could still fix CO2 upon exposure to light even after 15 days in darkness, although at a much lower rate than in non-darkened leaves (Supplemental Figure S1L).
An obvious hypothesis to explain the extended longevity in IDLs of pif5-621 could be that cells have slowed down their metabolism, respiration in particular, to consume as little reduced carbon as possible and survive much longer than in WT IDLs. Using a Clark-type oxygen electrode, we measured the dark respiration in IDLs and showed that, on a leaf area basis, dark respiration declined to ca. 50% of the rate measured in illuminated leaves (Supplemental Figure S1M) in both WT and pif5 IDLs. Respiration ceased in WT with the death of the leaf, however, it remained relatively constant in pif5 IDLs even after 15 days of darkening (Supplemental Figure S1M), suggesting that delayed senescence is not caused by a generally lower metabolic rate or a lack of substrates.
Since metabolism requires a balance between energy providing and energy requiring processes, extended survival under darkness would not only depend on resources and catabolic rate, but also on how much energy is available and how efficiently it is used. Accordingly, we measured levels of adenylates in both WT and pif5-621 IDLs. In WT and mutant, the ATP content was relatively stable, with a slight but not significant drop compared with earlier time points at 9 days IDL. In contrast ADP and AMP content decreased strongly in WT during the darkening time course, with the pool of AMP dropping drastically, ca.10 fold, after only 1 day (Supplemental Figure S2, A–C). Interestingly, in the mutant, while AMP levels dropped similarly to the WT ones, ADP levels remained relatively stable and to a much higher level than in the WT. This decrease of ADP in WT during senescence (Supplemental Figure S2B) likely reflected the loss of the plastidial contribution to the pool, which corroborated previous studies (Keech et al., 2007; Chrobok et al., 2016). Furthermore, the fact that the mutant maintained a rather stable ATP/ADP ratio across the darkening treatment once again supported the idea that substrates are available for energy maintenance even after prolonged darkness, raising the question of the identity of those substrates.
pif5 mutant leaves show distinctive metabolic changes compared with WT
Theoretically, cellular metabolism could be fueled by starch reserves, which could be differentially catabolized between WT and pif5-621. However, using both Lugol and enzymatic assays, we showed that starch was rapidly depleted in response to darkening for both genotypes (Supplemental Figure S2, D and E).
Therefore, to clarify the metabolic adjustments underpinning the striking longevity of pif5-621 leaves in response to darkness, we performed metabolic profiling of WT and pif5-621 leaves under 0, 1, 3, 6, and 9 days in darkness (IDL treatment) and focused our analysis principally on AAs, organic acids, amines, and sugars (Figure 1D and Supplemental Dataset S1). Firstly, apart from a few exceptions (primarily organic acids), the metabolic profiles of leaves that remained in light (i.e. D0) were similar between WT and pif5-621. Secondly, the metabolic profiles of IDLs from the two genotypes showed a few similarities, but also several major differences. Specifically, in darkened leaves, the abundance of sugars declined strongly in both pif5-621 and WT throughout the time course, in agreement with a lack of photosynthesis and a rapid depletion of starch reserves. A similar trend was observed for most of the organic acids, even though this decrease was on average more pronounced for the WT than for pif5-621. However, the most striking observation was related to the AA content. In IDLs of WT, most AAs showed a transient increase, starting at day 1 and peaking at day 3, followed by a decrease at later stages (Figure 1D). In IDLs of pif5-621, however, a progressive and significant accumulation of most of the AAs was observed across the time course. Only proline and glycine were not found to be more abundant in the IDLs of the mutant when compared with those of the WT. Several amines, such as putrescine (PUT) for instance, also significantly accumulated in IDLs of pif5-621 when compared with WT (Figure 1D). Conversely, typical senescence-associated metabolites like stigmasterol, tocopherols, and phytol increased much more strongly in IDLs of WT than in IDLs of pif5-621 (Figure 1D).
No major import of sugars, organic, or AAs from the rest of the plant is observed in pif5-621 IDLs
Extended longevity of pif5 mutant lines was also observed in dark-induced senescence assays with detached leaves (DET; Supplemental Figure S1I), even though senescence progressed faster for the DET of both the WT and mutants when compared with the IDL treatment. This suggests that the exchange of certain metabolites between the darkened leaf and the rest of the plant might contribute to pacing the progression of senescence.
We thus questioned whether the higher abundance of metabolites, particularly AAs, observed in IDLs of pif5-621 originated from the cells of the darkened leaf or were instead mostly imported from the rest of the plant. To test this, we conducted a 13CO2-labeling experiment in both WT and pif5-621 plants subjected to IDL treatment using a custom-made chamber and an experimental setup reported previously (Lindén et al., 2016; Law et al., 2018). The rationale behind this experiment is that 13CO2 is fixed only in the leaves remaining in light. This means that any metabolite with an above-background 13C percentage detected in an IDL (i.e. higher than the natural abundance) must have been either directly imported from the rest of the plant or de novo synthetized from another metabolite imported from the rest of the plant (Supplemental Figure S3A). Using GC-ToF-MS, we then analyzed the 13C enrichment in several metabolites, primarily sugars, AAs, and organic acids (for total relative pools [12C + 13C], see Supplemental Dataset S2). Concisely, while metabolites of leaves in light were labeled as expected, nearly no metabolites were labeled in IDLs of pif5-621 at any time points (Supplemental Figure S3, B and C). This clearly demonstrated that most of the metabolites found in higher abundance in pif5-621 IDLs did not come from the rest of the plant but predominantly originated from the cells of the darkened leaf itself.
pif5-621 undergoes moderate protein degradation
Next, we quantified the total soluble protein content in WT and pif5-621. Both genotypes underwent a substantial decrease in their protein abundance across the IDL treatment. However, this decrease was significantly slower and less pronounced in pif5-621 than in WT, and after 9 days, IDLs of pif5-621 retained two–three times more soluble protein than WT IDLs (Figure 1E).
In conclusion, our data show that the strong AA accumulation in the mutant is most likely derived from a selective protein breakdown, leaving both the photosynthetic and respiratory machineries in a functional state but allowing for the recycling of non-essential cellular components, likely in excess for the current cellular need.
Transcriptome analysis reveals major differences between WT and pif5-621 in their response to prolonged darkness
To shed light on the molecular mechanisms behind the metabolic divergence between WT and pif5-621, we performed a transcriptome analysis. A principal component analysis (PCA) showed that component 1, which accounted for 56% of the transcriptional variance, mostly reflected the effect of the darkening treatment, while only 14% accounted for the divergent response between genotypes across the IDL time course (component 2; Figure 1F). After 24 h of darkness, even though thousands of genes changed in expression for both the WT and pif5-621 compared with light conditions, only ca. 400 genes were differentially expressed between the two genotypes (Supplemental Dataset S3). However, this number drastically increased to several thousand at later stages, which notably reflected the transcriptional hallmarks of the induction of senescence in WT leaves (Supplemental Figure S4A). This was evidenced by the hierarchical clustering (HC) and subsequent Gene Ontology analyses performed with the gene expression dataset, from which seven different clusters were determined. In agreement with the observed senescence phenotype, clusters 2 and 3 contained many senescence-related genes strongly up-regulated in WT, but not (or significantly less) in pif5-621, across the progression of the darkening treatment (Supplemental Figure S4B and Supplemental Dataset S4). Autophagy- and senescence-associated genes (SAGs) including proteases (e.g. SAG12, SAG2), chlorophyll degradation-related genes (e.g. NON-YELLOWING 1 [NYE1], PHEOPHORBIDE A OXYGENASE [PAO]), transcription factor genes (e.g. ORE1, ETHYLENE INSENSITIVE2 [EIN2], ETHYLENE INSENSITIVE3 [EIN3], ABA INSENSITIVE 5 [ABI5]), starvation response and branched-chain AA (BCAA) metabolism-related genes had significantly higher transcript abundance in IDLs of WT than of pif5-621 (Figure 1G and Supplemental Figure S4, C–E). Conversely, clusters 6 and 7 contained genes whose transcript abundance strongly declined during IDL treatment in WT but remained much higher in pif5-621. These notably comprised genes associated with photosynthesis (e.g. LIGHT HARVESTING CHLOROPHYLL A/B BINDING PROTEIN encoding genes [LHCBs], RUBISCO SMALL SUBUNIT 1B [RBCS1B], GOLDEN 2-LIKE1 [GLK1]), consistent with maintained chloroplastic functions in pif5-621 but not in WT.
Looking in more detail at pathways associated with energy metabolism (Supplemental Dataset S5) revealed clear metabolic differences between WT and pif5-621. The abundance of transcripts associated with the β -oxidation and glyoxylate cycle, that is lipid degradation, was strongly up-regulated in IDLs of WT, whereas only a slight and transient increase in transcript abundance was observed in IDLs of pif5-621. This suggests that lipid degradation has only a minor contribution to energy metabolism in pif5-621 and would therefore be insufficient to support prolonged longevity. Furthermore, transcripts associated with gluconeogenesis and glycolysis, as well as with mitochondrial functions, such as the tri-carboxylic acid (TCA) cycle and mitochondrial electron transport chain (mETC), were only minimally differentially expressed between the two genotypes across the time course, which is consistent with similar respiratory rates observed (Supplemental Figure S1M). However, the alternative pathway, notably including NAD(P)H DEHYDROGENASE B2 (NDB2), NDB4 and ALTERNATIVE OXIDASE1A (AOX1A), AOX1D, increased strongly in transcript abundance in WT but not in pif5-621. This is in line with previously reported higher ATP/ADP ratio and surplus of reducing equivalents present in cells undergoing senescence (Supplemental Figure S2, A and B; Chrobok et al., 2016). Here, it also suggests a state of lower redox stress on the mETC of pif5-621.
Since IDLs of pif5-621 had (i) a lower induction of autophagy-related genes/proteases, (ii) less protein degradation, and (iii) a higher AAs content that was not originating from import, we examined the expression profiles of a set of AAs transporters. These included, but were not restricted to, the AA permease (AAP) and usually multiple AAs move in and out transporter (UMAMIT) families (for selected AA transporters with a known role, see Figure 1H while an overview of all potential AA transporters is provided in Supplemental Dataset S5). A HC revealed two main groups: one with genes coding for transporters with higher transcript abundance in WT in response to senescence, but not in pif5-621, and one with much less differences between the two genotypes as well as across the time course (Figure 1H).
Taken together, these data show that the AA accumulation observed in pif5-621 originates from the combined effect of (1) the selective breakdown of proteins, which did not alter the primary metabolic functions of the darkened cells and (2) the lack of induction of AAs transport mechanisms.
AA accumulation and deficiency in transport regulation are also affected in other stay-green contexts
Having observed this effect, we wondered whether a failure to induce AA transport was also associated with other stay-green contexts. For instance, ORE1 has previously been shown to be a master regulator of leaf senescence, in both dark-induced and developmental leaf senescence (Oh et al., 1997) as well as other programmed cell death events (Gao et al., 2018; Escamez et al., 2020). ORE1 is a NAC domain transcription factor regulating, among others, senescence-related genes like BIFUNCTIONAL NUCLEASE 1 (BFN1), SEVEN IN ABSENTIA2 (SINA2), SWEET15 (also known as SAG29), and NYE1 (Balazadeh et al., 2010; Matallana-Ramirez et al., 2013; Kim et al., 2014), to promote senescence progression. ORE1 is known to be regulated by several upstream factors including EIN3, ATAF1 (Arabidopsis Transcription Activation Factor 1, a NAC transcription factor), as well as PIF5 (Kim et al., 2014; Sakuraba et al., 2014; Garapati et al., 2015).
Thus, to test if the observed AA accumulation and export deficiency is also a feature downstream of ORE1, we challenged two independent knockout alleles of ORE1, ore1-2 (Kim et al., 2009) and SAIL_694_C04 (Wu et al., 2012). As expected, in response to darkness, the two ore1 mutant lines maintained high chlorophyll contents, while IDLs of WT underwent senescence (Supplemental Figure S5, A and B). Metabolomic analysis of all three genotypes was undertaken with a focus on the AA content and revealed that, similar to IDLs of pif5-621, IDLs of ore1 alleles accumulated AAs while IDLs of WT only showed a transient increase in AA abundance at day 3, before it dropped at later time points as previously observed (Supplemental Figure S5C). Furthermore, the expression profiles of several genes encoding AA transporters (AAP1, 3, 4, and 5), which were differentially expressed between pif5-621 and WT during senescence, had significantly lower transcript abundance in IDLs of ore1 compared with WT (Supplemental Figure S5D). To see whether ORE1 could be directly targeting AA transported genes, we queried the promoter regions (i.e. 3,000 kb upstream of the ATG) and the entire genomic region of several genes encoding senescence-associated AA transporters for the presence of previously determined binding sites for ORE1 (Matallana-Ramirez et al., 2013). Motifs did not occur more frequently in the promoter regions of those genes compared with a list of non-senescence associated AA transporters. Binding of ORE1 found by DAP-seq (O’Malley et al., 2016) was more frequently observed for senescence-associated transporters, but only for a subset of the genes, thus implying the involvement of other factors (Supplemental Dataset S6). We generated a gene inference network based on our transcriptome data (see “Materials and methods” for details), and in parallel performed literature mining. This yielded a list of additional transcription factors that could contribute to the transcriptional regulation downstream of ORE1 (Supplemental Figure S5E), including, for example NAP (NAC-like activated by AP3/PI [Guo and Gan, 2006]), bZIP53 (basic leucine zipper53 [Dietrich et al., 2011]), ARR2 (Arabidopsis Response Regulator2 [Kim et al., 2006]), WRKY25 (Doll et al., 2020), and WRKY45 (Chen et al., 2017).
Another stay-green context worth mentioning relates to a plant entirely darkened. As already introduced earlier, leaves of WT plant entirely darkened for 6 days remain much greener and metabolically active than an IDL (Keech et al., 2007; Law et al., 2018). Examination of both transcriptomic and metabolomic data of these leaves staying green in response to prolonged darkness evidenced a remarkably similar molecular signature as in pif5-621 and ore1 mutants, that is a non-induction of the typical senescence-responsive genes including the AA transporters (Supplemental Figure S6A) as well as a massive accumulation of AAs, including arginine and ornithine, when compared with the senescing leaves (Supplemental Figure S6B; Law et al., 2018).
Altogether, this indicates that the induction of AA transport is inherent to the senescence program, suppressed in stay-green contexts (mutants or DPs), and regulated downstream of ORE1, possibly both directly and indirectly via the action of other transcription factors.
Ornithine and arginine can repress the progression of senescence and support the energy metabolism
Under cellular conditions of carbohydrate scarcity, AA catabolism, particularly of BCAAs, can become an alternative source of substrates to fuel mitochondrial metabolism (Ishizaki et al., 2005, 2006; Araújo et al., 2010, 2011; Pires et al., 2016; Cavalcanti et al., 2017; Pedrotti et al., 2018). This mechanism was shown to be regulated by an energy deprivation response module including SnRK1.1 and bZIP transcription factors of C and S1 class (Baena-González et al., 2007; Dietrich et al., 2011). However, our data showed only a weak increase in expression of genes associated with the starvation response (e.g. bZIPs, SnRK1.1 [SNF1-RELATED KINASE1.1], and ATAF1) or with BCAA and lysine metabolism (e.g. ETFQO [ELECTRON-TRANSFER FLAVOPROTEIN:UBIQUINONE OXIDOREDUCTASE], IVDH [ISOVALERYL-COA-DEHYDROGENASE], MCCA [METHYLCROTONOYL-COA CARBOXYLASE SUBUNIT ALPHA]; LRK/SDH [LYSINE-KETOGLUTARATE REDUCTASE/SACCHAROPINE DEHYDROGENASE]) in IDLs of pif5-621 compared with the strong increase in expression in IDLs of WT (Supplemental Figure S4, D and E), and particularly in DP leaves (Supplemental Figure S6A). This implies that the observed BCAA catabolism associated with a low-energy syndrome may only partially contribute to supporting energy metabolism in pif5-621. It also suggests that another metabolic route is employed to support energy production and to allow for the extended longevity of cells in the mutant leaves.
We therefore questioned whether other AAs could repress the progression of senescence. To test this hypothesis, we placed Arabidopsis leaf discs in petri dishes containing a buffered aqueous solution of 2.5 mM of a given AA. Petri dishes were placed in darkness for 6 days at the same temperature cycle as in the growth room. Following this, the chlorophyll content of the leaf discs was quantified. Interestingly, in three cases, AA-treated leaf discs remained significantly greener than the mock-treated discs following darkening treatment: with glutamate (at P < 0.05), ornithine (P < 0.001), and arginine (P < 0.001), with ornithine having the strongest effect (Figure 2A). Since ornithine and arginine appeared as the most significant candidates, we assayed several additional metabolites, that is urea, allantoin, citrulline, spermidine (SPD), and PUT, that are, with the exception of allantoin, in close metabolic vicinity of these two AAs (Figure 2, A and B). Only the exogenous application of the two PAs, SPD and PUT, led to greener leaf discs, which thus suggested a role for these compounds in impeding the progression of senescence. In Arabidopsis, PUT can be both the direct product of an enzymatically catalyzed reaction with arginine as a substrate, or arise from non-enzymatic decarboxylation of ornithine, while SPD is synthesized from PUT via SPD synthase (SPDS) (Figure 2B; Alcázar et al., 2010). Note that other plant species may have ornithine decarboxylase (Hanfrey et al., 2001).
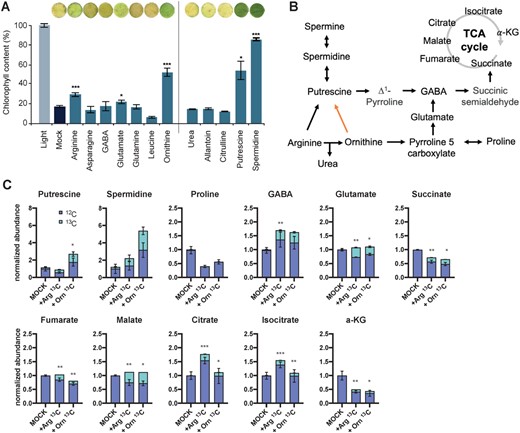
Contribution of arginine and ornithine to the production of PAs and energy metabolism. A, AA feeding experiments on leaf discs. Images of leaf discs were digitally extracted for comparison. Significance: Student’s t test with *P < 0.05, **P < 0.01; ***P < 0.001; n > 6 ±se. B, Simplified metabolic scheme leading to PAs, GABA, and TCA cycle intermediates production. Black arrow: enzymatic reaction, orange arrow: non-enzymatic reaction. C, Percentage of the 13C enrichment in the total pool of several metabolites in the metabolic vicinity of arginine (Arg) and ornithine (Orn) as shown in (B). Data were normalized to the mock treatment and compensated for the natural abundance of 13C; n = 3. Statistical significance: Student’s t test with *P < 0.05, **P < 0.01; ***P < 0.001. α-KG, α-ketoglutarate.
To ascertain whether the delayed senescence phenotype observed for treatment with arginine/ornithine or PUT/SPD were coupled, 13C-labeled arginine and ornithine (with all carbons labeled) were fed at 2.5 mM to leaf discs of Arabidopsis plants that were entirely darkened beforehand for 3 days (see “Materials and methods”). After another 3 days in darkness, that is 6 days in total, the relative content of 12C and 13C PUT and SPD in those leaf discs was quantified by LC-MS (Figure 2C). The strong 13C labeling, ca. 35%–40% of the total pool, present in the two PAs confirmed a metabolic flux from arginine and ornithine toward these PAs. Furthermore, arginine and ornithine could represent alternative substrates for mitochondrial energy metabolism via pyrroline-5-carboxylate (P5C) and glutamate, or via flux to PUT, as depicted schematically in Figure 2B. Indeed, in addition to PUT, significant labeling in the range of 10%–35% was observed in γ-aminobutyric acid (GABA), glutamate, and the TCA cycle intermediates succinate, fumarate, malate, citrate, isocitrate, and α-ketoglutarate (Figure 2C), but not in proline.
Taken together, our results suggest that in WT, arginine and ornithine deriving from protein degradation are catabolized or exported as part of the senescence process. However, in stay-green contexts such as in pif5-621 or in leaves of a DP, the two AAs accumulate in cells as their export from the leaf is not induced. This may provide a resource pool to support biosynthesis of PUT and SPD, which in turn can repress the progress of senescence. Furthermore, if canonical substrates (sugars, lipids, and BCAAs) become limiting; ornithine, arginine, and PUT may represent a pool of reduced carbon that can feed the TCA cycle.
PUT to SPD conversion is regulated by aging
PUT and SPD levels declined progressively during IDL treatment in all genotypes. However, PUT was found at significantly higher levels in both pif5-621 and ore1-2 mutants than in WT, while the abundance of SPD in the two mutant genotypes did not differ significantly from WT (Figure 3, A and B) after 6 days of treatment. In contrast, SPD levels dropped significantly less in the leaves of an entirely DP when compared with WT IDLs (Supplemental Figure S6C). This suggests that the flux from PUT to SPD might be partially gated independently of the stay-green characteristic per se.
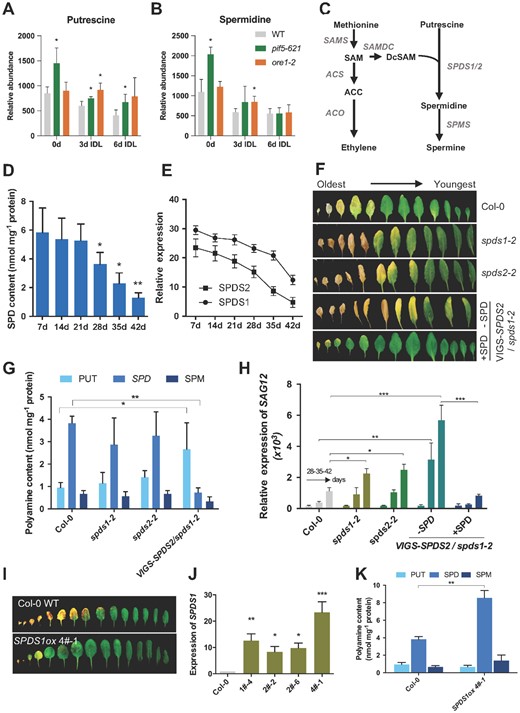
Endogenous SPD content decreases with leaf aging. Abundance of PUT (A) and SPD (B) in IDLs of WT, pif5-621, and ore1-2 across a 6-day time course. n = 3 ± sd. *P < 0.05, Student’s t test versus WT. C, Scheme illustrating biosynthesis of ethylene and SPD. Ethylene biosynthesis starts with the conversion of S-adenosyl-l-methione (SAM), which is converted from methionine by SAM synthase (SAMS), into 1-aminocyclopropane-1-carboxylic acid (ACC) by the enzyme ACC synthase (ACS). ACC can then be converted to the end product ethylene by ACC oxidase (ACO). SAM decarboxylase (SAMDC1/4) converts SAM into decarboxylated SAM (DcSAM). SPD is synthesized from PUT and DcSAM by SPDS (SPDS1/2). SPD is further metabolized to spermine by spermine synthase (SPMS). D, SPD content in the fourth leaf of WT (Col-0) at different developmental stages: 7-, 14-, 21-, 28-, 35-, and 42-day-old. Student’s t test, *P < 0.05, **P < 0.01; n = 3 ± sd. E, Transcript abundance of SPDS1 and SPDS2 in the fourth leaf across the same time course. n = 3 ± sd, and two technical replicates were performed. F, Senescence phenotype of spds1-2, spds2-2, VIGS-SPDS2/spds1-2, and WT plants. VIGS-SPDS2/spds1-2 plants were treated with 10 μM SPD. Rosette leaves detached from 45-day-old plants were arranged according to their age. G, PA contents in SPDS1/2 loss-of-function mutants. PAs were isolated from the fourth leaves of each line (30-day-old) and measured by HPLC. Bars represent mean ± sd (n = 3) (Student’s t test, *P < 0.05, **P < 0.01). H, RT-qPCR analysis of SAG12 expression. Bars represent mean ± sd (n = 3) (Student’s t test, *P < 0.05, **P < 0.01, ***P < 0.001). I, The senescence phenotype of SPDS1ox. Rosette leaves of 6.5-week-old Col-0 and SPDS1ox were detached and arranged according to their age. J, RT-qPCR analysis of SPDS1 expression in SPDS1ox lines. K, Determination of SPD contents in SPDS1ox plants as described in G. J and K: mean ± sd; n = 3; Student’s t test, *P < 0.05, **P < 0.01, ***P < 0.001.
SPD has been associated with the regulation of cell death/senescence processes in many species (reviewed in Sobieszczuk-Nowicka, 2017). For instance, it has been shown that exogenous application of SPD prolongs the lifespan of several model organisms such as yeast, nematodes, and flies by transactivation of autophagy-related genes through modulation of histone methylation (Eisenberg et al., 2009). In plants, already in the late 1970s, it was shown that exogenous addition of dibasic AAs as well as PAs, including SPD, delayed senescence in oat (Avena sativa) leaf protoplasts, supposedly by decreasing RNAse activity (Kaur-Sawhney et al., 1978). Since then, the variation of PA levels at the onset of leaf senescence has been investigated in a few species, and several modes of action on how PAs would modulate the progression of senescence have been proposed (Alcázar et al., 2010; Sobieszczuk-Nowicka, 2017; Nambeesan et al., 2019). This was mainly based on the fact that SPD biosynthesis can be metabolically connected to ethylene biosynthesis (Figure 3C). Yet, to date, many of the molecular aspects, including the mechanism of PAs action in senescence delay, as well as their natural role during development, have remained elusive (Sobieszczuk-Nowicka et al., 2019).
Based on the current literature and our results, we hypothesized that SPD biosynthesis could be affected by aging. To test this, we quantified the endogenous content of SPD in the fourth leaf of a WT Arabidopsis plant for 6 weeks and observed that its abundance dropped significantly as the leaf aged (Figure 3D). Secondly, we monitored the relative expression of the two genes encoding SPDS, SPDS1 and SPDS2 (Figure 3C; Imai et al., 2004), which may regulate the flux from PUT to SPD. Across the same developmental aging time course in the fourth leaf of a WT Arabidopsis plant, the two genes had a progressively lower transcript abundance (Figure 3E). Together, this confirmed our hypothesis that the flux from PUT to SPD is regulated by aging. Intriguingly, expression analysis of SPDS1 and SPDS2 in IDLs of WT and pif5-621 as well as in leaves of a DP showed that SPDS2 had a significant drop in transcript abundance during WT-IDL to about 30%. In contrast, the two other stay-green contexts retained significantly higher SPDS2 transcript levels than WT-IDL (about 75% of initial levels in pif5-621) or even showed an increase in WT-DP (Supplemental Figure S6D), suggesting a potential for enhanced SPD production. Although this would explain the significantly higher SPD levels measured in the leaves of an entirely DP (Supplemental Figure S6, C and D), the abundance of SPD measured in IDLs of pif5-621 did not show a significantly greater abundance, suggesting a different metabolic regulation between the two different stay-green contexts.
Endogenous SPD levels delay both dark-induced and developmental senescence
Exogenous application of SPD to darkened leaf discs had a strong repressing effect on senescence (Figure 2A). To assess whether endogenous SPD levels can also affect leaf senescence, we generated transgenic plants with decreased SPD content by silencing the expression of SPDS genes (Supplemental Figure S7, A–D). To circumvent the redundancy between both genes, but at the same time avoid the issue that the double knockout mutant spds1 spds2 is embryo lethal (Imai et al., 2004), we used the tobacco rattle virus (TRV)-induced gene silencing (VIGS) system (Liu et al., 2002) to generate SPDS2-silenced plants (VIGS-SPDS2) in the spds1-2 background (VIGS-SPDS2/spds1-2) (Figure 3F and Supplemental Figure S7D).
The spds1 and spds2 single knockout plants showed a slightly though not significantly altered content of PAs at 30 days. On assessment of the progression of leaf senescence at a later stage (45 days), however, the two single mutants displayed a moderately earlier senescence phenotype (Figure 3, F–H), while no difference was observed in bolting time among these plants under long-day (LD) conditions. This was exacerbated in the VIGS-SPDS2/spds1-2 plants, which had significantly higher levels of PUT and lower levels of SPD, as well as a strong early-senescence phenotype. Exogenous application of 10 μM SPD could rescue the accelerated senescence phenotype in the VIGS-SPDS2/spds1-2 plants (Figure 3F). These data strongly supported the hypothesis that a depletion of endogenous SPD accelerates developmental leaf senescence. In agreement, the expression of a senescence-associated marker gene SAG12 was also induced to a higher extent in VIGS-SPDS2/spds1-2 plants than in single spds mutant lines, but was suppressed by the addition of SPD (Figure 3H). Furthermore, the overexpression of SPDS1 (SPDS1ox) increased SPD content and delayed both age- and dark-induced senescence (Figure 3, I–K and Supplemental Figure S7, E–G). Collectively, the above data demonstrate that SPD is an endogenous negative-regulator of leaf senescence in Arabidopsis.
SPD affects the ethylene signaling pathway
Next, we sought to study the molecular mechanisms underlying SPD-delayed senescence. In plants, SPD and ethylene use the same common precursor, S-adenosylmethionine (SAM), for their biosynthesis (Figure 3C). However, these two molecules show opposite effects on the phenology of leaf senescence, with ethylene promoting senescence whereas SPD represses the process (Del Duca et al., 2014). Therefore, we hypothesized that SPD could delay leaf senescence through negatively regulating the ethylene pathway. The magnitude of the ethylene response is directly related to the level of EIN3 (Guo and Ecker, 2004), a primary positive transcription factor of both ethylene response and leaf senescence (Li et al., 2013; Kim et al., 2014). Indeed, we found that the EIN3 protein levels declined in a dose- and time-dependent manner in the transgenic plants 35S:EIN3-GFP/Col-0 upon treatment with SPD (Figure 4A and Supplemental Figure S8A). Interestingly, delayed senescence in SPDS1ox plants was not the result of constitutively altered ethylene production. When measuring ethylene production in WT and SPDS1ox seedlings grown on either MS or ACC medium as well as in mature leaves, no differences between the two genotypes were observed (Supplemental Figure S9), showing that SPD delays developmental leaf senescence mainly by interfering with the ethylene signaling pathway and not due to competition for common precursors. Interestingly, the protein levels of EIN3 were not altered in the transgenic plants 35S:EIN3-GFP/ein3 eil1 ebf1 ebf2 upon treatment with SPD (Figure 4B and Supplemental Figure S8B). EBF1/2 (EIN3-BINDING F BOX PROTEIN 1 and 2) are components of the ethylene signaling pathway, mediating EIN3-targeted degradation via the Ub/proteasome pathway and are themselves degraded upon ethylene perception allowing EIN3 accumulation. Our findings show that EBF1/2 are required for the SPD-induced degradation of EIN3 protein, and moreover, SPD treatment increased the protein levels of EBF1/EBF2 in a dose- and time-dependent manner (Figure 4C and Supplemental Figure S8C), suggesting that SPD decreases EIN3 protein levels by suppression of EBF1/2 protein degradation.
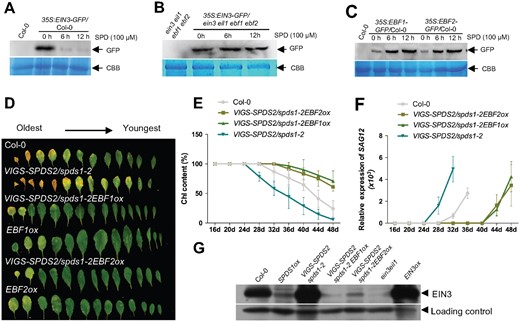
SPD delays leaf senescence via antagonistically regulating ethylene pathway. A, EIN3 protein accumulation in 35S:EIN3-GFP/Col-0 plants upon treatment with SPD. A nonspecific band was used as a loading control in the CBB. B, SPD-induced EIN3 protein degradation depends on EBF1/2. 35S:EIN3-GFP/ein3 eil1 ebf1 ebf2 seedlings treated with SPD were used for protein extraction. C, EBF1/2 protein accumulation in 35S:EBF1/2-GFP/Col-0 plants upon treatment with SPD. D, The senescence phenotype of 45-day-old plants. E, Measurement of the chlorophyll contents. Error bars indicate sd (n = 24). F, RT-qPCR analysis of SAG12 expression. Error bars indicate sd (n = 3). G, Immunoblot assay of EIN3 protein accumulation. EIN3ox and ein3 eil1 were used as the positive and negative controls, respectively.
Overexpression of EBF1/2 extended the time to yellowing of entire rosettes compared with WT (Figure 4D). To test whether EBF1/2 was also capable of repressing the early senescence phenotypes of spds1spds2, we generated triple mutants VIGS-SPDS2/spds1-2EBFox by using the VIGS system. The VIGS-SPDS2/spds1-2EBFox plants exhibited delayed senescence phenotypes compared with WT and VIGS-SPDS2/spds1-2 plants, which was corroborated by higher chlorophyll contents and a delayed induction of SAG12 (Figure 4, D–F). Correspondingly, lower levels of EIN3 protein were detected in VIGS-SPDS2/spds1-2EBFox and SPDS1ox plants (Figure 4G) and the activity of EIN3 protein (indicated by 5xEBS-GUS activity) was also decreased in SPDS1ox plants (Supplemental Figure S10). Together, this supports the hypothesis that the early senescence phenotype of VIGS-SPDS2/spds1-2 is largely caused by EBF1/2-dependent regulation of EIN3 protein levels. In line with this, the early senescence phenotype of VIGS-SPDS2/spds1-2 mutants was also repressed by ein3 eil1 or ein2-5 mutants (Supplemental Figure S11), in which EIN3 protein was barely detected.
Previous studies have highlighted the importance of PIF5, EIN3, and ethylene signaling in a series of coherent feed-forward loops regulating the expression of ORE1 and its targets during senescence (Li et al., 2013; Liebsch and Keech, 2016). Interfering with any component of such a loop, for example SPD interfering with EIN3 accumulation, circumvents an irreversible transition to the senescence program.
In summary, based on our analysis, we propose a model of how metabolic components act in the integration of stress- and age-related factors to modulate the progression of cell death in leaves (Figure 5). In brief, in both WT and stay-green mutants, cells of the IDL rapidly consume their intracellular sugar reserves (Figure 1D and Supplemental Figure S2). Despite their connection to the rest of the plant, which remains illuminated, these cells import only minimal additional sugars (Supplemental Figure S3), suggesting an active gating of the carbohydrate import in this “sink” organ. Genes that are primarily induced in response to substrate deprivation (with functions associated with starvation, BCAA catabolism [Supplemental Figure S4], and lipid degradation [Supplemental Dataset S5]) are not as strongly enhanced in pif5-621 as in IDLs of WT, and even less when compared with another stay-green context (leaves of an entirely darkened WT plant [DP] [Supplemental Figure S6]). This suggests alternative avenues for fueling energy metabolism and a potential repression of this starvation signaling module by the energy status, since energy homeostasis is maintained (Figure 5). The massive accumulation of AAs observed in the functional stay-green context (i.e. pif5-621, ore1-2, and in leaves of entirely DP) (Figure 1D and Supplemental Figures S5C and S6B) results from a dual process: (i) the selective breakdown of proteins, since both the respiratory and photosynthetic machineries are kept functional (Supplemental Figure S1, L and M) and (ii) the non-induction of a set of AA transporters regulated downstream of ORE1 (Figure 1H and Supplemental Figures S5D and S6A). Induction of AA transporters may thus be seen as a key element of a regulatory loop pacing the progression of senescence through the removal of the repressive effect of certain AAs.
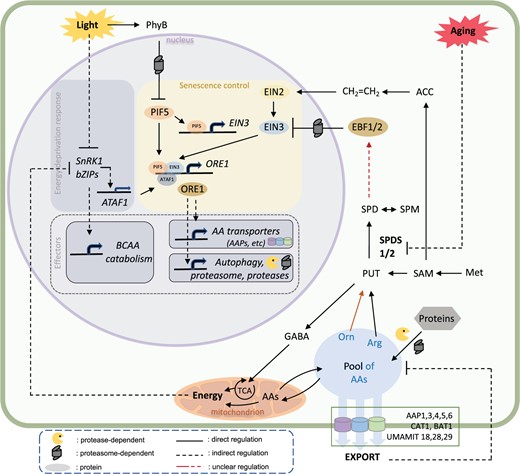
Model summarizing the metabolic regulation of the transcriptional module controlling the induction of leaf senescence in response to light stress and aging. For details, see text. Arg, arginine; Met, methionine; Orn, ornithine, SPM, spermine.
Most interestingly, the two AAs, arginine and ornithine, can strongly delay the progression of leaf senescence via feeding the TCA or the synthesis of PUT/SPD (Figure 2, A and C). Depending on the age of the leaf and the energy demand, PUT can have a bifurcated fate: it can feed energy metabolism via the production of GABA and/or support the biosynthesis of SPD, with the latter metabolic pathway gated by aging (Figure 3, D and E). SPD antagonizes the ethylene signaling cascade by stabilizing the EBF1/2 complex in a dose- and time-dependent manner (Figure 4, A–C and Supplemental Figure S8). Since EBF1/2 were shown to regulate EIN3 protein levels in a proteasome-dependent manner (Guo and Ecker, 2003; Binder et al., 2007), SPD can thus delay the progress of leaf senescence by hindering a component of the ethylene-dependent feed forward loop.
Concluding remarks
In conclusion, this work revealed a molecular feedback loop, gated by aging, in which specific metabolites can modulate both the energy status and an ethylene signaling cascade, thereby influencing the progression of leaf senescence. This molecular mechanism provides the plant with additional control to fine-tune the induction of cell death in leaves, which, if triggered unnecessarily, can impede plant growth and survival. Indeed, premature senescence induction in response to stress can strongly affect crop productivity, a problem exacerbated by the increased frequencies of various stresses due to climate change, which may threaten future food security. Our findings suggest that metabolic aspects like PA metabolism as well as AA utilization and transport are not simply regulated downstream of senescence but are essential for its progression. Intriguingly, our research did not detect a substantial metabolic support from the rest of the plant for the darkened leaf, demonstrating a certain autonomy of the mature organ. Furthermore, the comparison between several stay-green contexts (e.g. mutants versus DPs) also highlights the fact that the fluxes between the different metabolic pathways in the close vicinity of arginine and ornithine may be essential to the regulation of the progression of leaf senescence. Dedicated studies assessing these fluxes, as well as the use and export of the two AAs will have to be carried out to shed light on this point. However, because the progression of senescence is intricately related to the pace of metabolite export, further work aiming at precisely delineating the role, tissue specificity, and redundancy between all AA transporters will be essential. Nonetheless, our data suggest that strategies to specifically repress groups of AA transporters during stress—for example with inducible artificial miRNAs—as well as the modification of PA synthesis pathways may be interesting avenues for achieving stress tolerance through bioengineering approaches.
Finally, while several mechanisms for the action of SPD in plant senescence have been proposed, here we reveal its ability to interfere with the ethylene signaling pathway through the stabilization of the EBF1/2 complex, providing a missing link in our understanding of its mode of action. Even though PAs as cations were reported to interact with nucleic acids, ATP, phospholipids, and certain proteins in mammalian cells (Igarashi and Kashiwagi, 2019), the molecular nature of this stabilization in plants remains enigmatic and will necessitate further dedicated studies.
Materials and methods
Plant material and growth conditions
Arabidopsis (A.thaliana) Col-0 and respective mutant and transgenic lines (for details on genotypes see Supplemental Methods) were grown under controlled conditions (short-day [SD]: 8/16-h light/dark, 22°C/17°C, 150 µmol m−2 s−1 photosynthetic photon flux density [PPFD]; LD: 16/8-h light/dark, 22°C/17°C, 20–150 µmol m−2 s−1 PPFD on soil:perlite mix [3:1]).
EMS mutagenesis screen
The pif5-621 mutant was identified as a very strong “stay-green” mutant in an EMS mutagenesis screen (see Supplemental Methods for details) for leaf senescence delay as described in Keech et al. (2007). Obtained mutant plants were backcrossed three times to WT Col-0 and used for analyses, together with segregating WT (WT seg.). The causal mutation was identified by map-based cloning as described (Jander et al., 2002) and subsequent whole-genome deep-sequencing (SOLiDTM System Sequencing at Uppsala Genome Centre (http://www.igp.uu.se/Serviceverksamhet/Genomcenter/). For details, see Supplemental Methods.
Plasmid construction and generation of transgenic plants
Complementation constructs for PIF5 (pPIF5; PIF5 genomic locus [from −2473 to +2267]) and SPDS1-overexpression constructs (full-length coding sequence of SPDS1) were used for Agrobacterium (Agrobacterium tumefaciens)-mediated transformation of Arabidopsis using floral-dip (Clough and Bent, 1998). Transgenic plants were selected using phosphinothricin or kanamycin, respectively, as described in Harrison et al. (2006). Homozygous plants with one insertion locus were selected based on segregation. For details on primers and cloning strategy, see Supplemental Methods.
TRV-based VIGS assay
pTRV2-SPDS2 was constructed by cloning SPDS2 cDNA fragments into pTRV2. VIGS-SPDS2/spds1-2, VIGS-SPDS2/spds1-2EBF1ox, and VIGS-SPDS2/spds1-2 EBF2ox plants were obtained by silencing SPDS2 in spds1-2, spds1-2EBF1ox, and spds1-2EBF2ox background. VIGS vectors pTRV1 and pTRV2 and the VIGS assay protocol were described previously (Liu et al., 2002).
Assays for age- and dark-induced leaf senescence
IDL assays in SD were as described in Keech et al. (2007). For dark-induced senescence assays of DET, the same leaf stage was cut and placed floating adaxial side up on sterile water in petri dishes in the dark under normal growth conditions. For LD-grown plants, leaf 6 or 7 was covered/detached at about 25 days after sowing. For age-dependent leaf senescence, rosette leaf 4 was assayed for chlorophyll content and SAG12 expression. For dark-induced leaf senescence described in Supplemental Figure S7, leaf 4 from a 4-week-old plant was excised and placed on moisturized filter papers in Petri dishes with adaxial side up and kept in darkness at 22°C for 5 days.
Measurement of chlorophyll content and chlorophyll fluorescence
For IDL and DET treatment, as well as AA feeding (Figure 1 + 2 and Supplemental Figures S1 + S5), leaf discs (Ø 1 cm) from the tip of the leaf blade were frozen in liquid N2. Chlorophyll was extracted from single discs and measured as described in Porra et al. (1989) using a Halo DB-30 Double Beam Spectrophotometer (Dynamica Scientific Ltd., UK). Fv/Fm ratios were determined using a Dual-PAM-100 (Walz, Germany). For age- and dark-induced senescence assays (Figures 3 + 4 and Supplemental Figures S7 and S11), SPAD values (total chlorophyll content) were determined on treated leaves with a portable chlorophyll meter (SPAD-502; Minolta Sensing). Whole leaf values were averaged from readings at eight different sites per leaf.
Protein extraction, quantification, and western blotting
Protein extraction and quantification from leaf discs of IDL-treated leaves was performed as described in Brouwer et al. (2012). For other analyses, plant samples were ground in liquid N2 and soluble protein was extracted by homogenization in 50 mM Tris–HCl (pH 8.0), 10 mM NaCl, 0.1 M PMSF, and 0.1 M DTT, with subsequent centrifugation at 13,000 × g for 30 min at 4°C.
For GFP-EBF1/2 and GFP-EIN3 immunoblots, 5-day-old seedlings grown on MS medium under LD were transferred to a petri dish with deionized water without (mock) or with 10 µM SPD for 6 h or 12 h. Total protein extracts were subjected to immunoblots with anti-GFP (Upstate), using a nonspecific band of the Coomassie Brilliant Blue (CBB) stained gel as loading control.
Measurement of ethylene production
Ten 5-day-old seedlings of Col-0 and SPDS1oxplants were sealed in a 10-mL vial containing 1 mL liquid MS medium with 0.5% v/v DMSO (mock) or 10 μM ACC for 24 h. Ethylene levels in the headspace were determined by gas chromatography (Agilent 6890NGC, Agilent Technologies, USA). The area of the ethylene peak was integrated with Agilent Chemstation and values are normalized to levels in mock-treated Col-0 (=100%).
Transmission electron microscopy
Transmission electron microscopy was performed as described in Chrobok et al. (2016) using leaf pieces of approximately 2 mm2 from three biological replicates per treatment (corresponding to 0, or 6 days in darkness, or to 24 h in light following 6 days in darkness).
RNA extraction and RT-qPCR
Total RNA from ground whole leaf blades was extracted using the E.Z.N.A Plant RNA Kit (Omega Bio-Tek, VWR) or TRIzol reagent. DNase treatment of total RNA was performed by DNaseI (Invitrogen, Thermo-Fischer) followed by reverse transcription using 1 μg RNA with the RevertAid First Strand cDNA Synthesis Kit (Thermo Fischer Scientific, USA) or MMLV reverse transcriptase (Promega), according to the manufacturer’s instructions. Transcript levels were analyzed via reverse transcription quantitative PCR (RT-qPCR), using LightCycler480 SYBR Green I Master mix (Roche) and the LightCycler 480. Data were analyzed using LightCycler 480 Software Release1.5.0. Relative gene expressions was calculated according to Pfaffl (2001) or the 2−ΔΔCT method. Primer efficiency was determined using a standard curve of a mixture of cDNAs. TIP41 and Hrd1a (Czechowski et al., 2005), or ACT2 were used as reference genes. Primers are listed in Supplemental Table S1. For each time point, at least three biological replicates were analyzed. Statistical difference was assessed using Student’s t test.
Photosynthetic and respiration measurements
Photosynthetic rate at 250 μmol m−2 s−1 (A250) and dark respiration by CO2 release or oxygen consumption (Rd) were determined as described in Brouwer et al. (2012, 2014).
Microarray analysis
Leaf samples harvested together as previously described in Law et al. (2018) at noon, at 0 days (light/T0), and after 1, 3, and 6 days of individual darkening treatment for both WT and pif5-621, and at 12 days for pif5-621 with three biological replicates (or 2 for T12) corresponding to a pool of two leaves from independent plants. About 40 mg of frozen material was used for RNA isolation (RNAeasy kit QIAGEN [Hilden, Germany]) followed by DNase treatment (DNA-free TM; Ambion, Austin, TX, USA). RNA concentrations were determined using a ND-2000 spectrophotometer (NanoDrop Technologies, Inc, Wilmington, DE, USA) and RNA quality was assessed using an Agilent 2100 BioAnalyser 2100 and RNA 6000 Nano kits (Agilent, Santa Clara, CA, USA). Microarrays were performed by the NASCArrays (www.http//affymetrix.arabidopsis.info/) using the Arabidopsis Gene 1.1 ST Array Strip technology from Affymetrix (www.affymetrix.com). Data processing and expression analysis was performed essentially as in Law et al. (2018). For details, see Supplemental Methods. CEL files have been deposited to Gene Expression Omnibus at the National Center for Biotechnology Information under accession number GSE158053.
Gene Network Inference was performed using guide genes coding for differentially regulated transporters (Figure 1H), to retrieve their 50 top first-degree neighbors using the seidr (Schiffthaler et al., 2018) neighbors’ function, which were further analyzed and visualized using the Cytoscape software platform (Shannon et al., 2003). For details, see Supplemental Methods.
Promoter analysis
Based on previously described binding site for ORE1 (Matallana-Ramirez et al., 2013): (VMGTR(N)5-6YACR; (V: A,C,G; M: C,A; R:A,G; Y: C,T)) the genomic regions (incl. 3 kb upstream of the ATG and 500 bp downstream of the STOP codon) of the top 25 differentially expressed genes encoding senescence-dependent AA transporters as well as the top 25 non-differentially regulated AA transporter genes were scanned for matches using PatMatch and manual correction of UTR annotation, and determined potential ORE1 targets as assigned from previously reported DAP-seq data (O’Malley et al., 2016).
HC for metabolomics
The relative abundance of metabolites was obtained by normalizing the abundance value to their maximum, in this case set to 1. HC was performed using the Multi-experiment Viewer (MeV; version 4.8.1) (Saeed et al., 2003) with the following parameters: average linkage, leaf order optimization for metabolites, and Euclidean distance.
Metabolite analysis
General metabolite, PA, and adenylate analysis
Leaf blades from the indicated stages were harvested, immediately frozen in liquid N2, and ground to fine powder using a mortar. For general whole-metabolome analysis, extraction, derivatization, and gas chromatography-time of flight-mass spectrometry (GC-ToF-MS) were performed as described in Chrobok et al. (2016). Adenylate and PA content were determined by LC-MS analysis as described in detail in Supplemental Methods and Supplemental Table S2.
C13 labeling in close custom-made cabinet
Experimental setup (Law et al., 2018) and detection (Lindén et al., 2016) have been previously described (for details, see Supplemental Figure S3A and Supplemental Methods).
C13 feeding in leaf discs
13C-labeled arginine and ornithine (all carbons labeled) were fed at 1 mM to leaf discs of Arabidopsis plants that were beforehand entirely darkened for 3 days. After another 3 days in darkness, that is 6 days in total, the relative content of 12C and 13C metabolites of interest in those leaf discs was quantified by LC-MS.
Starch content determination
Leaves were harvested, clarified by boiling in 80% v/v ethanol, washed twice with MilliQ water, stained for 10 min with one-fourth concentrated Lugol Solution rinsed twice with MilliQ water and photographed. For enzymatic starch determination, ethanol extraction based on Smith and Zeeman (2006) from 20 mg (fresh weight) leaf material was performed. After a digestion in 50 mM sodium acetate buffer, with 0.45 U α-amyloglucosidase and 0.5 U α-amylase overnight at 37°C, starch content was determined by quantifying glucose with hexokinase/glucose-6-phosphate dehydrogenase-based spectrophotometric assay.
Accession numbers
Identifiers for genes used in this study can be found in Supplemental Table S3.
Supplemental data
Supplemental Dataset S1. Relative abundance of identified metabolites by GC-ToF-MS for WT-Col-0 and pif5-621 in light and during IDL treatment at 0, 1, 3, 6, and 9 days for four independent biological replicates.
Supplemental Dataset S2. Pools and 13C detection for the relative abundance of identified metabolites in WT-Col-0 and pif5-621 subjected to the labeling experiment to determine putative import of metabolites in IDL.
Supplemental Dataset S3. Genes differentially regulated between pif5-621 and WT during the IDL time course.
Supplemental Dataset S4. HC analysis (Pearson distance).
Supplemental Dataset S5. Gene expression profiles, normalized to the maximum expression per gene, for all functional categories mentioned in the text.
Supplemental Dataset S6. AA transporters and motif occurrence for ORE1.
Supplemental Figure S1. Molecular and physiological characterization of pif5-621.
Supplemental Figure S2. Level of adenylates and starch content in WT and pif5-621 mutant during IDL.
Supplementary Figure S3.13CO2 labeling of illuminated (light) and darkened (IDL) leaves from WT and pif5-621 after 2 or 5 days darkening treatment.
Supplemental Figure S4. Transcriptome analysis in WT and pif5-621 leaves under light and darkening treatment.
Supplemental Figure S5. Metabolic characterization of the stay-green mutant ore1.
Supplemental Figure S6. Analysis of gene expression and metabolite content in leaves of an entirely DP.
Supplemental Figure S7. Molecular characterization of spds1-2, spds2-2, VIGS-SPDS2/spds1-2, and SPDS1ox mutants.
Supplemental Figure S8. SPD-induced EIN3 protein degradation by promoting EBF1/2 protein accumulation.
Supplemental Figure S9. Over-expression of SPDS1 does not affect ethylene production.
Supplemental Figure S10. Increasing endogenous SPD decreases the activity of EIN3 protein.
Supplemental Figure S11. The early senescence phenotypes of VIGS-SPDS2/spds1-2 mutant are suppressed by ein3 eil1 or ein2-5.
Supplemental Table S1. Oligonucleotide primers used in this study.
Supplemental Table S2. Retention times (rt), MRM-transition stages monitored (precursor ion and product ions), and collision energies of analyzed compounds.
Supplemental Table S3. Accession numbers for genes mentioned in this study.
Supplemental Materials and Methods.
Acknowledgments
The authors gratefully acknowledge Dr. Thomas Dobrenel for help with metabolomics data analysis and helpful discussions, Dr. Sacha Escamez for providing ore1-2 and SAIL_694_C04 seeds, and Nottingham Arabidopsis Stock Centre (NASC) for seeds of pif5-3 and Dr. Tony Karlsborn for his valuable assistance during adenylates determination. Swedish Metabolomics Centre, Umeå, Sweden (www.swedishmetabolomicscentre.se) is acknowledged for PA and targeted metabolite quantification by LC-MS/MS.
Funding
This work is financially supported by the Swedish research council “VetenskapsRådet” (grant no. 621-2014-4688) as well as by the Kempe Foundations (Gunnar Öquist Fellowship), the Carl Tryggers Stiftelse (CTS14-247 and CTS15-262) and TC4F to O.K. and by the National Natural Science Foundation of China (31970196 to Z.L.; 31570286 to H.G.; and 31900173 to H.W.), Shenzhen Science and Technology Program (grant no. KQTD20190929173906742 to H.G.), and the National Key Research and Development Program of China (grant no. 2019YFA0903904 to H.G.). UPSC is supported by grants from the Knut and Alice Wallenberg Foundation (KAW 2016.0341 and 2016.0352) and the Swedish Governmental Agency for Innovation Systems (VINNOVA; 2016-00504).
Data Availability
All data are provided along with the manuscript and its supplemental material.
Conflict of interest statement. None declared.
D.L., M.J., Z.L., H.-L.W., A.Z., D.C., C.B., X.W., H.J., B.B., P.L., and O.K. carried out the experimental work and analyzed the data. D.L., S.R.L., N.D., H.S., and O.K. carried out the bioinformatics. D.L., M.J., T.M., P.G., H.G., and O.K. conceptualized the project. H.G. and O.K. supervised the project. D.L., Z.L., H.G., and O.K. wrote the manuscript which was read, edited, and approved by all authors.
The author responsible for distribution of materials integral to the findings presented in this article in accordance with the policy described in the Instructions for Authors (https://dbpia.nl.go.kr/plphys/pages/General-Instructions) is: Olivier Keech ([email protected]).
References
Author notes
These authors contributed equally (D.L., M.J., and Z.L.)
Present address for Daniela Liebsch: Instituto de Biología Molecular y Celular de Rosario, IBR-CONICET, Ocampo y Esmeralda s/n, 2000 Rosario, Argentina.
Present address for Bastiaan Brouwer: Wageningen Food and Biobased Research, Wageningen Campus, P.O. Box 17, 6700 AA Wageningen, The Netherlands.
Senior authors
