


Dear Editor,
Soybean (Glycine max (Linn.) Merr.) is one of the most important economic crops in the world. So far, massive soybean RNA-seq and small RNA-seq (sRNA-seq) data are publicly available, which is very beneficial for studying gene expression regulation and expression relationships among genes and non-coding RNAs (ncRNAs). ncRNAs, such as microRNAs (miRNAs), long ncRNAs (lncRNAs), and phased secondary small interfering RNA (phasiRNAs), are important regulators modulating gene expression (Aukerman and Sakai, 2003; D'Ario et al., 2017; Yu et al., 2019). Meanwhile, the ncRNAs usually coordinate with other gene expression regulators, such as transcription factors (TFs) and RNA-binding proteins (RBPs), to form regulatory networks to regulate gene expression (Wang et al., 2017; Yu et al., 2019). There are many soybean molecular biology databases, such as Soybase (Brown et al., 2021), Soybean Genome Database (Shultz et al., 2006), and Soybean knowledge base (Joshi et al., 2014). However, these databases either do not involve ncRNAs or only provide the sequence annotations of ncRNAs. There are also some plant ncRNA databases, such as Plant Non-coding RNA Database (PNRD) (Yi et al., 2015) and Plant Long noncoding RNA Database (PLncDB) (Jin et al., 2021), but they still focus on sequence annotations.
Here, we report a soybean ncRNA database, SoyNcRNAExp (Figure 1A), a soybean ncRNA expression and co-expression resource based on 1,263 RNA-seq libraries, and 333 sRNA-seq libraries (Supplemental Tables S1 and S2). SoyNcRNAExp hosts 4,179 lncRNAs, 1,245 miRNAs, 12,970 phasiRNAs, and 451 phasiRNA-encoding genes (PHAS genes) (Supplemental Table S3). Besides, 3,747 TFs and 135 RBPs (Supplemental Table S3) were also collected to expand ncRNA-centered co-expression networks. By calculating the expression profiles of ncRNAs and protein-coding genes, we generated four major functionalities in SoyNcRNAExp: ncRNA expression, ncRNA differential expression, ncRNA mining, and ncRNA co-expression (Figure 1B).
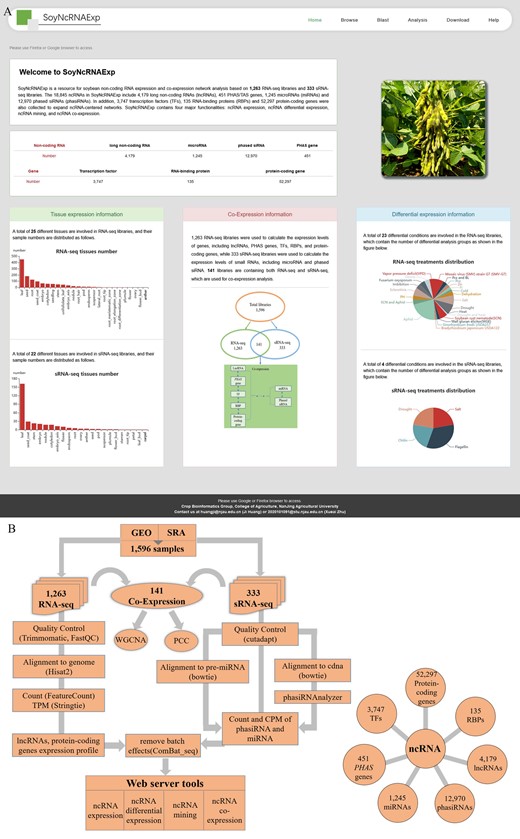
SoyNcRNAExp overview and data analysis workflow. A, Database main page. B, Data analysis workflow. We downloaded and processed the raw sequencing data with a unified pipeline to obtain transcript expression values. The featureCounts and stringtie were employed to calculate the expression count and TPM for long ncRNAs, PHAS genes, and protein-coding genes. The CPM was calculated for miRNAs and phasiRNAs. Combat-seq of the Sva package was employed for batch effect processing. The processed data were imported into SoyNcRNAExp to build four functionalities of ncRNA expression, ncRNA differential expression, ncRNA mining, and ncRNA co-expression. GEO, Gene Expression Omnibus; SRA, Sequence Read Archive.
ncRNA expression
We followed a unified pipeline to calculate transcripts per million reads (TPM) and counts per million (CPM) to represent expression levels of lncRNAs, TFs, RBPs, PHAS genes, and protein-coding genes, as well as miRNAs and phasiRNAs, respectively (Figure 1B). If the TPM or CPM of a certain ncRNA in all samples is 0, this ncRNA is defined as unexpressed and filtered. After filtering, only all RBPs and PHAS genes are retained (Supplemental Figure S1). In SoyNcRNAExp, unexpressed ncRNAs are not included in expression analysis, but their basic information is provided on the Browse page. RNA-seq libraries and sRNA-seq libraries involve 25 and 22 tissues, respectively (Supplemental Figure S2). SoyNcRNAExp provides a forward search for the expression of a certain ncRNA in all tissues and a reverse search for the expression of all ncRNAs in a certain tissue.
ncRNA differential expression
For RNA-seq and sRNA-seq libraries, SoyNcRNAExp collects 23 and 4 differential expression conditions, respectively. In differential expression analysis, each treatment and control must contain two or more biological replicates. SoyNcRNAExp employs featureCounts version 1.6.4 (Liao et al., 2014) to calculate the counts of ncRNAs and uses the raw read counts for differential expression analysis by DESeq2 version 1.24.0 (Love et al., 2014). Finally, the log2(fold change) and false discovery rate (FDR) of all ncRNAs expressed under different stress conditions are calculated. A differentially expressed ncRNA is defined when the log2 (fold change) is greater than or equal to 1 and the FDR is less than or equal to 0.05.
ncRNA mining
SoyNcRNAExp uses the tau algorithm to estimate the τ-value in the analysis of whether ncRNAs are tissue-specifically expressed (Yanai et al., 2005). Tau algorithm is an ideal way to estimate the tissue-specifically expressed transcripts compared to other methods (Kryuchkova-Mostacci and Robinson-Rechavi, 2017) and has been widely used in previous studies (Smeds et al., 2015; Zhao et al., 2015). The τ-value varies between 0 and 1, with 0 indicating ubiquitous expression and 1 indicating specific expression. The tissues with fewer than five libraries and the ncRNAs with maximal expression value of ≤5 in all tissues are removed in the analysis (Supplemental Figure S2). We defined ncRNAs with the τ-value >0.8 as tissue-specifically expressed ncRNAs (Supplemental Table S4). Tissue-specifically expressed phasiRNAs accounted for the largest proportion (∼92%) of all analyzed phasiRNAs, implying the important roles of phasiRNAs in the growth and development of soybean-specific tissues (Supplemental Figure S1).
ncRNA co-expression
The libraries for co-expression analysis are from 141 RNA-seq and sRNA-seq libraries from the same experiments. Among them, 21 representative samples were selected by removing the repetitions in the co-expression analysis. The 141 and 21 samples are both provided for selection for co-expression analysis. SoyNcRNAExp provides two co-expression analysis methods: Pearson correlation coefficient (PCC) and weighted correlation network analysis (WGCNA) version 1.70 (Langfelder and Horvath, 2008). Besides the PCC-based expression curve and network construction functions, we use the blockwiseModules function in WGCNA to construct the co-expression networks in one step, where the parameter setting power is 10 and TOMType is unsigned. In SoyNcRNAExp, the users can obtain all WGCNA-based co-expression modules and networks of ncRNAs.
Availability of SoyNcRNAExp
SoyNcRNAExp is freely available at https://cbi.njau.edu.cn/SoyNcRNAExp (Figure 1A). The users can browse ncRNAs list on the Browse page and get a general understanding of the ncRNA expression scale, based on the expression capacity, and also reach the ncRNAs by sequence alignment on the Blast page.
On the Analysis page, SoyNcRNAExp provides four major functionalities. ncRNA Expression function includes two subfunctions of Tissue-Specific Expression and Anatomy (Figure 2A). Tissue-Specific Expression subfunction presents a boxplot of the expression of a query ncRNA in all available soybean tissues. Anatomy subfunction allows the users to query the expression of ncRNAs in a specific soybean tissue. ncRNA Differential Expression function contains two subfunctions: Condition-specific expression and Perturbations (Figure 2B). Condition-specific expression is to query the expression of a specific ncRNA under various conditions, and positive and negative bar graphs are used to clearly show the upregulation and downregulation. Perturbations subfunction is to query ncRNAs that are differentially expressed under certain conditions. ncRNA Mining function is to query tissue-specifically expressed ncRNAs by measuring τ-value (Figure 2C). Through ncRNA Mining function, the users can select a tissue and customize the τ-value and expression threshold to identify the tissue-specifically expressed ncRNAs. ncRNA Co-expression has three subfunctions: PCC Curve, PCC Network, and WGCNA Network (Figure 2D). In the PCC Curve subfunction, the users can customize the PCC threshold and correlation type (positive or negative) to identify co-expressed ncRNAs or protein-coding genes and obtain the expression curves. In the PCC Network subfunction, the users can acquire a PCC-based co-expression network graph by settings of the number of layers, PCC threshold, correlation type, and the maximum of nodes. In the WGCNA Network subfunction, the users input a specific ncRNA, and all modules related to it can be displayed.
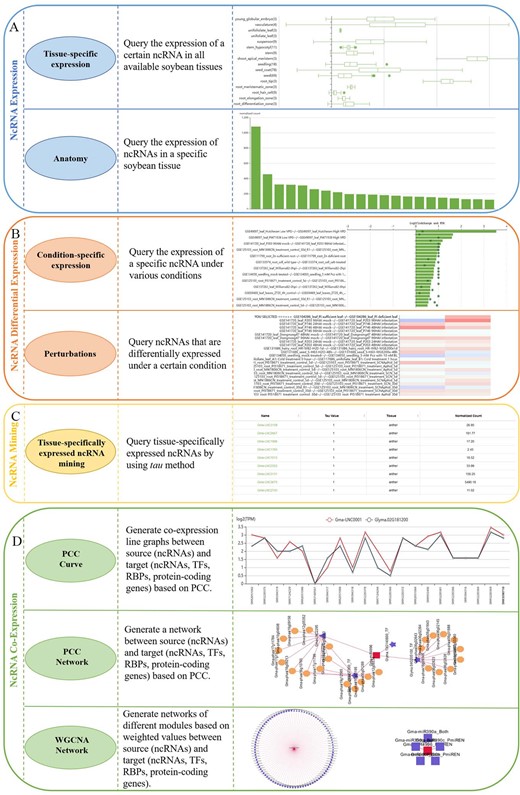
SoyNcRNAExp functionalities. A, ncRNA Expression function with two sub-functions of Tissue-specific expression and Anatomy. B, Differential Expression function containing two sub-functions of Condition-specific expression and Perturbations. C, ncRNA Mining function to mine tissue-specifically expressed ncRNAs by τ-value. D, ncRNA Co-expression with three sub-functions, PCC Curve, PCC Network, and WGCNA Network.
SoyNcRNAExp is a comprehensive, experiment-supported, soybean ncRNA expression and co-expression database, and may substantially accelerate the discovery and functional analysis of soybean ncRNAs for the soybean research community.
Supplemental data
The following materials are available in the online version of this article.
Supplemental Figure S1. Bar chart for the numbers of ncRNAs, expressed ncRNAs, ncRNAs with expression five or more, and tissue-specifically expressed ncRNAs.
Supplemental Figure S2. Histogram of the sample number distribution for various soybean tissues.
Supplemental Table S1. The information of 1,263 RNA-seq libraries.
Supplemental Table S2. The information of 333 sRNA-seq libraries.
Supplemental Table S3. The information of the source for all genes and ncRNAs.
Supplemental Table S4. The information of tissue-specifically expressed ncRNAs.
Acknowledgments
We are grateful for the public resources and their authors for providing soybean RNA-seq and sRNA-seq libraries used in SoyNcRNAExp. We also thank Prof. Yufeng Wu from the Center for Bioinformatics and the Information Center of Nanjing Agricultural University for their assistance in data storage and web maintenance.
Funding
This work was supported by the Fundamental Research Funds for the Central Universities, Nanjing Agricultural University Student Innovation and Entrepreneurship Training Program (S20190003), Cyrus Tang Innovation Center for Crop Seed Industry, and the Jiangsu Collaborative Innovation Center for Modern Crop Production.
Conflict of interest statement. None declared.
J.H. and F.H. conceived the original research plan. X.Z., B.Z., and F.G. collected, processed, and analyzed RNA-seq and sRNA-seq data. B.Z. and X.Z. built the database and website. X.Z. and J.H. wrote the manuscript. J.H., F.H., and H.Z. supervised this work.
The author responsible for distribution of materials integral to the findings presented in this article in accordance with the policy described in the Instructions for Authors (https://dbpia.nl.go.kr/plphys/pages/general-instructions) is: Ji Huang ([email protected]).
References
Author notes
These authors contributed equally (X.Z. and B.Z.).
Senior author
