


Abstract
Rhizobium–legume nitrogen-fixing symbiosis involves the formation of a specific organ, the root nodule, which provides bacteria with the proper cellular environment for atmospheric nitrogen fixation. Coordinated differentiation of plant and bacterial cells is an essential step of nodule development, for which few transcriptional regulators have been characterized. Medicago truncatula ETHYLENE RESPONSE FACTOR REQUIRED FOR NODULE DIFFERENTIATION (MtEFD) encodes an APETALA2/ETHYLENE RESPONSIVE FACTOR (ERF) transcription factor, the mutation of which leads to both hypernodulation and severe defects in nodule development. MtEFD positively controls a negative regulator of cytokinin signaling, the RESPONSE REGULATOR 4 (MtRR4) gene. Here we showed that that the Mtefd-1 mutation affects both plant and bacterial endoreduplication in nodules, as well as the expression of hundreds of genes in young and mature nodules, upstream of known regulators of symbiotic differentiation. MtRR4 expressed with the MtEFD promoter complemented Mtefd-1 hypernodulation but not the nodule differentiation phenotype. Unexpectedly, a nonlegume homolog of MtEFD, AtERF003 in Arabidopsis (Arabidopsis thaliana), could efficiently complement both phenotypes of Mtefd-1, in contrast to the MtEFD paralog MtEFD2 expressed in the root and nodule meristematic zone. A domain swap experiment showed that MtEFD2 differs from MtEFD by its C-terminal fraction outside the DNA binding domain. Furthermore, clustered regularly interspaced short palindromic repeats-CRISPR associated protein 9 (CRISPR-Cas9) mutagenesis of MtEFD2 led to a reduction in the number of nodules formed in Mtefd-1, with downregulation of a set of genes, including notably NUCLEAR FACTOR-YA1 (MtNF-YA1) and MtNF-YB16, which are essential for nodule meristem establishment. We, therefore, conclude that nitrogen-fixing symbiosis recruited two proteins originally expressed in roots, MtEFD and MtEFD2, with distinct functions and neofunctionalization processes for each of them.
Introduction
The rhizobium–legume symbiosis provides agro-ecosystems with considerable amounts of assimilable nitrogen (N), a critical factor for plant growth, thanks to the capacity of the bacterial nitrogenase to fix atmospheric nitrogen. The symbiotic N fixation (SNF) takes place in dedicated root organs, called nodules that provide rhizobia with carbon sources and a micro-oxic environment, essential for the nitrogenase to be functional. Nodules can be of indeterminate (e.g. in pea (Pisum sativum) and Medicago sp.) or determinate (e.g. in soybean (Glycine max) and Lotus sp.) type, that is, with or without a permanent (apical) meristem, respectively. Two main steps can be distinguished in nodule organogenesis: the first one is nodule inception in root tissues, which follows a signaling process triggered by the perception by the plant of specific rhizobial chito-oligosaccharidic molecules, the Nod factors. This leads to cell divisions in the root cortex and rhizobial infections in the root epidermis. Both processes involve a series of symbiotic transcription factors (TFs), with NODULE INCEPTION (NIN) as a master regulator (Schauser et al., 1999; Marsh et al., 2007), as well as phytohormones, among which cytokinins (CKs) and auxins are major players (Lin et al., 2020). CK signaling in the root cortex leads to NIN induction, itself activating NF-Y and LATERAL ORGAN BOUNDARIES-DOMAIN PROTEIN 16 (LBD16) TF expression, contributing to local auxin accumulation and consequently cell division (Schiessl et al., 2019; Soyano et al., 2019). LBD16 being also involved in lateral root organogenesis, this reveals an important overlap between the genetic programs, respectively, leading to nodule and lateral root inception, also evidenced by the importance of the SHORTROOT–SCARECROW module in both developmental programs (Dong et al., 2021). The second step is cell differentiation associated with nodule development, which allows symbiotic traits to be acquired by plant and bacterial cells. At this stage, a large number of genes are strongly and specifically upregulated in developing nodules compared to the roots (Mergaert et al., 2020). In Medicago truncatula, the symbiotic differentiation process first takes place in cells generated by divisions of inner (C4–C5) root cortical cells in the nodule primordium, and later in cells produced by an apical nodule meristem established from the C3 cortical cell layer (Xiao et al., 2014).
The meristematic region of a M. truncatula nodule, termed Zone I (ZI), involves distinct division centers, associated with peripheral vascular bundles (VBs) and central tissues, respectively. The nodule vasculature is ontologically related to roots, based on the ontogeny of the VB meristems and the expression of key regulators of the root meristem (WUSCHEL-RELATED HOMEOBOX5 [MtWOX5] and PLETHORA 1 [PLT1] and PLT2 TFs) (Osipova et al., 2012; Franssen et al., 2015; Magne et al., 2018). Two genes, with distinct but overlapping expression profiles in the nodule meristem, are essential to regulate the meristematic subdomains and control nodule identity: MtNODULE ROOT 1 (MtNOOT1) and MtNOOT2 (Couzigou et al., 2012; Magne et al., 2018). An Mtnoot1 Mtnoot2 double mutant shows a complete nodule to root conversion, with ectopic roots developing from VB meristems.
The symbiotic differentiation of indeterminate nodules involves cells generated by the central nodule meristem, along a longitudinal gradient from apical to proximal nodule zones. Once meristematic cells exit the division cycles in the sub-meristematic zone (termed distal ZII), they rapidly enlarge and begin to endoreduplicate. This endoreduplication is controlled by MtCCS52A, a cell cycle switch gene activated at the final stage of nodule primordium formation (Vinardell et al., 2003). Knocked down lines of MtCCS52A exhibit a reduction of the endoreduplication level (predominantly 8C, versus 32C nuclei in control nodules) and produce small fix− nodules, thereby demonstrating the importance of endoreduplication for nodule development. MtCCS52A is expressed in the whole nodule ZII (or infection zone) (Vinardell et al., 2003; Roux et al., 2014), where rhizobia are released from infection threads (tubular structures of plant origin). Rhizobia are surrounded by a plant membrane showing specific identity markers (Limpens et al., 2009), thereby forming the so-called symbiosome. In the same time, hundreds of plant genes are massively upregulated in successive waves (Maunoury et al., 2010; Roux et al., 2014; Pecrix et al., 2018). This allows the cell environment required for SNF to be gradually set up, leading to the formation of the interzone II-III (IZ) and nitrogen-fixing ZIII.
A hallmark of nodule differentiation is the accumulation of leghemoglobin, essential to keep a low free oxygen concentration while maintaining respiration. Differentiation also involves the upregulation of various transporters and important modifications of the cytoskeleton organization and membrane trafficking in the plant cell (e.g. Gavrin et al., 2014; Zhang et al., 2019). A C2H2 TF termed REGULATOR OF SYMBIOTIC DIFFERENTIATION (RSD) is thought to promote symbiosome development by regulating the plant secretory pathway (Sinharoy et al., 2013). Furthermore, in Medicago and other legumes of the Inverted Repeat Lacking Clade, a gene family strongly upregulated in the infection/differentiation zones encodes the so-called Nodule-specific Cysteine-Rich peptides (NCRs; Pan and Wang, 2017; Mergaert, 2018; Stonoha-Arther and Wang, 2018), processed and targeted to the symbiosomes by a signal peptidase complex (SPC) including DOES NOT FIX NITROGEN 1 (DNF1; Wang et al., 2010). More than 600 NCR genes have been identified in M. truncatula (de Bang et al., 2017; Montiel et al., 2017). While the role of most of them remains elusive, several have been demonstrated to be essential factors of bacteroid differentiation and/or survival (Van de Velde et al., 2010; Farkas et al., 2014; Horváth et al., 2015; Kim et al., 2015). Interestingly, the DNF1 SPC was recently shown to process NIN, to produce a smaller NIN form that controls late nodule development and numerous associated genes (Feng et al., 2021).
As with plant cells, rhizobia undergo several rounds of endoreduplication, along with strong morphological changes and modifications in gene expression triggered by the micro-oxic environment and NCR peptides, resulting in terminally differentiated bacteroids. Importantly, in spite of their presence in huge numbers within plant cells, rhizobia do not trigger plant immune responses, unless the interaction is impaired by mutations. Thus, several fix−M. truncatula mutants exhibit defense reactions which affect the maintenance of rhizobia: dnf2, nodules with activated defense 1 (nad1), symbiotic cys-rich receptor kinase (symcrk), nodule-specific Plat-domain 1 (npd1) or npd1, 2, 3, 4, and 5 (Bourcy et al., 2013; Berrabah et al., 2015; Wang et al., 2016; Yu et al., 2018; Pislariu et al., 2019).
Not many transcriptional regulators controlling symbiotic differentiation per se have been demonstrated in M. truncatula, besides MtRSD and MtNIN. MtNF-YA1, MtNOOT1, and MtNOOT2 are essential for the establishment and the maintenance of the central nodule meristem, respectively, but their mutation does not prevent the symbiotic differentiation (Couzigou et al., 2012; Xiao et al., 2014; Magne et al., 2018). Not considering TFs expressed in nodule VBs, three TFs appear to be more directly involved in nodule differentiation/development. ETHYLENE RESPONSE FACTOR INVOLVED IN NODULE DIFFERENTIATION (MtEFD) is expressed in ZII (Vernié et al., 2008), under the direct or indirect control of INTERACTING PROTEIN OF DMI3 (IPD3) transcriptional regulator (Ovchinnikova et al., 2011). The two others are NIN (Feng et al., 2021; Liu et al., 2021) and MtNLP2, a NIN-like protein expressed in the IZ and the ZIII, where it notably controls the expression of leghemoglobins, together with NIN (Jiang et al., 2021). Furthermore, epigenetic regulators are also important, likely by modulating the access of TFs to chromatin regions. Thus a knocked down mutant of DEMETER (DME), a DNA demethylase strongly upregulated in proximal ZII and IZ, is fix− and impaired in nodule differentiation (Satgé et al., 2016). In addition, gene expression in the nodule differentiation zone often coincides with reduced levels of repressive histone marks (e.g. H3K27me3) and increased levels of active histone marks (H3K9ac; Nagymihaly et al., 2017; Pecrix et al., 2018).
MtEFD belongs to the large family of APETALA2/ETHYLENE RESPONSIVE FACTOR (AP2/ERF) TFs, more specifically the group V, as ERF REQUIRED FOR NODULATION 1 (MtERN1) and MtERN2, two key regulators of NF signaling, nodule inception, and rhizobium infection (Andriankaja et al., 2007; Middleton et al., 2007; Cerri et al., 2016). MtEFD, however, differs from MtERN1 and MtERN2, both in its AP2/ERF DNA -binding domain and in its expression profile, since MtEFD is neither induced by NF nor associated with infection threads, in contrast to MtERN1 and MtERN2 (Vernié et al., 2008). Mtefd-1, a deletion mutant of MtEFD, is fix− and exhibits strong alterations in the nodules ZII and III (Vernié et al., 2008). In addition, Mtefd-1 exhibits a hypernodulation phenotype and frequent multilobed nodules. Transcriptomic analyses supported by a transactivation assay indicated that MtEFD positively controls a negative regulator of the CK pathway, the type A response regulator MtRR4 gene. Because CKs play a key role in nodule inception, it was hypothesized that the downregulation of MtRR4 might explain the hypernodulation phenotype of Mtefd-1. It was also speculated that MtEFD might regulate a gradient of CK activity within the nodule and thereby impact nodule differentiation (Vernié et al., 2008). The importance of CKs for nodule development/differentiation has later been established by the nodule phenotype of a Mtcre1/chk1 CK receptor mutant, which exhibits multiple lobes and incomplete differentiation (Plet et al., 2011). A multilobed nodule phenotype corresponding with a decreased MtEFD and MtRR4 expression was also observed in M. truncatula roots where three KNOX homeodomain TF genes, termed MtKNAT3/4/5-like (or MtKNOX3, MtKNOX5, and MtKNOX9), were simultaneously knocked down (Di Giacomo et al., 2017). These TFs, expressed in nodule primordia and different nodule zones, belong to a KNOX homeodomain subclass promoting the differentiation of aerial organs in Arabidopsis (Arabidopsis thaliana).
Here we revisited the impact of the Mtefd-1 mutation on nodule development, with analyses of the endoreduplication levels and affected genes, notably MtRR4. We also investigated MtEFD evolution, by testing the capacity of a close MtEFD paralog, MtEFD2, and of the A. thaliana EFD ortholog, AtERF003, to complement the Mtefd-1 mutation. Finally, we assessed whether MtEFD and MtEFD2, which exhibit distinct but overlapping expression profiles, could both be involved in the control of nodulation.
Results
The Mtefd-1 mutant exhibits an endoreduplication phenotype
To further investigate the impact of the Mtefd-1 mutation on nodule differentiation, we analyzed nodule endoreduplication. In wild-type (wt) 13-day-old nodules, the DNA content of plant cells ranged from 2C to 64C (five cycles of endoreduplication), with 32C and 64C nuclei representing on average 9.4% and 0.35% of total nuclei, respectively (in attapulgite growth condition; Supplemental Table S1). In Mtefd-1 nodules, the relative abundance of 32C and 64C nuclei was strongly decreased (0.8% and 0.08% of the population on average, respectively), whereas the frequency of 16C nuclei was not statistically different from wt (3.5% versus 4.2%; Figure 1A; Supplemental Table S1). This was observed in different growth conditions (aeroponic or attapulgite condition) and at different time points, from 13- to 30-day postinoculation (dpi; Supplemental Table S1), therefore ruling out a mere delay of endoreduplication. This phenotype differed from the one observed with five other fix−M. truncatula mutants, namely TR3, TR36, TRV36, TR183, and TRV43 (Maunoury et al., 2010), for which corresponding genes have not yet been identified, except for TR3, allelic to ipd3 (Ovchinnikova et al., 2011). These five mutants showed either a low proportion (TRV36 and TRV43) or a total absence (TR3, TR183, and TR36) of both 16C and 32C cells (Figure 1, C–F; Supplemental Table S1), as previously reported (Maunoury et al., 2010). While the rsd-1 (Sinharoy et al., 2013) and dme (Satgé et al., 2016) fix− mutants are also affected in the level of both 16C and 32C cells, Mtefd-1 appears to be a plant fix− mutant specifically affected at the 16C–32C transition.
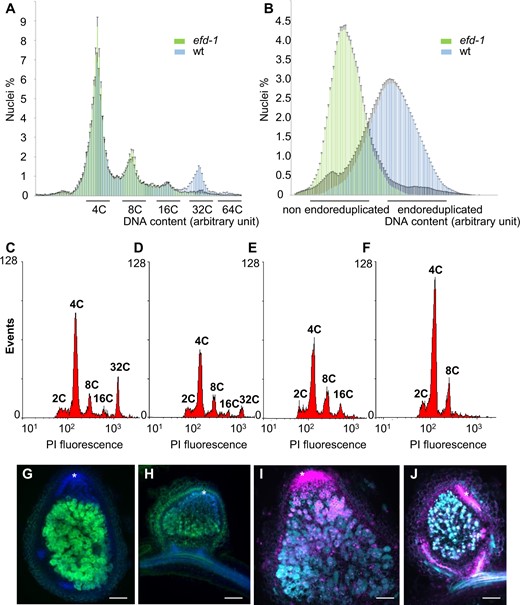
Mtefd-1 nodules exhibits an unusual plant cell endoreduplication phenotype, and a poor S. meliloti nifH expression level, without significant cell death. A and B, Comparison of plant (A) and bacterial (B) cell endoreduplication in wt and Mtefd-1 nodules (n = 19). C, D, E, and F, Levels of plant cell endoreduplication in wt (C), TRV43 (D), Mtefd-1 (E), and TR183 (F); each graph is representative of observations from two biological repeats (n = 22, 9, 19, and 16, respectively). G and H, Expression of S. meliloti pnifH:GFP in wt (G) and Mtefd-1 (H) nodules. DNA was stained with DAPI (blue fluorescence). I, J Live-dead assay of wt (I) and Mtefd-1 (J) nodules. Cells showing a cyan signal (SYTO 9) are alive while the magenta signal (propidium iodide) corresponds to dead cells as well as plant nuclei (particularly abundant in the nodule meristem). Asterisks indicate the nodule meristematic region. Nodules were analyzed at 21 dpi. Bars = 250 µm. Plants were grown under aeroponic condition for (A), (B), (G), (H), (I), and (J), and attapulgite condition for (C), (D), (E), and (F).
The endoreduplication of bacterial cells (Sinorhizobium meliloti 2011) was also clearly reduced in Mtefd-1 nodules (Figure 1B). In addition, another hallmark of bacteroid differentiation, the expression of nitrogen fixation H (NifH), a nitrogenase subunit, was severely affected, as seen with a NifH:GFP fusion. While a strong NifH:GFP signal was observed in the IZ/ZIII of wt nodules, only a weak signal was observed in a few scattered cells of Mtefd-1 nodules at 21 dpi (Figure 1, G and H). The weakness of the signal was not due to cell death, which was found by a live/dead assay to be very limited (Figure 1, I and J). The impact of Mtefd-1 on nodule differentiation is therefore not due to a deregulated plant immune response, in contrast to several other fix− plant mutants (dnf2, symcrk, nad-1, and npd1), which was further confirmed by transcriptomic data (see below).
The Mtefd-1 mutation impacts a large proportion of genes expressed during late nodule development
One of the first generations of M. truncatula microarrays (Mt16KOLIPlus) was used for the original transcriptomic analyses of the Mtefd-1 mutant, which revealed 223 and 34 genes, respectively, downregulated and upregulated at least two-fold (adj. P < 0.05) versus wt nodules at 10 dpi, and none at 4 dpi (Vernié et al., 2008). Here, to get a more complete view of genes affected by Mtefd-1, we successively used whole-genome Nimblegen microarrays (Verdier et al., 2013) and RNA-seq to compare wt and Mtefd-1 noninoculated roots, immature (4-day-old) and mature (10-day-old) isolated nodules. The two approaches gave consistent results (Supplemental Tables S2 and S3), but we focus here on RNA-seq results (Supplemental Figure S1), which are more sensitive and take advantage of the last (Mt5.0) M. truncatula genome release (Pecrix et al., 2018).
The analysis of wt samples showed a large set of genes strongly differentially regulated between nodules and roots, with 2,140 and 4,311 genes >4-fold upregulated (FDR < 0.01) in 4 dpi and 10 dpi nodules, respectively (Supplemental Figure S2, A–B). Furthermore, the comparison of mature versus immature wt nodules revealed 4,189 genes upregulated during late nodule development (fold change (FC) > 4, FDR < 0.01) (Supplemental Figure S2C). To determine where they are expressed in the nodule, we made use of the 16 expression patterns previously defined from RNA-seq analysis of laser-dissected nodule zones (Roux et al., 2014; Pecrix et al., 2018; see legend of Figure 2A). As expected, they were mostly expressed in the differentiation and nitrogen-fixation nodule zones (expression patterns 6–11 and 15–16; Figure 2, A–C).
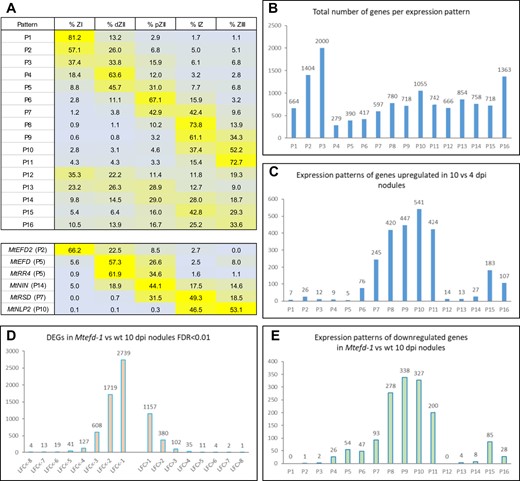
Expression pattern of MtEFD and other regulators of nodule development, and downregulation by the Mtefd-1 mutation of many genes expressed during late nodule development. A, Top: 16 expression patterns defined in wt nodules (Pecrix et al., 2018), based on the average relative expression levels (in percentage of total expression) in five laser-dissected nodule zones, namely zone I (ZI), distal zone II (dZII), proximal zone II (pZII), interzone II-III (IZ), and fixation zone III (ZIII) (RNA-seq data from Roux et al., 2014, mapped on the MtV5.0 genome release and reanalyzed). P1–P11 are mostly expressed in a single zone, while P12–P15 are expressed in all zones with a preferential one. A, Bottom: expression profile (with pattern number in parentheses) of MtEFD and its paralog MtEFD2, as well as MtRR4 and three TF genes thought to regulate nodule differentiation, shown in our final model (Figure 6). B, Distribution of all nodule-expressed genes amongst the 16 expression patterns (wt nodules). C, Number of genes upregulated in mature (10 dpi) versus immature (4 dpi) wt nodules (FC > 4; FDR < 0.01), per expression pattern. D, Cumulative number of genes upregulated and downregulated at least two-fold in Mtefd-1 versus wt 10 dpi nodules. E, Number of genes downregulated in Mtefd-1 versus wt 10 dpi nodules (FC < −4; FDR < 0.01), per expression pattern.
The analysis of Mtefd-1 transcriptomes revealed 246 and 1,719 strongly downregulated genes compared to wt in 4 and 10 dpi nodules, respectively (FC < −4, FDR < 0.01) (Figure 2D; Supplemental Figure S2D). This represented 8.6% and 37.6% of the genes upregulated in wt nodules versus roots, respectively. In contrast, only 14 genes were downregulated in Mtefd-1 roots versus wt roots (Supplemental Table S3). The analysis of 4 dpi nodules was particularly interesting, because those are less impacted by indirect, developmental effects of Mtefd-1. At this stage, the induction of several genes was completely abolished in Mtefd-1, including notably MtRR4 (Table 1). A > 4-fold reduction of expression was detected for 18 early (patterns 4–6) NCR genes, with notably 9 out of 12 NCR genes in patterns 4 and 5 affected, while the nodule-specific thioredoxin MtTRX S1, regulating NCR activity and required for bacteroid differentiation (Ribeiro et al., 2017) was 65-fold downregulated in Mtefd-1 versus wt 4 dpi nodules. Two other families proposed to be involved in nodule differentiation were also affected, namely nodule-specific Glycine-rich proteins (Alunni et al., 2007) and the Medicago lineage-specific SNARP/LEED.PEED family (Trujillo et al., 2014), with MtNODGRP36 and MtLP9/MtLP10 downregulated (153-, 31-, and 405-fold, respectively) in 4 dpi nodules and additional members of both families affected at 10 dpi (Table 1; Supplemental Table S3). In addition, the expression of various genes encoding other secreted Cys-rich peptides of unknown function was severely impaired (50- to 220-fold downregulation), including a cluster of eight leginsulin genes (de Bang et al., 2017) and three knottin-domain nodulins (MtN1, MtN1b, and MtN15) (Table 1; Supplemental Table S3). Of note, MtCCS52a was moderately but significantly downregulated (FC = −2.3 and −1.6 at 4 and 10 dpi, respectively), which is interesting considering the importance of this gene for nodule endoreduplication. Finally, the GO analysis revealed a downregulation of defense-related genes in Mtefd-1 nodules (GO:0006952; P = 7.5E-04; Supplemental Table S3).
The Mtefd-1 mutation leads to downregulation of a set of genes expressed in immature nodules and early differentiation zone, as well as premature activation of a set of genes expressed in the late differentiation zone
| Mt5.0 r1.8 ID | Gene Name | Expression Pattern | FC Mtefd-1 versus wt 4 dpi Nodules | FC Mtefd-1 versus wt 10 dpi Nodules | FC wt Nodules 4 dpi versus Roots | FC wt Nodules 10 dpi versus Roots |
|---|---|---|---|---|---|---|
| Downregulated in 4 dpi Mtefd-1 nodules | ||||||
| MtrunA17_Chr4g0002631 | MtEFD | 5 | −314.6 | −143.2 | 133.0 | 42.7 |
| MtrunA17_Chr5g0414931 | MtRR4 | 5 | −22.7 | −16.9 | 30.5 | 35.2 |
| MtrunA17_Chr3g0092781 | MtLegin39 | 4 | −216.1 | −15.6 | 211.1 | 13.8 |
| MtrunA17_Chr3g0092931 | MtLegin41 | 5 | −644.8 | −214.4 | 3,967.5 | 762.9 |
| MtrunA17_Chr7g0236361 | MtLP9 | 5 | −405.2 | −500.3 | 822.6 | 440.7 |
| MtrunA17_Chr7g0236381 | MtLP10 | 6 | −31.6 | −8.3 | 330.9 | 495.3 |
| MtrunA17_Chr6g0458644 | MtN1 | NA | −142.5 | −57.0 | 221.0 | 49.7 |
| MtrunA17_Chr4g0064831 | MtN15 | 5 | −69.0 | −44.5 | 1,813.2 | 521.6 |
| MtrunA17_Chr7g0253571 | MtN20 | 5 | −25.0 | −28.9 | 3,949.9 | 2,128.5 |
| MtrunA17_Chr2g0314811 | MtNCR477 | 5 | −10.3 | −17.9 | 272.1 | 112.1 |
| MtrunA17_Chr8g0353641 | MtNCR730 | 5 | −91.4 | −37.1 | 89.2 | 32.7 |
| MtrunA17_Chr8g0367791 | MtNCR737 | 6 | −13.3 | −23.7 | 523.2 | 359.8 |
| MtrunA17_Chr5g0415651 | MtNCR797 | 5 | −26.4 | −23.0 | 179.5 | 32.2 |
| MtrunA17_Chr5g0438331 | MtNodGRP36 | 4 | −153.7 | −196.6 | 1,038.0 | 324.7 |
| MtrunA17_Chr2g0317721 | MtTRX S1 | 5 | −65.7 | −65.5 | 3,455.8 | 512.6 |
| Upregulated in 4 dpi Mtefd-1 nodules | ||||||
| MtrunA17_Chr7g0229931 | MtNCR169 | 9 | 13.4 | −9.4 | 2.4 | 4,807.4 |
| MtrunA17_Chr2g0301771 | MtNCR238 | 8 | 36.6 | −7.5 | 1.7 | 4,755.6 |
| MtrunA17_Chr5g0431111 | MtNCR447 | 9 | 29.5 | −9.3 | 1.1 | 1,130.3 |
| MtrunA17_Chr3g0100541 | MtCAML3 | 10 | 15.2 | −9.3 | 1.7 | 11,715.6 |
| MtrunA17_ Chr1g0192121 | MtRbohA | 11 | 9.2 | −3.7 | 4.2 | 161.0 |
| MtrunA17_Chr5g0421331 | MtGH3 | 15 | 4.5 | 1.4 | 0.7 | 1.8 |
| MtrunA17_Chr8g0385011 | MtSAUR1 | 1 | 2.9 | 2.1 | 0.5 | 0.5 |
| MtrunA17_Chr4g0030001 | MtLBD11 | 12 | 4.1 | 4.52 | 1.7 | 5.1 |
| MtrunA17_Chr8g0369751 | MtCEP11 | 0 | 10.0 | 4.42 | 0.3 | 0.1 |
| Weakly regulated in Mtefd-1 nodules | ||||||
| MtrunA17_Chr5g0405841 | MtCP2 | 0 | 1.2 | −1.2 | 2.4 | 2.2 |
| MtrunA17_Chr4g0040881 | MtCP6 | 11 | −1.4 | 1.5 | 0.4 | 1,021.5 |
| MtrunA17_Chr4g0044681 | MtDNF2 | 15 | −4.8 | −5.8 | 479.1 | 1,759.6 |
| MtrunA17_Chr3g0119041 | MtSYMCRK | 10 | −1.2 | −4.5 | 278.1 | 756.5 |
Genes associated with nodule senescence and immune response are weakly affected in Mtefd-1. Gene expression patterns are from (Pecrix et al., 2018).
At 10 dpi, many genes downregulated in Mtefd-1 versus wt nodules corresponded to the late differentiation and nitrogen-fixing zones (Figure 2E), with 48.1% of patterns 6–11 genes downregulated in Mtefd-1 (1,890 genes FC < −2, FDR < 0.01). Total of 455 NCR genes were downregulated in Mtefd-1 (FC < −4), along with a series of leghemoglobin (GO:0015671) and transporter genes (GO:0006810) (Table 1; Supplemental Table S3). This reflects a major developmental impact of the Mtefd-1 mutation, with likely many indirect effects. As an illustration of possible cascade effects, the MtRSD (pattern 7) and MtNCR169 (corresponding to the dnf7 mutant; pattern 9) genes were downregulated four- and nine-fold, respectively, in 10 dpi Mtefd-1 nodules (Table 1). Transcriptomic analyses of rsd and dnf7 mutant nodules have previously identified 163 and 93 downregulated genes (FC ≤ −2) compared to wt controls, respectively (Sinharoy et al., 2013; Horváth et al., 2015), all expressed in the late nodule differentiation zone (patterns 7–11 and 15–16; Supplemental Figure S2, F and G). We found that a majority of them were downregulated in Mtefd-1 (78.4% for dnf7 and 79.5% for rsd-1; Supplemental Figure S2E), while only 12 genes were shared between dnf7 and rsd-1 affected genes. Likewise, MtDME was downregulated 3.4-fold in Mtefd-1, similar to the downregulation level leading to fix− nodules in MtDMEi knockdown mutants (Satgé et al., 2016), while MtNLP2 (Jiang et al., 2021) was 10-fold downregulated. In summary, Mtefd-1 affects several key regulators of late nodule development.
The dnf7 mutant nodules exhibit early senescence, with a high induction of MtCP2 and MtCP6 cysteine protease genes, which are markers of nodule developmental senescence (Horváth et al., 2015). In contrast, MtCP2 and MtCP6 were not differentially expressed in Mtefd-1 nodules as compared to wt nodules (Table 1), possibly because of the residual level of NCR169 expression in Mtefd-1. Furthermore, genes preventing plant immune responses against rhizobium in nodules (MtDNF2, MtSYMCRK, MtNAD1) were only modestly impacted by the efd-1 mutation (around five-fold downregulation), by comparison with their considerable level of induction in wt nodules (1760-, 756-, and 477-fold, respectively, in 10 dpi nodules versus roots) (Table 1; Supplemental Table S3). Consistently, the defense response genes highly activated in dnf2, symcrk, or nad1 mutants were either not (VACUOLAR SORTING PROTEIN; BETA-1,3-GLUCANASE; NON-RACE-SPECIFIC DISEASE RESISTANCE PROTEIN 1; PATHOGENESIS-RELATED PROTEIN 3; PHENYLALANINE AMMONIA LYASE; MtPR10-1, 10-2, 10-3, 10-4, 10-5) or only moderately upregulated (MtPR10-6; VACUOLE PROCESSING ENZYME) in 10 dpi Mtefd-1 versus wt nodules. Consistent with the live/dead assay (Figure 1J), these transcriptomic data thus confirmed that MtEFD controls the differentiation process and not immune responses.
In addition to downregulated genes, we found a number of upregulated genes in the Mtefd-1 mutant compared to wt samples (42 in noninoculated roots, 718 in 4 dpi nodules, and 380 in 10 dpi nodules; FC > 4, FDR < 0.01; Figure 2D; Supplemental Table S3; Supplemental Figure S2D). At 10 dpi, a fraction of upregulated genes likely reflects the absence of ZIII development in efd-1 nodules, mechanically leading to a relative enrichment in ZI and II transcripts compared to wt nodules (Figure 2A–C). We also observed the upregulation at 4 dpi of auxin-related genes, including MtLBD11 (Schiessl et al., 2019) and AUXIN RESPONSE FACTOR 13 transcriptional activator genes, as well as GRETCHEN HAGEN 3 (MtGH3) and SMALL AUXIN UP RNA 1 (MtSAUR1) auxin-responsive genes, potentially related to increased cortical cell divisions (ccd) that we observed in Mtefd-1 (see below). The 10-fold upregulation at 4 dpi of C-TERMINALLY ENCODED PEPTIDE 11 (MtCEP11; Table 1), related to the positive regulator of nodulation MtCEP1 (Gautrat et al., 2020), might also be linked to the Mtefd-1 hypernodulation phenotype. More intriguing was the observation that 44 genes normally expressed in the late differentiation zone (patterns 8–11 and 15), were upregulated at 4 dpi while downregulated at 10 dpi (FC > 4, FDR < 0.01; Table 1; Supplemental Table S3). Those included 21 late NCR genes (notably MtNCR169), a cluster of nodule-specific calmodulin-like genes, whose products are targeted to the symbiosome (Liu et al., 2006), as well as a redox control gene, RESPIRATORY BURST OXIDASE HOMOLOG A (MtRbohA), normally expressed in the zone III (Marino et al., 2011). These genes are thus prematurely induced in Mtefd-1 nodules. In other words, MtEFD seems to both positively regulate differentiation genes and prevent early expression of a set of late symbiotic genes.
MtRR4 can complement the hypernodulation but not the nodule differentiation phenotype of the Mtefd-1 mutant
In line with our original observations indicating that MtEFD positively controls MtRR4 expression (Vernié et al., 2008), we found here that MtRR4 and MtEFD have a similar expression profile in nodules (Figure 2A, bottom) and that MtRR4 induction is abolished in Mtefd-1 nodules (Table 1 and Supplemental Figure S3A for a validation by reverse transcription-quantitative polymerase chain reaction (RT-qPCR) analysis). MtRR4 is by far the most highly expressed member of the MtRRA gene family (10 genes) in mature wt nodules (Supplemental Table S3). Using RNA-seq data from an independent time course analysis (Schiessl et al., 2019), we observed two waves of MtRR4 induction taking place during nodulation, the first one in the first 24 h following rhizobium infection, and the second one about 3 days later, that is, at the stage of nodule primordium growth and young nodule emergence from the root (Supplemental Figure S3B). Since MtEFD is not induced before about 2 dpi (Vernié et al., 2008; Schiessl et al., 2019), it is likely that only the second wave of MtRR4 induction is impaired in Mtefd-1.
Since MtRR4 is thought to negatively regulate CK signaling, we decided to assess the impact of the Mtefd-1 mutation on the expression of a reporter of CK signaling, TCSn:β-glucuronidase (GUS; Zürcher et al., 2013; Jardinaud et al., 2016), using hairy root transformation. In wt and Mtefd-1 S. meliloti-inoculated roots, TCSn:GUS was expressed in nodule primordia at all developmental stages, from Stages I to VI as defined by Xiao et al. (2014) (Figure 3, A–D). In the Mtefd-1 mutant, we observed a more intense GUS signal in individual cells within nodule primordia (Figure 3, B and D) as well as frequent unorganized cortical cell divisions, associated or not with infection threads (Figure 3E). In mature (10 dpi) wt nodules, the TCSn:GUS signal was observed in a narrow, meristematic, or submeristematic region (Figure 3F; Supplemental Figure S4). In contrast, in Mtefd-1 nodules, TCSn:GUS was expressed in a broader region including the infection/differentiation zones (Figure 3G; Supplemental Figure S4). Yet, a marker of the central and vascular nodule meristems, the pWOX5:GUS construct (Osipova et al., 2012; Roux et al., 2014), remained expressed in highly localized apical cells in Mtefd-1, as in wt nodules (Figure 3, H and I). Of note, Agrobacterium rhizogenes-mediated transformation may change the hormonal balance but this would also be the case in the control wt background. Overall, this suggested an alteration of CK signaling in the infection/differentiation zones of Mtefd-1 nodules, while the nodule meristematic centers are not affected. In contrast, auxin signaling appeared to be minimally affected in mature Mtefd-1 nodules, based on the expression profile of a DR5:GUS auxin-responsive reporter (Ulmasov et al., 1997; Supplemental Figure S4).
Cortical cell divisions and CK signaling are modified in Mtefd-1 S. meliloti-inoculated roots and nodules. A–D, Expression pattern of the CK signaling reporter TCSn:GUS in young (stage III: A and B) and older (stages IV and V: C and D) nodule primordia, in wt (A and C) and Mtefd-1 (B and D) backgrounds, at 4 dpi with S. meliloti phemA:lacZ, using A. rhizogenes-transformed plants (10 µm sections), following revelation of GUS and LacZ activity (blue and violet signal, respectively). Note the stronger GUS signal in Mtefd-1. E, Section (10 µm) of TCSn:GUS Mtefd-1 roots at 4 dpi following GUS staining. Note the presence of numerous cortical cell divisions (asterisks) within and between nodule primordia. F–G, Expression of TCSn:GUS in mature wt (F) and Mtefd-1 (G) nodules (50 µm sections). H–I, Expression of pWOX5:GUS in mature wt (H) and Mtefd-1 (I) nodules (50 µm sections). F–I, Nodules were analyzed at 21 dpi. Bars = 100 µm (A–E) or 250 µm (F–I).
Bearing in mind the importance of CK for both early and late stages of nodule development (Plet et al., 2011), we then asked whether MtRR4 could complement the different nodulation phenotypes of Mtefd-1. MtRR4 was expressed under the control of MtEFD promoter to ensure a proper localization of its transcripts and transformed in Mtefd-1 using A. rhizogenes. To assess the complementation efficiency in a sensitive way, nodules were induced using S. meliloti carrying the NifH:GFP construct. As expected, transformation of Mtefd-1 with pMtEFD:MtEFD produced pink nodules, with numerous cells expressing NifH:GFP, as in wt control nodules (Figure 4, A–C). In contrast, nodules produced in pMtEFD:MtRR4-transformed roots were very similar to empty vector-transformed nodules, that is, small, white and with very few GFP-expressing cells (Figure 4D) even though MtRR4 was well expressed (as verified by RT-qPCR; Supplemental Figure S5). Furthermore, an analysis of nodule cell endoreduplication showed that the pMtEFD:MtRR4 construct was unable to restore the 32C peak in Mtefd-1 nodules, in contrast to pMtEFD:MtEFD (Figure 4E). We then tested whether pMtEFD:MtRR4 could complement the Mtefd-1 hypernodulation phenotype. In contrast to the nodule development phenotype, we found that pMtEFD:MtRR4 was as efficient as pMtEFD:MtEFD in restoring a normal level of nodulation (Figure 4F). Altogether, this suggested that MtRR4 downregulation is a major (and possibly the only) component of the Mtefd-1 hypernodulation phenotype, in contrast to its nodule differentiation phenotype, thus likely to involve other players.
The type A response regulator MtRR4 complements the hypernodulation phenotype of Mtefd-1 but not its nodule differentiation phenotype. A–D, Mtefd-1 complementation assays, using S. meliloti NifH:GFP-induced nodules and A. rhizogenes-mediated root transformation. A, wt mature nodules. B, Mtefd-1 nodules are efficiently complemented by pMtEFD:MtEFD. C, pMtEFD:MtRR4 fails to restore full nodule development and NifH:GFP expression in Mtefd-1. D, Mtefd-1 nodule transformed with an empty vector. Blue and green fluorescence: DAPI-staining of DNA and GFP expression, respectively (50 µm sections). DsRed expression (transformation marker) was checked for all nodules. E, Analysis by flow cytometry of the endoreduplication level of wt, efd-1, and efd-1 transformed by MtEFD or MtRR4; MtRR4 fails to restore the 32C level of plant cell endoreduplication. F, Analysis of the average nodule number produced in wt, efd-1, and efd-1 transformed by MtEFD or MtRR4; pMtEFD:MtRR4 complements the hypernodulation phenotype of Mtefd-1 Statistical significance was analyzed by Kruskal–Wallis multiple comparison test. Samples with different letters (a and b) show a statistical difference for P ≤ 0.001. Root fresh weight, measured after nodule removal. Center lines, box range, whiskers, black points, and red points indicate the median, lower to upper quartile, 1.5× interquartile, outliers, and individual values, respectively. All nodules were analyzed at 21 dpi. Bars = 250 µm.
The Arabidopsis ortholog of MtEFD, AtERF003, complements the nodule differentiation phenotype of Mtefd-1, in contrast to a close MtEFD paralog, MtEFD2
We identified proteins closely related to MtEFD in a variety of legume and nonlegume plant species. Those included an MtEFD paralog in M. truncatula dubbed MtEFD2 (MtrunA17_Chr3g0137174; 67.7% amino acid identity). The top 30 hits of Blastp searches in the ncbi nonredundant (nr) protein database with MtEFD were only legume ERFs (expect values <1e-82). In contrast, 14 nonlegume ERFs were found amongst the 30 top hits for MtEFD2 (expect values <1e-92). Multiple alignment analyses indicated that the AP2/ERF DNA binding domain of MtEFD/MtEFD2 subgroups and AtERF003, the only A. thaliana ERF closely related to MtEFD, are highly similar, with a perfect conservation of amino acids involved in the direct interaction with DNA (Figure 5A; Supplemental Figure S6). A phylogenetic tree was generated with the protein fraction following the AP2/ERF domain, using AtERF003, the 15 best hits for MtEFD and MtEFD2, and MtERN1 as an outgroup (subgroup Vb, versus subgroup Va for MtEFD). It showed that MtEFD2 and AtERF003 belong to a same subgroup, clearly distinct from the MtEFD subgroup (Supplemental Figure S7), with a further separation among MtEFD2-related proteins between legume and nonlegume proteins. In the protein fraction following the AP2/ERF domain, two motifs described for the group V ERFs, termed CMV-1 and CMV-2 (Nakano et al., 2006; Cerri et al., 2015) are also conserved amongst EFD/EFD2-related proteins, albeit with some differences between the two subgroups (Figure 5A; Supplemental Figure S6). The remaining region of about sixty amino acids, located between CMV-1 and the C-terminal CMV-2, is more variable and poorly structured, according to AlphaFold modeling (Supplemental Figure S8). Yet, an analysis of a set of 39 accessions of Pea (a species genetically closely related to M. truncatula), representing a wide range of diversity (Siol et al., 2017), showed that this region is well conserved in PsEFD (Supplemental Figure S9), suggesting a possible role in the structure and/or function of EFD.
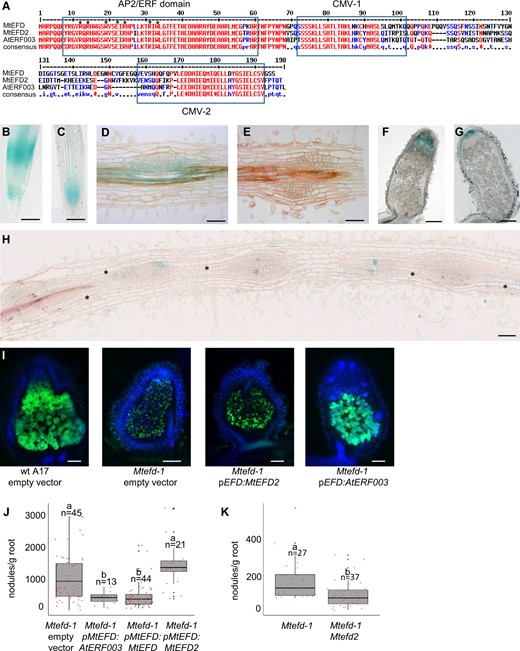
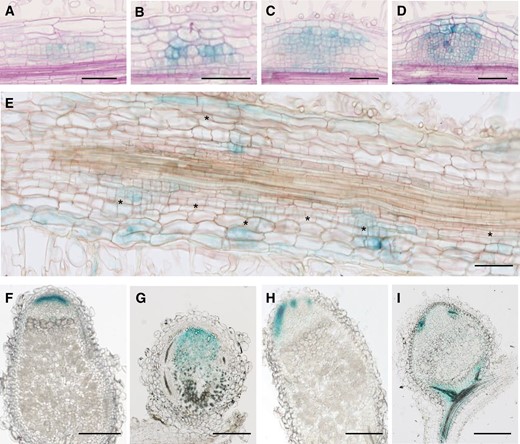
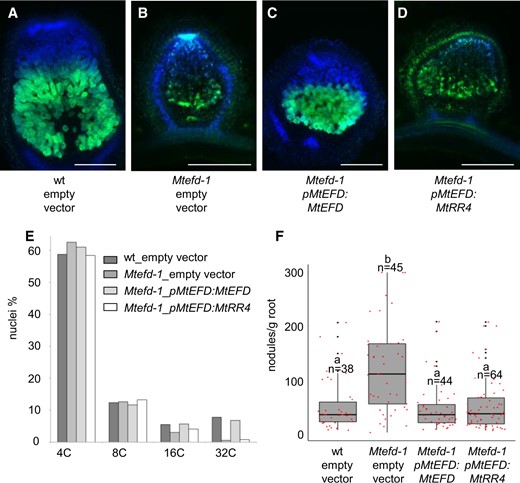
MtEFD2, an MtEFD paralog with a distinct expression pattern, is unable to complement the Mtefd-1 nodule phenotypes, in contrast to AtERF003, and positively regulates the nodule number in the Mtefd-1 mutant background. A, Multiple alignment analysis of MtEFD-like proteins in M. truncatula (MtEFD2; 79.1% similarity) and A. thaliana (AtERF003; 77.9% similarity). Amino acids involved in the direct interaction with DNA (Nakano et al., 2006) are indicated by an asterisk (AP2/ERF domain). CMV-1 and CMV-2 (= conserved motifs 1 and 2 of group V ERF proteins) are as previously defined (Cerri et al., 2015). Red and blue fonts: high and low consensus value (>90% and >50%, respectively). B and C, Expression of pMtEFD:GUS (B) and pMtEFD2:GUS (C) in wt root tips (cleared roots) D and E, Expression of pMtEFD:GUS (D) and pMtEFD2:GUS (E) in wt nodule primordia (10 µm sections). F and G, Expression of pMtEFD:GUS (F) and pMtEFD2:GUS (G) in wt mature nodules (50 µm sections). H, Expression of pMtEFD2:GUS in a Mtefd-1 mutant roots inoculated with S. meliloti 2011 (10 µm section). Asterisks indicate unorganized cortical cell divisions adjacent to nodule primordia. B–H, Observations following revelation of GUS activity. I, Sections (50 µm) of S.meliloti NifH:GFP-induced nodules (17 dpi) produced on wt M. truncatula A17 transformed with an empty vector, and Mtefd-1 mutant transformed with an empty vector, MtEFD2 and AtERF003 expressed from MtEFD promoter; note the presence of differentiated bacteroids around a central vacuole in wt nodules and pEFD:AtERF003 transformed nodules only. Blue and green fluorescence: DAPI staining of DNA and GFP expression, respectively. DsRed expression (transformation marker) was checked for all nodules. J, Average number of nodules produced at 21 dpi by Mtefd-1 transformed by an empty vector, AtERF003, MtEFD, and MtEFD2 expressed from MtEFD promoter. K, Average number of nodules produced at 17 dpi in the Mtefd-1 mutant and the Mtefd-1 Mtefd2 double mutant. b: P < 0.001 (Kruskal–Wallis test). Root fresh weight, measured after nodule removal. Bars = 250 µm (B, C, F, G, and I) or 100 µm (D, E, and H). A. rhizogenes-mediated root transformation for (B)–(K).
We found that pMtEFD2:GUS had a different expression pattern than pMtEFD:GUS in A. rhizogenes-transformed roots and nodules. In noninoculated roots, pMtEFD2:GUS was expressed in the meristematic zone of the root tip, while pMtEFD:GUS was expressed in both zones flanking the root meristem, notably in the transition zone (where root cells elongate and begin to differentiate) (Figure 5, B and C). Consistently, independent transcriptome analyses revealed that MtEFD2 expression is positively regulated by auxin, which is not the case for MtEFD (Herrbach et al., 2017). Following S. meliloti inoculation, the expression of both genes was detected in nodule primordia (Figure 5, D and E), including at very early stages, consistent with RNA-seq analyses of spot-inoculated roots (Schiessl et al., 2019) (Supplemental Figure S3B). However, from the stage III primordia (establishment of the nodule meristem; Xiao et al., 2014), pMtEFD:GUS seemed more expressed at the base of the primordium (Figure 5D), possibly corresponding to cells undergoing a differentiation process, which was not the case with pMtEFD2:GUS. In 4 dpi nodules, MtEFD and MtEFD2 were upregulated 133-fold and 7-fold versus roots, respectively, with MtEFD transcripts being about 9 times more abundant than MtEFD2 transcripts (Supplemental Table S3). In mature wt nodules, the maximal expression of MtEFD and MtEFD2 was in ZII and in ZI, respectively (laser capture microdissection-RNA-seq and promoter:GUS analyses; Figures 2, A and 5, F–G), with some overlapping expression in distal ZII. In the Mtefd-1 mutant, pMtEFD2:GUS was weakly expressed except for a few scattered cells in the nodule primordia (Figure 5H), consistent with a 2.6-fold decrease of MtEFD2 expression detected by RNA-seq in Mtefd-1 versus wt 4 dpi nodules (Supplemental Table S3).
Since MtEFD and MtEFD2 proteins are closely related, we then wondered whether MtEFD2 could complement the Mtefd-1 nodule phenotype if expressed from the MtEFD promoter. To further explore possible neofunctionalization processes, we also tested a nonlegume protein from the MtEFD2 subgroup, AtERF003. Following hairy root transformation of Mtefd-1 and inoculation with S. meliloti NifH:GFP, we found that pMtEFD:MtEFD2-transformed roots were unable to develop pink nodules at 3-weeks postinoculation (wpi), in contrast to pMtEFD:MtEFD -transformed roots, while a few pink nodules were observed at 6 wpi (Table 2;Figure 5I). In contrast, surprisingly, pMtEFD:AtERF003 efficiently complemented Mtefd-1 at 3 wpi, with the production of pink nodules harboring numerous pnifH::GFP expressing cells, and plant and bacteroid endoreduplication levels similar to the pMtEFD:MtEFD control (Table 2 and Figure 5I). Furthermore, pMtEFD:AtERF003 also complemented the hypernodulated phenotype of Mtefd-1, in contrast to pMtEFD:MtEFD2 (Figure 5J).
AtERF003 but not MtEFD2 can complement the nodule developmental phenotype of Mtefd-1, and the difference between MtEFD and MtEFD2 is in their C-terminal part, outside the N-terminal DNA-binding domain
| Mtefd-1 Transformed with: | Pink Nodules | 32C Endoreduplication | NifH:GFP Expression |
|---|---|---|---|
| empty vector | No (n = 0/54) | No (n = 19) | No (n = 19) |
| pMtEFD:MtEFD | Yes (n = 53/61) | Yes (n = 19) | Yes (n = 11) |
| pMtEFD:MtEFD2 | No (n = 0/41) | No (n = 11) | No (n = 12) |
| pMtEFD:N-MtEFD:C-MtEFD2 | No (n = 0/39) | No (n = 12) | No (n = 17) |
| pMtEFD:N-MtEFD2:C-MtEFD | Yes (n = 27/35) | Yes (n = 10) | Yes (n = 13) |
| pMtEFD:AtERF003 | Yes (n = 39/44) | Yes (n = 14) | Yes (n = 12) |
We identified one nonconservative modification (P57 replaced by T57) in the AP2/ERF DNA binding site (DBS) of MtEFD2, not found in MtEFD nor AtERF003 (Figure 5A). However, the reciprocal substitution of this amino acid residue in MtEFD and MtEFD2 did not modify the outcome of the complementation assay (Table 2). We then performed a reciprocal domain swap between MtEFD and MtEFD2, joining the N-terminal part, including the AP2/ERF DBS, of one protein (amino acids 1–64) to the remaining C-terminal part of the other. We found that a MtEFD2:MtEFD chimeric protein (MtEFD2 N-terminal part joined to MtEFD C-terminal part) was fully able to complement Mtefd-1, whereas the reciprocal MtEFD:MtEFD2 chimeric protein was totally inefficient (Table 2). This confirmed that the AP2/ERF domains of MtEFD and MtEFD2 are functionally identical, and showed the importance and neofunctionalization of the remaining part of the proteins.
Mtefd2 mutations decrease the nodule number in Mtefd-1
Since MtEFD2 is upregulated seven-fold in wt 4 dpi nodules, we tested whether Mtefd2 mutations could impact nodulation. The analysis of a mutant with a TnT1 insertion in the DBS (Noble Foundation population, R108 background, line NF-9808) revealed no nodulation phenotype. Then, to investigate possible interactions between Mtefd-1 and Mtefd2 mutations, we set up a multi-guide CRISPR–CAS9 mutagenesis approach based on A. rhizogenes-mediated transformation, as previously described for MtNLP2 (Jiang et al., 2021). The four-guide construct that we used had a very high editing rate of MtEFD2 (>70%) (Supplemental Figure S10), while no off-target edits were detected in MtEFD (n = 36). As for insertion mutants, no significant difference (P = 0.26, Kruskal–Wallis test) was observed in nodule number for these Mtefd2 mutants in a wt A17 background. In contrast, in the Mtefd-1 background, a significant decrease in nodule number was observed for bi-allelic mutants of Mtefd2 at 17 dpi (Figure 5K). The nodules formed in the double mutant were similar in terms of development to those formed in Mtefd-1 (Supplemental Figure S11).
RNA-seq analysis of nodulated root fragments at 4 dpi revealed a set of 122 genes that were downregulated in the Mtefd2 mutants, in both the wt A17 and Mtefd-1 backgrounds, whereas they were upregulated in the Mtefd-1 single mutant (Table 3; Supplemental Table S4). A majority of them (70.5%) were induced in wt nodules 4 dpi (FC > 4). These genes represent possible candidates for mediating the impact of Mtefd2 on nodulation. They included notably five MtNodGRP (Alunni et al., 2007; mean downregulation of ∼30-fold in Mtefd2), the symbiotic remorin gene MtSYMREM1 (Lefebvre et al., 2010; downregulated ∼20-fold), as well as MtNF-YA1 and MtNF-YB16, whose products interact in the nodule (Baudin et al., 2015) (downregulated >4-fold and 2.5-fold in Mtefd2, respectively). Consistently, the six SHORT INTERNODES/STYLISH (STY) genes and one YUCCA gene belonging to the NF-YA1 regulation cascade involved in auxin signaling and nodule emergence (Shrestha et al., 2021) were also downregulated in Mtefd-2 at 4 dpi (Table 3; Supplemental Table S4).
Examples of genes downregulated in Mtefd2 mutant 4 dpi nodules
| Gene Id (Mt5.0 r1.8) | Gene Name | FC wt 4 dpi Nodules versus Root Tips (Nontransformed) | FC Mtefd-1 versus wt 4 dpi Nodules | FC Mtefd-2 versus MtEFD2 (wt A17 Background) | FC Mtefd-2 versus MtEFD2(Mtefd-1 Background) |
|---|---|---|---|---|---|
| MtrunA17_Chr1g0177091 | MtNF-YA1 | 1,964.6 | 2.5 | −4.3 | −5.3 |
| MtrunA17_Chr4g0067091 | MtNF-YB16 | 240.5 | 2.3 | −2.5 | −4.1 |
| MtrunA17_Chr2g0296321 | MtNF-YB18 | 344.9 | 2.2 | −2.2 | −3.4 |
| MtrunA17_Chr2g0301491 | MtNodGRP12 | 588.1 | 3.2 | −6.9 | −33.8 |
| MtrunA17_Chr4g0033101 | MtNodGRP23 | 6,427.3 | 2.8 | −56.9 | −45.6 |
| MtrunA17_Chr3g0094011 | MtNodGRP4;MtN25 | 2,896.3 | 2.6 | −41.1 | −31.8 |
| MtrunA17_Chr8g0386521 | MtSYMREM1 | 3,350.1 | 2.6 | −19.6 | −15.9 |
| MtrunA17_Chr5g0422861 | MtNCR025 | 1,234.7 | 2.3 | −23.4 | −35.5 |
| MtrunA17_Chr6g0474261 | MtNCR109 | 1,105.1 | 3.1 | −8.6 | −17.6 |
| MtrunA17_Chr8g0372461 | MtSTY2 | 35.8 | −1.6 (FDR = 0.99) | −2.4 | −2.2 |
| MtrunA17_Chr8g0353111 | MtSTY9 | 51.6 | −1.7 (FDR = 0.99) | −3.3 | −2.3 |
| MtrunA17_Chr7g0262591 | MtYUC8 | 1.9 | −1.8 (FDR = 0.06) | −1.8 | −2.2 |
The three last columns correspond to CRISPR–Cas9 experiments in wt M. truncatula A17 or Mtefd-1 background. MtEFD2 correspond to nonedited MtEFD2 gene, as determined by genotyping and sequencing. Except where specified, all FC values are significant (FDR < 0.01).
Discussion
While substantial progress has been made in recent years in understanding nodule initiation, the control of later stages of nodule development remains relatively undocumented. Our further characterization of the EFD TF supports its key role in the control of symbiotic differentiation of M. truncatula nodules.
Thus, we found that endoreduplication of both rhizobium and plant cells, a hallmark of differentiation, is impaired in the Mtefd-1 KO mutant, with a pattern not yet described in other fix− mutants, namely the absence of 32C plant nuclei (64C nuclei being barely detectable in wt nodules in our conditions). Importantly, no concomitant cell death and strong defense reactions were observed in Mtefd-1 nodules, supporting the primary defect of Mtefd-1 being differentiation and not the control of the plant immune response toward rhizobium, in contrast to other reported plant fix− mutants. The absence of 32C nuclei in Mtefd-1 might be related to the downregulation of MtCCS52a expression. Indeed MtCCS52a antisense lines with a ∼2.5-fold decrease in MtCCS52a transcript accumulation (similar to the decrease of MtCCS52a expression in 4 dpi Mtefd-1 nodules) also exhibit a strong reduction of 32C nuclei (Vinardell et al., 2003). Furthermore, since transcription waves coincide with growing ploidy levels (Nagymihaly et al., 2017), there might be an EFD-dependent developmental transition corresponding to the last cycle(s) of endoreduplication, possibly taking place in the nodule proximal zone II, where MtCCS52a is maximally expressed (Roux et al., 2014). In agreement with this, our RN-Aseq analysis indicated that the expression of a strong proportion of genes specifically expressed in wt IZ is impaired in Mtefd-1 nodules (notably 46.7% of patterns 8 and 9 genes, that is, 616 genes, with a greater than four-fold downregulation compared to wt nodules). Those include two important symbiotic regulator genes, namely MtRSD (Sinharoy et al., 2013) and MtNCR169 (Horváth et al., 2015), expressed at a later stage of development than MtEFD (Figure 2A). Consistent with MtRSD and MtNCR169 acting downstream MtEFD, we found that a large fraction (∼75%) of genes affected in rsd-1 and ncr169 mutants were also downregulated in Mtefd-1.
Another advance provided by this work was the identification of hundreds of genes affected in very young (4 dpi) Mtefd-1 nodules, less prone to indirect developmental effects. In addition to the previously identified EFD target gene, MtRR4 (Vernié et al., 2008), we found a series of genes whose upregulation is abolished or highly impaired in Mtefd-1. Those include a set of genes encoding small secreted, Cys-rich peptides that is 24 early NCR, 8 leginsulin genes, MtN1-related and MtN15 nodulin genes, 4 LTP and defensin genes, all massively induced during wt nodulation. Some of them may contribute to rhizobium differentiation, as NCR peptides or nodule-specific Glycine-rich proteins (Alunni et al., 2007) and SNARP/LEED.PEED peptides (Laporte et al., 2010; Trujillo et al., 2014), also affected in Mtefd-1. Expression of the nodule-specific, symbiosome-localized, redox regulator MtTRX S1 (Ribeiro et al., 2017) was also strongly inhibited in Mtefd-1 (>60-fold at both 4 and 10 dpi), suggesting that not only the expression but also the activity of symbiosome-targeted peptides is likely affected. Of note, RNAi-mediated downregulation of MtTRX S1 is sufficient to alter bacteroid differentiation and nodule activity (Ribeiro et al., 2017).
We also found out that many (718) genes are upregulated in 4 dpi Mtefd-1 nodules, compared to wt nodules. In addition to auxin-related genes, hypothesized to relate to increased Rhizobium-induced ccd in Mtefd-1 (see below), 44 genes, normally expressed in the late differentiation zone of wt nodules (patterns 8, 9, 10, 11, and 15), were upregulated at 4 dpi but downregulated in 10 dpi Mtefd-1 nodules. This suggested an altered timing of transcriptional activation, with MtEFD controlling both the repression (in young nodules) and activation (in mature nodules) of genes associated with late stages of nodule development, notably encoding: NCR peptides [including NCR169 (Horváth et al., 2015)], nodule-specific symbiosome-targeted calmodulin-like proteins (Liu et al., 2006), and a zone III-associated redox regulator, MtRbohA (Marino et al., 2011). Since the expression of these genes is normally finely regulated in successive waves (Maunoury et al., 2010; Guefrachi et al., 2014; Roux et al., 2014), it is possible that their premature expression is deleterious to the differentiation process. Thus, NCR peptides are diverse in terms of biochemical properties, localization in the symbiosome, and probably interactors and functions (Mergaert, 2018). Modifying the timing of expression and the balance between different types of NCRs may therefore strongly modify the outcome of their action.
In summary, both the down and upregulation of multiple nodule-associated genes in Mtefd-1 could be responsible for Mtefd-1 defects in plant and bacteroid differentiation. From a mechanistic point of view, EFD and all related proteins carry a so-called conserved motif V-2, highly enriched in acidic and apolar amino acid residues. This motif is strongly reminiscent of the EDLL motif found in the subclass IX of ERFs and demonstrated to be a transcriptional activation domain (Tiwari et al., 2012). In contrast, EFD does not seem to carry a repressive domain, such as the EAR motif found in several ERFs (Nakano et al., 2006). Consequently, the EFD-repressive activity is probably either indirect or mediated by interactions with repressive factors. This was observed with AP2 proteins which act mainly as activators, but are able to interact with the TOPLESS repressor in other protein complexes (Horstman et al., 2014).
Among the set of target genes (direct or indirect) of MtEFD, we paid particular attention to MtRR4 because of the key role played by CK for nodule inception and development. MtRR4 is the most highly expressed type A response regulator gene in mature wt nodules, and its expression is abolished in Mtefd-1 nodules. The CK signaling reporter, TCSn:GUS, was found to be expressed in a narrow submeristematic region in wt nodules, but in a much larger zone in Mtefd-1 nodules (Figure 3, F–G). This might be due to the absence of MtRR4, thought to be a negative regulator of CK signaling. Considering the links between CK and the cell cycle control (Schaller et al., 2014), including endoreduplication, the Mtefd-1 mutant would probably be a useful tool to investigate this issue in nodules. Our attempts to complement Mtefd-1 using MtRR4 expressed from the MtEFD promoter were successful for the hypernodulation but not the nodule differentiation phenotype. This suggests that MtRR4 plays a major role in an MtEFD-dependent negative feedback loop for nodulation, while additional or alternative players are involved in the control of nodule differentiation. Examination of RNA-seq data from a detailed time course study (Schiessl et al., 2019) revealed two waves of MtRR4 transcriptional activation during early nodulation stages (Supplemental Figure S3). We propose that the first wave is induced by the burst of CK signaling in the cortex leading to ccd and nodule primordium formation, since MtRR4 is a primary CK response gene (Plet et al., 2011). The second one might be consecutive to MtEFD transcriptional activation, and contribute to the negative feedback regulation of the CK pathway (see model in Figure 6). Considering the numerous additional and disorganized ccd that we observed in Mtefd-1 roots (Figures 3, E and 5, H), it is tempting to hypothesize that MtEFD may act locally via MtRR4 to restrict ccd and the number of nodules. In the same time, MtEFD would contribute to the differentiation of cells resulting from ccd and nodule meristem activity (most likely once infected). Whether the MtEFD-dependent control of nodulation relates to the systemic autoregulation of nodulation (AON) mechanisms remains an open question. It was proposed that MtEFD expression could be activated by the CLAVATA3/EMBRYO-SURROUNDING REGION/SUPERNUMERIC NODULES (CLE/SUNN) AON pathway because MtCLE12 overexpression leads both to MtEFD induction (albeit moderate: 2.3-fold) and repression of nodulation, in a SUNN-dependent way (Saur et al., 2011). However, the impact of MtCLE12 overexpression on nodulation could not be tested in the Mtefd-1 mutant (Saur et al., 2011), preventing evaluation of the role of MtEFD in the CLE/SUNN pathway.
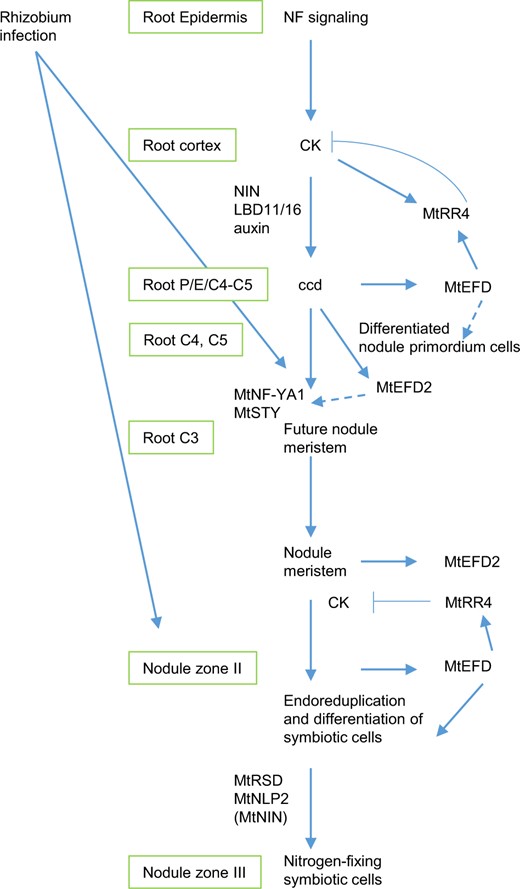
Model of MtEFD and MtEFD2 involvement in M. truncatula nodule development, integrated with other known regulators. Inspired by Xiao et al. (2014) and Shresta et al. (2020) for primordium and nodule meristem formation, by Schiessl et al. (2019) and Soyano et al. (2019) regarding NIN and auxin biosynthesis, and by Sinharoy et al. (2013), Feng et al. (2021), and Jiang et al. (2021) regarding MtRSD, NIN, and NLP2 in nodule development and activity. In the primordium cells, MtEFD would be first involved in the differentiation of nodule, following the Nod Factor signaling pathway leading to induction of root cortical cell divisions by CKs and auxin. MtEFD would also contribute to the transcriptional activation of MtRR4, a negative regulator of CK signaling, thereby contributing to negative feedback regulation of ccd and nodulation. In the nodule, MtEFD would be involved in the differentiation of cells generated by the nodule meristem, including late endoreduplication cycles (C16–C32 and C64). Based on their respective expression profile (Figure 2), MtEFD would act before two other regulators of nodule development, namely MtRSD and MtNLP2. MtNIN is only weakly downregulated in the Mtefd-1 mutant at 10 dpi. MtEFD also contributes to the regulation of CK signaling in the nodule (Figure 3G), possibly through MtRR4, but MtRR4 cannot complement the Mtefd-1 differentiation nodule phenotype, whereas it complements the Mtefd-1 hypernodulation phenotype. MtEFD2 is proposed to contribute to MtNF-YA1 expression and action, through its regulation cascade comprising MtSTY genes. NF, Nod Factors; ccd, cortical cell divisions; P, Pericycle; E, endodermis; C3, C4, and C5, cortical cell layers 3, 4, and 5, respectively.
During nodule evolution, MtEFD has probably been recruited from a root developmental program, because it is only expressed in roots and nodules, in both cases in the differentiation zone. We could not however identify a robust root phenotype co-segregating with the Mtefd-1 mutation, possibly because of functional redundancy issues or technical difficulties due to root plasticity. As a first approach to investigate the evolution of MtEFD, we asked whether two MtEFD closely related genes, from M. truncatula (MtEFD2) and from A. thaliana (AtERF003), expressed under the control of the MtEFD promoter, could complement the nodule differentiation phenotype of Mtefd-1. Unexpectedly, we found that AtERF003 but not MtEFD2 efficiently complemented Mtefd-1. This strongly suggests that the main innovation for the symbiotic function of MtEFD resides in its promoter, even though MtEFD regulates a large set of nodule-specific genes that do not exist in A. thaliana (which is unable to establish endosymbiotic interactions, whether with nitrogen-fixing bacteria or mycorrhizal fungi). This is in line with recent studies which revealed that a major mechanism for the emergence of nitrogen-fixing symbioses was the evolution of cis-regulatory elements in promoter regions (Liu and Bisseling, 2020; Mergaert et al., 2020; Dong et al., 2021).
Still, how AtERF003 can activate nodule-specific genes is an intriguing question. A first element of response is that the DBSs of MtEFD and AtERF003 are highly conserved. Furthermore, MtEFD does not activate its nodule-specific target genes in the root, nor following its induction by the bacterial pathogen Ralstonia solanacearum (Moreau et al., 2014). Therefore, another layer of regulation must exist in the nodule, to which AtERF003 is also responsive. This could be the presence of nodule-specific interactors in transcriptional complexes and/or the presence of a peculiar epigenetic landscape. Indeed many nodule differentiation genes are found in genomic regions (notably the so-called symbiotic islands) strongly enriched in epigenetic marks which are highly differential in nodules versus roots or between nodule zones (Satgé et al., 2016; Nagymihaly et al., 2017; Pecrix et al., 2018). DNA demethylation and replacement of repressive by active histone marks could thus be important factors to give MtEFD/AtERF003 access to a set of promoter regions. In support of this hypothesis, DNA affinity purification sequencing showed that the binding to DNA of many AP2/ERFs is sensitive to cytosine methylation (O'Malley et al., 2016).
The DBS of MtEFD2 is also very similar to MtEFD DBS, which it could efficiently replace in a chimeric EFD2:EFD protein, in contrast to the rest (C-terminal part) of MtEFD2 protein. This suggests a neofunctionalization of the MtEFD2 protein involving modifications in its C-terminal part, in addition to a distinct expression pattern (MtEFD2 being maximally expressed in/very close to the root and nodule division zones). Precise information is lacking regarding the role of the C-terminal part of MtEFD-related proteins, but it is likely involved in protein–protein interactions. Although we were unable to detect a nodulation phenotype of single Mtefd2 mutants, Mtefd-1 Mtefd2 double mutants were affected in the number of nodules produced. This suggests that MtEFD2 plays a role in nodule inception, possibly partially overlapping with MtEFD role, or perhaps only in the particular environment resulting from the Mtefd-1 mutation. It is possible, for example, that the downregulation of MtNF-YA1 and MtNF-B16 resulting from the Mtefd2 mutations does not affect the normal level of nodulation but becomes a limiting factor for hypernodulation in the Mtefd-1 background. Transcriptome analyses suggested that MtEFD2 contributes to the activation of MtNF-YA1/MtNF-B16 and their regulatory cascade involved in auxin biosynthesis six STY genes and one YUCCA gene. Since STY genes are required for nodule emergence (Shrestha et al., 2021), it is tempting to speculate that this contributes to decreased nodule formation in Mtefd-1 Mtefd2. In any case, the MtEFD/MtEFD2 case is reminiscent of several other examples of paralogous genes playing overlapping or synergistic roles during nodulation, such as MtNOOT1/MtNOOT2 (Magne et al., 2018),MtERN1/MtERN2 (Cerri et al., 2016), and MtNF-YA1/MtNF-YA2 (Laloum et al., 2014).
Conclusions
Our study revealed the recruitment to the N-fixing symbiosis of two proteins probably originally operating in roots, MtEFD and MtEFD2, expressed in the differentiation and meristematic zones of both roots and nodules, respectively, and with distinct neofunctionalization processes for each of them. We propose that, following the evolution of its promoter region leading to a strong induction in nodules, MtEFD has become a major regulator of nodule symbiotic differentiation, contributing directly or indirectly to the activation of almost half of the genes specifically expressed in the late differentiation zone, while preventing the premature activation of some of them. In addition, MtEFD is involved in the control of root cortical cell divisions and nodule number, probably through MtRR4 action on CK signaling. For a better understanding of the MtEFD-associated upstream and downstream regulation network, it would now be necessary to identify the cis- and trans-elements that control MtEFD expression, and to identify the DNA sites bound by MtEFD, keeping in mind that these may be affected by DNA methylation. Identification of protein interactors and possible posttranslational modifications would also be valuable to better understand the differences in the mode of action of MtEFD and MtEFD2, and more generally to document the functional importance of the C-terminal part of AP2/ERF proteins.
Materials and methods
Plant genotypes
The M. truncatula A17 was used as the wt reference. The Mtefd-1 null deletion mutant (backcrossed twice) was previously described (Vernié et al., 2008). The TR36, TRV36, TRV43, TR183, and TR3 mutant seeds (Maunoury et al., 2010) were provided by Peter Mergaert (I2BC, Gif-sur-Yvette). The Mtefd2 mutant was generated by multi-guide CRISPR–Cas9 mutagenesis of MtEFD2 using M. truncatula A17 hairy root transformation. It was therefore a mix of mutations, with >95% of large deletions or frame-shift mutations, as described in Supplemental Figure S9. The Mtefd-1 Mtefd2 double mutant was similarly generated by CRISPR–Cas9 mutagenesis of MtEFD2 using Mtefd-1 hairy roots.
Plant growth and hairy root transformation
Seeds were sterilized and placed at 4°C during 5 days then germinated one night at 25°C. Germinated seeds were grown on agar plates containing Fahraeus medium supplemented with 0.5 mM NH4NO3 and covered with a filter paper (at 25°C; light/dark photoperiod of 16 h/8 h), in attapulgite (at 25°C) or in aeroponic caissons (at 22°C; 75% hygrometry; light intensity: 200 µE.m−2.s−1; light-dark photoperiod: 16 h-8 h). In aeroponic caissons, plants were grown for about 7 days in aeroponic medium supplemented with 5-mM NH4NO3 (Barker et al., 2007) and then in nitrogen-free aeroponic medium 3 days before inoculation with S. meliloti 2011.
Hairy root transformations (analyses of all GUS constructs, Mtefd-1 complementation experiments and CRISPR–Cas9 mutagenesis of MtEFD2) were performed using ARqua1 A. rhizogenes as described (Boisson-Dernier et al., 2001). Composite plants were selected on kanamycin 25 mg/L (20°C; day/night, 12 h) and systematically checked for the expression of the DsRED marker present on the T-DNA construct (stereomicroscope MZFLIII; Leica Wetzlar, Germany). They were transferred in aeroponic caissons following 2 weeks of growth on plates at 20°C (Fahraeus medium with 5-mM NH4NO3) and grown for 7 days in the presence of 5-mM NH4NO3 before nitrogen starvation and inoculation with S. meliloti.
Under aeroponic conditions, nodules started fixing nitrogen at around 7 and 10 dpi for nontransformed plants and transformed composite plants, respectively.
Light and fluorescence microscopy
Bacterial viability (LIVE/DEAD BacLight Viability Kit;Thermo Fisher Scientific, Waltham, MA, USA) and NifH:GFP expression were analyzed using 80 µm sections (microtome LEICA VT 1000S) of nodules embedded in 8% low-melting agarose (NuSieve GTG Agarose Lonza). They observed with an Axioplan 2 microscope (Zeiss, Oberkochen Germany).
For GFP and SYTO 9, the fluorescence observations were made using an excitation wavelength of 475 nm, a barrier filter of 394 nm and an emission filter of 397 nm. For propidium iodide and DsRed, the set up was an excitation wavelength of 546 nm, a barrier filter of 580 nm and an emission filter of 590 nm. Images were taken with an Axiocam MRc camera (Zeiss). In complementation assays, sections were stained with 0.5 µg mL−1 4′,6-diamidino-2-phenylindole (DAPI; excitation wavelength of 365 nm, barrier filter 395 nm and emission filter 397 nm).
For analysis of promoter:GUS fusions, roots or nodules were prefixed in paraformaldehyde 0.4% (v/v) for 1 h, stained for GUS activity for 4 h at 37°C, and fixed in glutaraldehyde 2% (v/v). Longitudinal sections were made from roots embedded in 8% (w/v) low-melting agarose, using a vibrating microtome (Leica VT 1000S), and observed with a Zeiss Axiophot light microscope.
For analyses of thinner sections (TCSn:GUS-transformed S.meliloti-inoculated roots), roots fragments were fixed under vacuum in 0.1 M sodium phosphate buffer containing 0.3% (v/v) paraformaldehyde, rinsed in phosphate buffer (3 times) and incubated in GUS staining buffer (0.1 M NaPO4 pH 7.4, 400 µM K3 Fe(CN)6, 400 µM K4Fe(CN)6, 0.625% (w/v) X-Gluc) for 6 h at 37°C. Samples were rinsed and fixed again in 0.1-M Phosphate buffer containing 2% (v/v) glutaraldehyde. Roots were then dehydrated by sequential treatments in 30%, 50%, 70%, 90%, and 100% (v/v) ethanol and embedded in glycolmethacrylate (Technovit 7100; Haereus-Kulzer, South Bend, IN, USA) according to the manufacturer’s instructions. Images of 10 µm sections were acquired using a Nanozoomer HT (Hamamatsu, Shizuoka, Japan).
RNA extraction and transcriptome analyses
Total RNA was extracted from ∼1 cm-long root tips, isolated root nodules or nodulated root fragments, using the Qiagen rNeasy Plant kit according to the supplier’s instructions. These root tips represent good reference samples as they contain the region of MtEFD and MtEFD2 expression and part of the nodulation competence zone. Microarray analyses were carried out at URGV (Evry, France), using microarrays based on the Roche-NimbleGen technology. High density microarray slides contained 12 chambers, each with 249,087 oligonucleotides representing 83,029 M. truncatula A17 loci (each oligonucleotide in triplicate). Four independent biological replicates were analyzed, with ≥12 aeroponically grown plants per replicate. For each comparison, one technical replicate per biological replicate with fluorochrome reversal was performed (i.e. four dye-switch hybridizations per comparison). The labeling of cRNAs with Cy3-dUTP or Cy5-dUTP (Perkin-Elmer-NEN Life Science Products, Waltham, MA, USA) and the hybridization to the slides were performed as described in (Lurin et al., 2004). Two micron scanning was performed with InnoScan900 scanner (Innopsys, Carbonne, France) and raw data were extracted using Mapix software (Innopsys, Carbonne, France). For each array, the raw data comprised the logarithm of median feature pixel intensity at wavelengths 635 nm (red) and 532 nm (green); a global intensity-dependent normalization using the Loess procedure (Yang et al., 2002) was performed to correct the dye bias. Differential analysis was based on log-ratios averaged over duplicate probes and technical replicates. Hence the number of available data for each gene equaled the number of biological replicates and was used to calculate the moderated t test (Smyth, 2004). Since no evidence that specific variances vary between probes was found by Limma, moderated t-statistic was assumed to follow a standard normal distribution. Adjusted P-values were calculated using the optimized FDR approach (Storey and Tibshirani, 2003) with R software (R development Core Team, 2005). SqueezeVar function of the library Limma was used to smooth the specific variances by computing empirical Bayes posterior means. The library kerfdr was used to calculate the adjusted P-values.
RNA-seq analyses were performed with three biological replicates, each representing pools of >12 independent plants or transformed roots. Oriented RNA-seq was carried out at the GeT-PlaGe core facility, INRAE Toulouse, France (http://www.get.genotoul.fr). RNA-seq libraries were prepared according to Illumina’s protocols using the TruSeq Stranded mRNA sample prep kit (Illumina, San Diego, CA, USA) to analyze mRNA. Briefly, mRNA was selected using poly-T beads. Then, RNA was fragmented to generate double-stranded cDNA, and adaptors were ligated to be sequenced. Libraries were amplified by 11 cycles of PCR. Library quality was assessed using a Fragment Analyzer (Advanced Analytical Technologies, Inc., Ankeny, IA, USA) and libraries were quantified by qPCR using a Library Quantification Kit (Kapa, Wilmington, MA, USA). RNA-seq experiments were performed using a NovaSeq technology, with a paired-end read length of 2 × 150 bp.
Expression measure was performed using M. truncatula annotation version 5.1.8. We used nf-core/rnaseq pipeline version 3.0 (doi:10.5281/zenodo.4323183) with the following parameters “–skip_alignment –pseudo_aligner salmon” that performs adapter and quality trimming with Trim Galore software version 0.6.6 followed by transcript assignation and quantification with salmon tool (version 1.4.0). Differentially expressed genes (DEGs) were detected with EdgeR Bioconductor package version 3.34.0 (Robinson and Smyth, 2008). Genes with no counts across all libraries were discarded prior to further analysis. Normalization was performed using trimmed mean of M values method (Robinson and Oshlack, 2010). Heatmaps showing correlation between replicates were generated using the package pheatmap version 1.0.12 (https://CRAN.R-project.org/package=pheatmap) with sample-to-sample Euclidean distances. DEGs were called using the fitted generalized linear models likelihood ratio test, with an FDR-adjusted P-value (Benjamini and Yekutieli, 2001). Analyses of GO term enrichment were performed using the topGO package version 2.44.0 (Alexa et al., 2006).
Correspondences between gene identifiers (Nimblegen, Affymetrix, Mt20120830, Mt4.0 and Mt5.0), as well as gene names/acronyms were from Legoo (Carrère et al., 2019; Carrere et al., 2021) and downloaded from the downloads section of Mt5.0 genome browser (https://medicago.toulouse.inra.fr/MtrunA17r5.0-ANR/), as of 20211025. NCR genes were annotated using (Montiel et al., 2017) and (de Bang et al., 2017), with correspondences to Mt5.0 annotated proteins established using blastP. The published NCR number was used for hits with >90% identity over >90% query. Additional NCR numbers (MtNCR-new1…) were used for 86 Mt5.0 proteins with the Interpro domain IPR009810:Late nodulin and not corresponding to published NCRs. In total 693 NCR genes were annotated in Mt5.0.
Phylogenetic analysis
Sequences were aligned with MAFFT (version 7.310; Katoh and Toh, 2008). Columns with >50% of gaps were pruned. The phylogenetic tree was built with IQ-TREE (version 1.5.5) (Nguyen et al., 2015). IQ-tree used ModelFinder (Kalyaanamoorthy et al., 2017) to identify JTT+G4 as the best-fit evolutionary model according to Bayesian information criterion. Branches were tested by SH-like aLRT (Anisimova and Gascuel, 2006). Finally, the tree was drawn with Itol (Letunic and Bork, 2021).
Statistical analysis
Endoreduplication levels were compared using one-way analysis of variance (ANOVA) followed by post-hoc Tukey test. Normality (Shapiro’s test) and homoscedasticity (Bartlett’s test) were previously verified (P > 0.05). Transcriptomic and phylogenetic data were analyzed as described above. Nodule numbers were statistically analyzed with the Kruskal–Wallis multiple comparison test or the Wilcoxon two-sample method using R software (version 4.1.0) (two-sided tests) and the “agricolae” package (version 1.3-5). Boxplots were drown with the “ggplot2” package (version 3.3.5).
Construct production
The TCSn:GUS construct was previously described (Jardinaud et al., 2016). For pMtWOX5:GUS, a 2108 bp fragment upstream the ATG was PCR amplified (PrimeSTAR HS DNA Polymerase, TaKaRa, Shiga, Japan) using MtWOX5 promoter Forward and Reverse (Supplemental Table S5). The amplicon was then cloned into a modified pCAMBIA2200 vector (Fliegman et al., 2013) using the BsaI sites to generate the pMtWOX5:GUS binary vector. For the transcriptional fusion between the MtEFD and MtEFD2 promoters and the GUS gene, 960-bp and 2,457-bp regions were amplified respectively, using MtEFD and MtEFD2 promoter Forward and Reverse primers (Supplemental Table S5). The GUS fusion was achieved using BsaI digest-T4 DNA ligase ligation protocol with a mix of amplicon and level 0 plasmids EC47822 (pL1V-R2), EC75111 (pL0M-SC-GUS), and EC41414 (pL0M-T-T35S-1; Schiessl et al., 2019). Level 2 assembly was performed using BpiI digest-T4 DNA ligase ligation protocol and the following level1 blocs: the previously generated level1 assembly, EC15529 (pL1M-R1-p35S-Kana-TNOS); pUbiq (EC15062- pAtUbi10; EC15073-DSRed; EC41432-TOCS-1;EC47822), End Linker (EC41766–pL1M-ELE-3), and the binary vector EC50506 (pL2V-1-50506).
For the complementation experiments, MtEFD, MtEFD2, MtRR4, and AtERF003 wt coding sequences were amplified with MtEFD, MtEFD2, MtRR4, and AtERF003 Forward and Reverse primers, respectively (Supplemental Table S5). To introduce P57/T57 point mutations in MtEFD and MtEFD2, fragments were amplified using MtEFD and MtEFD2 mut Forward and Reverse (Supplemental Table S5). For the chimeric MtEFD:MtEFD2 and MtEFD2:MtEFD constructs (domain swaps), fragments were amplified with MtEFD:MtEFD2 chim Forward and Reverse, and MtEFD2:MtEFD1 chim Forward and Reverse, respectively (Supplemental Table S5). Level 1 (pMtEFD: coding sequence: T35S) and Level2 assemblies were generated as previously described.
For CRISPR–Cas9 mutagenesis, guide RNAs (gRNA; listed in Supplemental Table 5) were designed with CRISPOR (version 4.8, http://crispor.tefor.net/) program, with the INRA A17r5.0 r1.6 M. truncatula genome release (Pecrix et al., 2018) and the “20bp-NGG-Sp Cas9, SpCas9-HF1, eSpCas9 1.1” option. The S. pyogenes Cas9 coding DNA sequence was used, with a SV40 NLS sequence added at the C-terminus. Four gRNAs, interspaced by tRNAs, were preassembled as a synthetic polycistronic gene, as described (Xie et al., 2015). They were expressed from M. truncatula U6.1 (MtrunA17_Chr3g0136831) and U6.6 (MtrunA17_Chr7g0251721) promoters (each for two guides). They were cloned using Golden Gate cloning technology into backbone plasmids provided by the ENSA project (Schiessl et al., 2019) (Engineering Nitrogen Symbiosis for Africa; https://www.ensa.ac.uk). T-DNAs included a kanamycin resistance module (p35S:KanR:TNos) and a DsRed fluorescent reporter module (pAtUbi10:DsRed:TOcs), located, respectively, close to the right and left borders of the T DNA.
Genotyping was performed by nested PCR and systematic sequencing of PCR products, using individual transformed root systems, on DNA from root segments adjacent to nodules.
Accession numbers
GSE138899 (Nimblegen analyses); SRP349933 (RNA-seq of CRISPR-Cas9 mutant and control samples); SRP349926 (RNA-seq of nontransformed wt and Mtefd-1 samples).
Supplemental data
The following materials are available in the online version of this article.
Supplemental Table S1. Percentage of 16C, 32C, and 64C nuclei in nodules of wt A17, Mtefd-1, and other fix minus mutants.
Supplemental Table S2. DEGs detected using Nimblegen gene chips.
Supplemental Table S3. RNA-seq analysis of N-starved root tips, 4 and 10 dpi nodules in wt A17, and Mtefd-1 backgrounds.
Supplemental Table S4. RNA-seq analysis of 4 dpi nodulated root fragments of Mtefd2 mutants generated by CRISPR–Cas9 in wt A17 and Mtefd-1 backgrounds.
Supplemental Table S5. Primers and guides.
Supplemental Figure S1. Clustering analysis of RNA-seq data produced using noninoculated N-starved root tips and isolated S. meliloti 2011-induced nodules at 4 and 10 dpi, in wt (A17) and Mtefd-1 backgrounds.
Supplemental Figure S2. Genes upregulated and downregulated in wt nodules, and comparison of genes downregulated in the Mtefd-1, Mtrsd-1, and Mtdnf-7 mutants.
Supplemental Figure S3. Time course analysis of MtEFD, MtRR4, and MtEFD2 expression.
Supplemental Figure S4. Expression pattern of the auxin responsive reporter DR5:GUS, as compared to the CK-responsive reporter TCSn:GUS in wt and Mtefd-1 nodules.
Supplemental Figure S5. Quantitative RT-PCR analysis of gene expression in Mtefd-1 complementation assays.
Supplemental Figure S6. Multiple alignment analysis of MtEFD- and MtEFD2-related proteins.
Supplemental Figure S7. Phylogenetic tree of MtEFD-related proteins.
Supplemental Figure S8. Protein structure of AtERF003 (At5g25190), MtEFD and MtEFD2 predicted by AlphaFold version 2.0 (Jumper et al., 2021) and visualized using Mol* Viewer (Sehnal et al., 2021).
Supplemental Figure S9. Multiple alignment analysis (Multalin) of MtEFD and PsEFD proteins from a collection of 39 pea accessions.
Supplemental Figure S10. Multi-guide CRISPR–Cas9-induced mutations in MtEFD2, obtained following A. rhizogenes transformation.
Supplemental Figure S11. Macroscopic development of nodules in the Mtefd-1 mutant and the Mtefd-1 Mtefd2 double mutant.
M-F.J., J.F., and P.G. conceived the research plans. M-F.J. and J.F. performed most of the experiments in Mt. G.A. performed experiments in pea. Y.P. designed the CRISPR–Cas9 constructs. L.T., S.C., and L.C. performed microarray experiments, bioinformatics analyses, and phylogenomic analyses, respectively. S.M. and M.C.A. provided technical assistance to M-F.J. and P.G. S.B. supervised microarray experiments. P.G. and J.B. supervised the experiments in Mt and pea, respectively. M-F.J., J.F., and P.G. analyzed the data. P.G. conceived the project and wrote the article with contributions of M-F.J., J.F., S.B., and L.C. P.G. agrees to serve as the author responsible for contact and ensures communication.
The author responsible for distribution of materials integral to the findings presented in this article in accordance with the policy described in the Instructions for Authors (https://dbpia.nl.go.kr/plphys/pages/general-instructions) is Marie-Françoise Jardinaud ([email protected]).
Acknowledgments
We are grateful to Peter Mergaert (ISV CNRS, Gif-sur-Yvette) for providing us with Fix- Medicago mutants, Ludovic Legrand (LIPME, Toulouse) for helping us with Alphafold, Rene Geurts and Eric Limpens for providing us with the S. meliloti NifH:GFP strain, and Jean-Marie Prospéri (INRA, Montpellier) for supplying M. truncatula A17 seeds. We thank the ENSA project for providing plasmids for Golden Gate cloning, and the FRAIB-TRI Imaging Platform (Université de Toulouse, CNRS) for its excellent support. RT-qPCR and RNA-seq experiments were carried out at the Toulouse Genopole GeT-PlaGe platform.
Funding
This work was supported by the Agence Nationale de la Recherche (grant “GENOPEA” ANR-09-GENM-026), by INRAE (CJS fellowship for J.F.; SPE grant “EFFOR”) and the “Laboratoire d’Excellence (LABEX) TULIP” (ANR-10-LABX-41). The POPS platform benefited from the support of the LABEX Saclay Plant Sciences-SPS (ANR-10-LABX-0040-SPS).
Conflict of interest statement. None declared.
References
Author notes
These authors contributed equally (M-F.J. and J.F.)
Present address for Yann Pecrix: PVBMT, CIRAD, Université de la Réunion, France.
Present address for Ludivine Taconnat: GEVES, SNES, Beaucouzé, France.
Present address for Sandrine Balzergue: IRHS, INRAE, AGROCAMPUS-Ouest, Université d'Angers, France.#Senior author
Senior author
