


Abstract
Flooding causes severe crop losses in many parts of the world. Genetic variation in flooding tolerance exists in many species; however, there are few examples for the identification of tolerance genes and their underlying function. We conducted a genome-wide association study (GWAS) in 387 Arabidopsis (Arabidopsis thaliana) accessions. Plants were subjected to prolonged submergence followed by desubmergence, and seven traits (score, water content, Fv/Fm, and concentrations of nitrate, chlorophyll, protein, and starch) were quantified to characterize their acclimation responses. These traits showed substantial variation across the range of accessions. A total of 35 highly significant single-nucleotide polymorphisms (SNPs) were identified across the 20 GWA datasets, pointing to 22 candidate genes, with functions in TCA cycle, DNA modification, and cell division. Detailed functional characterization of one candidate gene, ACONITASE3 (ACO3), was performed. Chromatin immunoprecipitation followed by sequencing showed that a single nucleotide polymorphism in the ACO3 promoter co-located with the binding site of the master regulator of retrograde signaling ANAC017, while subcellular localization of an ACO3-YFP fusion protein confirmed a mitochondrial localization during submergence. Analysis of mutant and overexpression lines determined changes in trait parameters that correlated with altered submergence tolerance and were consistent with the GWAS results. Subsequent RNA-seq experiments suggested that impairing ACO3 function increases the sensitivity to submergence by altering ethylene signaling, whereas ACO3 overexpression leads to tolerance by metabolic priming. These results indicate that ACO3 impacts submergence tolerance through integration of carbon and nitrogen metabolism via the mitochondrial TCA cycle and impacts stress signaling during acclimation to stress.
Introduction
Current climate change models suggest that flooding frequency will increase substantially over the next decades and will continue to restrict crop production and reduce yields severely (Atkinson and Urwin, 2012). For example, between 1980 and 2010 flooding events have tripled worldwide and production losses across Asia were up to 86% (FAO, 2017). Therefore, increased understanding of mechanisms leading to higher flooding tolerance in plants has immense potential to secure food production.
Submergence reduces the availability of oxygen, carbon dioxide, and light, which inhibit aerobic respiration and photosynthesis, impacting carbohydrate and ATP synthesis (Voesenek and Bailey-Serres, 2015). Additionally, submergence-related hypoxia and the rapid reoxygenation during desubmergence result in elevated reactive oxygen species (ROS) and oxidative stress, making both phases complex compound stresses (Pucciariello et al., 2012; Yeung et al., 2019). Plants acclimate to flooding by adjusting growth and fine-tuning metabolism to changing conditions (Tamang and Fukao, 2015; Voesenek and Bailey-Serres, 2015). Photosynthesis-related parameters such as chlorophyll concentration and maximum quantum yield of photosystem II (Fv/Fm) as well as starch and protein concentrations decrease during submergence and recover after desubmergence (Voesenek and Bailey-Serres, 2015; Yeung et al., 2019; Meng et al., 2020). Furthermore, a role of mitochondrial signaling in the acclimation and adaptation to submergence has also recently emerged (Meng et al., 2020). Concomitantly, genes involved in carbohydrate metabolism, the TCA cycle, fermentation, and oxidative responses also play important roles in hypoxia responses to adjust metabolism (Narsai et al., 2011; Mustroph et al., 2014; Shingaki-Wells et al., 2014; Safavi-Rizi et al., 2020). While most studies have focused on hypoxia as an important component of the flooding stress, other factors also contribute to the plant’s ability to survive this stress (Nakamura and Noguchi, 2020). An increased expression of nitrate, phosphate, and sulfate transporters has been observed in Arabidopsis (Arabidopsis thaliana), indicating a limitation of these macronutrients under submergence and an increased uptake capacity is part of the acclimation response (Mustroph et al., 2014). Consequently, flooding tolerant plant species such as rice (Oryza sativa) and Distylium chinense are able to maintain nutrient uptake, and external nutrient application also improves flooding tolerance (Liu et al., 2014; Gautam et al., 2016). Studies in citrus and soybean (Glycine max) show a decrease in nutrient uptake and distribution, especially of nitrate or ammonia, in waterlogged conditions (Board, 2008; Martínez-Alcántara et al., 2012). A direct link of nitrogen supply to energy metabolism and hypoxia signaling is also based on an increased activity of nitrate reductase under hypoxia, leading to the formation of nitrite and subsequently nitric oxide (NO; Gupta et al., 2020). While NO has a function as a signaling molecule interacting with the ethylene pathways, nitrite reduction in mitochondria supports ATP production when oxygen as a substrate becomes limiting and maintains mitochondrial function (Gupta et al., 2020). While nutrient deficiency is likely caused by leaching of the highly soluble ions from the soil and by restricted transpiration impeding uptake and transport, this aspect of the compound stress and its impact on metabolic acclimation or signaling has not been investigated in much detail (Tamang and Fukao, 2015).
Quantitative trait locus (QTL) mapping and genome-wide association studies (GWAS) have identified many loci underlying naturally occurring variation (Korte and Farlow, 2013). Genetic variation of flooding tolerance has also been found in many species (Xu et al., 2006; Mommer et al., 2007; Vashisht et al., 2011). For example, genes detected by QTL mapping such as SUB1A, SNORKEL1, SNORKEL2, and ACCELERATOR OF INTERNODE ELONGATION 1 (ACE1) contribute to flooding tolerance in rice by controlling shoot elongation (Xu et al., 2006; Hattori et al., 2009; Nagai et al., 2020). GWAS relies on the linkage of highly dense markers such as single-nucleotide polymorphisms (SNPs) and a phenotype quantified over a large number of accessions, while accounting for background associations due to population structure (Weigel, 2012). As associations are being tested for millions of SNPs, GWAS can point to narrow genetic regions with high resolution that can then be functionally validated by further experiments, typically by candidate gene knockout or overexpression in isogenic lines (Weigel and Nordborg, 2015). A GWAS of flooding tolerance in rice identified a gibberellic acid (GA) biosynthesis gene, SEMIDWARF1 (SD1). The corresponding encoded protein promotes GA4 synthesis resulting in internode elongation to increase flooding tolerance (Kuroha et al., 2018). Another GWAS of flooding tolerance in 277 bean (Phaseolus vulgaris) genotypes found the gene SNF1-RELATED PROTEIN KINASE 1.1, which is the central integrator in energy signaling under hypoxia (Baena-González et al., 2007; Soltani et al., 2018).
The model plant A. thaliana is distributed across a large range of climatic conditions and with natural variants adapted to diverse environments (Fournier-Level et al., 2011; Verslues and Juenger, 2011). Hence, Arabidopsis is a relevant model for studying the intraspecies genetic variation involved in stress tolerance (Weigel and Nordborg, 2015). The 1001 Genomes Project collected high density genotype data averaging one SNP every 10 base pairs for a large set of geo-localized accessions (Alonso-Blanco et al., 2016). Many traits related to abiotic stress such as salt, drought, heat, and freezing tolerance have been analyzed by GWAS in Arabidopsis (Baxter et al., 2010; Li et al., 2010; Verslues et al., 2014; Horton et al., 2016). A GWAS using 81 Arabidopsis accessions identified 30 significant SNP markers (p < 10−4) associated with a survival score after submergence (Vashisht et al., 2016).
To identify genetic loci with importance for submergence tolerance, we characterized a collection of 387 Arabidopsis accessions for a set of seven physiologically important traits. Highly significant associations (P < 5 × 10⁻⁸) of SNPs were determined and candidate genes identified. Gene functions highlight the importance of metabolic acclimation involving amino acid and carbohydrate metabolism for the survival of and recovery from submergence. The most plausible candidate gene encoding ACONITASE3 (ACO3) was further characterized and validated by analyses of knockout and overexpression lines, which showed decreased and increased stress tolerance, respectively.
Results
Genotypic variation in 387 Arabidopsis accessions after submergence and desubmergence
For the analysis of the natural genetic variation in submergence tolerance in Arabidopsis, 387 genetically highly diverse accessions were selected from the 1001 genomes project collection representing a wide distribution range and growth environments across Eurasia (Supplemental Figure S1 and Supplemental Table S1; Alonso-Blanco et al., 2016). These accessions were analyzed for their response to complete submergence and subsequent desubmergence by quantifying seven traits. These traits were the visual score (i.e. the proportion of green, vigorous leaves in the rosette categorized from 0 to 10; Figure 1A), tissue concentrations of nitrate, starch, protein, and chlorophyll, as well as (relative) water content and the maximum quantum yield of photosystem II (Fv/Fm). The traits were determined for three time points: before submergence (control), 13 days after submergence and 1-day post desubmergence (see “Materials and methods” for details) yielding a total of 20 GWA datasets. Examples of accessions with high, moderate and low score after submergence and desubmergence are shown in Figure 1A. The phenotypes of tolerant accession Lp2-6, moderately tolerant Col-0, and sensitive Ler-1 were consistent with previously published work (Yeung et al., 2018; Meng et al., 2020). The observed variability across all 387 accessions was trait specific (Figure 1B; Supplemental Table S2). Under control conditions the difference in relative water content and Fv/Fm was negligible, while the tissue concentrations of chlorophyll, nitrate, protein, and especially starch varied across the accessions (Figure 1B). After submergence, a general trend across all accessions was a decrease in quantified physiological parameters, except for the predictable increase in water content. The score and the Fv/Fm showed an increase in variation when compared to control conditions, indicative of contrasting tolerance and sensitivity across accessions (Figure 1B). The median for other quantified traits, i.e. tissue concentrations of nitrate, protein, and chlorophyll, halved during submergence treatment and their variation among accessions narrowed. Starch concentrations in many accessions trended towards zero after submergence and hence their distribution was most highly skewed among traits. While the nitrate concentration was variable among accessions growing in control conditions, it narrowed significantly after submergence. This is likely a consequence of reduced availability of nitrate after leaching from the soil or uptake by inhibition of transpiration (Tamang and Fukao, 2015), with a knockon effect on nitrogen-containing protein and chlorophyll (Figure 1B; Gaude et al., 2007; Krapp et al., 2011). After desubmergence, the score, relative water content, and Fv/Fm showed large variability in the accessions, demonstrating the range of tolerance and sensitivity to the consecutive submergence and desubmergence treatments (Figure 1B). The concentration of starch started to recover in most accessions and therefore the median concentration increased, suggesting an improved metabolic activity after return to standard growth conditions. This was mirrored by an increase in the protein concentration (and a slight increase in chlorophyll), while no increase in the median tissue concentration of nitrate was observed. This might indicate that in most accessions nitrate was assimilated into protein (Krapp et al., 2011), and subsequently chlorophyll biosynthesis (Gaude et al., 2007), and only few accessions had sufficient uptake capacity to increase nitrate concentrations in their leaf tissue 1-day post desubmergence.
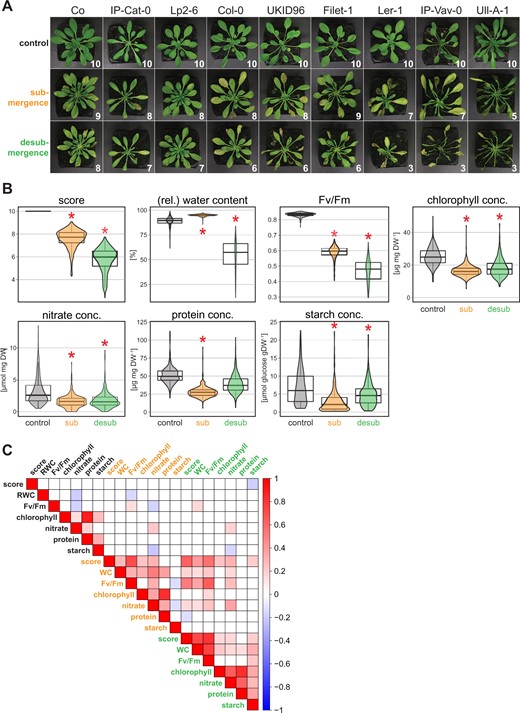
Trait quantification and their correlation in 387 Arabidopsis accessions. A, Phenotype of representative Arabidopsis accessions before submergence (control), after 13 days of submergence, and 1-day post desubmergence. The numbers indicate the visual score indicating the proportion of vigorous green leaves to total number of leaves (score 10 = all leaves vigorous, score 5 = 50% of leaves stress affected). B, Distributions of the seven quantified traits in 387 Arabidopsis accessions under the three experimental conditions (control; submergence, sub; desubmergence, desub). Asterisks indicate a statistically significant difference for a comparison of treatments against control (ANOVA, Tukey’s HSD test, P <0.01). The box plots indicate the first and third quartiles with a median line and the whiskers represent the 1.5× interquartile range. C, Pearson correlation of all determined traits under control (black text), submergence (orange text), and desubmergence (green text) conditions. For significant correlations (P <0.01) the color scale indicates the correlation coefficient (R).
Further analysis of the data showed positive correlation of all traits with one another, except for starch, after submergence (Figure 1C), with starch being negatively correlated with Fv/Fm and nitrate as expected (Krapp et al., 2011). After desubmergence there was a pronounced positive correlation between nitrate, protein, and chlorophyll concentrations, while the score and Fv/Fm showed only weak or no correlation to these metabolites, respectively (Figure 1C). This demonstrated that the ability to preserve leaf morphology and photosystem integrity is not directly linked to the increasing metabolic activity indicated by recovering protein, starch, and chlorophyll levels. Together the results suggest that tolerance or sensitivity to submergence and desubmergence might depend on a diverse set of acclimation mechanisms segregating among natural accessions of Arabidopsis.
Genome-wide association analyses identify candidate genes for submergence tolerance
The observed variation in submergence and desubmergence traits was used to identify genes underlying tolerance and sensitivity using a GWAS. This was performed using easyGWAS (Grimm et al., 2017) and the Efficient Mixed-Model Association eXpedited (EMMAX) algorithm (Kang et al., 2010; see Supplemental Figures S2 and S3 for all Manhattan and QQ plots). Further analyses focused only on statistically highly significant SNPs with a P < 5 × 10⁻⁸ in intragenic regions, i.e. exon, intron, and promoter sequences (2-kb upstream; Supplemental Table S3). This identified 35 highly significant SNPs with 22 associated genes for 9 out of the 20 data sets of treatment × trait combinations (Figure 2A; Supplemental Table S3).
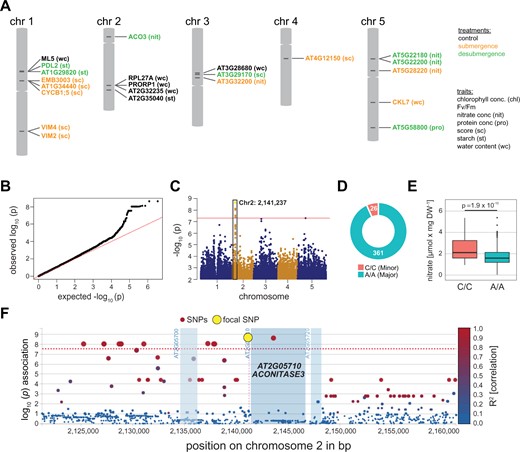
Highly significant SNPs for submergence and desubmergence across seven traits identified by GWAS. A, A total of 35 SNPs statistically significant (P < 5 × 10⁻⁸) associated with 22 genes were identified by GWAS for the seven traits (see trait abbreviations) and three conditions (highlighted by different colors) across the 387 analyzed accessions. See Supporting Information Table ST3 for a listing of all SNPs with detailed annotations. B–F, For the nitrate concentration after desubmergence highly significant SNPs were identified in the ACONITASE3 (ACO3) gene. B, QQ plot, C, Manhattan plot, D, allele distribution, E, trait quantification for accessions with major and minor alleles for SNPs. Statistical significance was determined by a Student’s t test. The box plots indicate the first and third quartiles with a median line and the whiskers represent the 1.5× interquartile range. F. Linkage disequilibrium (LD) plots of genomic region surrounding the focal SNP at ACO3. The R2 indicates the linkage coefficient of SNPs to the focal SNPs (yellow dot). The red line indicates the cut-off threshold for SNP statistical significance used.
The candidate genes identified related to tRNA processing (PROTEINACEOUS RNASE P 1 and PROTEINACEOUS RNASE P 2, PRORP1/2; control-water content data set), DNA modification (VARIANT IN METHYLATION (VIM) 2 and 4; submergence-score data set), and cell division (CYCLIN B1;5, CYCB1;5; submergence-score data set) (Supplemental Table S3). PRORP1 and PRORP2 are involved in controlling organellar gene expression (Zhou et al., 2015). VIM2 and VIM4 modulate DNA methylation and histone modification to control gene silencing (Kim et al., 2014), processes previously implicated in submergence and hypoxia (Tsuji et al., 2006; Loreti et al., 2020) and CYCB1;5 increases the formation of lateral roots under phosphate limitation (Pérez-Torres et al., 2008). Two candidate genes are associated with the mitochondrial TCA cycle, an important process for the tolerance to flooding stress (Supplemental Table S3; Voesenek and Bailey-Serres, 2015). For the score after submergence, which showed significant variation across accessions (Figure 1B), the focal SNP on chromosome 1 was located in an exon of gene EMBRYO DEFECTIVE (EMB) 3005 (AT1G34430). This gene encodes a dihydrolipoyl acetyltransferase (E2) family protein, which acts as a subunit of the pyruvate dehydrogenase (PDH) complex (Lin et al., 2003). The PDH complex is localized in both mitochondria and chloroplast with a function in conversion of pyruvate to acetyl-CoA, the latter fuelling the TCA cycle in mitochondria (Reid et al., 1977; Broz et al., 2014).
The second TCA cycle-related candidate gene was ACONITASE (ACO) 3, which was associated with the nitrate concentrations in plants 1-day post desubmergence. This trait had considerable variation among accessions (Figure 1B) and deviation of the expected from the observed association test statistics evident in the QQ-plot (Figure 2B) and the Manhattan plot (Figure 2C). There were 26 Arabidopsis accessions carrying the minor allele (C at Chr2: 2,141,237; Figure 2D), and these accessions had significantly (P = 1.9 × 10⁻¹⁰) higher nitrate concentration than the 361 accessions with major allele (A/A; Figure 2E; Supplemental Table S4). The focal SNP (P = 2.3 × 10⁻⁹) is localized in the promoter region of the ACO3 gene at 92-bp upstream of the start codon, in linkage with an intronic and several other upstream SNPs (Figure 2F). Aconitases catalyze the reversible isomerization of citrate to isocitrate in the TCA cycle with some isoforms showing dual localization in mitochondria and cytosol (Hentze and Kühn, 1996; Hooks et al., 2014). In Arabidopsis, ACO3 is one of three aconitase isoforms and exclusively localized to mitochondria in mature plants (Bernard et al., 2009; Pascual et al., 2021), suggesting a function for ACO3 in mitochondria in our experiments. In addition to the function of mitochondria in hypoxia stress (Wagner et al., 2018), our recent work has established their importance for the acclimation and adaptation to submergence (Meng et al., 2020). Data for ACO3 expression from these experiments show a two-fold upregulation in submergence-sensitive Arabidopsis accessions and mutants for the master regulator of mitochondrial retrograde signaling ANAC017 (Figure 3, A and B). Also, the overexpression of ANAC017 leads to an increase in ACO3 expression by about four-fold (Figure 3B; Meng et al., 2019). To test the binding of ANAC017 to the ACO3 promoter, we carried out chromatin immunoprecipitation sequencing (ChIP-seq) experiments using lines expressing a GFP-ANAC017 fusion protein under control of the ANAC017 promoter. Results demonstrate that ACO3 is one of the most significant (q-values ranging from 1.3 × 10−43 to 9.3 × 10⁻¹² and read enrichment ranging from 92- to 532-fold across treatments and three biological replicates each) targets of ANAC017 after the induction of mitochondrial stress (Figure 3C). Interestingly, the focal GWAS peak in the ACO3 promoter is centrally located in the ChIP peak and within a predicted ANAC017 binding motif. Taken together, these results made ACO3 the best candidate gene for further analyses.
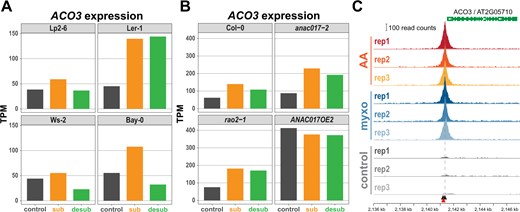
Regulation of ACO3 expression. A, ACO3 expression in two accessions sensitive to submergence (Ler-1, Bay-0) and two tolerant accessions (Lp2-6, Ws-2). B, ACO3 expression in the wild-type (Col-0) and mitochondrial signaling mutants for the transcription factor ANAC017 (anac017-2, rao2-1) that are sensitive to submergence, and in a submergence tolerant ANAC17 overexpressing line (ANAC017OE2). Data in (A) and (B) for plants submerged (sub) for 2 days and 1 day post desubmergence (desub) were extracted from Meng et al. (2020). C, ChIP-seq experiments using an ANAC017-GFP fusion protein identify an ANAC017 binding site that co-localizes with the focal GWAS SNP (indicated by a red arrow) in the ACO3 promoter. ChIP-seq was performed after the induction of mitochondrial stress by antimycin A (AA) and myxothiazol (myxo) and compared to mock treatment (control) (see “Materials and Methods” for details). Two ANAC017 binding motives (De Clercq et al., 2013) in the ACO3 promoter are indicated by black arrows.
ACO3 impacts submergence tolerance
To investigate the putative function of ACO3 for submergence tolerance, three ACO3 overexpression lines (ACO3OE1, ACO3OE3, ACO3OE7) were analyzed together with the aco3-1 mutant line described previously (Arnaud et al., 2007; Pascual et al., 2021; Figure 4). Quantification of ACO3 gene expression levels by reverse transcription quantitative real-time PCR (RT-qPCR) showed a three- to five-fold higher expression in the overexpression lines than in the wild-type and only residual transcript abundance in the aco3-1 mutant (Figure 4A; Supplemental Figure S4). The aco3-1 mutant line had slightly bigger rosette size than the wild-type under standard growth conditions (Figure 4, B and C). In contrast, the overexpression lines showed slightly delayed development and flowering with reduced rosette size and higher leaf number at flowering (Figure 4, B–F).

Altering ACO3 expression levels affects plant growth and development. Expression levels of ACO3 in the different genotypes correspond with their growth. A. ACO3 expression in the aco3-1 mutant and ACO3 overexpression lines relative to the wild-type (Col-0) quantified by RT-qPCR. Shown is the mean ± se of the -ΔΔCT value determined in pooled rosette leaves of three independent plants. B–F, Phenotypic analysis of ACO3 overexpression and mutant lines grown on soil in a 14-h light/10-h dark cycle. B, Representative pictures for each genotype at indicated time points. C, Maximum rosette radius of genotypes at indicated time points. D, Representative leaf phenotypes (scale bars indicate 1 cm) and leaf numbers ± se at time of bolting, E, leaf numbers at indicated time points. F, Growth stage progression in the five analyzed genotypes according to Boyes et al. (2001): 1.04 (four rosette leaves >1 mm in length), 1.08 (eight rosette leaves >1 mm in length), 1.10 (ten rosette leaves>1 mm in length), 5.1 (first flower buds visible). C–F, At least 17 plants per genotype were used for all phenotypic analyses and given are the mean ± se. Asterisks indicate statistically significant differences (ANOVA, Tukey’s HSD test, P < 0.05) from the wild-type.
For subsequent submergence experiments, phenotypic assessment and physiological characterization were performed as for the GWAS experiment at 13 days after submergence in the light and 1-day post desubmergence, respectively (Figure 5A). The aco3-1 mutant plants showed more severe tissue damage than the other genotypes after the stress treatments. In contrast, the three ACO3 overexpression lines showed only mild stress symptoms (Figure 5A). The expression quantified by RNA-seq (see below for detailed global analyses) for the three ACO isogenes showed a downregulation of ACO1 after submergence and desubmergence by about two-fold in all three analyzed genotypes (Col-0, aco3-1 mutant, overexpression line ACO3OE3), while ACO2 expression increased by two-fold. As expected from previous experiments (Meng et al., 2020), ACO3 expression was increased by about two-fold in Col-0, while abundance of nonfunctional residual transcripts (Supplemental Figure S4) decreased in the aco3-1 mutant (Figure 5B). Although already having a five-fold higher expression of ACO3 than the wild-type (Figure 4A), the overexpressing line ACO3OE3 showed a further increase in expression especially after desubmergence (above two-fold; Figure 5B). Confocal microscopy of transgenic lines expressing an ACO3-YFP fusion protein confirmed the mitochondrial localization under all three experimental conditions (Figure 5C), indicating a role for the increased ACO3 levels in the mitochondrial TCA cycle.
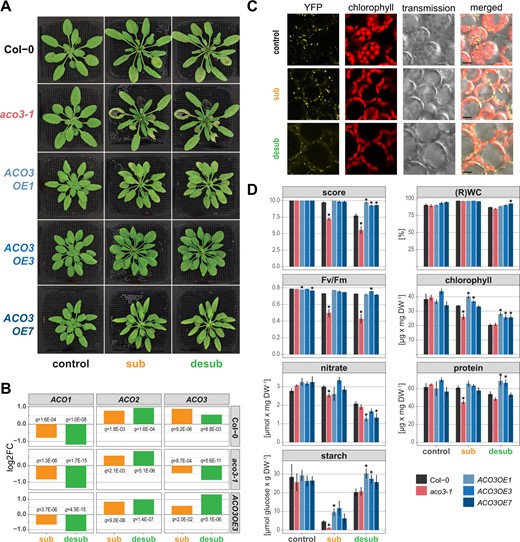
Quantitative changes in traits after submergence and desubmergence in aco3-1 knockout and ACO3 overexpression lines. A, Representative images of the wild-type (Col-0), aco3-1 mutant, and the three independent ACO3 overexpression lines before submergence (control), after 13 days submergence (sub) and 1 day after desubmergence (desub). B, Changes in the expression of the three Arabidopsis ACO isogenes in the indicated genotypes after 13 days submergence (sub) and 1 day after desubmergence (desub). Given are the log2 of fold changes when compared to control and the false discovery rates (q-values). C, Sub-cellular localization of a ACO3-YFP fusion protein before submergence (control), after 13 days submergence (sub) and 1 day after desubmergence (desub). Shown are confocal images for the fluorescence of YFP and chlorophyll as well as corresponding transmission and merged images. Scale indicates 10 µm. D, The score, concentrations of nitrate, protein, starch, and chlorophyll, as well as RWC and maximum quantum yield of photosystem II (Fv/Fm) of the wild-type (Col-0), aco3-1 mutant, and the three ACO3 overexpression lines in pooled rosette leaves under standard growth conditions (control), after 13 days of submergence and 1-day post desubmergence. Asterisks indicate statistically significant differences (ANOVA, Tukey’s HSD test, P < 0.05) of the mutant and overexpression lines from the wild-type Col-0. Given are mean ± se of three biological replicates.
Quantification of the seven traits also used for the GWAS experiments largely confirmed the qualitative phenotypic analyses (Figure 5D). Stress-sensitive aco3-1 mutant had significantly (P < 0.05) lower score, Fv/Fm, and concentrations of protein, chlorophyll starch, and nitrate than the wild-type after 13 days of submergence (Figure 5D). One-day post desubmergence, significant differences in aco3-1 compared to the wild-type were more limited, largely because the values for the wild-type declined to aco3-1 mutant levels for concentrations of nitrate, proteins, and chlorophyll, while aco3-1 levels recovered to wild-type levels for starch. However, Fv/Fm remained below wild-type values post-desubmergence (Figure 5D). For the ACO3 overexpressing lines chlorophyll and starch concentrations were higher than the wild-type after submergence. After desubmergence nitrate concentrations were lower than the wild-type, while score, protein, chlorophyll, and starch concentrations were higher.
Taken together, these data suggest that changes in mitochondrial ACO3 expression in the Col-0 accession impact physiological parameters, with the loss of ACO3 function leading to increased sensitivity to submergence, while increased expression supports tolerance.
Changes of constitutive gene expression in ACO3 mutant and overexpression lines impact stress signaling pathways
The analysis of phenotypic and physiological parameters supports the importance of ACO3 for (de)submergence tolerance and is therefore consistent with its identification by GWAS. To gain further insight, changes in gene expression were analyzed by RNA-seq for the aco3-1 mutant and the ACO3OE3 overexpression line.
Under standard growth conditions there were 257 and 414 differentially expressed genes (DEGs; defined by fold change >2 and false discovery rate (FDR) < 0.05; Supplemental Table S5), when compared to the wild-type, in the aco3-1 and ACO3OE3 lines, respectively, with 46 DEGs overlapping in both genotypes (Figure 6A). For the downregulated DEGs in aco3-1 enriched gene ontology (GO) terms were related to ethylene signaling, hypoxia, cell death, and leaf senescence (Figure 6B). Genes associated to these GO terms included ETHYLENE RESPONSE DNA-BINDING FACTOR (EDF) 1, 2, and 4, ETHYLENE RESPONSE FACTOR 6 (ERF6), MAP KINASE KINSASE (MKK) 9, and RELATED TO AP 2.3 (RAP2.3; Figure 6B; Supplemental Table S6). EDF1/2/4 are transcription factors mediating ethylene-dependent gene expression directly downstream of the master regulator EIN3 (Chang et al., 2013). These three EDFs are also regulators of ethylene-dependent senescence mechanisms (Woo et al., 2010; Chen et al., 2015). ERF6 is part of the detoxification signaling network after oxidative stress (Vermeirssen et al., 2014) and involved in chloroplastic signaling under high light stress via MAP KINASE (MPK) 6 (Vogel et al., 2014). MKK9, together with MPK6, phosphorylates EIN3 and its overexpression leads to constitutive ethylene signaling and synthesis (Xu et al., 2008; Yoo et al., 2008). RAP2.3 is a member of the group VII ERFs which are the key regulators in the N-end rule pathway of oxygen sensing and hypoxia responses (Gasch et al., 2016).
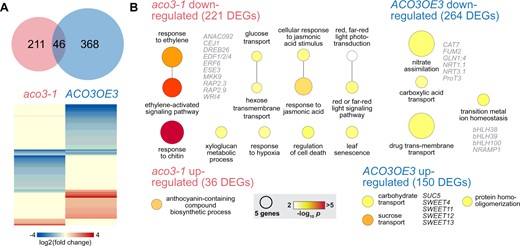
Differential gene expression in aco3-1 mutant and ACO3OE3 overexpressing lines under standard growth conditions. Expression of genes in the aco3-1 mutant and ACO3OE3 overexpressing lines was compared to the wild-type (Col-0) using RNA-seq. A. The aco3-1 and ACO3OE3 line had 257 and 414 DEGs, respectively, with 46 overlapping in both lines. The heatmap indicates the extent of changes in expression in both genotypes. B, GO term enrichment analysis for up- and downregulated DEGs in the aco3-1 and ACO3OE3 lines. The size of the circles indicates the number of genes associated with the GO term and the circle color the corresponding P-value for enrichment after Bonferroni correction. Functionally interesting DEGs within the GO terms and discussed in the text are indicated.
GO terms enriched for DEGs downregulated in the ACO3OE3 line were related to metal homeostasis, nitrogen assimilation, and the TCA cycle (Figure 6B; Supplemental Table S6). Genes associated with metal homeostasis were the major regulators of iron deficiency responses BASIC HELIX-LOOP-HELIX (bHLH) 38, bHLH39, bHLH100, and NATURAL RESISTANCE-ASSOCIATED MACROPHAGE PROTEIN 1 (NRAMP1; Curie et al., 2000; Wang et al., 2013), which were downregulated by 16-fold (Supplemental Table S5). A role of the TCA cycle and its metabolic intermediates for iron homeostasis is well established (Vigani, 2012) and hence increased expression of ACO3, which itself is a Fe-S cluster containing enzyme, might impact this. The downregulation of these genes suggests changes in the assimilation of nitrogen into amino acids and/or their distribution in leaves of the ACO3OE3 line (Zhang and Fernie, 2018). In line with that, enriched GO terms for DEGs upregulated in ACO3OE3 were related to carbohydrate and sucrose transport. Corresponding genes were SWEET4, 11, 12, 13, and SUC5 (Figure 6B; Supplemental Table S6), all involved in export of sucrose through the phloem (Chen et al., 2012), suggesting altered carbon partitioning by changes in constitutive expression of the ACO3 gene (Zhang and Fernie, 2018).
Taken together these data suggest that even before the onset of stress aco3-1 mutant plants are impacted in signaling pathways important for the acclimation to submergence, especially by the downregulation of genes related to ethylene signaling. Similarly, ACO3 overexpression led to changes in the expression of genes important for the assimilation and partitioning of nitrogen, carbohydrates, and iron. These changes might therefore affect the tolerance of ACO3 mutant and overexpressing plants to flooding stress similar to metabolic priming (Djamei et al., 2011; Schwachtje et al., 2019).
Transcriptional responses to submergence and desubmergence in ACO3 mutant and overexpression lines
Next, we analyzed the global transcriptional responses of the wild-type, aco3-1, and ACO3OE3 lines to submergence and desubmergence compared to plants grown under normal growth conditions. After submergence the aco3-1 mutant had the highest number of DEGs (7,849 DEGs) and ACO3OE3 the lowest number (6,786 DEGs), with the wild-type in-between both (7,227 DEGs; Figure 7A; Supplemental Table S7). These numbers are consistent with the severity of the stress phenotypes (Figure 5). Post-desubmergence the number of DEGs decreased by 1,104 and 741 DEGs in the wild-type and ACO3OE3, respectively, indicating progressing recovery from the stress. In contrast, in aco3-1 the DEG number increased even further by 586 genes (Figure 7A).
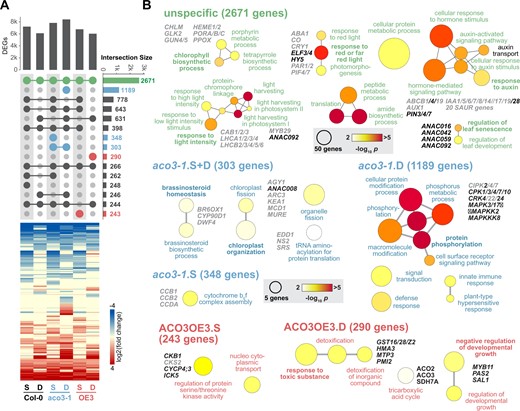
Transcriptomic responses to submergence and desubmergence in aco3-1 and ACO3OE3 lines. The transcriptomic response of the wild-type (Col-0), aco3-1 mutant, and ACO3OE3 overexpressing lines after 13 days of submergence (S) and 1 day after desubmergence (D) was analyzed by RNA-seq. A, For the two stress treatments the number of DEGs and their overlaps are represented as an UpSet plot (Conway et al., 2017). The vertical bar chart gives the number of DEGs in the different genotypes and conditions, while the number of overlapping DEGs is represented by horizontal bars. The dot matrix indicates the respective overlaps by connected circles. For example, the common stress response in all three genotypes across the two treatments consisted of 2,671 DEGs, while 1,189 DEGs were specific for aco3-1 after desubmergence. Intersects specific for the aco3-1 mutant and ACO3OE3 overexpressing lines are indicated in blue and red, respectively. The heat map represents the log2 of fold changes (submergence or desubmergence versus control) for the DEGs after hierarchical clustering using a Euclidian distance algorithm. B, For the DEGs common in the three genotypes and specific to aco3-1 and ACO3OE3 in two stress treatments in (A) a GO term enrichment analysis was carried out. The color scale indicates statistical significance for enriched GO terms (P < 0.01, after Bonferroni correction) and circle size the number of genes. Functionally important genes are given next to GO terms.
The common response of the three genotypes was characterized by 2,671 DEGs overlapping for the three genotypes (Figure 7A). A GO term enrichment analyses identified processes related to light responses and chlorophyll biosynthesis (Figure 7B; Supplemental Table S8). DEGs associated to these were a number of genes encoding chlorophyll a/b binding proteins, light-harvesting complex proteins, chlorophyll biosynthesis proteins, and some genes involved in chloroplast signaling such as GENOMES UNCOUPLED 4/5 and GOLDEN-LIKE 2 (Waters et al., 2008; Adhikari et al., 2011). Their downregulation is indicative of a reduced chloroplast and photosynthetic function under the stress. Another set of enriched GO terms was linked to auxin responses, likely due to changes in growth regulation (Figure 7B). This included nine downregulated members of the INDOLE-3-ACETIC ACID INDUCIBLE (IAA) genes, four auxin transporters (ATP-BINDING CASSETTE B 1/4/19, AUXIN RESISTANT 1), and 20 SMALL AUXIN UPREGULATED RNA genes, while genes encoding auxin transporters PINFORMED 3, 4, and 7 were upregulated. Another enriched GO term was “leaf senescence” and linked DEGs were the ANAC transcription factors ANAC016, ANAC042, ANAC059, and ANAC092. These ANACs are positive regulators of leaf senescence (Kim et al., 2016) and their upregulation is in agreement with the observed phenotype after (de)submergence (Figure 5). They were also identified as regulators in a gene regulatory network of submergence tolerance-related genes (Meng et al., 2020). Together the DEGs shared among genotypes are consistent with a general response involving metabolic and growth-related processes to acclimate to the compound stress.
The 303 DEGs common for submergence and desubmergence and for the 348 DEGs specific after submergence in aco3-1 are largely related to chloroplast function as evidenced by GO term enrichment analysis (Figure 7B; Supplemental Table S8). More specifically, for the former set of DEGs GO terms are related to chloroplast organization and fission, while for the latter they are linked to the assembly of the cytochrome b6f complex. The 1,189 DEGs specific for the response of aco3-1 to desubmergence were mainly associated with signaling pathways, especially protein phosphorylation (Figure 7B; Supplemental Table S8). Associated DEGs are linked to Ca2+ signaling via CALCIUM-DEPENDENT KINASES (CPKs) and CBL-INTERACTING PROTEIN KINASEs (CIPKs). Changes in Ca2+ fluxes after hypoxia and under energy deprivation are well established (Sedbrook et al., 1996; Igamberdiev and Hill, 2018), and in rice CIPK15 links oxygen sensing with carbohydrate metabolism under flooding stress (Lee et al., 2009). Several genes encoding members of the MAP kinase signaling cascade were also associated with the enriched GO terms (Figure 7B; Supplemental Table S8). MAPK3, induced in aco3-1 after desubmergence, is activated by mitochondrial ROS production after submergence and desubmergence as well as inhibition of mitochondrial electron transport with antimycin A in Arabidopsis (Chang et al., 2012). These data suggest an induction of two important pathways for hypoxia and flooding stress signalling in the aco3-1 mutant, but not the wild-type or ACO3 overexpression lines, after desubmergence, in agreement with a more severe phenotype.
For 243 DEGs specific to ACO3OE3 under submergence, enriched GO terms were related to the regulation of serine/threonine kinases and protein import into the nucleus (Figure 7B; Supplemental Table S8). These DEGs were mainly regulators of the cell cycle such as CYCLIN-DEPENDENT KINASE SUBUNIT 2 (CKS2), CYCLIN P4;3 (CYCP4;3), and INHIBITOR OF CDK 5 (ICK5). The 290 DEGs ACO3OE3-specific after desubmergence are linked to detoxification, the TCA cycle, and growth regulation (Figure7B). DEGs related to detoxification encoded three glutathione-S-transferases (GST16, 28, GSTZ2), metal transporters HEAVY METAL ATPASE 3 (HMA3), and METAL TOLERANCE PROTEIN 3 (MTP3), as well as PHOSPHOMANNOSE ISOMERASE 2 (PMI2). GST16 is involved in the mitigation of oxidative stress (Lee et al., 2014). HMA3 is a metal transporter contributing to the sequestration of heavy metals in the vacuole and increased expression, as seen in ACO3OE3 under desubmergence, improves tolerance to cadmium, zinc, cobalt, and lead (Morel et al., 2009). Similarly, upregulated MTP3 is controlling the distribution of zinc in plant tissues and tolerance to high Zn2+ tissue concentration (Arrivault et al., 2006). PMI2 belongs to a group of genes that are activated late in dark-induced senescence and carbohydrate starvation. It is also zinc binding and involved in the biosynthesis of ascorbic acid (Fujiki et al., 2000; Maruta et al., 2008).
Further analysis of the expression for all DEGs involved in primary nitrogen metabolism and TCA cycle showed their general upregulation after submergence and desubmergence (Figure 8). Especially the upregulation of nitrate and ammonium transporter genes is indicative for the activation of a nitrogen starvation response in all three genotypes (Krapp et al., 2011). However, some genes showed genotype-specific differences: NITRITE REDUCTASE, GLUTAMINE SYNTHETASE (GLN) 2, and GLUTAMATE SYNTHASE (GLU) 1 were more highly expressed in aco3-1 than in the wild-type or ACO3OE3 under control conditions, while ASPARAGINE SYNTHETASE (ASN) 2 was not upregulated in aco3-1 in contrast to the wild-type and ACO3OE3. Also, an increased expression of the nitrate transporters NRT2.5 and NAXT1 in all three genotypes after submergence was sustained under desubmergence in aco3-1 only. In the ACO3 overexpressing line GLN1;4 was not responsive to the stress treatments and ASN1 expression was highest in the control conditions, while upregulated after submergence in the wild-type and aco3-1. The expression of FUMARASE 2 was decreased in ACO3OE3 under control conditions, and it also decreased across all three genotypes after submergence and desubmergence. Malate dehydrogenase was upregulated after desubmergence in the wild-type and ACO3OE3, but not in aco3-1.
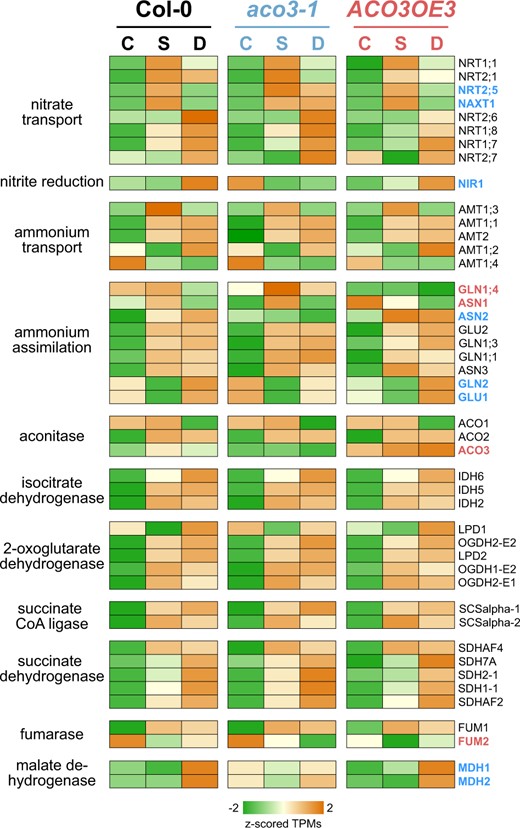
Expression of genes associated with nitrogen assimilation and the TCA cycle. Transcript levels for differentially expressed genes of for indicated steps in nitrogen assimilation and TCA cycle in the wild-type (Col-0), aco3-1, and ACO3OE3 plants under control conditions (C), after submergence (S), and after desubmergence (D). Genes showing differing response to the other two genotypes are indicated in blue and red for aco3-1 and ACO3OE3, respectively. Expression is given as z-scored TPM.
These results provide further support for a complex regulation of nitrogen assimilation and the TCA cycle during acclimation to submergence and desubmergence in general (Nakamura and Noguchi, 2020). Our data demonstrate how altered expression of ACO3 impacts those pathways and subsequently tolerance to the stresses.
Discussion
Genetic variation across naturally occurring accessions of a species is an important resource to analyze the adaptation to stresses. This study performed GWAS on 387 Arabidopsis accessions by quantifying traits impacted by submergence and important for stress acclimation and adaptation. A set of candidate genes were identified through their linkage to trait-associated SNPs and these may represent potential targets for the improvement of submergence tolerance in plants as evidenced by the further characterization of ACO3.
Our RNA-seq data suggests that reduced ACO3 expression in the aco3-1 mutant significantly impacts ethylene signaling pathways before the onset of flooding stress. Ethylene is the key regulator of many submergence and hypoxia responses (Hartman et al., 2019b), mediated by the oxygen-sensing N-end rule pathway via the class VII ERF transcription factors (van Dongen and Licausi, 2015). TCA cycle activity is regulated by ethylene through EIN3 to allow for metabolic acclimation after submergence by glutamate dehydrogenase (Tsai et al., 2016). Thus, the downregulation of several components of the ethylene pathway in aco3-1 plants under normal growth condition, including the class VII ERF RAP2.3, might have a detrimental effect on their ability to adjust to submergence stress potentially also via NO (Hartman et al., 2019a). The interaction of NO and ethylene during hypoxia and submergence is complex and crosstalk between the two signaling pathways is dynamic and involving feedback loops (Sasidharan et al., 2018). A regulatory relationship between NO3−/NO and ACO3 is also suggested by an increased expression of ACO3, and also ACO2, by about two- to three-fold in mutants lacking nitrate reductase activity (nia1nia2 double mutant) and NO synthesis activity (nia1nia2noa triple mutant) as shown previously (Gibbs et al., 2014), and by the higher expression of NITRITE REDUCTASE in the aco3-1 mutant. In contrast, increased expression of genes encoding several sucrose transporters (SWEET4/11/12/13, SUC5) observed in ACO3 overexpressing lines could have beneficial consequences for stress tolerances. SWEET transporters are important for the phloem loading of sucrose for transport to sink tissues (Chen et al., 2012) and involved in the plant’s stress response. The overexpression of SWEET4 increases freezing tolerance (Liu et al., 2016), while SWEET11 and SWEET12 are upregulated in water-stressed plants to facilitate sucrose export from source tissues (Durand et al., 2016). These changes in ACO3 overexpression lines could induce metabolic priming that prepares the plants for a subsequent onset of stress (Djamei et al., 2011; Schwachtje et al., 2019). In addition, ACO is highly sensitive to oxidative stress and its activity only recovers very slowly (Lehmann et al., 2012). This, in conjunction with a generally slower oxidative stress recovery of mitochondria than cytosol and chloroplast (Schwarzländer et al., 2009), might explain why TCA cycle components such as ACO3 have impact on flooding stress tolerance.
The importance of mitochondrial function for the acclimation and adaptation to submergence stress has been highlighted before (Meng et al., 2020) together with their more general function as stress sensors involving mitochondrial retrograde signaling (Wagner et al., 2018; Wang et al., 2020). Our finding that the transcription factor ANAC017, a key regulator of the mitochondrial retrograde signaling, directly binds to the ACO3 promoter under mitochondrial stress, together with ACO3 localization to mitochondria, supports a function of mitochondrial ACO3 during stress responses. Furthermore, the localization of the focal SNP within the ANC017 binding site identified by GWAS further confirms a key function of a ANAC017-dependent regulation under submergence stress (Meng et al., 2020). This was further corroborated for submergence by analysis of mutant and overexpressing lines and subsequent RNA-seq. A more general role of mitochondrial ACO3 in stress responses is also confirmed by our recent finding that ACO3, and its phosphorylation, contributes to UV-B- and antimycin A-induced stress tolerance which is dependent on ANAC017 (Pascual et al., 2021). In addition, this work suggested that ACO3 phosphorylation upon stress requires de novo synthesis of the protein and accentuates the induction of marker genes of mitochondrial stress such as AOX1a, ANAC013, and SULFOTRANSFERASE 12 (Pascual et al., 2021). Here, we find an increased abundance of ACO3 transcripts after 13 days of submergence in lines overexpressing the gene (Figure 5B). This may be caused by altered turn-over of the transcript rather than transcriptional induction via the constitutive 35S promoter used in those lines. Combined our studies indicate a transcriptional regulation on the gene level as well as post-transcriptional and post-translational regulation on the protein level to control ACO3 activity under stress conditions.
Redox balance is also critical for flooding tolerance and by supplying substrate for isocitrate dehydrogenase, ACO activity contributes to NADH production to increase the availability of reducing equivalents under stress (Mhamdi et al., 2010). Given ACO is sensitive to oxidative stress and inactivated by H2O2 and NO treatments (Verniquet et al., 1991; Navarre et al., 2000), the increased ACO3 expression under submergence could be a compensatory mechanisms to maintain mitochondrial ACO activity. Additionally, the inhibition of ACO caused by NO leads to citrate accumulation, which acts as a mitochondrial retrograde signal inducing ALTERNATIVE OXIDASE (AOX) expression under hypoxia (Gupta et al., 2012). A cyclic reaction of nitrate reduction to NO and re-oxidation by hypoxia-induced hemoglobin with very high O2 affinity was proposed to maintain NAD+/NADH balance and redox status (Igamberdiev and Hill, 2004; Horchani and Aschi-Smiti, 2010). Transcriptional regulation of ACO3 expression under submergence might therefore be beneficial to sustain this NO3−/NO cycling and ATP production.
As a major macro nutrient, nitrogen is essential for the biosynthesis of proteins, nucleic acids, chlorophyll, and hormones (Williams and Miller, 2001). Flooding removes nutrients from the soil impacting nutrient availability, while it represses transpiration leading to reduced uptake and transport of nitrate and ammonium (Pang et al., 2006; Setter et al., 2010; Tamang and Fukao, 2015). Nitrate application enhances the tolerance of plants to hypoxia (Drew and Sisworo, 1977; Allègre et al., 2004; Oliveira et al., 2013) and amino acid synthesis is induced, which is dependent on nitrate reduction by NR, the first enzyme of nitrogen assimilation (Gupta et al., 2012). An impaired ACO reduces the biosynthesis of ATP and 2-oxoglutarate, which also impacts nitrate assimilation and carbon metabolism (Carrari et al., 2003; Taylor et al., 2004; Gupta et al., 2012). Similarly, tomato (Solanum lycopersicum) lines with reduced transcript levels for the TCA cycle enzymes isocitrate dehydrogenase and citrate synthase show altered nitrate assimilation, carbon partitioning, and protein concentrations (Sienkiewicz-Porzucek et al., 2008; Sienkiewicz-Porzucek et al., 2010). In addition, mitochondrial ACO has major control over the flux through the TCA cycle and a reduced activity leads to lower levels of TCA cycle intermediates (Carrari et al., 2003; ARAÚJO et al., 2012). Thus, ACO3 activity may be important during submergence and after desubmergence as metabolism of both nitrogen and carbon supports supply of energy and proteins for acclimation responses and plant recovery. The observed lower concentration of nitrate and higher concentration of proteins, chlorophyll, and starch in the ACO3 overexpressing lines after desubmergence support a role of ACO3 in converting nitrate into downstream metabolites under this stress.
Although our study establishes a role for mitochondrial ACO3 in submergence tolerance, further investigation is needed to determine the specific function of ACO3 in the metabolic acclimation. Recent evidence suggests that under hypoxia mitochondrial aconitase is inhibited by NO by up to 80% while the cytosolic activity is only marginally affected (Jayawardhane et al., 2020). On the other hand, it seems surprising that the aco3-1 mutant has no observable phenotype under standard growth conditions in our experiments or earlier reports (Arnaud et al., 2007; Pascual et al., 2021). Similarly, the loss of mitochondrial aconitase activity in tomato results in only a minor growth retardation at early seedling stage while showing increased photosynthetic rates and increased sucrose synthesis at later growth stages (Carrari et al., 2003). Together these observations suggest cytosolic aconitase, noncyclic flux modes of the TCA cycle and/or transport of intermediates across the mitochondrial membranes have a role during acclimation to stress (Sweetlove et al., 2010; ARAÚJO et al., 2012). The quantification of TCA cycle components and associated intermediates, in conjunction with our RNA-seq data, have potential to provide some further insight on the metabolic shifts involving aconitase (Hildebrandt, 2018). While the determination of steady-state metabolite levels is valuable, such measurements are often not reflecting the true flux through a pathway (Fernie and Morgan, 2013). Current evidence suggests this might be especially important for ACO3 as it has high control over the flux through the TCA cycle and is also highly abundant in mitochondria (ARAÚJO et al., 2012; Fuchs et al., 2020). Thus, future experiments on the role of ACO3 in stress acclimation will depend on deciphering changes of fluxes through the TCA cycle and interconnected pathways as well as compartmentation of metabolites that together lead to adjustment in carbon and nitrogen balance under unfavorable conditions. A study of metabolism and flux following oxidative stress in Arabidopsis roots revealed that citrate increased even after oxidative stress removal for up to 30 h, but that 13C label flux continued to decrease up to 24 h after stress removal suggesting other sources of citrate production (Lehmann et al., 2012). Feeding of isotopically labeled substrates containing 13C and 14N will be challenging to set up and control for plants submerged in a substantial volume of water and over a time-course (Tsubaki et al., 2020). Similarly, analyzing the compartmentation of labeled metabolites in damaged or senescing tissues also presents challenges for nonaqueous fractionation methods. The application of real-time measurement by newly developed and emerging biosensors for key compounds of the pathway might allow such compartment-resolved estimation of changes in metabolite levels and mitochondrial energy metabolism in the future (Walia et al., 2018; Wagner et al., 2018). This might be especially valuable as mitochondrial structure and function, their responses to stress and the involved signaling pathways are tissue specific which will not be captured by bulk tissue analyses (Armstrong et al., 2006; Berkowitz et al., 2021).
Materials and methods
Plant material and growth conditions
A total of 387 Arabidopsis (A. thaliana) accessions selected form the 1001 Genomes Project dataset were used in this study (Supplemental Table S1). Seeds were obtained from the Nottingham Arabidopsis Stock Centre (NASC). The aco3-1 T-DNA insertion mutant (Salk_013368), the generation of ACO3 overexpression, and ACO3-YFP lines was described previously (Arnaud et al., 2007; Pascual et al., 2021).
For experiments with accessions, plants were grown in parallel under temperature-controlled glasshouse conditions with 14 h of natural light for seeds harvesting. Seeds were then sown in a vermiculite, perlite and soil mixture (1:1:3) and cold stratified in the dark for 4 days. Five plants of each accession were grown under temperature-controlled glasshouse conditions with 14 h of natural light. At the four-leaf stage, the soil was covered with a black mesh with a small hole for the seedling to grow through. The mesh prevented the leaching of soil material during submergence experiments. Out of initially 425 accessions, plants of 38 accessions showed suboptimal growth before transfer to submergence and were discarded. Three representative plants of the remaining 387 accessions were chosen for subsequent experiments. For the submergence treatment, plants were completely submerged in tubs filled with water to a height of 30 cm and remained in a 14-h light/10-h dark cycle for 13 days. For desubmergence treatments, the plants were removed from the water and transferred to standard growth conditions as above for 1 day of recovery. Samples of leaf tissue were taken 2 h into the light cycle at indicated time points.
For experiments with ACO3 mutant and overexpression lines, plants were grown for 4 weeks in climate controlled chambers at 22°C/19°C (day/night), 65% relative humidity, 120 μmol·m−2·s−1 photosynthetic photon flux density, and 14 h/10 h (day/night) photoperiod before submergence experiments as described above. Samples of leaf tissue were taken 2 h into the light cycle at 13 days after submergence and 1 day post desubmergence. Five biological replicates (independently grown plants per replicate) were analyzed in the ACO3 experiments.
Trait assays and confocal microscopy
The score was quantified on a scale of 1–10 by the ratio of the vigorous, green leaves to the total number of rosette leaves (Figure 1). Plants were counted as viable if a new rosette leaf appeared within 3 days after desubmergence. Measurement of the maximum quantum yield of photosystem II (Fv/Fm) was determined as previously described (Rossel et al., 2006). After 20 min of dark acclimation, Fv/Fm was recorded after a saturating pulse using the IMAGING-PAM M-series Chlorophyll Fluorescence System (Walz).
(Relative) water content (RWC) was determined for whole rosettes. For samples of control and desubmergence conditions, the fresh weight (FW) of the whole rosette was weighed followed by complete submergence in water for 24 h, and then the turgid weight (TW) was measured. Subsequently, the rosette was dried at 65°C for 48 h with the dry weight (DW) measured. The RWC of control and desubmergence samples were calculated using the equation: RWC = (FW−DW)/(TW−DW) × 100. For samples of submergence conditions, the FW of the whole rosette was measured immediately after desubmergence and then dried at 65°C for 48 h with the DW measured. The water content under submergence was calculated by the equation: water content (%) = DW/FW × 100.
Chlorophyll was extracted twice with 80% ethanol and once with 50% ethanol. After complete extraction, the supernatants were pooled and measured with a spectrophotometer (BMG, SPECTROstar) as previously described (Cross et al., 2006). Starch was extracted and analyzed using a NAD(P)H-linked enzymatic assay (Hendriks et al., 2003). The protein was extracted and determined as described previously (Hendriks et al., 2003). The pellet from the ethanolic extraction was resuspended in 0.1 M sodium hydrate and incubated at 100°C for 30 min. The protein was measured following the Bradford method (Bradford, 1976) using an assay kit (Bio-Rad) with a spectrophotometer (BMG, SPECTROstar). Nitrate was quantified using a nitrate reductase enzymatic assay as previously described (Cross et al., 2006).
The methodology and parameters for confocal microscopy of the ACO3-YFP line were as described in Pascual et al. (2021).
Data analyses of the GWAS
Data from the GWAS was analyzed with easyGWAS (https://easygwas.ethz.ch/; Grimm et al., 2017). A total of 1,772,276 SNPs with a minor allele frequency >0.05 were used. Association analyses were carried out by the EMMAX model (Kang et al., 2010) which allows for correcting spurious associations due to population structure. For the null model, the percentage of variance explained by the random effect of the Kinship is 48.7% and the cumulative R2 of the fixed effects of the PCs is 1.9%. QQ plots computed using the qqman package in R were used to assess the performance of the EMMAX model to control for the inflation of P-values due to population structure. The linkage disequilibrium plots of the significant SNPs were also generated on the easyGWAS website (https://easygwas.ethz.ch/). The Bonferroni-corrected significance threshold controlling for multiple testing was adjusted to 5 × 10⁻⁸. A candidate gene was considered when a significantly associated SNP co-localized with the exon/intron or promoter (2-kb upstream) regions of the gene.
RNA-seq and bioinformatic analysis
For three biological replicates (pools of leaves 4, 5, and 6 of one independent plant per replicate) per treatment and genotype the tissue was ground using a Tissue Lyser II (QIAGEN). Total RNA was isolated with the Spectrum Plant Total RNA Kit followed by on-column DNase treatment according to the manufacturer’s instructions (Sigma-Aldrich). RNA-seq libraries were prepared using the TruSeq Stranded mRNA Library Prep Kit according to the manufacturer’s instructions (Illumina) and sequenced on a NextSeq500 system (Illumina) as 75-bp reads with an average quality score (Q30) of above 92%. Quality control was performed using the FastQC software (https://www.bioinformatics.babraham.ac.uk/projects/fastqc/). Transcript abundances as transcripts per million and estimated counts were quantified on a gene level by pseudoaligning reads against a k-mer index build from the representative transcript models downloaded for the Araport 11 annotation using a k-mer length of 31 (Cheng et al., 2017) using the kallisto program with 100 bootstraps (Bray et al., 2016), yielding on average 14.7 M pseudo-aligned reads per sample. Only genes with at least five counts in a quarter of all samples were included in the further analysis. The program sleuth with a Wald’s test was used to test for differential gene expression (Pimentel et al., 2017). Genes were called as differentially expressed with a |log2 (fold change)|>1 and false discovery rate FDR < 0.05. For further analyses the Partek Genomics software suite version 6.16 (Partek Incorporated, http://www.partek.com/) was used. GO term enrichment analysis was performed using the ClueGO plugin for Cytoscape (Bindea et al., 2009).
ChIP-seq
proANAC017:GFP-ANAC017 plants were generated by cloning the open reading frame (ORF) of ANAC017 into pK7m34GW (Karimi et al., 2002). For this, the 2-kb upstream region of the translational start site of ANAC017 (proANAC017) was amplified by PCR from Arabidopsis Col-0 genomic DNA and cloned into the vector pDONR P4-P1r (Invitrogen). GFP-Linker was cloned into pDONR221 (Invitrogen) and the ORF of ANAC017 without start codon was cloned into pDONR P2r-P3 (Invitrogen) The final proANAC017:GFP-ANAC017 construct was created by recombination of these constructs into the MultiSite destination vector pK7m34GW using Gateway technology according to the manufacture (Invitrogen). Constructs were transformed into Arabidopsis Col-0 by Agrobacterium tumefaciens-mediated floral dipping (Clough and Bent, 1998).
For ChIP-seq experiments, approximately 100 mg of proANAC017:GFP-ANAC017 seeds were grown under a 16 h: 8 h day: night photoperiod at 23°C with 100 μmol·m−2·s−1 photosynthetic photon flux density for 12 days on B5 media with 1% (w/v) sucrose, 0.8% (w/v) agar. Samples were spray-treated with 50-µM antimycin A (AA) + 0.01% (v/v) Tween-20, 50-µM myxothiazol (myxo) + 0.01% (v/v) Tween-20, or 0.01% (v/v) Tween-20 for control treatments. ChIP was performed as described previously (Chang et al., 2013) with three biological replicates (pooled seedlings from one plate per replicate) per treatment and 10 µg of anti-GFP antibodies (A11122, Thermo Fisher Scientific). ChIP-seq libraries were generated with the Accel-NGS 2S Plus DNA Library Kit following the manufacturer’s instructions (Swift Biosciences) and sequenced on a NextSeq500 platform (Illumina) with an 84-bp read length. Reads were mapped to the Arabidopsis reference genome (TAIR10) using Bowtie2 (Langmead and Salzberg, 2012). ChIP-seq peaks were called with the MACS2 software using default parameters (Zhang and Fernie, 2008).
Statistical analysis
All statistical analyses were performed using the R computing environment with base statistics functions.
Data availability
RNA-seq read data and ChIP-seq data were deposited at the NCBI SRA database under project ID PRJNA662689 and PRJNA699617, respectively.
Accession numbers
Sequence data from this article and further gene information can be found in the TAIR10 database (www.arabidopsis.org) _using the gene names given in this article.
Supplemental data
The following materials are available in the online version of this article.
Supplemental Figure S1. Map of origin for 387 Arabidopsis accessions used in this study.
Supplemental Figure S2. Manhattan plots (EMMAX model) of SNPs associated with each trait under control, submergence, and desubmergence conditions.
Supplemental Figure S3. QQplot (EMMAX model) of SNPs associated with each trait under control, submergence, and desubmergence conditions.
Supplemental Figure S4. RNA-seq read coverage for Col-0, aco3-1, and ACO3OE3.
Supplemental Table S1. Information on Arabidopsis accessions used in this paper.
Supplemental Table S2. The data of each trait. C, S, and D indicate control, submergence, and desubmergence, respectively.
Supplemental Table S3. The 35 statistically significant (P < 5 × 10⁻⁸) SNPs associated to each trait under control, submergence, and desubmergence conditions.
Supplemental Table S4. SNP distribution for the ACO3 locus across 387 accessions.
Supplemental Table S5. Log2 fold changes of differentially expressed genes as shown in Figure 6A.
Supplemental Table S6. GO term enrichment analysis for gene differentially expressed in aco3-1 and ACO3OE3 (Figure 6B).
Supplemental Table S7. Log2 fold changes of DEGs as shown in Figure 7A.
Supplemental Table S8. GO term enrichment analysis for gene differentially expressed in aco3-1 and ACO3OE3 after submergence and desubmergence (Figure 7B).
J.W., O.B., and X.M. designed the research. X.M., L.L., J.P., M.R., C.H., and C.Y. performed the research; X.M., O.B., L.L., J.P., M.R., C.Y., R.J., C.H., J.B., A.F.L., S.K., and J.W. collected, analyzed, or interpreted the data; O.B., X.M., and J.W. wrote the manuscript with contributions by all authors.
The author responsible for distribution of materials integral to the findings presented in this article in accordance with the policy described in the Instructions for Authors (https://dbpia.nl.go.kr/plphys/pages/general-instructions) is: James Whelan ([email protected]).
Acknowledgments
We also would like to thank Matteo Togninalli from the Machine Learning and Computational Biology Lab at ETH Zurich for the support on GWAS analysis. We also acknowledge Asha Haslem for technical assistance with RNA-seq library generation, Xishi Zhou (Nanjing Agricultural University) for help with assay development and the La Trobe University Genomics Platform for access to next-generation sequencing equipment.
Funding
This work was supported by the facilities of the Australian Research Council Centre of Excellence Program (CE140100008, ARC Centre of Excellence in Plant Energy Biology; J.W.; ARC Discovery Grant DP200102452; J.W.). X.M., L.L., and C.Y. were supported by a La Trobe University postgraduate research scholarship. X.M. was supported by the China Postdoctoral Science Foundation (2020M672156) and the Natural Science Foundation of Shandong Province (ZR2021QC028), L.L. was supported by the China Postdoctoral Science Foundation (2020M672046) and S.K., J.P., and M.R. were supported by Academy of Finland project 307719 and 345071, post-doctoral grant 325122, and the Center of Excellence program 307335.
Conflict of interest statement. The authors declare no conflict of interest.
References
FAO (
Author notes
Present address: The Key Laboratory of Plant Development and Environmental Adaptation Biology, Ministry of Education, School of Life Science, Shandong University, Qingdao 266237, China.
Present address: Plant Physiology, Department of Organisms and Systems Biology, University of Oviedo, 33071, Spain.
Senior author.
