


Abstract
Recent developments in both instrumentation and image analysis algorithms have allowed three-dimensional electron microscopy (3D-EM) to increase automated image collections through large tissue volumes using serial block-face scanning EM (SEM) and to achieve near-atomic resolution of macromolecular complexes using cryo-electron tomography (cryo-ET) and sub-tomogram averaging. In this review, we discuss applications of cryo-ET to cell biology research on plant and algal systems and the special opportunities they offer for understanding the organization of eukaryotic organelles with unprecedently resolution. However, one of the most challenging aspects for cryo-ET is sample preparation, especially for multicellular organisms. We also discuss correlative light and electron microscopy (CLEM) approaches that have been developed for ET at both room and cryogenic temperatures.
Introduction
Understanding the basic architecture of organelles and their structural variations among cell types is critical for analyzing their functions. The past decades have seen a revolution in microscopy approaches to study cellular biology, mostly in the fields of live-cell imaging using fluorescence microscopy, three-dimensional electron microscopy (3D-EM), and correlative light and electron microscopy (CLEM).
Fluorescence-based light microscopy allows us to visualize organelles and cellular processes with an ever-growing collection of genetically encoded reporters and chemical probes and to follow organelles and cellular processes through in vivo imaging. Although conventional light microscopy has a spatial resolution limit of 200 nm in the x–y plane (≥500 nm in z), super-resolution microscopy approaches such as stochastic optical reconstruction microscopy, structured illumination microscopy, photoactivated localization microscopy (PALM), and fluorescence photoactivation localization microscopy can reach practical lateral accuracy in the 20–100 nm range (Huang et al., 2010; Komis et al., 2015; Sahl et al., 2017; Schubert, 2017; Shaw et al., 2019). However, these methods can only detect targeted/selected fluorescence signals from either introduced probes or intrinsically fluorescent compounds, while the dynamics of untagged molecules, organelles, and processes go undetected. Thus, EM has become a powerful ally for cell biologists not only because of its higher resolving power but also for the capability to obtain complete 3D cellular information that can be combined with light microscopy imaging through CLEM approaches.
The most traditional way to obtain 3D information of relatively large areas of cells and tissues by EM is serial section transmission EM (ssTEM), that is, the sequential imaging of serial plastic sections that were cut from a fixed and resin-embedded sample using an ultramicrotome. This is a challenging and time-consuming approach that requires the training and skill to collect hundreds of sequential thin sections (40–60 nm thick) on grids for imaging. While the x–y resolution within the section plane can be ∼5 nm, the axial (z-axis) resolution of these 3D reconstructions is limited to twice the section thickness (McEwen and Marko, 2001), that is, 80–120 nm.
More recent approaches based on serial block-face scanning EM (SBF-SEM) have improved traditional ssTEM in two important ways: (1) fully automating sectioning/milling and image collection and thereby increasing throughput and (2) reducing the thickness of the material removed from the block surface resulting in drastic improvement in axial resolution (∼15–20 nm). In these techniques, a thin layer of material is removed from a fixed and resin-embedded sample either using an ultramicrotome mounted inside the SEM (SBF-SEM) or by milling with a focused ion beam (FIB-SEM) (Peddie and Collinson, 2014; Figure 1). After removal, a secondary backscattering SEM image is recorded of the freshly exposed block-face before the sequence of removal-imaging is repeated. FIB-SEM can ablate layers of just a few nanometers, reaching nearly isotropic resolution in all three axes (∼10 nm), optimizing image registration and post-processing reconstruction. In addition, data can be collected over days or even months with minimal intervention, resulting in large reconstructed volumes of tissues and cells (e.g. >106 µm3) (Xu et al., 2017).
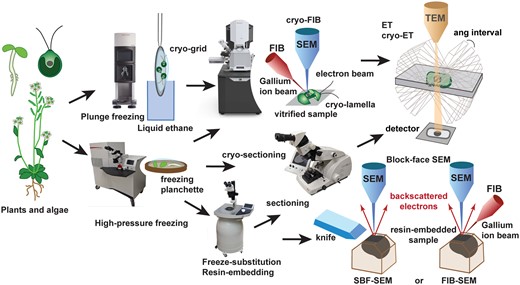
Overview of workflow and methods to image plant and algal material by 3D EM. Relatively small samples (single cells such as Chlamydomonas or isolated organelles) can be vitrified by plunge-freezing directly on EM-grids. If they are too thick (>300 nm) to be imaged directly by cryo-ET, they are milled by cryo-FIB to obtain thinner cryo-lamellae. Larger cells and excised pieces of multicellular tissues and organs are frozen under high pressure in a high-pressure freezer. The resulting vitrified samples can be sectioned by cryo-ultramicrotomy, milled by cryo-FIB, and imaged by cryo-ET or freeze-substituted and resin-embedded. Once embedded in resin, samples can be sectioned in an ultramicrotome, stained with heavy metals, and imaged by ET or serial block-face SEM, either using a knife for layer removal (SBF-SEM) or a focused ion beam (FIB-SEM).
In contrast to ssTEM and SBF-SEM, electron tomography (ET) is not based on serial sectioning; instead, 3D reconstructions are calculated from a series of 2D TEM images of the same cellular area viewed from different directions by tilting the sample under the electron beam. Once the 2D projection images are collected either along one or two tilt axes, tomograms are calculated using either Fourier or real-space methods (Brooks and Di Chiro, 1975; Ercius et al., 2015) with software packages like IMOD (Kremer et al., 1996). ET can be performed in sections obtained from resin-embedded samples or thin lamellae of frozen-hydrated samples (cryo-ET). The resolution of ET is dependent on the tilt geometry and signal-to-noise ratio. The axial resolution is typically within one to two times of the x–y resolution. For example, the resolution of a well-preserved fixed and resin-embedded sample can be almost isotropic at 4–5 nm, whereas raw cryo-tomogram are often noise-limited to worse than 10 nm. When cryo-ET is combined with other approaches such as sub-tomogram averaging, the resolution can be 2–3 nm or even better (Briggs, 2013; Schur et al., 2014; Castano-Diez et al., 2017). Although plastic-section ET can be performed on serial sections, it is only practical for relatively small volumes within cells (Figure 2).
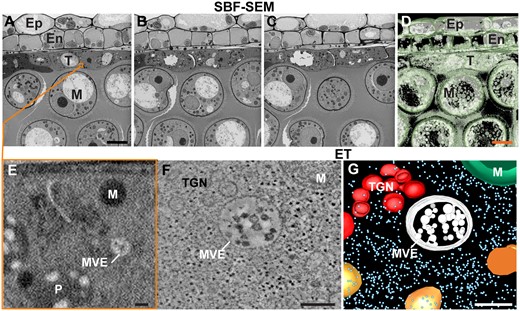
3D EM analysis of high-pressure frozen/freeze-substituted A. thaliana anthers using SBF-SEM and ET. A–C, Three serial block face EM images depicting the anther cell wall layers, i.e. the epidermis (Ep), endothecium (En), and tapetum (T), and the developing microspores (M) in the anther locule processed as explained in Czymmek et al. (2020). D, Isosurface visualization of anther wall layers and microspores from 64 serial block face SEM images. E, Enlarged view of tapetal cell region highlighted by orange square in (A). Note that the resolution is too low to discern most structural features of cytoplasmic organelles such as the membranes of mitochondria (M), multivesicular endosomes (MVE), and plastids (P). This is due to a tradeoff between the size of the reconstructed area (i.e. low magnification to increase the field of view) and the resolution (i.e. lower resolution due to large pixel size). In this SBF-SEM image dataset, the magnification was chosen to capture multiple cell layers and microspores within the anther resulted in limited subcellular resolution. F, G, Tomographic slice (F) and tomographic model (G) of a portion of cytoplasm from a tapetal cells showing an MVE, a TGN, and a mitochondrion (M). Scale bar = 5 µm in A–D; 100 nm in E–G.
Different 3D EM modalities in cell biology have advantages and drawbacks as well as their own requirements in terms of sample preparation, compatibility with CLEM approaches, resolution, and reconstructed cellular volume size. In this review, we discuss sample preparation options for different 3D EM modalities and how their applications have transformed plant cell biology.
Sample preparation for 3D EM
The quality of cellular preservation is critical for both resolution and reliability of the imaging data. Traditional methods to preserve samples for EM imaging are based on chemical fixation, dehydration, resin embedding, sectioning, and staining with heavy metals for increased contrast. Chemical fixation and dehydration can drastically affect the structure of membranes and cytosol, generating unwanted artifacts. For this reason, rapid cryofixation (cryo-immobilization) at either atmospheric or high pressure followed by freeze-substitution is the preferred method for sample preparation as it achieves better preservation of cellular structures than chemical fixation. However, insufficient freezing rates result in the formation of ice crystals that produce significant damage in cells and tissues. In fact, at atmospheric pressure, freezing with no detectable ice crystal damage can only be achieved within ∼10 µm from the sample surface (Dubochet, 2007). For freezing of larger volumes (up to 200-µm deep into the sample), such as dissected portions of leaves, roots, flowers, or cell cultures, freezing under high pressure (∼2,000 atm) is required (Gilkey and Staehelin, 1986; McDonald, 2009). The existing high-pressure freezers can accommodate biological samples submerged in cryoprotectants within freezing planchettes that are 3-mm or 6-mm wide and up to 0.6-mm deep (Otegui, 2020).
High-pressure frozen samples can be subjected to freeze substitution, a process by which the frozen water in the sample is replaced by a solvent (e.g. acetone) at −80°C to −90°C. Different types of fixatives (e.g. osmium tetroxide, glutaraldehyde, uranyl acetate) can be added to the freeze-substitution medium to both fix the cellular components and enhance their contrast. This process can be performed manually using dry ice or in automated freeze-substitution devices (Figure 1; Otegui, 2020). Once the sample is dehydrated through freeze substitution, it can be embedded in epoxy or acrylic resins. For ET, the resin-embedded sample is sectioned in an ultramicrotome to obtain 200- to 300-nm-thick sections, stained with heavy metal solutions to enhance contrast, and typically imaged in a TEM operating at 200–300 kV at room temperature (Figure 1). For SBF-SEM, samples must be properly contrasted before resin embedding. Protocols have been developed to enhance contrast in high-pressure frozen/freeze-substituted samples by introducing in-block osmiophilic thiocarbohydrazide incubation steps prior to resin-embedding (Seligman et al., 1966; Deerinck et al., 2010; Czymmek et al., 2020; Figure 2, A–E).
Although high-pressure freezing followed by freeze substitution is currently the best method for cellular preservation when resin-embedding is required (e.g. ssTEM, SBF-SEM, and ET), it still relies on the action of chemical fixatives and electron-dense stains to enhance contrast. Instead, cryo-EM allows for the visualization of frozen-hydrated molecules, organelles, or cells close to their native state (neither chemically fixed nor stained with heavy metals), providing the most faithful structural preservation possible (Pierson et al., 2011; Milne et al., 2013; Beck and Baumeister, 2016; Oikonomou and Jensen, 2017). The application of cryo-ET to cell biology has revolutionized the field thanks to an extraordinary development of technology for facilitating cryo-preparation of samples, a generation of direct electron detectors for data collection, other advances of hardware (e.g. phase plate), and algorithms for image processing and analysis (Beck and Baumeister, 2016; Oikonomou and Jensen, 2017; Hutchings and Zanetti, 2018).
For both ET and cryo-ET, sample thickness is a limiting factor. With electron microscopes operating at accelerating voltages of 200–300 kV, both methods can image sections up to 200–300 nm thick. Whereas obtaining sections from resin-embedded material using an ultramicrotome is a relatively routine task, producing thin specimens of frozen-hydrated eukaryotic cells or tissues is technically challenging. Traditionally, this has been achieved by ultramicrotomy at cryogenic temperature using a diamond knife (“CEMOVIS”, Dubochet, 1988; Al-Amoudi et al., 2004; Bouchet-Marquis and Hoenger, 2011). For example, cryo-ET of cryosections obtained through CEMOVIS has revealed the 3D structure of chloroplasts and isolated thylakoid membranes from spinach (Spinacia oleracea) and pea (Pisum sativum) cells with molecular resolution (Daum et al., 2010). However, this is a difficult technique, even when done with micromanipulators and other accessories designed for handling vitrified material (Pierson et al., 2010; Bouchet-Marquis and Hoenger, 2011; Studer et al., 2014; Kolovou et al., 2017). In addition, even if done properly, sectioning artifacts are common, such as compression of the vitrified sections that results in nonlinear distortion of the cellular structures (Richter, 1994; Al-Amoudi et al., 2005; Bouchet-Marquis and Hoenger, 2011).
In most recent years, cryo-focused ion beam (cryo-FIB) milling (Rigort and Plitzko, 2015)has provided an alternative mean for thinning vitrified samples under cryogenic conditions using a gallium ion beam. The ion beam milling process can be monitored by SEM imaging under vacuum (Figure 1). Thin lamellae are obtained following two methods: (1) cells or organelles are plunge-frozen directly on an EM-grid and material is removed by FIB-milling leaving behind a thin lamella attached to the grid (in situ-lamella) that can be directly imaged by cryo-ET (Rigort and Plitzko, 2015) or (2) cryo-lamellae produced by cryo-FIB milling are lifted-out using a micromanipulator within the SEM and transferred to a grid for cryo-ET (Mahamid et al., 2015).
However, as discussed above, plunge-freezing at atmospheric pressure only works well for relatively small cells. Cells larger than 10 µm or dissected tissues need to be high-pressure frozen to achieve vitrification without ice crystal formation. In these cases, it is possible to combine CEMOVIS for the initial trimming of the frozen samples followed by thinning of cryo-lamellae by cryo-FIB (Marko et al., 2007; Hsieh et al., 2014).
In situ-lamella milling through cryo-FIB has worked very well for the unicellular green alga Chlamydomonas reinhardtii (Engel et al., 2015a, 2015b; Albert et al., 2017; Bykov et al., 2017; Mosalaganti et al., 2018). However, most plant cells and tissues are not amenable to plunge freezing. Adapting cryo-ET for plant samples will require high-pressure freezing followed by direct cryo-lamella FIB milling, such as the waffle method (Kelley et al., 2021), or a combination of CEMOVIS and cryo-FIB.
3D EM in plant cell biology
SBF-SEM
The ability to image large volumes of cells and tissues and even whole organs by SBF-SEM has been applied to a number of cellular studies, such as the structural analysis of the endoplasmic reticulum (ER) during the formation of protein bodies in the maize endosperm (Arcalís et al., 2020), the complex remodeling of the endomembrane system in the digestive gland cells of the fly trap (Dionaea) upon prey stimulation (Boulogne et al., 2020), and the dynamic protrusions of nuclear domains into neighboring meiocytes during meiosis in Nicotiana tabacum anthers (Mursalimov et al., 2021).
However, one of the most important contributions of SBF-SEM to cell biology is the ability to quantify morphometric features from multiple individual organelles/cells in large volumes of tissues. Inferring organelle structural features such as chloroplast surface area and volume from 2D TEM images is not only tedious but also prone to errors (Harwood et al., 2020). By combining morphometric data provided by SBF-SEM with proteomic and lipidomic analyses, Pipitone et al. (2021) revealed that during de-etiolation of Arabidopsis cotyledons, plastids undergo changes in two distinct phases that had not been appreciated previously. Within the first 24 h after light exposure in mesophyll cells, prolamellar bodies disappear, large amounts of thylakoid membranes form (surface area of thylakoids between 4 and 24 h after light exposure increases 22-fold), and chloroplast volume increases. Between 24 and 96 h, the increased rate in thylakoid surface area slows down and chloroplast start dividing, going from approximately 26–112 chloroplasts per cell (Pipitone et al., 2021).
In another study, researchers applied SBF-SEM to the quantitative analysis of plasmodesmata distribution in phloem unloading interfaces (e.g. between sieve elements and phloem pole pericycle and between phloem pole pericycle cells and the endodermis) as well as their cell wall environment in Arabidopsis thaliana (Paterlini et al., 2020). This quantitative information will be critical to inform computational models that estimate phloem fluxes.
Although a fully automated pipeline of sectioning and imaging allows for the collection of large data sets, image analysis remains a bottleneck. There are different commercial (e.g. Amira) and open-source software packages (e.g. FIJI) available and, although they provide some level of automated segmentation, in most cases time-consuming manual intervention is required.
ET of resin-embedded samples
As mentioned above, ET offers higher resolution than SBF-SEM but is restricted to small volumes (a few cubic microns in most cases; Figure 2, F and G). ET was first applied to plant tissues processed by high-pressure freezing/freeze-substitution to study cytokinesis in the endosperm of Arabidopsis (Otegui et al., 2001). This study allowed for the first time to appreciate the 3D complexity of the membrane intermediates that form during cell plate assembly and to detect putative motor proteins connecting secretory vesicles to phragmoplast microtubules. By performing quantitative analyses on the segmented tomograms, it was possible to calculate that approximately half a million Golgi-derived vesicles fuse at the division plane to generate a new endosperm cell wall while 75% of the total membrane delivered to the cell plate is removed by endocytosis (Otegui et al., 2001).
ET was later applied to a broad range of organelles and cellular processes such as preprophase band assembly (Karahara et al., 2009; Mineyuki, 2014; Takeuchi et al., 2016), phragmoplast organization (Austin et al., 2005), and cell plate maturation (Otegui and Staehelin, 2004; Segui-Simarro et al., 2004), Golgi and trans Golgi network (TGN) structure and dynamics (Otegui et al., 2006; Donohoe et al., 2007, 2013; Kang and Staehelin, 2008; Kang et al., 2011; Boutte et al., 2013; Engel et al., 2015a; Wang et al., 2017), 3D organization of the ER (Leitz et al., 2009), its association with lipid droplets (Brocard et al., 2017), and its contact sites with the plasma membrane (McFarlane et al., 2017) and other organelles (Stefano et al., 2015), the formation of vacuoles and endosomes/prevacuolar compartments (Otegui et al., 2006; Cui et al., 2019; Liu et al., 2021), endomembrane dynamics during the formation of protein storage vacuoles in maize aleurone cells (Reyes et al., 2011), changes in plasmodesma structural features during development (Nicolas et al., 2017), autophagic membranes dynamics (Zhuang et al., 2017), membrane and vacuolar remodeling during viral infections (Cao et al., 2015; Jin et al., 2018a, 2018b; Wang et al., 2021), and cell wall architecture (Sarkar et al., 2014).
In some cases, ET has changed our understanding of organelle structure and function. For example, the 3D organization of thylakoid membranes is very hard to discern exclusively from 2D TEM images. Based on variations in image collection and the resulting interpretations, different models were proposed in the 1960s to explain the connections between the stacked thylakoids within grana and stromal thylakoids (Staehelin and Paolillo, 2020). The models proposed by Heslop-Harrison (1963) and Wehrmeyer (1964) postulated that stroma thylakoids form sheets that connect to grana thylakoid through narrow connections following helical patterns. Many years later, both ET and cryo-ET studies, fully supported the helical model (Austin and Staehelin, 2011; Daum and Kuhlbrandt, 2011; Engel et al., 2015; Kowalewska et al., 2016) and showed a dynamic complex system of right- and left-handed helical thylakoid membranes of different sizes and pitches (Bussi et al., 2019), which may be critical for optimizing photosynthesis to different light conditions. A recent study in the single cell C4 photosynthesis species Bienertia sinuspersici has revealed structural insights about the differentiation of chloroplasts. In this species, chloroplasts are segregated into two groups in each mesophyll cell: central chloroplasts and peripheral chloroplasts (Mai et al., 2019). Whereas the peripheral chloroplasts fix atmospheric CO2 into a 4C-organic acid, central chloroplasts take the released CO2 from the decarboxylated 4C-organic acid and incorporate it into the Calvin cycle for sugar synthesis. The study also showed the mechanisms of thylakoid proliferation from both invagination of the inner envelope and the cleavage of existing grana thylakoids (Mai et al., 2019). In addition, an ET-based study showed that plastoglobules, which were once thought to be stromal globules, are in fact permanently attached to stroma thylakoids (Austin et al., 2006).
The improved axial resolution of ET has been instrumental in re-interpreting the structure of the multivesicular endosome, which was thought to be a rather simple organelle. Multivesicular endosomes are often depicted as spherical organelles with a few free intralumenal vesicles that sequester plasma membrane proteins targeted for degradation. The formation of these vesicles, which have been traditionally assumed to occur through membrane budding and scission, is critical for endosomal function and cell survival. ET analysis of multivesicular endosomes in Arabidopsis root and tapetal cells demonstrated that endosomal intralumenal vesicles, contrary to the traditional model, form by a complex process of concatenation (Buono et al., 2017; Goodman et al., 2021; Liu et al., 2021; Figure 2, F and G), prompting a re-evaluation of the mechanistic aspects of this cellular process.
Some organelles, such as autophagosomes, cannot be reliably identified based on single 2D TEM images. Autophagosomes are approximately 1 µm in diameter, mediate the degradation of cytoplasmic components in the vacuolar lumen, and are characterized by a double membrane. However, in conventional TEM images, vacuoles and provacuoles can be mistaken for autophagosomes. Therefore, 3D reconstructions via ET or SBF-SEM are needed to more confidently identify autophagosomes in plant cells (Klionsky et al., 2021). One of the most intriguing aspects of autophagy is related to selective autophagy, in which different signals trigger the specific degradation of certain organelles or cytoplasmic cargo, and likely, the formation of different types of autophagosomes. Although there is a general conservation of the autophagy machinery across eukaryotes, plants have developed specific autophagy receptors for some of their organelles, such as mitochondria and plastids (Marshall and Vierstra, 2018; Ma et al., 2021). A recent study employing ET showed that, during seedling de-etiolation, autophagosomes assembled around single damaged mitochondria associated with the protein FRIENDLY, which is a component of a plant autophagy receptor complex. This study not only identified a plant autophagy receptor but also the formation of an autophagosome type that traps individual mitochondria for degradation, most likely to reprogram mitochondrial metabolism and facilitate chloroplast biogenesis (Ma et al., 2021).
Although ET is usually restricted to small volumes in the range of a few cubic microns, there are approaches to reconstruct larger volumes by combining serial tomograms and collect “montaged” tomograms where each 2D tilt series image consists of four to nine tiles. As an example of serial tomography, complete root meristematic cells encompassing 60 serial sections, 300-nm-thick each, were calculated to analyze the biogenesis of vacuoles. This study showed that large vacuoles arise from the fusion of small vacuoles, which are themselves derived from the homotypic fusion of multivesicular endosomes (Cui et al., 2019).
Models derived from the segmentation of electron tomograms can be used as geometries for mathematical simulations. For example, tomographic models derived from multivesicular endosomes undergoing vesiculation have been used for calculating diffusion of membrane proteins on endosomal membranes (Buono et al., 2017).
Moving the field forward: Cryo-ET
Cryo-ET and subtomogram averaging have substantially improved our understanding of plant cell structure and physiology in recent decades. For cryo-ET, samples are cryo-immobilized within milliseconds by plunge-freezing or high-pressure freezing, as explained above (Figure 1). In contrast to plastic section ET, however, the samples are then imaged in their vitrified state without fixation and staining, resulting in unparalleled native structural preservation. Two major limitations of this technique are that frozen biological samples do not scatter electrons strongly (when compared with heavy-metal stained sections), resulting in low image contrast, and that they are sensitive to radiation damage by the electron beam that destroys their structure over the course of data collection. To ameliorate the latter issue, low doses of radiation are applied at each tilt angle. This limits the suitable sample thickness for cryo-ET to only a few hundred nanometers. Alignment and computational reconstruction algorithms are similar to those used for plastic section ET; raw cryo-tomograms typically have only 10+ nm resolution, depending on sample thickness, content, and freezing quality.
On the other hand, cryo-ET benefitted from some of the same advances that led to the “resolution revolution” in the cryo-EM single particle reconstruction field (Kuhlbrandt, 2014). For example, high-speed direct electron detectors allow collection of short movies that can be retroactively corrected for beam-induced motion that would otherwise result in blurred images (Li et al., 2013; Zheng et al., 2017). To further improve resolution, subvolumes containing structures found repeatedly within and across tomograms can be extracted, aligned, and averaged together in a process called sub-tomogram averaging, routinely achieving 2–3 nm and as high as ∼3 Å resolution. Together, these techniques have allowed for the exploration of native cellular components that cannot be resolved using light microscopy methods.
Because of their small size and robust genetic tools, the unicellular green alga C. reinhardtii has emerged as an ideal model system for studying the 3D structure of organelles and macromolecular complexes using cryo-ET. A particularly well-studied organelle in Chlamydomonas is the cilium (sometimes called eukaryotic flagellum). These whip-like structures protrude from the surface of many eukaryotic cells, contributing to both environmental sensing and motility (Mitchell, 2007). Cilia can be found on unicellular/colonial green algae (chlorophytes) throughout their life-cycle, as well as on the majority of streptophyte sperm cells, though some lineages have lost cilia altogether (Zygnematales, Angiosperms, Conifers, and Gnetales) (Hodges et al., 2012). Chlamydomonas contains two motile cilia per cell, which can be detached from the cell body via pH-shock, chemical treatment, or mechanical shearing (Craige et al., 2013). Large quantities of Chlamydomonas can be easily grown in the lab, and because whole cells are relatively small (<10 µm in length), entire cells, isolated cilia, or the microtubule-based ciliary axonemes can be properly vitrified without ice crystal formation via plunge-freezing. With 200–300 nm thickness, cilia and/or isolated axonemes are thin enough to be imaged directly in the TEM, thus they were among the first eukaryotic samples to be studied using cryo-ET (Nicastro et al., 2006). Furthermore, many ciliary structures have defined periodicities along the length of the axoneme, often occurring every 96 nm, which makes them ideal for subtomogram averaging. These features combined with the availability of many mutant strains from motility screens and an extensive mutant library (Li et al., 2016) have made Chlamydomonas a powerful system for studying ciliary structures with molecular resolution.
The molecular architecture of Chlamydomonas cilia was first described using cryo-ET and subtomogram averaging in 2006 (Nicastro et al., 2006), and since then, many advances have been made in dissecting the structure and function of molecular complexes found inside (Figure 3, A–E). The resolution afforded by cryo-ET has allowed us to peer inside the axonemal microtubules, revealing their protofilament composition and a family of proteins attached to their luminal surface, microtubule inner proteins (Nicastro et al., 2006, 2011). In addition, detailed 3D structures have been reported for each of the molecular complexes within the 96-nm axonemal repeat, including the inner and outer dynein arms (Nicastro et al., 2006; Bui et al., 2012), the nexin–dynein regulatory complex (Heuser et al., 2009), the I1 dynein complex (Heuser et al., 2012), the radial spokes (Pigino et al., 2011; Barber et al., 2012), and the central pair complex (Carbajal-Gonzalez et al., 2013). More recently, proteomics combined with wild type versus mutant comparisons have localized specific protein components within each of these structures, providing even deeper insights into their unique functions (Lin and Nicastro, 2018; Fu et al., 2019; Gui et al., 2019; Owa et al., 2019).
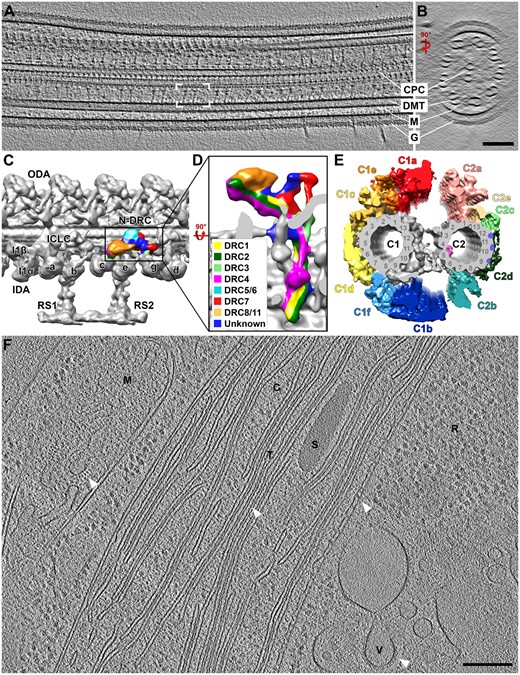
Cryo-ET of Chlamydomonas cells. A and B, Longitudinal (A) and cross-sectional (B) tomographic slices through a Chlamydomonas cilium showing the central pair complex (CPC), doublet microtubules (DMTs), and ciliary membrane (M) with the extracellular glycocalyx (G). White brackets in (A) denote a single 96-nm axonemal repeat, which contains two radial spokes. C and D, Subtomogram average of the 96-nm axonemal repeat unit displayed as an isosurface rendering (C). ODA, outer dynein arm; N-DRC, nexin-dynein regulatory complex; I1α/I1β/ICLC, α- and β-heavy chain and intermediate/light-chain complex of the I1 dynein; IDA/a-e and g, inner dynein arm isoforms; RS, radial spoke. Enlarged bottom-view of the N-DRC (D), indicating positions of protein subunits (adapted from Gui et al. (2019). E, Architecture of the ciliary central pair complex viewed from proximal to distal, highlighting the color-coded and labeled projections of the C1 and C2 microtubule (adapted from Fu et al. (2019). F, Tomographic slice through a cryo-FIB milled Chlamydomonas cell body. M, mitochondrion; C, chloroplast; T, thylakoid; S, starch granule; R, ribosomes; V, vesicle. Arrowheads highlight detailed molecular structures, including ATP synthases in the mitochondrion, oxygen-evolving complexes in the thylakoid membrane, contact sites between the outer and inner chloroplast membranes, and a vesicular coat. Scale bars = 100 nm in B (valid for A as well), 200 nm in F.
Some ciliary components have been difficult to study, however, due to their small size or extensive structural instability caused by mutations. In these cases, the ciliary protein of interest can be tagged with a small cloneable label such as SNAP (Song et al., 2015) or Biotin Carboxyl Carrier Protein (BCCP) (Oda et al., 2014) that is then conjugated with biotin–streptavidin and nanogold for precise protein localization in the sub-tomogram averages. In addition, CLEM can be combined with ET to localize specific structures, as evidenced by time-resolved studies of intraflagellar transport using traditional EM (Stepanek and Pigino, 2016), which is also applicable to cryo-ET. As a result, the current cryo-ET toolkit can not only visualize the overall architectures of megadalton complexes, but can also structurally dissect individual protein components and their interactions, enhancing our understanding of their cellular functions.
Though not ideal for all sample types, single particle analysis (SPA) using cryo-EM has provided even higher (near atomic) resolution views of Chlamydomonas ciliary proteins. This technique typically involves isolating individual proteins or complexes of interest, embedding them in a very thin layer of ice, imaging them (typically without tilting), and then generating a 3D reconstruction based on many 2D images of the complex in various orientations. Using SPA cryo-EM of isolated doublet microtubules, researchers have generated 3D reconstructions with near-atomic resolution of the ciliary doublet microtubule (Ma et al., 2019), the radial spokes (Poghosyan et al., 2020; Grossman-Haham et al., 2021; Gui et al., 2021), and the outer dynein arms (Walton et al., 2021). For the SPA method to be successful, the complexes must be embedded as a single layer in the relatively thin ice (i.e. the complexes should not overlap in the 2D cryo-EM image), adopt random orientations, and should be stable and relatively homogenous under the isolation condition (Lyumkis, 2019). One way to circumvent these issues is to use a hybrid technique called Tomography Guided 3D Reconstruction of Subcellular Structures (TYGRESS). TYGRESS generates a SPA reconstruction of relatively thick and complex samples, such as an intact axoneme, by first recording a high-resolution single particle image and then acquiring a cryo-ET tilt series of the same sample area. This series is used to guide particle extraction and alignment from the SPA-type 2D image (Song et al., 2020). In this way, the power and potential of both SPA cryo-EM and cryo-ET can be combined for higher resolution reconstructions while the molecules remain in their native cellular context.
In addition to extensive investigations into the Chlamydomonas ciliary structure and function, cryo-ET studies have elucidated many other organelles and their associated protein complexes in a variety of cells. In contrast to cilia, however, eukaryotic cells are several micrometers thick and thus cannot be imaged directly by cryo-EM. As a result, either isolated organelles, sections produced by CEMOVIS, or lamellae obtained by cryo-FIB milling are needed for cryo-ET of Chlamydomonas cells. By exposing internal areas of the cell, cryo-FIB milling combined with cryo-ET has facilitated tremendous advances in understanding the overall architecture of Chlamydomonas (Figure 3, F); for example, in studying the Chlamydomonas chloroplasts as well as protein complexes lining thylakoid membranes, including photosystem II, ATP synthase, and the membrane-shaping Vesicle-Inducing Protein in Plastid 1 (Engel et al., 2015b; Gupta et al., 2021). Cryo-ET has also revealed important structural information about chloroplast components from flowering plants, such the 3D structures of ATP synthase monomers, plastid ribosomes, and light-dependent protochlorophyllide oxidoreductase molecules in membranes from isolated pea and maize etioplasts (Floris and Kuhlbrandt, 2021).
Using cryo-FIB milling combined with cryo-ET and sub-tomogram averaging, nuclear pore complexes were imaged within their native cellular environments in Chlamydomonas, revealing two classes of proteasomes tethered either to the nuclear pore complex basket or the nuclear membrane (Albert et al., 2017). Cryo-FIB milling has also enabled in situ structural studies of Chlamydomonas membrane proteins (Schaffer et al., 2017), centriolar cartwheel structures (Klena et al., 2020), and Golgi-associated structures, including COPI-coated vesicles (Bouchet-Marquis et al., 2008; Engel et al., 2015a; Bykov et al., 2017). Furthermore, SPA cryo-EM analyses combined with cryo-ET have defined interaction sites between Rubisco and its linker protein Essential Pyrenoid Component 1 in the Chlamydomonas pyrenoid, revealing the importance of these interactions for phase separation (He et al., 2020). Together, these and other studies have begun to reveal the inner workings of molecular complexes within plant and algal cells.
CLEM
CLEM approaches aim to map the distribution of signals detected by light microscopy (mostly fluorescent labels) in EM images. This is important as it is usually challenging to determine the molecular identity of cellular protein complexes and other macromolecules within cells by EM. For cryo-CLEM combined with cryo-ET, fluorescently tagged macromolecules are first visualized by light microscopy and then, using reference points visible in both imaging modalities, the position of the fluorescent signal can be extrapolated to the cryo-electron tomogram derived from the same sample region (Schwartz et al., 2007). For post-embedding CLEM combined with ET, the sample must be processed for TEM in a way that preserves fluorescence, that is avoiding osmium tetroxide and employing special resins (Wang and Kang, 2020). Classical CLEM usually results in low-resolution correlations since it is limited to resolution of the light microscope. However, it is possible to use super-resolution approaches like PALM to image fluorescence signals and more accurately determine their position within electron tomograms (Chang et al., 2014).
Another CLEM approach employs tags that can be detected both by light microscopy due to their fluorescence properties and by EM through their electron density. Most of these tags induce electron-dense precipitates in the presence of diaminobenzidine (DAB) either using peroxidase activity (Martell et al., 2012; Lam et al., 2015; Martell et al., 2017) or photo-oxidation (Gaietta et al., 2002; Shu et al., 2011). However, DAB requires an aqueous environment to act and therefore it cannot be used directly on high-pressure frozen/freeze-substituted samples. Protocols optimized for the APEX2 (enhanced ascorbate peroxidase) CLEM tag have been successful in overcoming this limitation. For example, a procedure called CryoChem (Tsang et al., 2018) uses a special freeze substitution medium that preserves the peroxidase activity of APEX2 to perform DAB precipitation after rehydration of the sample following freeze substitution. After rehydration, the sample can be imaged by fluorescence microscopy, incubated in DAB, stained with osmium tetroxide, dehydrated, and embedded in resin (Tsang et al., 2018). Another method called cryoAPEX (Sengupta et al., 2019) performs a prefixation step and DAB incubation before high-pressure freezing and freeze substitution. Variations of these protocols have been applied to both ET (Sengupta et al., 2019; Ludwig, 2020) and SBF-SEM imaging (Tsang et al., 2018) in animal cells. APEX2 is also used as a tag for proximity biotinylation-based proteomics (Hwang and Espenshade, 2016), opening opportunities for associating proteomic data with subcellular localization by both light microscopy and 3D EM.
Future perspectives
Recently developed methods and technology for 3D EM have allowed cell biologists to study the structural intricacies of individual cells, organelles, and macromolecules. SBF-SEM offers the opportunity to collect serial images across large volumes with minimal manual intervention. However, image analysis still requires experience and tedious manual work. Automated segmentation using deep learning algorithms have been optimized for neuronal tissues to establish connections and relationships among neurons (Wernitznig et al., 2016; Shahbazi et al., 2018). However, these algorithms cannot always be applied to other systems such as plant tissues. The limited options for automated segmentation are also an important bottleneck for ET applications. Better algorithms for image segmentation will be crucial to reduce manual intervention and allow for much broader applications of ET and SBF-SEM to plant cell biology.
Though cryo-ET has tremendously advanced our understanding of the molecular organization and structure of plant cells, a vast number of unresolved questions remain (see Outstanding questions). Proteomic estimates cite hundreds of proteins just within Chlamydomonas cilia (Pazour et al., 2005), though the majority have not been precisely localized. Small, low-abundant, highly transient and/or highly dynamic proteins and complexes remain difficult to visualize and average, though tools and techniques are continually being developed to address these challenges (Turk and Baumeister, 2020; Pyle and Zanetti, 2021). In addition, one of the biggest limitations in cryo-ET is cell size; while small Chlamydomonas cells can be properly vitrified, other plant-based cells and structures are simply too large to be plunge-frozen without the formation of damaging ice crystals (Dubochet, 2007). As a result, improved workflows that efficiently combine high-pressure freezing with cryo-FIB milling and cryo-ET hold great potential for future discoveries.
Recent developments in both instrumentation and image analysis algorithms have allowed 3D-EM to increase automated image collections through large tissue volumes using SBF-SEM and to achieve near-atomic resolution of macromolecular complexes using cryo-ET and sub-tomogram averaging.
The application of cryo-ET to cell biology research on plant and algal systems offers special opportunities for understanding the organization of eukaryotic organelles with unprecedently resolution.
Preparation of samples for cryo-ET is challenging and has not yet been optimized for plants.
CLEM approaches have been developed for ET at both room and cryogenic temperatures.
How can we expand the power of cryo-ET to large cells and plant tissues?
How will recent 3D EM developments change our understanding of plant organelle function and structure?
Will it be feasible to expand the applications and throughput of SBF-SEM and ET to better characterize all cell types in plants?
Funding
Research employing 3D EM in the Otegui Laboratory is supported by grants from the National Science Foundation (MCB-2114603 and IOS-1840687) and the National Institute of Health (1S10OD026769-01) to M.S.O. The Cryo-EM work in the Nicastro Laboratory is supported by grants from the National Institutes of Health (R01GM083122 to D.N. and F32GM137470 to J.M.P.), and the Cancer Prevention and Research Institute of Texas (RR140082 to D.N. and RP170644) to the UT Southwestern cryo-EM Facility.
Conflict of interest statement. None declared.
E.W., J.M.P., D.N., and M.S.O. conceptualized, wrote, and edited the manuscript.
The author responsible for distribution of materials integral to the findings presented in this article in accordance with the policy described in the Instructions for Authors (https://dbpia.nl.go.kr/plphys/pages/General-Instructions) is: Marisa S. Otegui ([email protected]).
References
Author notes
Senior author.
