


Abstract
Although simultaneous drought and cold stress occurs, especially in northwestern and eastern regions of China, and is an important factor limiting agricultural productivity, there are few studies focusing on plant responses to a combination of drought and cold stress. Here, by partially overlapping drought and cold stresses, we characterized the acclimation of maize (Zea mays B73) to these two stresses using physiological measurements, as well as comparative transcriptomics combined with metabolomics and hormonal analyses during the stress treatments and recovery stages. The combined drought and cold stress and drought stress alone were accompanied by a decline in photosynthetic capacity and enhanced transcriptional response, and subsequent recovery of these following removal from stress, whereas cold stress alone was accompanied by irreversible damage to photosynthetic capacity and chloroplast structure. The stress combination induced transcription-associated metabolomic alterations, in which raffinose, trehalose-6-phosphate, and proline accumulated, and monosaccharide abundance increased. Concomitantly, the increased abscisic acid (ABA) content and upregulated ABA signaling pathway may have provided the transcriptional regulation for the metabolic changes. In a parallel experiment, ABA treatments prior to exposure of the plants to cold stress primed the plants to survive the cold stress, thus confirming a key role for the endogenous ABA activated by the drought pretreatment in acclimation of the plants to cold. We present a model showing that the plant response to the combined stress is multi-faceted and reveal an ABA-dependent maize acclimation mechanism to the stress combination.
Introduction
Plants continuously encounter a wide range of environmental stresses, such as drought, salinity, and extreme temperatures (cold and heat). In the past decades, the majority of studies have focused on the mechanisms underpinning plant response to a single stress (Munns and Tester, 2008; Mittler and Blumwald, 2010; Langridge and Reynolds, 2015; Shi et al., 2018). Nevertheless, plants in field conditions have to cope with combinations of two or more environmental stresses, which could cause more severe damage to agricultural production than an individual environmental stress, especially if stress combinations resulted in a negative effect on crop growth and production (Prasch and Sonnewald, 2015). Thus, efforts to reveal plant responses and acclimation to the combined stresses are crucial in improving agricultural production.
Plant responses to combined stresses are highly complex due to the cross talk that is evident between signal transduction pathways and the interaction of different metabolic components, suggesting that responses to combined stresses cannot be directly deduced from the response to individually applied stresses (Mittler, 2006; Suzuki et al., 2014). Moreover, the outcome of combinatorial stress is difficult to predict and depends on the developmental stage of the plant, the timing of stress applications (parallel or consecutive stresses), the nature of the stressors, and the severity of individual stresses (Zhang and Sonnewald, 2017).
Transcriptome analyses revealed that the response of Brachypodium distachyon under partially overlapping combinations of drought, heat, and salinity stress was unique and could not be extrapolated from the response of plants to the corresponding single stress (Shaar-Moshe et al., 2017). Tomato plants (Solanum lycopersicon) under a combined heat and salt stress accumulated trehalose and glycine betaine and, thereby, showed a higher degree of tolerance compared with plants subjected to salt stress alone (Rivero et al., 2014). Proline accumulation, that usually occurred in plants under drought, was not observed in plants during drought combined with heat stress, and sucrose, instead of proline, accumulated in plants exposed to the combined stress (Mittler, 2006). These studies, along with the review paper (Suzuki et al., 2014) support the hypothesis that combined stresses could characterize a “new state of environmental stresses” regulated through either positive or negative interactions of different signaling pathways, rather than just the sum of two or more stresses. Nevertheless, studies that focus on drought and cold combinations are limited. Indeed, drought and cold stress do occur simultaneously, especially in northwestern and eastern regions of China.
Cold and drought, two major climatic factors limiting crop growth and yield, are being extensively studied (Jia et al., 2016; Wang et al., 2016; Jiang et al., 2017; Shi et al., 2018). Multiple levels of regulation are involved in the response of plants to cold stress alone, including metabolic changes (sugar and amino acid accumulation), and the C-repeat binding factor (CBF)/dehydration-responsive-element binding factor (DREB) responsive pathway (Zhao et al., 2015; Ding et al., 2019). Given that both cold and drought stresses lead to cellular dehydration, it is unsurprising that the various signaling pathways contributing to protection against cellular dehydration overlap following exposure to these two environmental stressors. For example, the stress-induced responses are orchestrated by members of transcription factor (TF) families, including the WRKY, MYB, APETALA 2/ethylene response element binding protein (AP2/EREBP), NAC, and the basic leucine (Leu) zipper (bZIP) families (Atkinson and Urwin, 2012; Kissoudis et al., 2014). The generation of osmoprotectants (e.g. raffinose, trehalose, fructose, proline, and glycine betaine) is common in a broad range of plant species under single drought or cold stress and stabilize proteins and cellular structures (Valliyodan and Nguyen, 2006; Janská et al., 2010; Krasensky and Jonak, 2012). Another typical plant response to individual drought and cold stress is synthesis of late embryogenesis abundant (LEA) proteins to protect cell metabolism (Tolleter et al., 2007; Battaglia et al., 2008). LEA proteins have been proposed to reduce the damage caused by abiotic stresses through binding to DNA or RNA and forming a tight hydrogen-bonding network to stabilize cellular structures (Wolkers et al., 2001).
The phytohormone, abscisic acid (ABA), plays an important role in regulating responses to osmotic stress. The ABA biosynthetic enzyme, 9-cis-epoxycarotenoid dioxygenase (NCED), is considered to catalyze the rate-limiting step in ABA biosynthesis (Tan et al., 1997). Among the NCED gene family members, NCED3 is pivotal during drought-inducible ABA biosynthesis. In maize (Zea mays), ZmVP14 (also known as ZmNCED3) was the first cloned NCED gene, and is a key regulator in determining ABA levels induced by abiotic stresses (Schwartz et al., 1997; Schwartz et al., 2003). The signaling pathways involved in drought stress are orchestrated by both ABA-dependent and ABA-independent pathways, while plant responses to cold stress are proposed to be less dependent on ABA compared with the response to drought stress (Roychoudhury et al., 2013; Yoshida et al., 2014). Currently, little is known about the transcriptional and metabolic mechanisms underlying plant acclimation to the combination of drought and cold stresses.
In this study, by partially overlapping drought and cold stress, we performed physiological, comparative transcriptomic, metabolomic, and hormonal analyses on maize plants exposed to single and combined drought and cold stresses, covering both stress treatments and recovery stages, to characterize acclimations of maize to the combined stress and to decipher the underlying mechanisms. Our findings deepen our understanding of plant acclimation to combined stresses and provide valuable information for cold tolerance improvement in crop plants.
Results
Maize plants under drought and cold combination exhibited improved cold tolerance
In a preliminary experiment, we combined progressive drought stress with cold stress at different time points (Supplemental Figure S1, A). We applied stress in three ways: (1) drought stress was imposed for 7 d with a 4-d-period of cold stress imposed at day 4 (Group 1); (2) drought stress was combined with cold stress at the same time for 4 d (Group 2); and (3) cold stress was imposed for 4 d and, subsequently, drought stress was imposed for 3 d (Group 3). Interestingly, we found that the plants of Group 1 recovered when the stresses were removed, whereas the plants in Group 2 did not completely recover and Group 3 died (Supplemental Figure S1, B). As drought was progressively applied by withholding irrigation whereas cold stress (8°C day/4°C night) exposer was immediate, we could expect different performance between Group 1 and Group 2 plants. In the context of improving stress tolerance in crop plants, we subsequently focused on uncovering the plant responses to the combination of drought and cold stress as applied to Group 1, where drought stress “primed” the plant to survive the cold stress.
To study the responses to drought, cold, and their combination, combinatorial stress assays were performed (Figure 1, A and B). Twenty-five-day-old plants were exposed to optimal conditions, single stresses (drought [D] or cold [C]), and combinations (D&C) as shown in Figure 1, A. For progressive 7-d-period drought treatments, we nominated the first 3 d of drought treatment as D-pre. The water content in soil under single drought and combined stresses was progressively reduced relative to the control condition and single cold stress (Figure 1, C). Both the individual D, C, and D&C treatments resulted in a reduction in leaf relative water content (RWC). After 2 d recovery, the RWC under D and D&C increased to the level of the control (Figure 1, D). In addition, the single cold stress significantly reduced the survival rate to 20%, whereas all plants survived the application of drought and combination stresses (Figure 1, E).

Stress response and recovery experimental design and effects on plant development. A, An illustration of maize developmental stage, stress combination strategy, and sampling time points. Control plants were grown under optimal conditions throughout the experiment. Drought was gradually applied by withholding irrigation. Cold was applied by transferring plants to a precooled growth chamber at 8°C day/4°C night. The combination stress treatment was performed by transferring 3-d-drought plants to a precooled growth chamber. B, Shoot morphology. C, Water content in soil (%). D, Leaf RWC (%). E, Survival rate (%). The data are means ± sd (n ≥ 10). Different letters indicate significant differences between treatments and control plants from Student’s unpaired two-tailed t test (P < 0.05). CT, control; C, cold; D, drought; and D&C, the combination of drought and cold.
Prolonged treatment with drought facilitated the acclimation of plants to cold stress
To gain insight into how the maize plants were affected under drought, cold, and combined stresses, several physiological properties were investigated. Net photosynthesis rate and stomatal conductance markedly decreased in plants subjected to D, C, and D&C compared with control plants. Notably, plants under the combined stress had the greatest decrease in photosynthesis rate and stomatal conductance. After 48 h recovery, an increase in net photosynthesis rate and stomatal conductance was observed in D and D&C plants, but not cold-stressed plants (Figure 2, A and B). Similarly, D, C, and D&C resulted in lower Fv/Fm than control plants. However, Fv/Fm values under D and D&C recovered to normal levels at the recovery stage, but not those exposed to cold stress alone (Figure 2, C). Initial Fv/Fm measurements suggested that PSII activity was affected by the stresses.
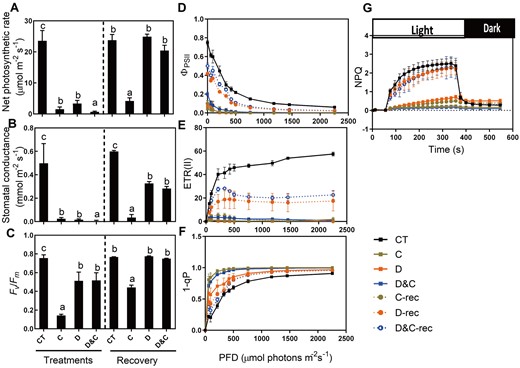
Effects of single and combined stresses on plant photosynthesis. A, Net photosynthesis rate. B, Stomatal conductance. C, Maximum efficiency of photosystem II (Fv/Fm). D, Quantum yield of photosystem II (ΦPSII). E, ETR. F, Redox state of the QA electron acceptor of PSII (1 − qP). G, Kinetics of NPQ induction. The data are means ± sd (n ≥ 10). Different letters indicate significant differences between treatments and control plants from Student’s unpaired two-tailed t test (P < 0.05). CT, control; C, cold; D, drought; and D&C, the combination of drought and cold.
To further characterize the photosynthetic apparatus, the light intensity dependence of three chlorophyll fluorescence parameters (the light-response curves of PSII quantum yield (ΦPSII), the electron transport rate (ETR), and the redox state of the QA electron acceptor of PSII (1 − qP)) was analyzed at the end of the stress period and following 48 h of recovery (Figure 2, D–F). The ΦPSII and ETR were much lower in D, C, and D&C than in control plants, and subsequently, with exception of C, an increase in ΦPSII and ETR occurred in D and D&C during the recovery stage, as also observed for Fv/Fm. In contrast, the redox state of the QA electron acceptor of PSII, 1 − qP, was higher in D, C, and D&C plants than control, reflecting a more highly oxidized plastoquinone pool in these plants.
Nonphotochemical quenching (NPQ) induction during light and dark transition periods was monitored. Following dark-adaption, plants were exposed to 1,200 μmol photons m−2 s−1 for 6 min to analyze the induction and relaxation of NPQ (Figure 2, G). NPQ under D, C, and D&C was induced more slowly, and the values were considerably lower, relative to control. Once switched to dark, NPQ relaxed slowly under the stress treatments compared with control. During the recovery stage, the NPQ induction kinetics of D- and D&C-treated plants were similar to control plants, although the values were slightly lower than control plants, indicating that the NPQ was largely reversible. However, this NPQ reversibility was not observed in cold-treated plants during recovery. These results suggest that the cold stress irreversibly disrupted the photosynthetic activity of PSII, whereas the combination of cold with drought stress relieved this irreversible disruption.
Previous studies have shown that chloroplasts are critical sensors of chilling stress (Liu et al., 2018). Under cold stress, chloroplasts were severely deformed into irregular shapes (Figure 3). The accumulation of starch grains and the damage to the grana lamellae in chloroplasts are obvious in the cold-treated plants compared with control plants, while the changes in chloroplasts were less severe in plants under D and D&C compared with cold-treated plants (Figure 3). During the recovery stage, chloroplast structures in D and D&C plants were similar to the control plants, whereas chloroplasts in cold-treated plants were still deformed and exhibited irregular shapes.
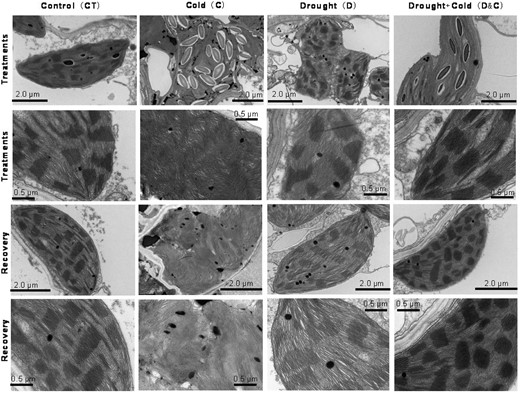
Unique ultrastructural features of chloroplasts from plants subjected to cold (C), drought (D), and combination (D&C) stresses, and recovery shown by TEM. Images were taken at different magnification levels. Scale bar = 2.0 or 0.5 µm (as labeled in each image).
Transcriptome responses in maize subjected to the combination of drought and cold stress (D&C) show unique patterns
A transcriptomic analysis of maize leaves from plants subjected to D, C, and D&C identified 12,356, 7,420, 10,031, and 12,289 differentially expressed genes (DEGs) in response to C, D-pre, D, and D&C, respectively. During subsequent recovery, 4,416 DEGs, 1,651 DEGs, and 1,374 DEGs were identified in plants subjected to C, D, and D&C, respectively (Figure 4, A and Supplemental Table S1). A principal component analysis (PCA) of the transcriptomic data revealed a high similarity among the three biological replicates within each treatment (Figure 4, B). Among treatments, a clear separation of the stress treatments from the control plants was observed, while in recovery no clear separation between D and D&C and control samples was observed, in contrast to cold stress (Figure 4, B). Interestingly, D and C plants diverged and were in stark contrast to the control plants, whereas samples under D&C stress diverged between D and C stresses. Over the 7-d time course, the transcriptome of the two drought treatments (D-pre and D) became progressively divergent (Figure 4, B).
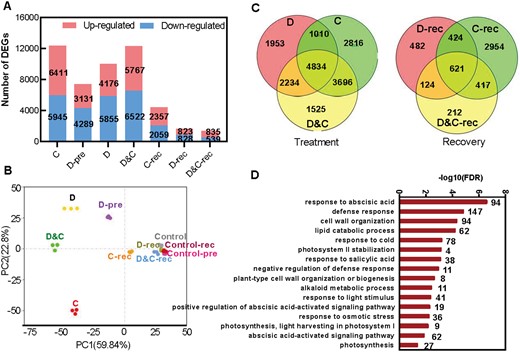
Global transcriptome responses of plant to single and combined stresses and recovery. A, The number of DEGs under different stresses and recovery. B, PCA showing the divergence of the respective transcriptomes in response to stresses and recovery. C, Venn diagrams showing the overlap among DEGs in each of the different treatments and recovery. D, GO annotation of common DEGs under drought (D), cold (C), and combination (D&C) stresses (numbers above each bar represent DEG numbers).
Of the DEGs in D&C stress, 4,834 transcripts (39%) were common with both D-induced transcripts and C-induced transcripts, and 1,525 transcripts (12%) were uniquely induced by the stress combination. These results suggest that a considerable proportion of the transcriptomic changes in maize subjected to D&C is common to both drought and cold stress (Figure 4, C and Supplemental Table S2).
To gain insight into biological processes in response to the combined stress, we analyzed gene ontology (GO) term enrichment of the 4,834 common DEGs (Figure 4, D). The set of common DEGs was involved in different biological processes including in defense response, cell wall organization, lipid catabolic process, photosynthesis, as well as to response to osmotic stress, whereas the DEGs uniquely induced by D&C stress were enriched in GO terms including chaperone-mediated protein folding and RNA binding (Supplemental Table S2). Hormone-related GO terms, e.g. response to ABA, salicylic acid (SA), or ABA-mediated signaling pathway were enriched (Figure 4, D, Supplemental Figure S2, and Supplemental Table S3).
Among enriched GO terms, we observed a larger number of transcripts encoding TFs was differentially regulated under the combined and single stresses. The responsive TFs were categorized into several different families, including WRKY, MYB, NAC, AP2/EREBP, bZIP, and bHLH that play critical roles in plant responses to abiotic stresses (Supplemental Figures S3–S8 and Supplemental Table S4). Among these families, a larger fraction of these TFs in each cluster was upregulated to a similar extent when D&C and C are compared.
Among downregulated transcripts during stress treatments, significant enrichment was observed in GO terms related to photosynthesis, light harvesting, and photosynthetic electron transport chain (Supplemental Figure S2). In accordance with their repressed photosynthesis activity, the expression of transcripts encoding photosystem II proteins (PsbO, PsbP, PsbQ1, PsbS, PsbW, or PsbY), photosystem I proteins (PsaD, PsaE, PsaF, PsaG, PsaH, PsaK, PsaL, PsaN, or PsaO), antenna proteins (Lhca1, Lhca2, Lhca3, Lhca3, Lhca6, Lhcb3, Lhcb4.1, Lhcb5, or Lhcb7), proteins of the cytochrome b6f complex (PetC or PetJ), and proteins involved in photosynthetic electron transport (PetE: LOC103629356, LOC100192779) were downregulated in response to D, C, and D&C (Figure 5, A and Supplemental Table S5). Interestingly, these transcripts encoding photosynthetic apparatus were downregulated to a significantly larger extent under D and D&C compared with C. Similarly, at the protein level, we observed decreased levels in core subunits, D1 (PsbA), PsbD, CytB6, and Lhca1, under treatments (Supplemental Figure S9). During recovery, the transcripts encoding photosynthetic apparatus were upregulated in plants under D and D&C but not C (Figure 5, A), suggesting a recovery in photosynthesis of D- and D&C-treated plants.
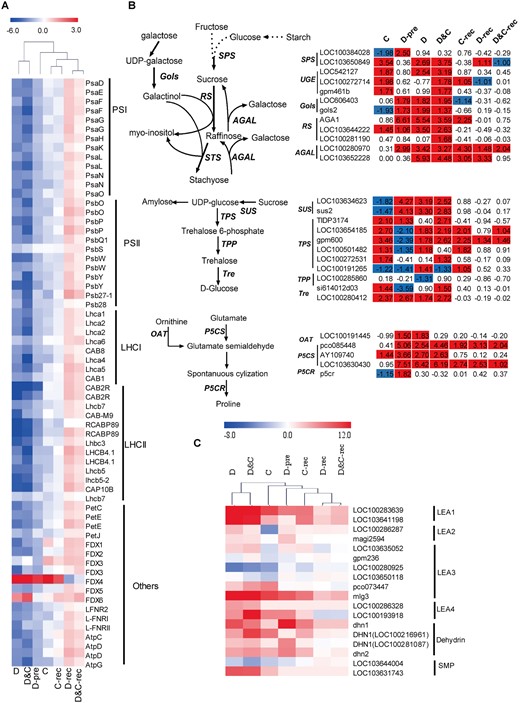
Photosynthetic, sugar biosynthetic genes, and LEA genes are regulated by cold (C), drought (D), and combination (D&C) stresses and recovery. A, The expression profile of transcripts involved in photosynthesis. The heatmap is clustering the log2 fold-change (log2(FC)) of each gene. B, DEGs in the synthesis of raffinose, trehalose, and proline. The value is the log2 fold-change (log2(FC)) of each gene. C, DEGs encoding LEA proteins. The value is the log2 fold-change (log2(FC)) of each gene. The colors of the boxes represent upregulated (red) and downregulated (blue) genes.
As significant enrichment for upregulated DEGs was observed in GO terms related to the sugar-mediated signaling pathway, trehalose metabolism in response to stress, and proline biosynthetic process (Supplemental Figure S2), we analyzed transcript abundance of genes involved raffinose, trehalose, and proline metabolism (Figure 5, B and Supplemental Table S5). The expression of two genes (LOC606403 and Gols2) encoding galactinol synthase were upregulated in response to D and D&C, whereas expression of Gols2 was downregulated under cold stress relative to control plants (Figure 5, B). Three genes (AGA1, LOC103644222, and LOC100281190) annotated as raffinose synthase (RS) showed largely induced transcript abundance by D&C stress, while only one RS gene (LOC103644222) was slightly induced by cold stress (Figure 5, B). The transcript abundance of genes encoding enzymes involved in trehalose synthesis were upregulated to a similar extent when combined and single stresses are compared (Figure 5, B). In contrast, the transcripts of three P5CS genes which encode Δ-1-pyrroline-5-carboxylate synthetase, an enzyme associated with proline synthesis, were considerably more upregulated under D and D&C rather than cold stress (Figure 5, B).
The transcripts of most identified LEA genes characterizing different groups were upregulated to a significantly larger extent under D and D&C compared with C (Figure 5, C). Representatively, the expression of several members (mlg3, LOC100193918, and DHN1) was considerably greater in D&C compared with that under C alone.
Given that significant GO terms enrichment for DEGs were related to hormone signaling pathway and response (Figure 4, D and Supplemental Figure S2), the expression changes of biosynthetic genes for phytohormones including ABA, IAA, jasmonic acid (JA), and SA were analyzed (Figure 6, A and Supplemental Table S6). We found that most genes related to the ABA biosynthetic pathway showed increased expression under D, C, and D&C stresses. Notably, the combined stress markedly induced genes related to the ABA biosynthetic pathway in comparison to C and D alone (Figure 6, A). Representatively, transcript abundances of ZmVP14 and other NCED gene members (NCED4 and LOC100501444) were elevated under D&C relative to those of D or C (Supplemental Table S6). During recovery, this induction disappeared in D and D&C-treated samples. Increased expression of auxin biosynthetic pathway-related genes only appeared in C-treated samples (Figure 6, A). In terms of genes involved in the ABA signaling pathway we noted the following: five ABA receptors were differentially expressed and most of these were downregulated in response to C, D, and D&C stresses; 15 clade A PP2C genes were identified and most were significantly induced by stresses, especially by the combined stress; the transcripts of most identified SnRK2s and ABF genes showed upregulation under D&C and C or D alone (Figure 6, B and Supplemental Table S6).
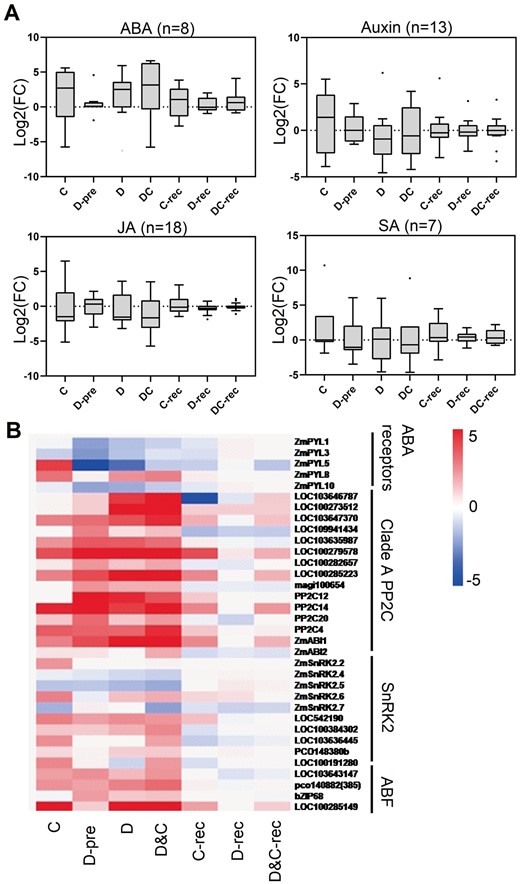
Hormone biosynthetic pathway genes are regulated by stresses and recovery. A, The boxplots show the expression profile of transcripts that are involved in hormone biosynthetic pathways under cold (C), drought (D), and combination (D&C) stresses and recovery. The y-axis is log2 fold-change (log2(FC)). B, The expression profile of transcripts involved in the ABA signaling pathway. The colors of the boxes represent upregulated (red) and downregulated (blue) genes, and the value is the log2 fold-change (log2(FC)) of each gene. Whiskers indicate the maximum and minimum values of the data, horizontal thick lines show the medians, boxes show the interquartile ranges (25th–75th percentiles of the data), and black dots indicate the outliers according to Tukey’s test.
Metabolomic adjustments occur in leaves of maize plants in response to drought (D), cold (C), and a combination of drought and cold stress (D&C), and during recovery
To gain a complete view of maize in response to stress, metabolomic analysis was performed (Figure 7). PCA was undertaken to gain an overview of the sample distribution for metabolomic responses under D, C, and D&C. PCA of metabolomic data strongly echoed the PCA of the transcriptomic data, as D and C samples diverged and were in stark contrast to the control plants. Interestingly, D&C-treated samples grouped together with drought-treated samples, indicating that drought mitigated the impact of cold stress under D&C treatment. Following recovery, drought-treated and D&C-treated samples still grouped together and were closer to the controls, suggesting recovery at the metabolic level. In contrast, 48 h after stress removal, cold-treated plants still diverged from control plants and remained closely grouped with the cold-stressed plants, indicating no recovery occurred in cold-treated plants (Figure 7, A).
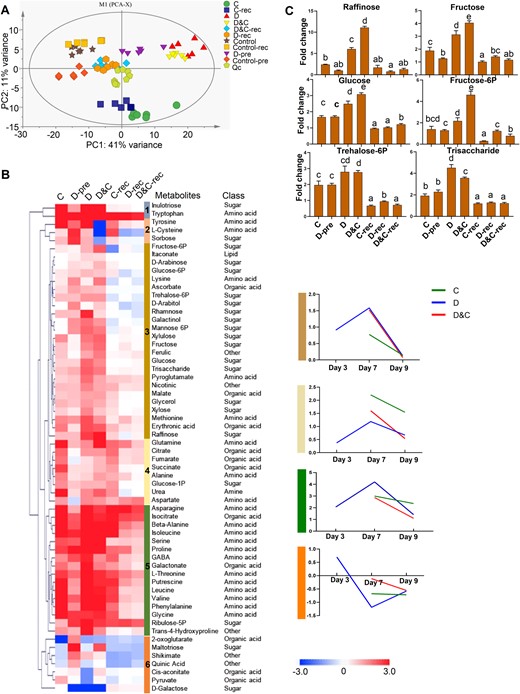
Metabolic profiling of maize plants subjected to cold (C), drought (D), and combination (D&C) stresses and recovery. A, PCA shows the divergence of the respective metabolomes in response to stresses and recovery. B, Identified metabolites were hierarchically clustered (Euclidean distance) based on their abundance relative to control samples and six clusters were generated. For Clusters 3–6, in order to better visualize any patterns of abundance changes in metabolites that constitute these clusters, the average abundance of metabolites was plotted. The colors of the boxes represent upregulated (red) and downregulated (blue) metabolites, and the value is the log2 fold-change (log2(FC)) of each metabolite. C, The profile of selected sugar metabolites which represent the response patterns of Cluster 3. The y-axis is fold change relative to corresponding control plants. The data are means of six replicates ± SE. Different letters indicate significant differences between treatments from Student’s unpaired two-tailed t test (P < 0.05).
To further analyze the abundance profiles of metabolites under the different stresses, we performed hierarchical clustering of metabolites from the treatments and corresponding control plants (Figure 7, B and Supplemental Table S7). This analysis resulted in six clusters that revealed different metabolic patterns for stress treatments and recovery. In order to better visualize the changes in metabolites, we also plotted the average abundance of metabolites that characterized Clusters 3–6, respectively. Obvious changes were observed in the abundance of a wide variety of carbohydrates, amino acids, and organic acids. Notably, Cluster 3 displayed a marked divergence in abundance of metabolites between C and D&C treatments, with much greater abundance of various carbohydrates induced by D&C treatment relative to that induced by cold treatment. Those carbohydrates characterizing Cluster 3 exhibited highly similar abundance patterns between D and D&C treatments and after 48 h of recovery, with a strong increase under the treatments and a decrease during recovery. Representatively, raffinose, fructose, glucose, trisaccharide, and fructose- and trehalose-6-phosphates were more abundant in D and D&C plants compared with those in C plants, implying that these metabolites could contribute to the different cold tolerance exhibited by C and D&C plants (Figure 7, C).
Some metabolites in Cluster 4 had generally greater pool size in C plants relative to those in D&C and D plants, for example succinate and urea, as shown in Cluster 4. Additionally, the major N-carrier amino acid, glutamine (Gln), occurred in Cluster 4 and accumulated in D&C and C plants. Large-scale increases of amino acids were found in Cluster 5. These included: the aromatic amino acids phenylalanine (Phe), tyrosine (Tyr), and tryptophan (Trp); key amino acids with high N:C ratio (aspartate (Asp) and asparagine (Asn)); and the branched-chain amino acids isoleucine (Ile), leucine (Leu), and valine (Val). As shown in Cluster 5, the levels of the majority of these metabolites remained high in cold-treated plants throughout both treatment and recovery whereas, under D and D&C treatments, their abundance increased and subsequently decreased during recovery (Figure 7, B). Notably, accumulation of proline (cluster 5) was much greater in D and D&C plants relative to C plants.
ABA displayed different patterns in plants subjected to drought (D), cold (C), and a combination of drought and cold stress (D&C) stresses, and during recovery
We quantified the stress-related phytohormones including ABA, auxin, JA, and SA (Figure 8). Significant increases in ABA content were observed under D, C, and D&C treatments. Interestingly, ABA content in D&C samples was considerably greater than that in samples treated by drought or cold stress alone. After recovery, only C-treated samples retained their greater ABA content relative to control plants (Figure 8). These results are consistent with the observed increase in expression of the ABA biosynthetic genes, suggesting a critical role of ABA in response to the combined stress. In addition, we found that auxin content was strongly induced by cold treatment, while SA levels were repressed by the combined and single stresses (Figure 8). Notably, the contents of JA and its active form, JA-Ile, showed an increased trend in D&C-treated plants during recovery, suggesting a possible role of JA for plant acclimation to the combined stress (Figure 8).
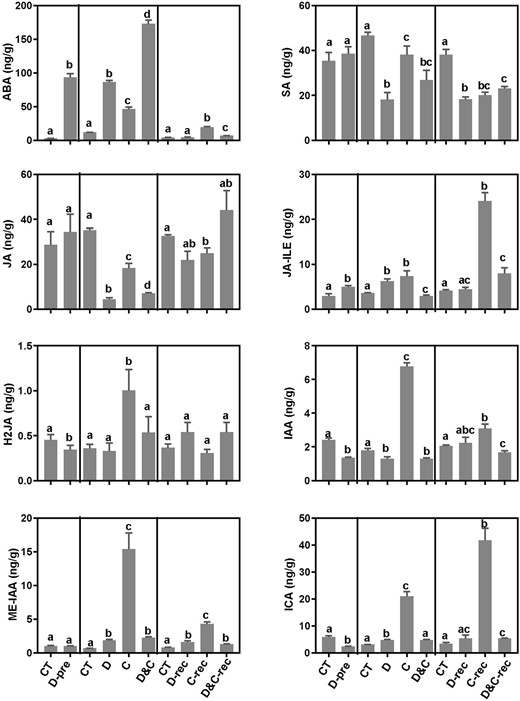
Phytohormone levels in maize plants subjected to cold (C), drought (D), and combination (D&C) stresses, and recovery. The data are means of three replicates ± sd. Different letters indicate significant differences between treatments and control plants from Student’s unpaired two-tailed t test (P < 0.05).
Characterizing the role of ABA in maize in response to the combined drought and cold stress by ABA treatment prior to exposure of the plants to cold stress
To further study the role of ABA in the response of plants to the combined drought and cold stress, we performed a parallel experiment by exposing ABA-treated plants to cold stress (ABA&C). Similar to the drought pretreated plants, plants with an ABA treatment prior to exposure to cold stress showed cold tolerance, with higher survival rate relative to plants without the ABA treatment (Figure 9, A and Supplemental Figure S10). Similarly, ABA pretreated plant had markedly decreased net photosynthesis rates, stomatal conductance, and Fv/Fm during cold stress, and showed significant recovery, in terms of increased photosynthesis rate and Fv/Fm, 48 h after removal from stress (Figure 9, B–D). The ΦPSII and ETR were much lower in ABA&C plants than in control plants, with a subsequent increase during the recovery stage, which was also observed in D&C and D plants (Figure 9, E and F). During stress, the NPQ in ABA&C plants showed similar patterns to D&C and D plants, with slow induction by light and, once switched to dark, NPQ slowly relaxed compared with control. After 48 h recovery, the NPQ induction kinetics of ABA&C plants showed a recovery pattern similar to D&C and D plants (Figure 9, G). These results strengthen the suggestion that the increase in ABA, triggered by drought pretreatment (Figure 8), might play a key role in acclimation of maize to D&C stress.
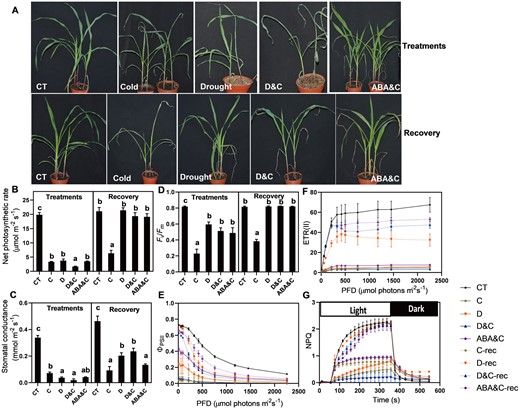
Effects of ABA pretreatment and sequential cold stress (ABA&C), single and combined stresses on plant photosynthesis. A, Shoot morphology. B, Net photosynthesis rate. C, Stomatal conductance. D, Maximum efficiency of photosystem II (Fv/Fm). E, Quantum yield of photosystem II (ΦPS II). F, ETR. G, Kinetics of NPQ induction. The data are means ± se (n ≥ 4). Different letters indicate significant differences between treatments and control plants from Student’s unpaired two-tailed t test (P < 0.05). CT, control; C, cold; D, drought; and D&C, the combination of drought and cold.
Discussion
This study was designed to uncover the primary response of maize plants to a combined stress of drought and cold, two of the most common abiotic stresses that negatively affect crop growth and yield in the field. Li et al. (2015) reported that wheat plants, exposed to 2 weeks of drought and followed by 2 weeks recovery and then subsequently subjected to low temperature, showed more tolerance to cold stress than plants without drought pre-treatments, suggesting a cross-tolerance in plants to drought and cold. In our work, we partially overlapped the drought and cold stress treatments. Using comparative transcriptomic and metabolomic analyses of the maize plants in response to the individual and combined stresses, we have uncovered different responses to such events and have characterized an ABA-required adaptation of maize plants to the combination of the two environmental stressors.
Given that low-temperature injury appears during recovery rather than during the low-temperature treatment itself (Zhang et al., 2016), we sampled during both treatment and recovery stages to obtain a clear view of comparison between cold stress alone and in combination with drought stress. During recovery, plants grown under D and D&C treatment displayed higher survival rates than those exposed to cold stress alone. This was consistent with the observed alterations in photosynthetic parameters during recovery stages, suggesting that drought-treated plants exhibited greater tolerance to cold stress than plants without a prolonged drought treatment. The effects of cold stress on individual cold-treated plants were reflected by the accumulation of starch and inhibited photosynthetic capacity, which is consistent with previous studies (Allen and Ort, 2001). Interestingly, accumulation of starch grains and the damage to the grana lamellae was not observed in chloroplasts of plants under D&C, suggesting that the cold stress effects on chloroplasts were alleviated by exposure to drought stress (Figure 3). These primary physiological responses observed in plants under the combined D&C stress suggested that drought stress prior to exposure of the plant to cold stress could prime the plant so that the impact of cold on plant growth is ameliorated.
Transcriptome data indicated that of the clusters of downregulated genes, some related to photosynthesis, such as the clusters of light reactions in photosystem I and photosystem II (Figure 4, D). The reduction in transcript abundance of photosynthetic genes was stronger under D&C relative to that under D, whereas the reduction was not significant under cold stress alone (Figure 5, A). These data are consistent with the strong repressions by the combined stress at the photosynthetic level, including gas exchange, stomatal conductance, and PSII efficiency (Figure 2). The reduced PSII efficiency during D&C could be explained by the degradation of D1 (PsbA) protein in PSII (Supplemental Figure S9, B). During recovery, genes encoding PSI- and PSII-related proteins were upregulated under D&C and D, compared with C (Figure 5). These results reveal that D&C-treated plants underwent a strong reduction of photosynthesis followed by an efficient and rapid recovery response relative to cold-treated plants, at both the transcriptional and physiological levels, suggesting induction of a photosynthetic acclimation mechanism to the combined stress in maize.
Repressions in stomatal conductance and Rubisco activities by chilling or drought stress lead to inhibited carbon fixation and, consequently, result in photoinhibition and the generation of a burst of reactive oxygen species (ROS; Mahajan and Tuteja, 2005). The significant reduction in the expression of PSI- and PSII-related genes in D&C plants may repress the activity of photosystem components, thus avoiding the generation of a burst of ROS during the combined drought and cold stress. This finding is supported by the observation in maize cultivars which vary in their drought tolerance, where the expression of PSI- and PSII-related genes was reduced mainly in the drought tolerant rather than sensitive landraces (Hayano-Kanashiro et al., 2009). Together, these results suggest that a strong reduction of photosynthetic genes under the combined drought and cold stress may constitute an energy-saving strategy under low CO2 availability.
The Group 3 LEA protein in maize, mlg3, has been reported to reduce cell shrinkage effects during dehydration (Amara et al., 2012). Enhanced expression of DHN (another LEA group) was associated with stress tolerance in plants to drought, cold, and salinity (Beck et al., 2007). In our study, the upregulation of most genes encoding LEA proteins was enhanced by D&C stress relative to cold stress alone. Particularly strong upregulation of the transcripts of mlg3 and DHN occurred, suggesting that LEA proteins may contribute to the tolerance of plants to the combination of drought and cold. LEA proteins generally accumulate in response to ABA (Hong-Bo et al., 2005). Given that the elevated ABA content was accompanied by upregulation of genes encoding LEA proteins under D&C condition, it is likely that ABA underlies the upregulation of these LEA genes.
In our study, metabolic adjustments contributed to the acclimation of maize under combined stress. Under cold and other abiotic stressors, the accumulation of amino acids plays important roles in stress tolerance of plants (Maruyama et al., 2014; Zhang et al., 2016). In our study, significant accumulation of amino acids was observed under drought and the combined stresses, and this accumulation disappeared during recovery. Notably, under cold stress a large number of key amino acids also accumulated during the cold treatment but remained accumulated 48 h after stress removal, which is in agreement with the observation in chilling-sensitive rice variety 9311 exposed to chilling stress (Zhang et al., 2016). These findings reveal that the imbalance of protein metabolism and consequent accumulation of amino acids may be a common mechanism underlying plant adaptation to single or combined environmental stresses in plants. Clearly, however, the accumulation of amino acids, as a well-known stress response, and observed in both C and D&C plants, was not responsible for their different tolerance to cold stress.
In contrast, a striking observation was the significantly greater accumulation of a group of key sugar metabolites, including raffinose, trehalose-6-phosphate, fructose, fructose-6-phosphate, glucose, glucose-6-phosphate, and trisaccharide, during D&C and D relative to cold stress, suggesting that these sugar metabolites could be relevant to the observed plant tolerance to the combined stress (Figure 7).
Raffinose and the galactose donor galactinol, which is involved in the raffinose biosynthetic pathway, have been positively associated with cold and drought tolerance in many plant species because of their functions as osmoprotectants during stresses (Zuther et al., 2012; Zhuo et al., 2013). Two key enzymes, GOLS and RS, are required for raffinose biosynthesis (Saravitz et al., 1987; Peterbauer et al., 2002). Overexpression of AtGOLS2 in Arabidopsis led to the accumulation of raffinose and galactinol, and enhanced plant tolerance to drought stress (Taji et al., 2002). The contents of raffinose and galactinol, and of GOLS and RS, displayed similar patterns, with enhanced accumulation/upregulation in the D&C and D treatments, compared with those in cold stress, confirming the contribution of raffinose biosynthesis to the cold tolerance exhibited by the D&C plants (Figure 5, B). In maize, ABI5 up-regulates GOLS2 via directly binding to the GLOS2 promoter (Zhang et al., 2019). In our transcriptome data, the expression of the homologous gene (Gene ID: LOC100285149; Gene symbol: ABI5) of Arabidopsis ABI5 was upregulated under C, D, and D&C but significantly more so in the D&C plants (Figure 6, B). We speculate that ABI5 may play a role in the regulation of the raffinose biosynthetic pathway. Given that, during freezing stress, raffinose accumulation in the chloroplast stroma contributes to specifically stabilizing photosystem II (Knaupp et al., 2011), we could suggest that raffinose plays an important role in protecting the photosynthetic apparatus from oxidative damage under the combined stress, which is also supported by the finding that both raffinose and galactinol protect plant cells from oxidative damage caused by chilling stress (Nishizawa et al., 2008).
Additionally, we observed that not only were the transcripts of ZmVP14, as well as other NCED gene family members, elevated more by D&C relative to D or C alone (Figure 6 and Supplemental Table S6), but so also was the ABA content (Figure 8). Further, under the combined and single stresses, the transcripts of PP2Cs and SnRK2s showed upregulation, whereas the PYLs were mainly downregulated (Figure 6), indicating activation of the ABA signaling pathway. Crucially, pre-treatment with ABA, prior to exposure of the plants to cold stress, increased the ability of plants to acclimate to cold stress (Figure 9). Given that the ABA content was significantly induced by drought pretreatment prior to cold stress (Figure 8), we speculate that drought pretreatment primed plants to become more cold tolerant.
It has been well documented that osmotic stress responses, such as drought and salt stress, occur through upregulation of gene expression via ABA-dependent and ABA-independent pathways, whereas cold-stress responsive gene expression is regulated by an ABA-independent pathway (Yoshida et al., 2014; Vishwakarma et al., 2017). Our data indicated that an ABA-dependent transcription pathway was more active in maize plants subjected to the stress combination. Less clear is the role of JA in the plant response to this stress combination, although it was recently suggested that JA is necessary for plant acclimation to a combination of high light and heat stress (Balfagón et al., 2019).
As summarized in Figure 10, our model shows an accumulation of effects induced by the stress combination, in which a moderate drought (D-pre) primed plants to induce stress tolerance mechanisms to the more severe stress caused by cold conditions (D&C stress). As highlighted in the previous section, ABA content and the transcripts of genes involved in the biosynthesis of raffinose, trehalose, and proline, metabolites that play a stress-protective role, increased under the combined stress, indicating that ABA-dependent transcriptional control played an important role in plant acclimation to the combined drought and cold stress. Overall, plants subjected to the combined drought and cold stress were able to avoid cold-induced damage to the photosystem and chloroplasts through ABA-dependent metabolomic adjustments, thereby facilitating enhanced tolerance to cold.
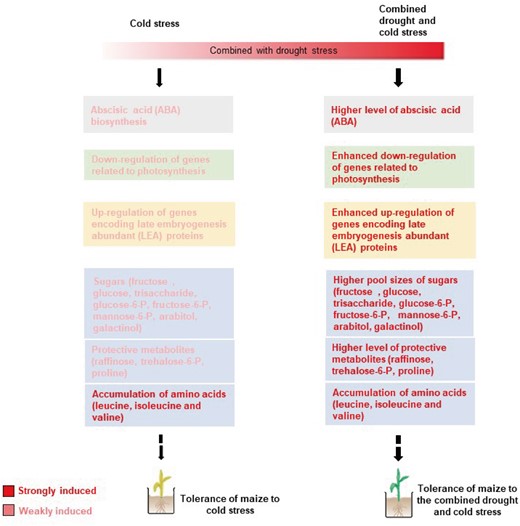
Schematic overview of different transcriptional and metabolic strategies employed by maize plants that contribute to tolerance to the combination of drought and cold stress, compared with cold stress alone. Stronger stress tolerance-related metabolic adjustments (blue boxes), ABA biosynthesis (gray box), photosynthetic acclimation (green box), and upregulation of genes encoding LEA proteins (yellow box) were activated in maize plants in response to the combined drought and cold stress, compared with cold stress alone. Highlighted words, strongly induced regulation; thick and thin arrows, strong and weak induction of stress responses, respectively; broken-line arrows, gaps in the pathway.
Conclusion
Through a comprehensive physiological, transcriptomic, metabolomic, and hormonal analysis of drought and cold stress, applied singly and in combination, during both the stress and recovery stages, we have revealed adaptation mechanisms to the combination of drought and cold stress. We suggest that ABA positively regulates transcriptional control and metabolomic adjustments. In the future, genetic materials are required to uncover more specific information. This study contributes to a deeper understanding of the sophisticated and efficient mechanisms in the response of plants to stress combinations and, consequently, an increased understanding that can be of use in the improvement of plant tolerance and yield in the field.
Materials and methods
Plant growth conditions, stress treatments, and exogenous ABA pretreatment
Maize (Z. mays L.), B73, seeds were sterilized in 10% (v/v) H2O2 for 25 min, washed with distilled water, and then germinated on tissue paper soaked with distilled water in the dark at room temperature for 2 d. When the roots were about 1.5-cm long, uniform seedlings were transplanted into pre-weighed pots (one plant per pot) and irrigated every 3 d. Plants were grown in a growth chamber at 28°C/22°C with a 14-/10-h light/dark cycle (14-h light from 8 AM to 10 PM; 250–300 µmol m−2 s−1 at the canopy height), 65% humidity.
The different stress treatments were performed as shown in Figure 1. Control: plants were grown at 28°C day/22°C night with normal irrigation throughout the experiment so that soil moisture was the same as field capacity. Drought (D): 25-d-old plants were gradually exposed to drought by withholding irrigation. Each pot was weighed and relative soil water content was maintained at 20% for 7 d. Cold (C): 28-d-old well-watered plants were transferred to a precooled growth chamber at 8°C day/4°C night for 4 d. Combined drought and cold stresses (D&C): 25-d-old plants were gradually exposed to drought by withholding irrigation for 7 d. At day 4, drought and cold stresses were merged by transferring these plants to a precooled growth chamber at 8°C day/4°C night for 4 d. ABA pre-treatment and sequential cold stress (ABA&C): 25-d-old plants were sprayed with 100 µM ABA at 8 AM daily for 3 d. At day 4, ABA-treated plants were exposed to a precooled growth chamber at 8°C day/4°C night for 4 d. For recovery, the plants, with D, C, D&C, and ABA&C treatments were transferred back to normal temperature and well-watered for 48 h. All experiments were performed at the same time of the light cycle and were repeated at least three times.
Leaf RWC measurement
Leaf RWC was calculated as described by Prasad et al. (2011). From each fully expanded leaf, 2.5-cm long leaf segments were collected and immediately weighed to obtain a fresh weight (FW) after the single and combined stresses. The leaf segments were floated on deionized water in a petri dish in the dark at 4°C for 24 h. Then the leaf segments were reweighed to obtain turgid leaf weight (TW). Finally, leaves were oven dried at 80°C for 48 h and dry weights (DWs) were measured. RWC (%) was calculated as [(FW − DW)/(TW − DW)] × 100.
Gas exchange measurement
Photosynthetic rate and stomatal conductance were measured using a LI-6400 photosynthesis system with a 6400-40 leaf-chamber fluorometer (Li-Cor Inc., Lincoln, NE, USA) on the youngest fully expanded leaves as described by Niu et al. (2020). The measurements were taken for at least 10 plants. Each experiment was repeated at least three times.
Chlorophyll fluorescence analysis
A Dual-PAM-100 fluorometer (Walz, Effeltrich, Germany) was used to measure quantum yield of photosystem II (ΦPSII) and maximum efficiency of photosystem II (Fv/Fm). The plants were adapted in the dark for at least 30 min prior to measurement. Photosynthetic measurements were taken for at least 10 plants using fully expanded young leaves. Each experiment was repeated at least three times.
Transmission electron microscopy
Leaves of treated and untreated plants were cut into small pieces and fixed under vacuum in 0.1 M phosphate buffer (pH 7.2), 2% (v/v) glutaraldehyde, 0.5% (w/v) paraformaldehyde, and then further fixed for 4 h in phosphate-buffered saline (PBS) containing 2% OsO4 (pH 7.2). After dehydration in an ethanol series, samples were embedded in LR White resin (London Resin, Berkshire) and then sectioned using an ultramicrotome (Power TomeXL; RMC, Arizona). Ultrathin sections (50–70 nm) were double stained with 2% (w/v) uranyl acetate and 2.5% (w/v) lead citrate aqueous solution before observation. Sections were examined with a Hitachi H-7650 transmission electron microscope (TEM).
RNA-seq and bioinformatics analysis
Ten fully expanded leaves from 10 independent plants subjected to each of the stress treatments and control were pooled as one biological replicate for RNA-Seq analysis. Three biological replicates were performed. Total RNA was extracted using Trizol reagent (Invitrogen). RNA (100 ng) was used for RNA-seq library construction according to the manufacturer’s instructions (Illumina). First-strand cDNA was synthesized using SuperScript II Reverse Transcriptase (Invitrogen). After second strand cDNA synthesis and adaptor ligation, cDNA fragments were enriched, purified, and then sequenced on the Illumina Hiseq X Ten. The clean reads were mapped to the reference genome of maize (B73_RefGen_v4, NCBI) using HISAT2 (Kim et al., 2015). DEGs of D-, C-, and D&C-treated plants relative to control samples were identified with a P < 0.05 and fold change >2 or fold change <0.5 as the threshold. Heat maps were constructed using MeV4.9 to explore patterns of gene expression. GO enrichment and Kyoto Encyclopedia of Genes and Genomes (KEGG) pathway enrichment of DEGs were generated using R, based on the hypergeometric distribution.
Metabolomic profiling
Metabolomic analyses were performed using GC–MS as described by Law et al. (2018). Samples were analyzed on an Agilent 7890B gas chromatography system coupled to an Agilent 5977A MSD system (Agilent Technologies Inc., CA, USA). Ten fully expanded leaves from 10 independent plants subjected to each of the stress treatments and control were pooled as one biological replicate, and six biological replicates were performed for metabolomic profiling. The fold-change for each metabolite was calculated as the ratio of the scaled amount of stress-treated plants relative to that of control plants. The differential metabolites were selected on the basis of the combination of a statistically significant threshold of variable influence on projection (VIP) values obtained from the OPLS-DA model and P values from a two-tailed Student’s t test on the normalized peak areas from different groups, where metabolites with VIP > 1.0 and P < 0.05 were considered as differential metabolites. Hierarchical clustering (Euclidean distance) was performed with MeV4.9 to explore the pattern of metabolite abundances.
Hormonal analysis
The quantification of endogenous ABA, auxin (indole-3-acetic acid, IAA), JA, and SA was performed by Wuhan Metware Biotechnology Co., Ltd. (Wuhan, China) using an LC–MS/MS platform as described by Izumi et al. (2009). Plant materials (50 mg FW) were frozen in liquid nitrogen, ground into powder, and extracted with 0.5 mL methanol/water/formic acid (15:4:1, V/V/V) at 4°C. The extract was vortexed for 10 min and centrifuged at 14,000 rpm under 4°C for 5 min. The supernatant was collected and the extraction steps repeated. The combined extracts were evaporated to dryness under a stream of nitrogen gas, reconstituted in 80% methanol (V/V), ultraphoniced (1 min), and filtrated (PTFE, 0.22 μm; Anpel) before LC–MS/MS analysis. The sample extracts were analyzed using an LC–ESI–MS/MS system (HPLC, Shim-pack UFLC SHIMADZU CBM30A system, www.shimadzu.com.cn/; MS, Applied Biosystems 6500 Triple Quadrupole, www.appliedbiosystems.com.cn/). The analytical conditions were as following, HPLC: column, Waters ACQUITY UPLC HSS T3 C18 (1.8 µm, 2.1 mm × 100 mm); solvent system, water (0.04% acetic acid): acetonitrile (0.04% acetic acid); and ND injection volume: 2 μL. The effluent was alternatively connected to an ESI-triple quadrupole-linear ion trap (Q TRAP)-MS. AB 6500+QTRAP LC–MS/MS System, equipped with an ESI Turbo Ion-Spray interface, operating in both positive and negative ion modes and controlled by Analyst 1.6 software (AB Sciex). Standard curves consisting of 0.02, 0.05, 0.1, 0.2, 0.5, 1, 2, 5, 10, 20, 30, 50,100, 200, 400, 800, 1,600, and 2,000 ng/mL of ABA, SA, JA, JA-Ile, H2JA (dihydrojasmonic acid), IAA, ME-IAA, and ICA (Indole-3-carboxaldehyde) were used to quantify each compound. Ten fully expanded leaves from 10 independent plants subjected to each of the stress treatments and control were pooled as one biological replicate for hormone quantification, and three biological replicates were performed.
Accession number
Raw and processed RNA-Seq data files were deposited in SRA (https://www.ncbi.nlm.nih.gov/sra/) under the following accession numbers SRR13398916, SRR13398917, SRR13398918, SRR13398919, SRR13398920, SRR13398921, SRR13398922, SRR13398923, SRR13398924, and SRR13398925.
Supplemental data
Supplemental Figure S1. The experimental design used for the study of drought, cold stresses, and their combination using maize.
Supplemental Figure S2. Partial significant GO terms enrichment for upregulated DEGs and downregulated DEGs under drought, cold, and their combination stress and recovery stages (FDR < 0.05).
Supplemental Figure S3. Expression profile of TF WRKY.
Supplemental Figure S4. Expression profile of TF NAC.
Supplemental Figure S5. Expression profile of TF bZIP.
Supplemental Figure S6. Expression profile of TF bHLH.
Supplemental Figure S7. Expression profile of TF MYB.
Supplemental Figure S8. Expression profile of TF AP2/EREBP.
Supplemental Figure S9. Immunoblot analysis of representative subunits of photosynthesis proteins.
Supplemental Figure S10. Effects of ABA pretreatment and sequential cold stress (ABA&C), single and combined stresses on plant survival rate (%).
Supplemental Table S1. The relative abundance of DEGs under C, D-pre, D, D&C treatments, or recovery; relates to Figure 4, A and B.
Supplemental Table S2. The relative abundance of common DEGs under treatments or recovery, and DEGs uniquely induced by D&C treatment; relates to Figure 4, C.
Supplemental Table S3. The GO term enrichment of DEGs under treatments and recovery; relates to Supplemental Figure S2.
Supplemental Table S4. The relative expression of significantly altered WRKY, NAC, bZIP, bHLH, MYB, and AP2/EREBP TFs under treatments and recovery; relates to Supplemental Figures S3–S8.
Supplemental Table S5. The expression pattern of DEGs involved in photosynthesis, and raffinose, trehalose, proline biosynthesis, and LEA family genes; relates to Figure 5.
Supplemental Table S6. The expression pattern of DEGs involved in hormone biosynthesis and ABA signaling; relates to Figure 6.
Supplemental Table S7. The relative abundance of identified metabolites under treatments and recovery; relates to Figure 7.
Acknowledgments
The authors thank Dr. Ze Wei, Yanyan Yan, Rudan Geng, and Jinxiang Yan (Institute of Crop Sciences, Chinese Academy of Agricultural Sciences) for technical assistance and Dr. Shengyan Li (Biotechnology Research Institute, Chinese Academy of Agricultural Sciences) for providing Zea mays L., B73, seeds.
Funding
This work was supported by the Innovation Program of Chinese Academy of Agricultural Sciences, the Elite Youth Program of the Chinese Academy of Agricultural Science, the National Key Research and Development Program China (2016YFD0300102), Fundamental Research Funds for the Central Universities (BLX201938) and China Postdoctoral Science Foundation (2017M620967).
Conflict of interest statement. None declared.
Q.G. and W.Z. conceived the original research plans, performed the experiments, and analyzed the data. Q.G., X.L., and L.N. performed the ABA application experiment. W.Z. supervised the research and provided laboratory infrastructure and funding. P.E.J. critically commented and edited the manuscript. Q.G. wrote the article and prepared the figures. All authors read and approved the final manuscript.
The author responsible for distribution of materials integral to the findings presented in this article in accordance with the policy described in the Instructions for Authors (https://dbpia.nl.go.kr/plphys/pages/general-instructions) is: Wenbin Zhou ([email protected]).
References
Author notes
Senior author.
