


Abstract
Lipid structures affect membrane biophysical properties such as thickness, stability, permeability, curvature, fluidity, asymmetry, and interdigitation, contributing to membrane function. Sphingolipids are abundant in plant endomembranes and plasma membranes (PMs) and comprise four classes: ceramides, hydroxyceramides, glucosylceramides, and glycosylinositolphosphoceramides (GIPCs). They constitute an array of chemical structures whose distribution in plant membranes is unknown. With the aim of describing the hydrophobic portion of sphingolipids, 18 preparations from microsomal (MIC), vacuolar (VM), PM, and detergent-resistant membranes (DRM) were isolated from Arabidopsis (Arabidopsis thaliana) leaves. Sphingolipid species, encompassing pairing of long-chain bases and fatty acids, were identified and quantified in these membranes. Sphingolipid concentrations were compared using univariate and multivariate analysis to assess sphingolipid diversity, abundance, and predominance across membranes. The four sphingolipid classes were present at different levels in each membrane: VM was enriched in glucosylceramides, hydroxyceramides, and GIPCs; PM in GIPCs, in agreement with their key role in signal recognition and sensing; and DRM in GIPCs, as reported by their function in nanodomain formation. While a total of 84 sphingolipid species was identified in MIC, VM, PM, and DRM, only 34 were selectively distributed in the four membrane types. Conversely, every membrane contained a different number of predominant species (11 in VM, 6 in PM, and 17 in DRM). This study reveals that MIC, VM, PM, and DRM contain the same set of sphingolipid species but every membrane source contains its own specific assortment based on the proportion of sphingolipid classes and on the predominance of individual species.
Introduction
The composition and amounts of proteins, carbohydrates, and lipids determine the identity and functionality of biological membranes and their specialized functions in different subcellular compartments. Solubility, charge, volume, size, and reactivity of the membrane lipids contribute to define the biophysical properties of the membranes. These properties, such as thickness, stability, permeability, curvature, fluidity, lateral diffusion, asymmetry, and interdigitation, influence the physiological role of the membrane during plant developmental processes and in stress conditions (Niemelä et al., 2009; Marquês et al., 2015; Maula et al., 2015; Cacas et al., 2016; Fanani and Maggio, 2017; Fujimoto and Parmryd, 2017; Gronnier et al., 2017; Grosjean et al., 2018).
Three of the most common and abundant lipid families in plant membranes are glycerophospholipids, sterols, and sphingolipids. Due to the relatively recent development of selective procedures of extraction and identification, sphingolipids have emerged as a vast, abundant, and diverse lipid group in plants (Markham et al., 2006; Cacas et al., 2013). In addition, an increasing number of functions accredited to sphingolipids encompasses major aspects of cell biology (Ali et al., 2018; Huby et al., 2020).
As amphiphilic molecules, sphingolipids are allocated to cell membranes and from there, they constitute the dynamic structural support of the bilayer (Tapken and Murphy, 2015; Michaelson et al., 2016; Mamode Cassim et al., 2020) and act as physiological mediators of stomatal closure, programmed cell death, plant-microbe interactions, abiotic stress responses, plasmodesmata function and pollen, fruit, and seed development (Dietrich et al., 2008; Luttgeharm et al., 2016; Ali et al., 2018; Inês et al., 2018; Mamode Cassim et al., 2019; Gonzalez-Solis et al., 2020).
In plants, complex sphingolipids are classified into four classes, ceramides (Cers), hydroxyceramides (hCers), glucosylceramides (GlcCers), and glycosylinositolphosphoceramides (GIPCs) that constitute approximately 4%, 3%, 37%, and 56%, respectively, of the total sphingolipids extracted from Arabidopsis (Arabidopsis thaliana) leaves (Sperling et al., 2005; Markham et al., 2006; Markham and Jaworski, 2007; Luttgeharm et al., 2016; Mamode Cassim et al., 2019). Genetic, pharmacological, and biochemical approaches have helped to establish some assignments to these sphingolipid classes. However, the identification of the individual species responsible for these roles remains unachieved. Because of their low abundance, Cers and hCers are considered metabolic intermediates or sources of signaling molecules. Cers have been involved in the cold stress and the plant immune responses (Liang et al., 2003; Dutilleul et al., 2015). hCers have been reported as signaling transducers in hypoxia stress (Xie et al., 2015). Because of their high abundance, GlcCers and GIPCs have been identified as structural components of PM, VM, plasmodesmata, Golgi, and ER membranes, with concentration in the nanodomains (Gronnier et al., 2019). In addition, Cers and GIPCs display signaling roles related to their structural membrane allocation. For instance, GlcCers are involved in gametophyte development, morphology and secretion of Golgi membranes, low-temperature performance, organogenesis, and cell differentiation (Dietrich et al., 2008; Melser et al., 2010; Chen et al., 2012; Msanne et al., 2015). GIPCs have been postulated as structural signaling connectors between the PM and the cell wall (Mamode Cassim et al., 2020), as elements in several forms leading to the defense against pathogens, in the pollen viability, and in the perception of high salt levels (Wang et al., 2008; Mortimer et al., 2013; Rennie et al., 2014; Fang et al., 2016; Jiang et al., 2019). This diversity of functions explains the essential character of sphingolipids in plants.
The hydrophobic moiety of sphingolipids is constituted by two acyl chains: a fatty acid (FA) with 16–26C and a long-chain base (LCB) of 18C. LCBs can be dihydroxylated at C1 and C3 or trihydroxylated with a third OH at the C4 position and can contain a double bond in C4 (trans configuration) and in C8 (cis or trans configuration). The FA can have a double bond in C9 (cis configuration). The LCB and FA are bound through an amide bond between the amino group in the C2 from the LCB and the carboxyl group of the FA forming the Cer backbone. When the C2 position of the FA is hydroxylated, then a hCer backbone is formed. When the hydroxyl group from the C1 of the LCB forms a 1,4 glycosidic linkage to a glucose unit, a GlcCer is named and when it is esterified to a phosphoinositol linked to several carbohydrate units, a GIPC is produced. The OH from the Cers and hCers, the glucose residue from the GlcCers, and the phosphoinositol bound to the other sugar residues form the polar head of sphingolipids. The number of possible LCB forms (hydroxylated, unsaturated), FAs (hydroxylated, unsaturated, with different carbon number), and carbohydrates (diverse type and number of sugars) may render an immense number of assembled combinations or sphingolipid species (Luttgeharm et al., 2016).
Some plant cell membranes are particularly enriched in sphingolipids: the ER and GA membranes, the plasma membrane (PM), and the vacuolar membrane (VM). Detergent-resistant membranes (DRM) are sub-PM preparations very useful in the characterization of the composition and function of membrane nanodomains that have sphingolipids and sterols as their major constituents (Sezgin et al., 2017). Microsomal membranes (MIC) are a heterogeneous population of membrane vesicles from the different organelles and the PM. These membranes have distinct and essential functions in plant cells. In the mesophyll cells, for example, VM and PM surround two important spaces: the cytoplasm and the vacuolar lumen, respectively. The PM is the ultimate border of the cell and carries out solute transit, external signal perception, energy transduction, cell-cell recognition, in-site synthesis of secreted compounds, and so on (Mamode Cassim et al., 2019). PM contains nanodomains, which recruit proteins and lipids involved in signaling, cell-cell recognition, and communication (Tapken and Murphy, 2015). VM carries out solute transport, water movement, metabolite storage, lytic actions, and energy transduction (Cui et al., 2020). Many of these functions are performed by specific proteins, but lipids are the matrix supporting these proteins, determining their tertiary and quaternary structures and, in many cases, regulating their activity. This matrix is a source of signaling lipids and environmental sensors (Gronnier et al., 2019). Therefore, resolving the lipid composition of the MIC, PM, DRM, and VM is essential to understand their physiological purposes in a specific membrane.
This work describes the sphingolipidomes from the MIC, VM, PM, and DRM from Arabidopsis leaves, and the implication of the sphingolipid composition in the properties and functions of these membranes is discussed. For this, we generated a set of 18 biological independent membrane preparations from which sphingolipids were selectively extracted and chemically separated. The independent analyses allowed the identification and quantitation of molecular species of particular pairings of LCBs and FAs corresponding to the 84 hydrophobic moieties from the four sphingolipids classes (Cers, hCers, GlcCers, and GIPCs) present in MIC, VM, PM, and DRM. The experimental values were evaluated and compared using univariate and multivariate analysis to assess the allocation and distribution of the sphingolipid classes and individual sphingolipid species across the four membrane types. This analysis provides information about the potential influence of the sphingolipid composition in the properties and functions of the MIC, VM, PM, and DRM.
Results
Microsomal, plasma, vacuolar, and DRM assessment
To characterize the sphingolipid composition of the PM, VM, and DRM, using as a reference the MIC fraction, several procedures were followed as shown in Figure 1. Two aspects were used to assess the purity of every membrane preparation: ultrastructure and detection of membrane protein markers by specific antibody recognition. The MIC fraction was constituted by a heterogeneous population of vesicles with diameters from 100 to 400 nm, stained with variable contrast, and by the abundant presence of amorphous electrodense material (Figure 2A). The ultrastructure of the VM preparation had a more homogeneous pattern in terms of shapes and a predominant vesicle size between 100 and 500 nm (Figure 2A). In the PM fraction, vesicle structures were homogeneously stained, with similar shapes and with sizes between 50 and 300 nm. The DRM ultrastructure micrograph presented a majority of nonvesicular fibrillary structures with lengths between 50 and 500 nm and some vesicular formations. The purification of membrane preparations was evaluated by immunodetection of PM and endomembrane marker proteins. All the membrane markers were detected in MIC: PM H+-ATPase and a PM aquaporin, sterol methyltransferase 1 from endoplasmic reticulum (ER), the alternative oxidase (AOX) from the mitochondrial inner membrane, and the Na+/H+ antiporter from the VM (Figure 2B). The VM marker was only present in this membrane and the two PM markers were abundant in the PM preparation that also included traces of ER and VM markers. The DRM, which was obtained from the PM fractions, reacted only against the PM markers. The Coomassie-stained protein gel shows the profiles of all the membrane preparations and was also the loading control (Figure 2C). Altogether, these results showed that an adequate purification of the corresponding membrane fractions was attained.
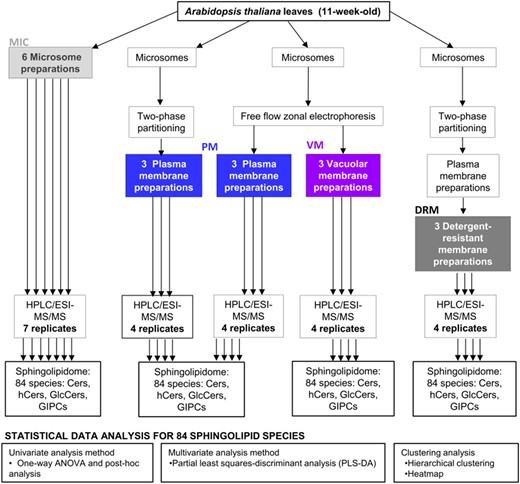
Experimental approach followed for the analysis of membrane sphingolipidomes. Arabidopsis (A. thaliana; Col-0) leaves from 11-week-old plants were used to obtain the crude membrane fraction, microsomes (MIC). From this, VM and PM were purified. PM fractions were obtained by two methods, phase partitioning, and free-flow electrophoresis. DRM fractions were obtained from the PMs isolated by two-phase partitioning. Every membrane preparation was independently treated and extracted for sphingolipid analysis by HPLC/ESI-MS/MS. Thus, the 18 independent membrane preparations are named 18 biological replicates and are composed of six MIC preparations, three VM preparations, three PM preparations obtained by two-phase partitioning, three PM preparations obtained by FFZE, and three DRM preparations. Every biological replicate was used for one sphingolipid extraction and sphingolipid analysis (one technical replicate). However, only for one biological sample from each type of membrane, two extractions were performed (two technical replicates). Therefore, a total of 23 technical replicates were obtained as shown. The different statistical tests applied to the data are indicated.
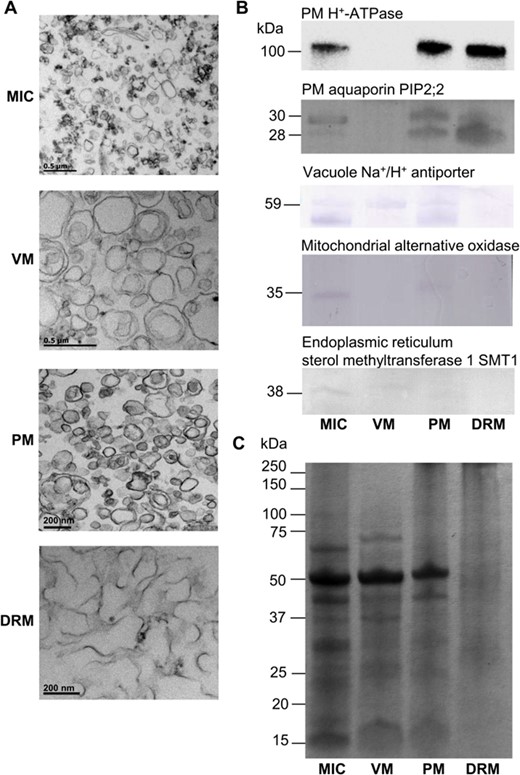
Purity assessment of MIC, VM, PM, and DRM fractions from Arabidopsis leaves. A, Transmission electron micrographs from MIC, VM, PM, and DRM preparations from Arabidopsis leaves. MIC, VM, PM, and DRM pellets were fixed and processed as indicated in the Materials and Methods. B, Immunodetection of the PM H+-ATPase and a PM aquaporin, the Na+/H+ antiporter from the VM, the AOX from the mitochondrial inner membrane, and the sterol methyltransferase 1 from ER. Membrane proteins were separated by SDS-PAGE and detected by immunoblot. C, Protein loading was determined by Coomassie blue staining of a replicate gel, wherein equal quantities of protein were loaded in the lanes. MIC, microsomal fraction.
With the aim of acquiring a set of robust data for this study, a total of 18 biological independent membrane preparations were isolated rendering a total of 23 technical replicates (Figure 1). The sphingolipid contents of 23 samples were separately processed, analyzed by HPLC/ESI-MS/MS, and statistically scrutinized. Eight PM preparations were purified by two different procedures as described in the Materials and Methods section. Their similarity was statistically verified and, therefore, they were treated independently but under the common denomination of PMs (see the Materials and Methods section for details). Then, the chemical analysis of sphingolipid molecular species from the four membrane sources (MIC, VM, PM, and DRM) was performed, which included the selective extraction and analytical separation of the four complex sphingolipids classes: Cers, hCers, GlcCer, and GIPCs. Analyses measured the exact pairings of FAs and LCBs in the constituent ceramides. The extended profiling is described in Supplemental Data set S1. As a result, 160 species of sphingolipids composed of an LCB and a FA were identified. From these, 76 species presented levels below the detection limits, resulting in a final profile of 84 species.
Content of sphingolipids and distribution of sphingolipid classes in MIC, VM, PM, and DRM
The quantitative distribution of the complex sphingolipid classes was determined for each membrane source (Figure 3). This was calculated on the basis of the relative sphingolipid content as a molecular percentage (mol %), as is conventional in this type of study. In addition, distribution was calculated in absolute amounts of sphingolipids per mg protein. Regarding the latter, the protein yields of every membrane preparation were considered and normalized according to the MIC preparation, which was the starting point for the three membrane preparations (Supplemental Table S1; Supplemental Figure S1). The general structure of the four sphingolipid classes is depicted in Figure 3A. The total sphingolipid amount was first compared in Figure 3B, revealing that while MIC contained 44.8 nmol sphingolipid/mg protein, all the other membranes were enriched in these lipids. VM and PM had very similar sphingolipid contents in terms of mg of protein, while DRM showed a 6-fold enrichment compared to the other membranes. Then, the contribution of every sphingolipid class to the MIC, VM, PM, and DRM was expressed in absolute amounts (Figure 3C). It was found that the Cer amount was moderate in the PM (22.3 nmol/mg of protein), higher at the VM (81.3 mol/mg of protein), and vast in DRM (715.4 nmol/mg of protein). The hCer fraction was represented in MIC with values of 10 nmol/mg of protein, followed by the PM (95.7 nmol/mg of protein), then by the VM (413.3 nmol/mg of protein), and DRM (2,181 nmol/mg of protein). The GlcCer content showed in MIC a low content (8.3 nmol/mg of protein) while the highest values corresponded to VM (504 nmol/mg of protein) and DRM (712.2 nmol/mg of protein), with the PM showing a moderate content (143.7 nmol/mg of protein). Finally, GIPC analysis revealed similar contents in the VM and the PM, which was increased 10-fold in DRM. The quantitative distribution of the four sphingolipid classes as compared to the total content in every membrane type was resolved (Figure 3D). Cers were predominant in DRM (app. 11.3% of the total sphingolipid content). The hCers showed a similar distribution among all membranes (app. 20% of the total sphingolipid content in the respective membrane). GlcCers were abundant in the VM (app. 34% of the total sphingolipid content). GIPCs were the most abundant class of sphingolipids in the PM (approximately 68% of its total sphingolipid content) and in the MIC and DRM (approximately 44% of their total respective sphingolipid content). These data indicate that the distribution of sphingolipid classes and their respective species were different across membrane types.
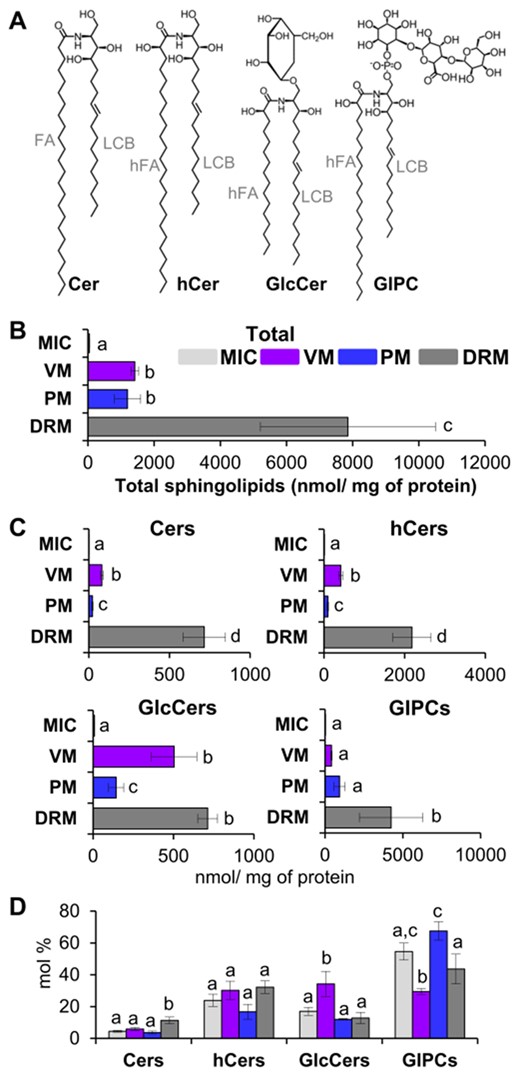
Sphingolipid content and sphingolipid class distribution from MIC, VM, PM, and DRM of Arabidopsis leaves. A, Representation of the structure of the main sphingolipid classes studied in this work. Cers, ceramides; hCers, hydroxyceramides; GlcCers, glucosylceramides; GIPCs, glycosylinositolphosphoceramides; FA, fatty acid; hFA, hydroxylated fatty acid; LCB, long-chain base. B, Total sphingolipid content from MIC, VM, PM, and DRM preparations. C, Content of every sphingolipid class in MIC, VM, PM, and DRM. Membrane types are indicated in colors (light gray for MIC, magenta for VM, dark blue for PM, and dark grey for DRM). D, Distribution of sphingolipid classes within every membrane type. Values are expressed as mean ± SE from 4 to 8 technical replicates depending on the membrane source from the independent biological preparations (see Figure 1). Different lowercase labels in bars indicate statistical differences (i.e., in panel B, VM and PM labeled as “b” were not statistically different among them, while both VM and PM are statistically different to MIC labeled as “a” and to DRM labeled as “c”). One-way ANOVA with Fisher’s post hoc test for multiple comparisons, P < 0.05 was performed.
Overall assessment of sphingolipid profiles
To provide an overview of the general patterns among the different membranes, the quantitative data obtained from these 84 sphingolipid species were subjected to partial least squares-discriminant analysis (PLS-DA). PLS-DA is a method that uses multivariate regression to project variance along groups, giving information about the similarity among the different membranes and across replicates on the basis of their species content (Figure 4A). The sphingolipid content analysis showed that every type of membrane preparation was different from the others while their replicates were similar. To assess the diversity and distribution of sphingolipid classes in the four different types of membranes, a hierarchical clustering analysis was performed on the 84 species of complex sphingolipids (Figure 4B). This clearly revealed a membrane-specific profile for every one of the four sphingolipid classes in Arabidopsis leaves. As it can be observed in the heat map, there was enrichment of Cers in DRM, of GlcCers in the VM, and of GIPCs in the PM (Figure 4B). Although GIPCs predominated in DRM, other sphingolipid classes were overrepresented as well (Figure 4B). These results indicate that membranes are characterized by their sphingolipid profiles.
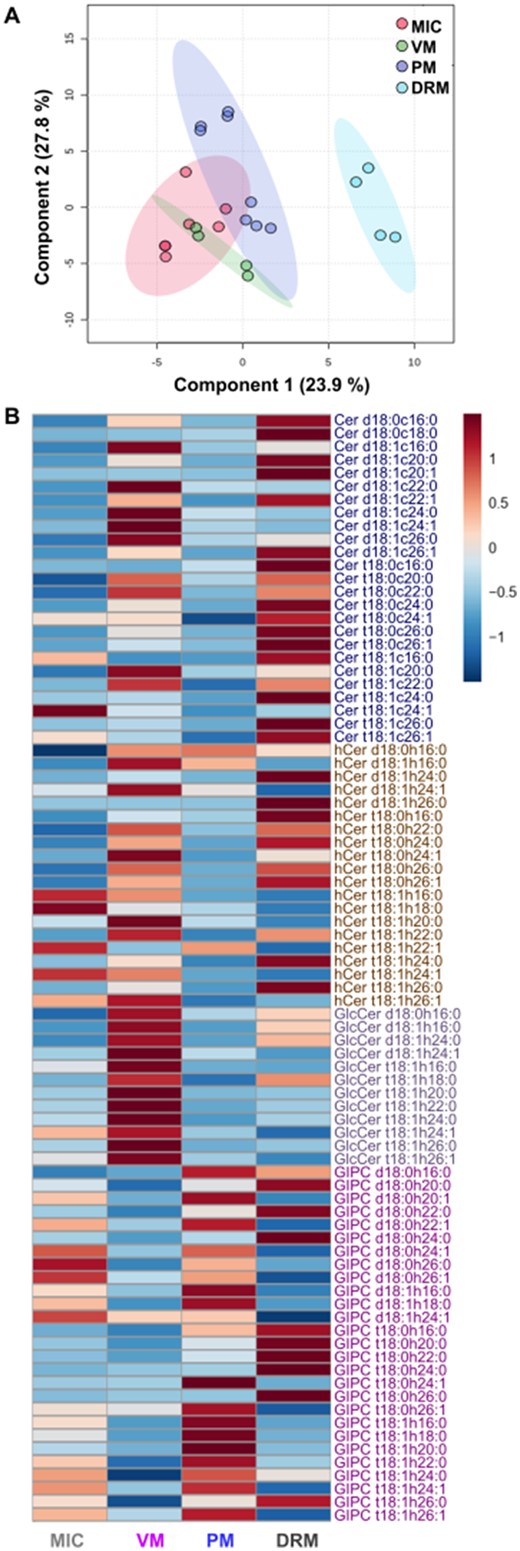
Multivariate analysis and heatmap plot of the sphingolipidome profiles from MIC, VM, PM, and DRM of Arabidopsis leaves. A, Partial least squares-discriminant analysis (PLS-DA) of sphingolipid profiles from the independent preparations of MIC, VM, PM, and DRM obtained from Arabidopsis leaves. B, Comparison of global sphingolipidomes from MIC, VM, PM, and DRM. Heat map visualization shows the standardized (z-scores) concentrations of individual sphingolipid species from mol %. Hierarchical clustering of the sphingolipid classes was used to group similar profiles using Euclidean distances and Ward clustering.The scale from 1 to −1 represents the number of standard deviations from the mean. Blue color indicates lower concentrations than average and red color indicates higher concentrations than average. In B, average values from the technical replicates were considered for each membrane preparation (7, 4, 8, and 4 for MIC, VM, PM, and DRM, respectively). These analyses required the processing of a total of 1,932 values from LCBs and FAs (mol %) that yielded 84 paired sphingolipid species (a LCB bound to a FA each) from the 23 technical replicates. The sphingolipid classes were Cers, ceramides; hCers, hydroxyceramides; GlcCers, glucosylceramides; GIPCs, glycosylinositolphosphoceramides.
LCB and FA profiling in Cers, hCers, GlcCers, and GIPCs from MIC, VM, PM, and DRM
We focused on the dissection and identification of the hydrophobic region of the four sphingolipids classes. Thus, the LCB and FA compositions of the four sphingolipid classes from the four membrane types were compared (Supplemental Figures S2 and S3). We identified four LCBs that differed in terms of unsaturation degree and hydroxylation: two were dihydroxylated forms (d18:0, d18:1) and two, trihydroxylated forms (t18:0, t18:1; Supplemental Figure S2A). In all membranes, the four sphingolipid classes predominantly contained trihydroxylated LCBs, while the dihydroxylated forms had a lower abundance in the Cers and were present in about 5% of the GlcCers and GIPCs. The predominant unsaturated LCB was the t18:1 form.
Considering the LCBt18/LCBd18 ratios in the membranes and classes studied, hCers presented the highest values, especially in the MIC (Supplemental Figure S2B). According to the LCBsat/LCBuns ratios, the highest values corresponded to the Cers and GIPCs in all the membranes, but the DRM source was the one with maximal saturated over unsaturated LCBs (Supplemental Figure S2C).
The analysis identified 20 FA species, differing in length, degree of unsaturation, and hydroxylation (Supplemental Figure S3). Ten nonhydroxylated FAs (c16:0, c18:0, c20:0, c20:1, c22:0, c22:1, c24:0, c24:1, c26:0, c26:1) were exclusively associated with free Cers, while the other 10 hydroxylated FA species (h16:0, h18:0, h20:0, h20:1, h22:0, h22:1, h24:0, h24:1, h26:0, h26:1) were associated with hCers, GlcCers, and GIPCs. The four sphingolipid classes in the MIC, VM, PM, and DRM contained as a long-chain fatty acid (LCFA), the 16C species but the main contributors were very-long-chain fatty acids (VLCFAs) with 22, 24, and 26C both in saturated and unsaturated versions (Supplemental Figure S3A; Supplemental Table S2). The comparative sum of these species was appreciated in the LCFA/VLCFA ratios plot (Supplemental Figure S3B). These ratios showed that the hCers and GIPCs were mostly formed by VLCFAs that were much less prevalent in Cers and especially in GlcCers. In this class, DRMs were the membranes with the highest LCFA/VLCFA ratios. We calculated the saturated over unsaturated FA ratio (Supplemental Figure S3C). We observed that Cers showed the highest ratio as compared to the other three sphingolipid classes and in the four membranes. However, DRM showed the highest saturated over unsaturated FA ratio in all the membranes.
An overview of all the individual LCB and FA species found in the four sphingolipid classes from MIC, VM, PM, and DRM is depicted in Supplemental Figures S2 and S3. Additionally, the composition of LCB and FA from Cers and hCers in the MIC, VM, PM, and DRM is shown in Supplemental Figure S4. Cers with dihydroxylated LCBs were mainly acylated with a C16:0 FA in all membranes; minor amounts of these LCBs were acylated to LCFAs in DRM and VM showed some species bound to VLCFAs (Supplemental Figure S4A and B). Ceramides with trihydroxylated LCBs were much more abundant in all membranes, especially in DRM, and they were acylated to a LCFA of C16:0, but preferentially to VLCFAs ≥ 24C (Supplemental Figure S4C and D). Concerning the hCer fraction, this showed similar combinations of LCB species bound to FAs as the Cer class, but now acylated to hFAs/hVLCFAs (Supplemental Figure S4E–H). In addition, dihydroxylated LCBs were more abundant than trihydroxylated LCBs in hCers and although they were all acylated to a hFA of 16C:0, dihydroxylated and saturated LCBs and trihydroxylated LCBs were bound to a hVLCFA ≥ 24C, particularly the C24:0 and C24:1 species.
The molecular pairings of LCB and FA in GlcCers and GIPCs were determined (Supplemental Figure S5). GlcCers present in all membranes were characterized for a 40-fold higher content of the d18:1 LCB as compared to the saturated form. Practically, all these two LCBs were acylated to the hLCFA C16:0 and only some of the unsaturated LCBs were linked to a hVLCFA C24:0 (Supplemental Figure S5A and B). The GlcCer species containing t18:1 exceeded by about 100-fold the amount of the t18:0 forms and both were acylated with a h16:0 FA. In addition, the GlcCers containing t18:1 included a large amount of VLCFAs, the h22:0, h24:0, h24:1, h26:0, and h26:1. This was a pattern shared by all membranes (Supplemental Figures S5C and D).
In the GIPC class, d18:0 and d18:1 LCBs had similar low abundance, but while the unsaturated LCB was mainly acylated with a C16:0 hLCFA, the saturated LCB forms were mainly acylated with hVLCFAs from 22 to 26C (Supplemental Figure S5E and F). GIPCs constituted by trihydroxylated LCBs contained the t18:0 and t18:1 species but the latter were the more abundant from all the sphingolipid classes, and their amidated FAs were mainly hVLCFAs with C22:0, C24:0, C24:1, C26:0, and C26:1. This profile was observed in all the membrane types (Supplemental Figure S5G and H).
The abundance and distribution of these 84 sphingolipid species in terms of classes and membrane types were described (Supplemental Figure S6). The profile corresponded to 25 Cer, 20 hCer, 12 GlcCer, and 27 GIPC species. We observed that the Cer class is particularly abundant in DRM, represented by about seven species, then VM is next in decreasing order of abundance and diversity of Cer species, followed by PM and MIC. The Cer species were mainly formed by both saturated and unsaturated trihydroxylated LCBs and saturated VLCFAs. A small contribution of dihydroxylated LCBs bound to LCFAs of 16C and 18C was found in VM. The hCer species formed almost exclusively by trihydroxylated LCBs bound to VLCFAs were abundant in VM and DRM and to a lesser extent in PM and MIC. The GlcCer species were more represented in VM and DRM with a few species containing di or trihydroxylated LCBs. The GIPCs were abundant in all membranes, especially in PM and DRM, and the more profuse varieties contained trihydroxylated LCBs and VLCFAs of 24C, in saturated and unsaturated forms.
Predominance of sphingolipid classes and individual species in MIC, VM, PM, and DRM
The complexity of the experimental data from this lipidomics study had as a particular focus, to assign, from all the chemical species identified, those that were preferentially distributed to a particular membrane. This allocation was central, since it could allow deciphering the role of the special lipid assortment in the properties and functions of the VM and PM. As a first approach, the distribution of molecular sphingolipid species according to their representativeness among the MIC, VM, PM, and DRM was shown (Figure 5). From the 25 Cers identified, only four Cer species were of high abundance but only distributed in VM and DRM, while more than 20 Cer forms were identified in the four membrane sources, but at low content (Figure 5A). The four highly represented Cer species are depicted in the right part of the Figure 5A panel, which shows that these species contained trihydroxylated LCBs and VLCFAs. The distribution of the 20 hCer forms was more similar among the four membrane types, since the more abundant were from five to seven species and the less abundant between were 13–15 species (Figure 5B). The hCer species with the highest abundance in the four membranes were the same two species that differed only in the desaturation of the FA, as it is shown in the right part of the Figure 5B panel. Regarding the distribution and abundance of the 12 GlcCer species identified, VM showed the highest diversity of forms (seven in total), which were found at high content as compared with four species identified in MIC, PM, and DRM (Figure 5C). The seven forms present in the VM belonged to the high content interval, but at different extents as shown in the right part of the Figure 5C panel. Finally, the GIPC class, constituted by 27, 24, 27, and 25 species in MIC, VM, PM, and DRM, respectively, integrated a diverse and the more abundant sphingolipid class (reaching contents of 19%) in the four membrane sources (Figure 5D). From the seven species in the highest interval of relative concentration, only one (GIPC t18:1h24:0) is the same that is partitioned to the four membranes, the rest are rather selective for a certain membrane. Most of the GIPC species belonged to an abundance between 1 and 1.99% in the membranes.
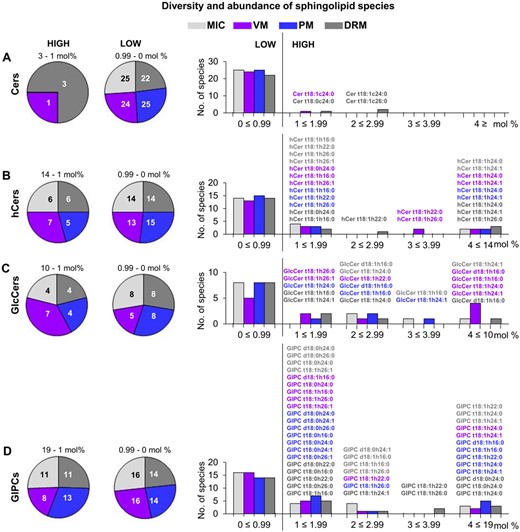
Distribution of molecular sphingolipid species according to their diversity and abundance in MIC, VM, PM, and DRM from Arabidopsis leaves. A. Distribution of Cer species in MIC, VM, PM, and DRM. Left pie chart includes the highly abundant species and right pie chart includes the low abundant species. Bar graphs at the right side indicate the number of low and high abundant species. Structures of highly abundant species in three different abundance intervals are depicted in colors according to the membrane type (light gray for MIC, magenta for VM, dark blue for PM, and dark grey for DRM). B–D, Illustrate the same but for hCers, GlcCers, and GIPCs, respectively. The abundance of sphingolipid species is expressed in mol % from 4 to 8 technical replicates depending on the membrane source (see Figure 1).
As a second approach, we aimed to distinguish which individual sphingolipid species were more represented in one specific membrane as compared to the others in our study. The approach here followed was to perform a one-way ANOVA analysis and a Fisher’s post hoc test considering the 84 sphingolipid species already identified. This scrutiny allowed the selection of a total of 44 sphingolipid species with significant differences across the membranes studied. Such species were grouped in terms of their belonging to a sphingolipid class and according to their abundance in the membrane preparations. These results were expressed as the individual species that, although found in other membranes, were statistically more abundant in only one membrane type (Figures 6 and 7).
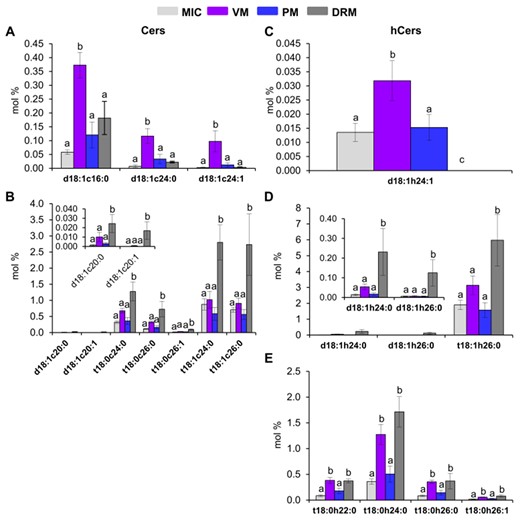
Differential distribution of individual species of Cers and hCers among the MIC, VM, PM, and DRM from Arabidopsis leaves. A and B, Cer individual species. C–E, hCer individual species. Values are expressed as mean ± SE from 4 to 8 replicates depending on the membrane source (see Figure 1). Different lowercase labels between bars indicate statistical differences as described in Figure 3.
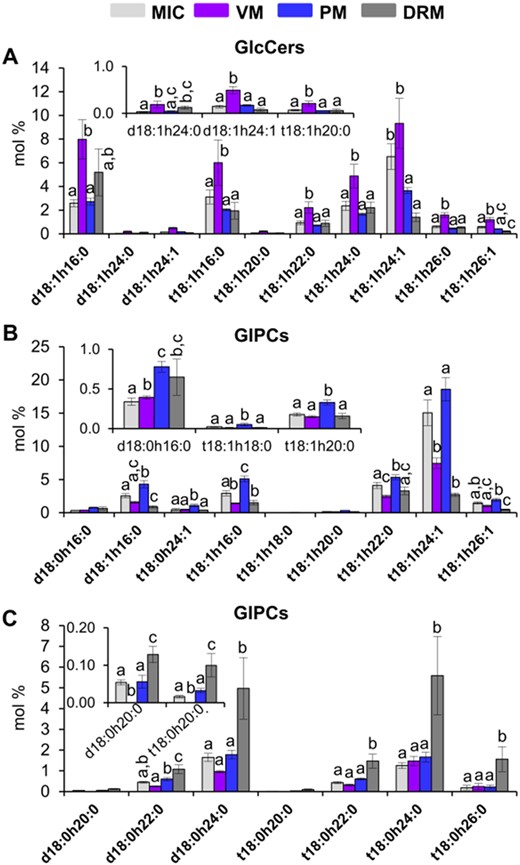
Differential distribution of GlcCer and GIPC individual species among the MIC, VM, PM, and DRM from Arabidopsis leaves. A, GlcCer individual species. B and C, GIPC individual species. Values are expressed as mean ± SE from 4 to 8 replicates depending on the membrane source (see Figure 1). Different lowercase labels between bars indicate statistical differences as described in Figure 3.
Then, the individual content of Cers and hCers with a significantly different abundance among MIC, VM, PM, and DRM was determined by statistical scrutiny (Figure 6). VM showed three Cers (Cer d18:1-c16:0, Cer d18:1-c24:0, and Cer d18:1-c24:1) with up to approximately 3-fold more abundance as compared to the other membranes (Figure 6A). DRM presented seven Cers (Cer d18:1-c20:0, Cer d18:1-c20:1, Cer t18:0-c24:0, Cer t18:0-c26:0, Cer t18:0-c26:1, Cer t18:1-c24:0, and Cer t18:1-c26:0) that were increased up to 4-fold with respect to MIC, VM, and PM (Figure 6B). Eight hCer species were distributed in three groups according to their abundance in the membrane preparations (Figure 6C–E). VM showed the hCer d18:1-h24:1 with up to 2-fold more enrichment as compared to MIC and PM (Figure 6C). DRM presented three hCer species (hCer d18:1-h24:0, d18:1-h26:0, and t18:1-h26:0) that were increased up 3-fold with respect to the other membranes (Figure 6D). Then, VM and DRM were increased up to 2-fold in four-hCers: hCer t18:0-h22:0, t18:0-h24:0, t18:0-h26:0, and t18:0-h26:1 (Figure 6E).
In an analogous comparison, the individual content of GlcCers and GIPCs with a significantly different abundance among MIC, VM, PM, and DRM were plotted (Figure 7). Seven GlcCers (GlcCer d18:1-h24:0, GlcCer t18:1-h16:0, GlcCer t18:1-h20:0, GlcCer t18:1-h22:0, GlcCer t18:1-h24:0, GlcCer t18:1-h26:0, and GlcCer t18:1-h26:1) were augmented 30% in VM (Figure 7A). Six GIPC species (GIPC d18:1-h16:0, GIPC t18:0-h24:1, GIPC t18:1-h16:0, GIPC t18:1-h18:0, GIPC t18:1-h20:0, and GIPC t18:1-h22:0) showed a 2-fold increase in PM as compared to MIC, VM, and DRM (Figure 7B). Seven GIPC species (GIPC d18:0-h20:0, GIPC d18:0-h22:0, GIPC d18:0-h24:0, GIPC t18:0-h20:0, GIPC t18:0-h22:0, GIPCt18:0-h24:0, and GIPC t18:0-h26:0) were enriched about 3-fold in DRM as compared to the other membranes (Figure 7C).
Discussion
While differential lipid composition has been recognized in all cell membranes, characterization of lipidomes from specific membranes is just recently emerging in eukaryotic cells. This analysis has been scarcely performed due to the difficulty in the isolation of membranes at a high purity and the lack of protocols allowing an efficient and selective extraction of lipids linked to a powerful platform of analysis. Sphingolipidome profilings have been described in protozoa such as Leishmania and Trypanosoma (Guan and Mäser, 2017), Caenorhabditis (Cheng et al., 2019), yeast (Sacharomyces cerevisiae; Ejsing et al., 2009), fly (Fyrst et al., 2008; Walls et al., 2013), mouse brain (Chao et al., 2019), and various human organs and tissues (Merrill et al., 2009; Hammad et al., 2010; Merrill, 2011; Sampaio et al., 2011; Karsai et al., 2020; Levental et al., 2020). In plants, the sphingolipidome at the level of the whole plant or organ has been reported for Arabidopsis and rice (Markham et al., 2006; Markham and Jaworski, 2007; Ishikawa et al., 2016; Liu et al., 2020b), and a study from Cacas et al. (2016) has detailed the composition of GIPCs from tobacco.
In this study, the MIC, VM, PM, and DRM preparations showed high purity, assessed by vesicle homogeneity and protein markers, as reported for VM (Endler et al., 2006; Barkla et al., 2009), PM, and DRM (Mongrand et al., 2004; Borner et al., 2005; Lefebvre et al., 2007; Carmona-Salazar et al., 2011). The sphingolipid contents determined in our membranes are in agreement with the values that can be compared in the literature. When the amount of nmol sphingolipids/mg of protein in MIC is converted to nmol sphingolipids/g fresh weight, the resultant 55 nmol sphingolipids/g fresh weight is a value similar to those reported from Arabidopsis whole extracts, i.e. 42.5 and 12 nmol sphingolipids/g fresh weight, found by Markham and Jaworski (2007) and Liu et al. (2020b), respectively. In addition, the number and abundance of the sphingolipid species, LCBs, and FAs found in our membranes coincide with those reported in whole extracts from Arabidopsis (Markham and Jaworski, 2007; Liu et al., 2020b). These agreements are indications of the reliability of the experimental design followed to describe the present membrane sphingolipidomes.
Microsomes sphingolipid distribution, diversity, and predominance
MICs include vesicles from most of the cell membranes. Accordingly, MIC contained a high representation of ER and PM vesicles as shown by the respective membrane markers and reflected by the representation of 25 and 20 species of Cers and hCers, respectively (which are synthesized in the ER; Luttgeharm et al., 2016). In addition, MIC contained 55% of GIPCs, abundant in PM, and in whole extracts from Arabidopsis (Liu et al., 2020b). The four most abundant GlcCers in MIC showed to be present at high abundance in PMs and VMs as well. All 84 species identified in the sphingolipid profiling of the present work were represented in MIC, in accordance with its assorted vesicle composition.
VM sphingolipid distribution, diversity, and predominance
Central vacuoles in the mesophyll cells from Arabidopsis occupy about 90% of the cell volume. They are engaged in the preservation of the turgor pressure and in the degradation and reutilization of cell constituents. Vacuoles actively participate in processes as cell division, biogenesis, storage, programmed cell death, and autophagy (Zhang et al., 2015; Cui et al., 2020). The vacuolar tonoplast contributes to these dynamic functions. We found that VM contained similar relative amounts of hCers, GlcCers, and GIPCs and a minor amount of Cers. Only GlcCers had been previously reported in the VM (Verhoek et al., 1983; Yoshida and Uemura, 1986; Ozolina et al., 2013; Nesterkina et al., 2015), which was coincident with the 34% of GlcCers content that comprised 10 of the 12 identified species. Seven of the latter were predominant in the VM.
The high content of GIPCs and hCers (29.5 and 30.2%, respectively) in the VM was unexpected. However, of the 24 GIPC species found, none was prevalent in this membrane.
Regarding hCers (20 identified species, 7 as very abundant, and 1 with the highest content as compared to the other membranes), their presence could be related to the lytic character of the vacuole. They could be remains of complex sphingolipid degradation and potential biosynthetic precursors for recycled species (Cui et al., 2020). hCers could be required to maintain the impermeability of the vacuole lipid bilayer to control water flow. In the stratum corneum, hCers provide a highly hydrophobic barrier against water loss, maintaining the hydration of the skin (Cha et al., 2016). In addition, the LCBs composing the hCers could enable the VM to function as a potential reservoir of signaling LCBs and VLCFAs in plant cell death or development, respectively (Bach and Faure, 2010; Saucedo-García et al., 2011, 2015). Ceramidases are located at the ER and Golgi but in the PM as well (Luttgeharm et al., 2016; Dai et al., 2020).
PM sphingolipid distribution, diversity, and predominance
The PM carries out extensive functions in the plant cell, manifested as an isolating hydrophobic barrier that transports solutes, perceives externals signals, secretes materials, and transduces energy. These functions must be compatible with the current visualization of the PM as a nano- and micro-compartmentalized film enclosing the cell content (Jaillais and Ott, 2020). Diversity of proteins and lipids must be distributed to fulfill the structural and functional roles of such small zones.
PM contained low amounts of Cers and GlcCers (4 and 12%, respectively) but contained all the Cer and GlcCer species identified (25 and 12, respectively), most of them at low abundance and with no predominance in this membrane. However, hCers were represented in a significant proportion (17%) composed of 20 species, with only five of them of high abundance. The high incidence of -OH groups in the small polar head of the hCers (almost all the species contain trihydroxylated LCBs and a paired hydroxylated FA) could promote structural disorder at the hydrophylic region of the membrane (Maula et al., 2015). In addition, the large asymmetry produced by the acyl chains from LCBs (18C) and VLCFA (22–26C) may produce interdigitation between both membrane leaflets, which usually increases membrane viscosity (Fujimoto and Parmryd, 2017). Thus, the polar region of the hCers could contribute to a flexible surface of the PM and the acyl chains to a packed and rigid hydrophobic core.
GIPCs contributed to 68% of the PM sphingolipids. They were composed of 27 species, from which 13 were the more abundant and six preferentially enriched in the PM. The high GIPC content agrees with the reports from Markham and Jaworski (2007), Ishikawa et al. (2016), and Liu et al. (2020b), and is close to the 40% value reported for tobacco PM (Cacas et al., 2016). GIPCs contain the most voluminous hydrophilic heads of all the membrane lipids in plants. Although the present study excluded this polar moiety, it must be recalled that this is an additional chemical feature that adds diversity to GIPCs. The number of identified species in our work was similar to that from tobacco (Cacas et al., 2016) and rice (Ishikawa et al., 2016). However, while the predominant GIPC in Arabidopsis is N-acetyl-hexosamine-hexuronic-inositolphosphate (Markham et al., 2006), tobacco contains species with two polar heads belonging to the A series (Cacas et al., 2016) and rice showed species with four polar heads with different sugars (Ishikawa et al., 2016). This variety of molecular structures protruding from the membrane surface provides a chemical topology suitable for recognition or sensing of external molecules/signals. A GIPC interacting with a rhamnogalacturonan from the cell wall pectins forms an attachment site to the PM (Voxeur and Fry, 2014). A PM GIPC is capable of sensing Na+ ions as the first event in the Arabidopsis response to salinity stress (Jiang et al., 2019). The 21 GIPC species containing VLCFA identified in this study support the proposed roles of sphingolipids in PM nanodomain formation (Gronnier et al., 2018), which interdigitation may facilitate cell-to-cell communication (Cacas et al., 2016), and which length may contribute to regulate the PM fluidity (Uemura et al., 1995; Minami et al., 2009).
DRM sphingolipid distribution, diversity, and predominance
Sphingolipids, together with sterols, conform the lipid matrix of nanodomains (Simons and Ikonen, 1997). They recruit specific proteins mainly involved in signaling, favoring a more effective interaction that can be used in stress responses (Sutter et al., 2006; Minami et al., 2009; Raffaele et al., 2009) and in the regulation of plasmodesmata function (Yan et al., 2019; Liu et al., 2020a). DRM are vesicle preparations obtained, in our case, from PM and that have been very useful tools in the studies on membrane nanodomains in plants (Mamode Cassim et al., 2019). The typical sphingolipids identified in these nanodomains have saturated and very long acyl chains (Grosjean et al., 2018). Our analysis revealed that DRMs had the highest sphingolipid content (8-fold as compared to VM and PM) and that some sphingolipid species from the PM were concentrated in DRMs as reported in other plant species (Mongrand et al., 2004; Laloi et al., 2007; Lefebvre et al., 2007; Cacas et al., 2016). DRMs contained 44% GIPCs. The acyl part of the seven GIPC species, which were enriched (up to 3-fold) in DRM as compared to PM, contained both LCFAs and saturated VLCFAs, a t18:0 LCB, and a predominance of a t18:1 LCB as a clear trait of association to nanodomains. In addition, this is the main form associated with GIPCs in total extracts from Arabidopsis (Markham et al., 2006; Chen et al., 2012). In addition, DRM predominantly included Cer and hCer species (7 and 3, respectively) that were not enriched in the PM, indicating that these preparations and their analyses reflect the selectivity and abundance of individual species targeted to specific membranes.
Conclusion
The analyses of the hydrophobic moieties of the Arabidopsis sphingolipidomes from MIC, VM, PM, and DRM, revealed a vast chemical diversity of species. The four sphingolipid classes – Cers, hCers, GlcCers, and GIPCs – were represented in the four membranes, but with different qualitative and quantitative distribution. Regarding individual sphingolipid species, their abundance and predominance revealed a selective distribution in the four membrane sources as well.
The sphingolipidomic profiles described here for the MIC, VM, PM, and DRM contribute to the knowledge of the structural matrix of plant membranes and to a future elucidation of the roles of their components and dynamics in cell processes.
Materials and Methods
Materials
Dextran T-500 and PEG 3350 were obtained from Sigma-Aldrich (St. Louis, MO, USA). Optiprep solution was obtained from Axis-Shield (Oslo, Norway). All chemicals were of the highest grade available. Antibodies against the PM H+-ATPase, PM PIP2;2, vacuolar Na+/H+ antiporter, ER sterol methyltransferase SMT1, and mitochondrial AOX were obtained from Antisera, Vännäs, Sweden.
Biological material
Arabidopsis (A. thaliana; Col-0) seeds were sown in propagation trays with a soil mixture (Mix 4 Aggregate Plus, Sunshine, Sun Gro Horticulture, Canada Ltd.; vermiculite, Premium Grade, Sunshine, Sun Gro Horticulture; Canada Ltd.; and agrolite, Dica Mex, Dicalite de México S.A. de C.V., Tlalnepantla, Edo. de México, in 3:1:1, v:v:v, respectively). After 3 weeks, seedlings were transferred to individual pots (with the same soil mixture as described above) or to hydroponic trays (with one-half strength Hoagland’s medium, Hoagland and Arnon, 1938). Plants were grown under natural solar irradiation and photoperiod, and kept at 25 ± 3°C in a greenhouse. In these conditions, the average photosynthetic active radiation (PAR) was 980 ± 293 µmol/m2/s, and the plants were nonbolting and healthy as their photosynthetic quantum yield (Fv/Fm) was 0.835 ± 0.006. All the leaves were harvested after 11 weeks and most of the leaf mass was contributed by fully extended leaves. Then, they were frozen at –70°C until use.
Microsomal membranes isolation
A total of 350 g fresh weight of Arabidopsis frozen leaves from approximately 350 plants was used to isolate every membrane preparation corresponding to a biological replicate. Microsomal fractions were obtained as described (Larsson et al., 1994). Briefly, frozen leaf batches of 40 g fresh weight were supplemented with a homogenization buffer, blended, and the homogenate filtered and subjected to a medium- and then a high-speed centrifugation. The resulting pellet, the microsomes, was resuspended and kept at –70°C until use.
PM vesicles isolation by aqueous polymer two-phase partitioning
PM was purified by aqueous two-phase partitioning systems using dextran 500 and PEG 3350 as aqueous polymers (Larsson et al., 1994; Carmona-Salazar et al., 2011). In this method, PM vesicles were separated using the microsomal fraction as the starting membrane material. PM vesicles were separated from the other microsomal vesicles according to their surface properties, and their selective partition to a polymer phase.
VM and PM vesicles isolation by FFZE
Fractionation of microsomal membranes to render tonoplast and PM vesicles was performed by free-flow zonal electrophoresis (FFZE) using the BD FFE system (BD Proteomics, Germany) as previously described (Barkla et al., 2007, 2009). The separation was started from microsomes isolated from the Arabidopsis leaves. PM vesicles are separated based on their charge-to-size ratio from the other membrane vesicles.
To determine the similarity between the PM preparations obtained by two-phase partitioning (three independent preparations, four technical replicates) and those obtained by FFE, (three independent preparations, four technical replicates), a Kruskal-Wallis sum-rank test (Kruskal and Wallis, 1952) was applied to the sphingolipid species abundance (expressed as mol %) using R v 3.5.1 (R Core Team, 2018). The test indicated no statistical differences between preparations (P = 0.3761), thus the six preparations were pooled and treated under PM denomination.
DRM isolation
DRM isolation was performed as described by Carmona-Salazar et al. (2011). This was done from PM vesicles isolated by the aqueous two-phase partitioning procedure, subjected to Triton-X-100 solubilization, and then separated with an Optiprep gradient, washed, and stored at –70°C until use. A PM amount was adjusted to have a detergent/PM protein ratio of 7 (w/w; 7 µg of Triton X-100 per 1 µg of membrane protein, as reported for Arabidopsis DRM isolation by Borner et al. (2005) and Laloi et al. (2007).
Protein determination
Total protein was determined by a modification of the Lowry method (Peterson, 1977). BSA was employed as a standard.
Immunoblotting assays
Immunoblotting was performed according to the procedure described in (Carmona-Salazar et al., 2011). Briefly, membrane proteins were separated by SDS-PAGE (Schägger and von Jagow, 1987), electrotransferred to a polyvinylidene difluoride membrane, blocked, and treated with a primary antibody (Agrisera, Vännäs, Sweden) against PM H+-ATPase (1:10,000 dilution); for PM aquaporin PIP2;2, mitochondrial AOX, ER sterol methyltransferase SMT1, and vacuole Na+/H+ antiporter the same antibody dilution was used (1:1,000). The secondary antibody (goat antirabbit IgG alkaline phosphatase conjugate, Sigma-Aldrich, St. Louis MO, USA) was used in a 1:1,000 dilution. Detection was performed with the alkaline phosphatase reaction (Sigma-Aldrich).
Sphingolipid analysis
MIC, VM, PM, and DRM preparations stored at –70°C were thawed and lyophilized (samples were chemically stable through this step). The extraction, separation, identification, and quantification of sphingolipids were performed by reverse-phase high-performance liquid chromatography coupled with electrospray ionization tandem mass spectrometry (HPLC ESI-MS/MS), as described in Markham et al. (2006) and Markham and Jaworski (2007).
Transmission electron microscopy
Ultrastructure of membrane preparations was analyzed as in (Carmona-Salazar et al., 2011). Briefly, membrane fractions were concentrated by centrifugation, fixed, and treated with osmium tetroxide. Then they were infiltrated and embedded in Epon resin. Ultrathin sections of 100-nm thick were done in a Reichert-Jung Ultracut model (Reichert, Wien, Austria) and collected on 200-mesh copper grids, stained with uranyl acetate and observed with a Jeol-JEM-1200EX electron microscope (JEOL Ltd, Tokyo, Japan) operated at 60 kV.
Data analysis
Six MIC preparations, three VM preparations, three PM preparations obtained by two-phase partitioning, three PM preparations obtained by FFZE, and three DRM preparations, all of them independently obtained, were individually used for extraction and sphingolipid analysis. A total of 18 biological independent membrane preparations were isolated rendering a total of 23 technical replicates (Figure 1).
PLS-DA, as implemented in software package MetaboAnalyst (v.0.3), was used to represent the overall variance across groups. Heatmaps of the z-scores arranged via hierarchical clustering were constructed to visualize differences among membranes. ANOVA tests were used to identify the most statistically important groups followed by the post hoc Fisher’s least significant difference (LSD) analysis, P < 0.05.
All statistical tests were performed using MetaboAnalyst v.0.3 (Xia and Wishart, 2016).
Supplemental Data
The following supplemental material is available.
Supplemental Figure S1. Multivariate analysis of the sphingolipidome profiles from MIC, VM, PM, and DRM of Arabidopsis leaves.
Supplemental Figure S2. LCB composition from the sphingolipid classes of MIC, VM, PM, and DRM from Arabidopsis leaves.
Supplemental Figure S3. FA composition from the sphingolipid classes of MIC, VM, PM, and DRM from Arabidopsis leaves.
Supplemental Figure S4. LCB/FA composition from the Cer and hCer classes of MIC, VM, PM, and DRM from Arabidopsis leaves.
Supplemental Figure S5. LCB/FA composition from the GlcCer and GIPC classes of MIC, VM, PM, and DRM from Arabidopsis leaves.
Supplemental Figure S6. Comparative profiles of sphingolipid species from MIC, VM, PM, and DRM from Arabidopsis leaves.
Supplemental Table S1. Yields from membrane fractions isolated from Arabidopsis leaves.
Supplemental Table S2. Statistical significance of the FAs present in the sphingolipid classes from MIC, VM, PM, and DRM from Arabidopsis leaves.
Supplemental Data Set 1. Sphingolipid profile of 160 sphingolipid species identified in MIC, VM, PM, and DRM from Arabidopsis leaves.
Acknowledgments
The authors are indebted to the excellent work from Consuelo Enriquez-Arredondo for her expertise in the isolation of most of the membrane preparations used here. The authors thank Dr. Christian Vázquez-Vázquez for support in statistics and graphic programs, Dr. Rodolfo Paredes for transmission electron microscopy work, and Laurel Fabila-Ibarra and Adelita Hernández-González for technical support.
Funding
This work was financed by Direccion General de Asuntos del Personal Academico, DGAPA, UNAM (grants: PAPIIT IN222815 and IN220618), CONACYT (CB-2014–01, 238368), and Facultad de Química, UNAM (5000 9115). Research in EBC lab was funded by a National Science Foundation grant MCB 1818297.
Conflict of interest statement. None declared.
L.C.-S, R.E.C, A.G.-S., and R.V.-E. performed the experiments and analyzed the data; L.C.-S. and J.G.-P. performed the informatics analyses; V.T. assisted with the informatics analyses; M.G.-R. and E.B.C. conceived the project, analyzed data and wrote the article with contributions of all the authors.
The author responsible for distribution of materials integral to the findings presented in this article in accordance with the policy described in the Instructions for Authors (https://dbpia.nl.go.kr/plphys/pages/general-instructions) is: Marina Gavilanes-Ruiz ([email protected])
References
R Core Team (
Author notes
Senior author.
