


Abstract
Transposable elements (TEs) pervade most eukaryotic genomes. The repetitive nature of TEs complicates the analysis of their expression. Evaluation of the expression of both TE families (using unique and multi-mapping reads) and specific elements (using uniquely mapping reads) in leaf tissue of three maize (Zea mays) inbred lines subjected to heat or cold stress reveals no evidence for genome-wide activation of TEs; however, some specific TE families generate transcripts only in stress conditions. There is substantial variation for which TE families exhibit stress-responsive expression in the different genotypes. In order to understand the factors that drive expression of TEs, we focused on a subset of families in which we could monitor expression of individual elements. The stress-responsive activation of a TE family can often be attributed to a small number of elements in the family that contains regions lacking DNA methylation. Comparisons of the expression of TEs in different genotypes revealed both genetic and epigenetic variation. Many of the specific TEs that are activated in stress in one inbred are not present in the other inbred, explaining the lack of activation. Among the elements that are shared in both genomes but only expressed in one genotype, we found that many exhibit differences in DNA methylation such that the genotype without expression is fully methylated. This study provides insights into the regulation of expression of TEs in normal and stress conditions and highlights the role of chromatin variation between elements in a family or between genotypes for contributing to expression variation. The highly repetitive nature of many TEs complicates the analysis of their expression. Although most TEs are not expressed, some exhibits expression in certain tissues or conditions. We monitored the expression of both TE families (using unique and multi-mapping reads) and specific elements (using uniquely mapping reads) in leaf tissue of three maize (Zea mays) inbred lines subjected to heat or cold stress. While genome-wide activation of TEs did not occur, some TE families generated transcripts only in stress conditions with variation by genotype. To better understand the factors that drive expression of TEs, we focused on a subset of families in which we could monitor expression of individual elements. In most cases, stress-responsive activation of a TE family was attributed to a small number of elements in the family. The elements that contained small regions lacking DNA methylation regions showed enriched expression while fully methylated elements were rarely expressed in control or stress conditions. The cause of varied expression in the different genotypes was due to both genetic and epigenetic variation. Many specific TEs activated by stress in one inbred were not present in the other inbred. Among the elements shared in both genomes, full methylation inhibited expression in one of the genotypes. This study provides insights into the regulation of TE expression in normal and stress conditions and highlights the role of chromatin variation between elements in a family or between genotypes for contributing to expression.
Introduction
Transposable elements (TEs) are the predominant portion of many plant genomes. These mobile elements can accumulate to quite high copy through a variety of mechanisms depending on the specific class or type of TE (Wicker et al., 2007). Class I TEs utilize RNA intermediates for transposition, while class II elements utilize DNA intermediates. A structural annotation of TEs in the maize genome reveals more than 150,000 classes I and II elements but the class I elements tend to be much longer and account for a substantially larger portion of the genome (Jiao et al., 2017; Stitzer et al., 2019). The majority of these TEs are transcriptionally silent and are found in chromatin containing high levels of DNA methylation and histone modifications associated with heterochromatin (Rabinowicz et al., 1999). However, a subset of the TEs are transcriptionally active with tissue-specific expression (Anderson et al., 2019b; Lanciano and Cristofari, 2020).
Transcripts arising from TEs can have diverse functional consequences (Lanciano and Cristofari, 2020). In some cases, the transcripts can encode the RNA and proteins that are necessary for TE mobilization and lead to transposition. However, in many other cases the transcripts may produce partial length transcripts that do not encode the proteins necessary for transpositional activity. These partial transcripts arising from TEs could reflect cryptic promoters within the TE that respond to enhancers or other regulatory elements within or near the TE. The transcripts arising from TEs can result in small RNAs that may trigger silencing of other TEs from the same family or genes with related sequences (Muyle et al., 2020). Some TE transcripts can provide outward reading promoters that result in novel expression patterns or isoforms for nearby protein coding genes. The diverse potential influences of TEs on the expression or regulation of genes may be co-opted to provide novel regulatory responses.
Prior research has found that some plant TEs can be transcriptionally activated by environmental stress (Wessler, 1996; Negi et al., 2016; Galindo-González et al., 2017; Lanciano and Mirouze, 2018; Benoit et al., 2019). These include examples of TEs activated during tissue culture (Peschke et al., 1987; Hirochika, 1993), heat stress (Ito et al., 2011; Cavrak et al., 2014), cold stress (Jiang et al., 2004), or biotic stresses (Grandbastien et al., 2005). While many of these examples were identified through detection of novel TE insertions or targeted assays for activity, the advent of transcriptome profiling has provided opportunities to survey all TEs (Lanciano and Cristofari, 2020). However, the highly repetitive nature of most TEs leads to complications in monitoring expression of these elements. Monitoring the expression of a family can allow for multi-mapping reads but does not identify the specific elements that contribute transcripts (Anderson et al., 2019b).
Prior research has identified highly dynamic expression of maize TEs in different tissues or development stages (Vicient, 2010; Anderson et al., 2019b) and has suggested that some maize TE families may be associated with triggering stress-responsive expression for nearby genes (Makarevitch et al., 2015). In this study, we apply approaches for monitoring both per-family and per-element expression of TEs to document the transcriptional response of maize TEs to heat or cold stress in seedling leaf tissue. We find that many TEs exhibit expression changes in response to heat or cold and that these responses are highly variable among genotypes. This variation among genotypes includes examples of varying genomic content of specific elements as well as examples of elements that are present in multiple genomes with distinct transcriptional responses.
Results
Many TEs are activated by abiotic stress in maize
Assessing the expression of TEs is complicated by the highly repetitive nature of the individual TEs within a family. In order to broadly survey the expression of TEs, we initially focused on monitoring the per-family expression of TEs. We implemented an approach that counts all unique and multi-mapping reads that map to members of a TE family (Anderson et al., 2019b). This per-family expression estimate enables analysis of all TE families even if they are highly repetitive. This approach also provides the opportunity to quantify the total amount of TE transcripts in RNA sequencing (RNAseq) datasets. It is worth noting that the presence of transcripts associated with TEs does not necessarily reflect expression of functional products or potential transposition activity.
The per-family expression of TEs was assessed in a dataset that includes at least four biological replicates of seedling leaf material from plants subjected to control, heat, or stress conditions and includes three genotypes (B73, Mo17, and W22) with de novo genome assemblies and consistent TE annotations (Stitzer et al. 2019; Jiao et al., 2017; Springer et al., 2018; Sun et al., 2018; Anderson et al., 2019a). We identified genes and TE families that exhibit significant expression changes in the abiotic stress relative to control conditions for all three genotypes (Figure 1A). A gene ontology (GO) enrichment analysis of upregulated genes reveals enrichment for terms associating with abiotic stress responses (GO:0009409 “response to cold” in cold stress; GO:0009408 “response to heat” in heat stress), suggesting effective cold/heat responses have been triggered in these plants (Supplemental Table S1). In general, the proportion of TE families that exhibit up- or downregulation in cold stress is similar to the proportion of genes with differential expression (Figure 1A). In heat stress, there are more examples of upregulation than downregulation of TEs (Figure 1A). A PCA analysis performed for each genotype revealed that using genes or TE per-family expression levels clustered the samples based on treatment (Supplemental Figure S1). The heat stress resulted in a greater difference relative to the control than the cold stress for all genotypes, and there was not a major difference in the differentiation between conditions when using genes compared to TE expression (Supplemental Figure S1). The upregulated TE families include examples from each superfamily of TEs (Supplemental Table S2) and we do not see substantial enrichments for specific types of TEs (Supplemental Figure S2A). A comparison of TE families that show expression in at least one condition relative to all TE families reveals that expressed TE families are enriched for families with higher copy number (Supplemental Figure S2A). However, the upregulated TE families do not show strong enrichments for large or small TE families compared to other expressed TEs (Supplemental Figure S2A). A comparison of the types of TE classes or superfamilies present in the genome, expressed or differentially regulated, reveals that the TEs that are expressed of responsive to heat/cold include elements from all types of TEs without striking differences between the differentially expressed (DE) TEs and other expressed TEs (Supplemental Figure S2B). A previous study used similar methods to document expression of 4,187 TE families in at least one of more than 70 maize tissues (Anderson et al., 2019b). If we consider these as the expressible set of TEs, we still only find fewer than 25% of these families with expression following stress treatment (Figure 1A). Overall, there are a substantial number of TE families that respond to abiotic stress, but the majority of TE families do not exhibit changes in expression level in these stress conditions suggesting a specific, rather than global, response of TE families to abiotic stress.
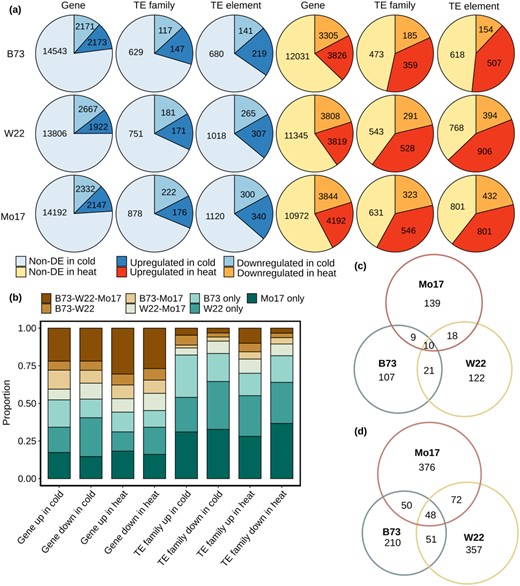
Expression changes for genes and transposable elements (TEs) under cold and heat stress conditions. A, The number of non-DE (but expressed), upregulated, and downregulated genes, TE families and TEs is shown for cold and heat conditions relative to control. B, The consistency of up- or downregulation was investigated for the nonredundant set of genes or TE families that are up- or downregulated in at least one genotype. This analysis only included the set of genes and TE families that are present in all three genomes. The proportion of genes or TE families that are upregulated in any combination of the three genotypes is shown. The overlap between shared TE families that are upregulated among three genotypes in (C) cold condition or in (D) heat condition is shown.
Genotypic variation for TE responses to abiotic stress
We proceeded to evaluate how consistently the same TE families would respond to abiotic stress in multiple maize inbreds. Clustering of the DE genes or TE families (Supplemental Figure S3) reveals differences in the consistency of response to abiotic stress for genes and TEs. While the genes are well clustered by treatment and reveal many examples of common responses in all genotypes, there is much less evidence for consistent responses of the same TE families in all three genotypes (Supplemental Figure S3). There are many genes that are consistently up- or downregulated in multiple genotypes, but the majority of TE families only show altered expression in one of the three genotypes (Figure 1B). A comparison of TE families present in all three genotypes reveals that only a subset of families was consistently upregulated in all three genotypes (Figure 1C and 1D). There are 10 TE families with a consistent response to cold stress and 48 families with consistent response to heat stress. Within each genotype, there are some TE families that are upregulated in both cold- and heat stress (Supplemental Figure S4). There are three TE families (RLG08887, RLX10775, and RLX13504) that are upregulated in all genotypes in both cold and heat stress conditions. These TE families may have a more global stress response.
Trade-offs in per-family and per-element analyses of transposon expression
The analysis of per-family TE expression is quite useful to capture all transcripts arising from TEs, even if they are highly repetitive and map to many genomic locations. For the TE families that are upregulated in B73 in heat or cold stress conditions, we assessed the proportion of uniquely mapping reads within the family (Figure 2, A and B). This revealed variable ability to resolve expression of specific elements in these families. In some cases, there are very few or no uniquely mapping reads for the family and these families would not be detected using only uniquely mapping reads. In other cases, a high proportion of the reads providing evidence for expression of the TE family is uniquely mapping (Figure 2, A and B). Very similar results are observed for upregulated TE families in W22 or Mo17 (Supplemental Figure S5). The analysis of upregulated families in all three inbreds revealed a handful of upregulated long terminal repeat (LTR) retrotransposon families with multiple expressed TEs in all three genomes under specific stress conditions including families RLC00032, RLG00009, RLC00151, and RLC00157 (Figure 2, A and B).
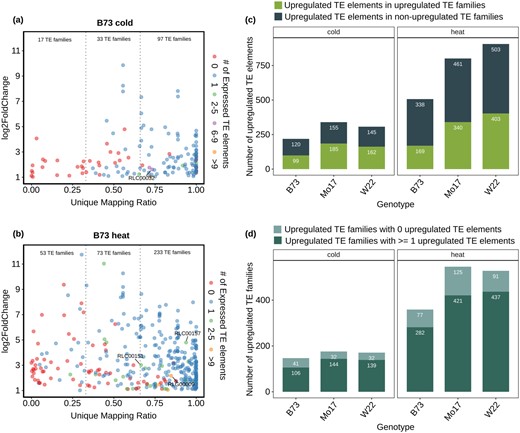
Comparison of per-family and per-element analyses of TE expression. A, For all B73 TE families that are upregulated in cold condition the proportion of unique mapping reads attributed to the family was determined. The plot compares the expression change relative to control (y-axis) and proportion of unique mapping reads in cold stress (x-axis) for each upregulated TE family in B73. The color of each data point indicates the number of elements that are detected as expressed (> 1 CPM) in cold experiment. The number of TE families with less than one-third, one-thirds to two-thirds, or greater than two-thirds unique mapping reads is shown. The upregulated TE families that are shared among three genotypes (B73, W22, and Mo17) with more than two-third unique mapping ratio and ≥3 expressed TEs were labeled. B The same information is presented for upregulated TE families under heat condition. C In each genotype, the unique mapping reads were utilized to identify upregulated TEs. These upregulated TEs were compared to the results using multi-mapping reads to monitor per-family TE expression. The plot indicates the number of upregulated TEs that in TE families that are significantly upregulated and the number of upregulated elements that are in TE families that were not identified as significantly upregulated. D, The number of significantly upregulated TE families with at least 1 or with 0 upregulated elements (based on unique mapping reads) is shown.
While there is certainly value in characterizing all of the TE families that change in expression, the use of per-family expression estimates limits our ability to investigate the factors associated with expression of specific elements. Therefore, we performed a per-element expression analysis that only utilizes unique mapping reads to monitor expression of individual TEs. This approach often results in underestimates of expression as multi-mapping reads are omitted. The analysis of per-element expression reveals similar proportions of up- and downregulated elements when compared to per-family estimates (Figure 1A) and generates similar clustering of samples (Supplemental Figure S1).
A comparison of the TE families and elements with altered expression reveals only partial overlap (Figure 2, C and D). Only ∼50% of the upregulated TEs from the per-element analysis using unique mapping reads are within TE families that are classified as upregulated (Figure 2C). This can occur for a variety of reasons. The most common reason is likely that the TE family is expressed in both control and stress conditions, but only some elements in the family are upregulated and this does not generate enough difference to be classified as significant. We also assessed the proportion of upregulated TE families that contain at least one upregulated element (Figure 2D). While the majority of upregulated TE families contain an upregulated element there are 20%–35% of the families that do not have any upregulated elements. This is likely because some of these families are highly repetitive and we were not able to quantify individual elements within a family. This highlights the variability in the potential to capture expression of TEs using unique mapping reads compared to per-family estimates that use both unique and multi-mapping reads. For the rest of the analyses in this study, we largely focus on per-element expression estimates since this allows us to monitor factors associated with a specific genomic locus.
Partial transcripts of TEs often arise near unmethylated TE regions
Our analyses that assess transcript levels for TE families or elements are based on counting reads that align to transposons. The presence of transcripts derived from TEs does not necessarily imply production of functional transcripts containing a full open reading frame (ORF) that could provide transpositional activity. Visual inspection of the transcripts reveals that in many cases the transcripts are only observed for a part of the TE (Figure 3, A–C). This suggests that many of the transcripts that occur following a stress treatment (or in control conditions) represent activity from internal cryptic promoters that may not result in any actual transposition events.
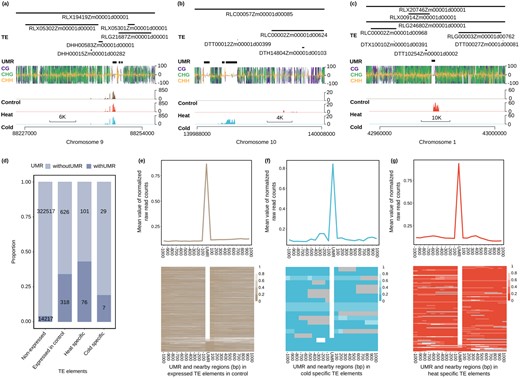
Localized expression within TEs often occurs near UMRs in B73. A–C, Examples of localized expression of a region within a TE are shown for three genomic regions. In (A) is an example of expression that occurs within/near a UMR in control and stress conditions. The examples in (B) and (C) show examples of cold-specific and heat-specific expression of TEs. In each plot, the RNAseq values are the average of all three biological replicates, and the DNA methylation data are based on WGBS of the control sample and are visualized using the R package trackViewer (Ou and Zhu, 2019). D, The proportion of TEs with and without UMRs in nonexpressed, expressed in control, heat-specific, and cold-specific categories (see “Materials and Methods” for heat- and cold-specific TEs). Number in each class was indicated in the bar plot. E and F, The relative level of expression throughout TEs was examined relative to the UMRs for expressed in control (E), cold-specific (F), or heat-specific (G) elements that contain a UMR. The expression value for each UMR and its 20 surrounding extended 100 bins were normalized from 0 to 1. The mean value of each region was drawn on the upper panel and normalized values for every UMR and its extended bins were drawn as the heatmap below. Any extended bins overlapped with another UMR will be labeled as gray in the heatmap.
We assessed whether there were factors that are associated with the expression of portions of specific TEs. While TEs are generally highly methylated, there are some unmethylated regions (UMRs) that occur within TEs (Crisp et al., 2020; Noshay et al., 2020). Methylome data were available for B73 control, cold and heat stress and was used to call UMRs (Supplemental Figure S6). In general, the overlap between control and heat or cold samples was very similar to the overlap between two replicates of control samples, suggesting very limited changes in methylation following heat or cold stress treatments (Supplemental Figure S6a). The majority of the UMRs found in one sample but not in another are instances in which there are DNA methylation data in one sample but missing coverage in the other rather than actual changes in DNA methylation levels. There are only 154 UMRs identified in the cold-stressed samples that are methylated in the control sample and 205 UMRs in the heat-stressed samples that are methylated in the control sample and the majority of these are examples of CG-only methylation in the control. None of these stress-specific UMRs are found within upregulated TEs and only one of these stress-specific UMRs are present in a downregulated TE indicated that changes in methylation are rarely associated with these changes in expression (Supplemental Figure S6b). In each of the three genomes there are ∼6% of annotated TEs that contain at least one UMR. The TEs that contain a UMR are much more likely to be detected as expressed compared to elements without a UMR (Figure 3D). The TEs that are only expressed in heat-stressed or cold-stressed conditions are also enriched for UMRs, even when looking at DNA methylation for the control sample (Figure 3D). This suggests that these TEs may often contain cryptic promoters or regulatory elements that only have the potential for activity when they are unmethylated. The lack of methylation does not lead to constitutive expression but instead results in competence for expression in specific conditions. Similar trends are observed in Mo17 and W22 as well (Supplemental Figure S7). The analysis of transcript abundance over the UMR region itself and flanking regions for expressed TEs that contain a UMR reveals that the majority of transcripts occur within the unmethylated portion of the TE (Figure 3, E–G; Supplemental Figure S7). These analyses highlight the potential for chromatin state to influence the potential expression of TEs and suggest that failure to maintain high methylation state of TEs can result in localized transcriptional activity within specific elements.
While the majority of the transcripts that arise from TEs are relatively short and likely do not encode the functional products necessary to enable transposition, there are some examples in which longer transcripts are produced. To detect potential functional transcripts in the expressed or upregulated TEs, we performed de novo transcriptome assemblies for all nongenic RNAseq reads for each condition. The assembled contigs were mapped to the genome to identify transcripts that overlap TEs. The subset of TE transcripts that encode an ORF more than 100 aa that contain homology to a transposon-related domain (transposase, polyprotein, etc.) were identified (Supplemental Table S3). There are slightly over 100 transcripts that meet these requirements in the cold and heat stress samples although in many cases these include multiple transcripts from the same element so there are only approximately 50 expressed TEs that produce a potential transposon related ORF more than 100aa (Supplemental Table S3). The vast majority (94%) of these transcripts have a putative ORF that is less than 300 aa and likely do not encode a full-length functional product. If we search for examples in which the assembled contig covers at least 80% of the TE element, we identify four TEs (RLX04077Zm00001d00002, DTT00026Zm00001d00096, RIT00002Zm00001d00088, and DHH00682Zm00001d00001) in cold stress and three TEs (RLG02103Zm00001d00002, DTT00026Zm00001d00096 and DHH00682Zm00001d00001) in heat stress that can potentially produce transcripts as whole elements. Further studies would be necessary to evaluate the potential that these families may have active transposition.
Consistent and variable responses to abiotic stress among members of a TE family
Transcriptional activation of a TE family in response to abiotic stress could reflect consistent upregulation of all members of a family or specific changes to some members of the TE family. We focused on the subset of TE families that have greater than two-thirds unique mapping reads TEs and assessed the per-element expression levels in these families to monitor whether response to stress is family-wide or element-specific. In some TE families (such as DTH00434 and RLC00157), the increase in expression was driven by high levels of expression of a single element (Supplemental Figure S8). In other TE families (such as RLC00151, RLG00292 and DTH11270), the increase in expression was attributed to multiple members of the family (Supplemental Figure S8).
Examples of consistent upregulation for multiple members of the same TE family may reflect the presence of cis-regulatory elements within the TE that provide responsiveness to the stress condition. We identified TE families with consistent response in all genotypes that include multiple members of the family with transcriptional response. We required that the TE family was upregulated in all three genotypes, that greater than two-thirds of the reads uniquely map to a single element and that at least two elements of the TE family have increased expression. This resulted in the identification of one TE family for cold stress (RLG00032) and three families for heat stress (RLC00151, RLC00157, and RLG0009). These families with consistent responses of multiple elements may reflect conserved cis-regulatory elements within the TE that promote stress-responsive expression for these families.
We sought to examine some of the potential explanations for why some members of a TE family would respond to an abiotic stress while others did not. One potential explanation could be sequence divergence among family members. We selected two LTRs TE families that had at least 10 elements with several that were upregulated under heat stress in B73 and generated sequence phylogenies based on the 5′-LTR sequence (Supplemental Figure S9A and B). The elements that are upregulated do not necessarily represent a specific subset of related sequences. This suggests that factors beyond sequence identity influence the responsiveness of individual elements. The LTR elements with expression were used to test whether the potential for expression might be related to the age of the element (Supplemental Figure S9C). The sequence divergence between the two LTRs can be used to estimate the age of an insertion with higher divergence indicating older insertions. The analysis of all LTR elements or just the elements in three families with the highest number of expressed elements reveal that expressed TEs are on average slightly older (Supplemental Figure S9C). This could reflect that older elements are more likely to be expressed or could reflect the fact that it is often easier to detect expression for older elements due to sequence divergence that allows unique mapping to these elements.
An alternative possibility is that the potential for transcriptional activation is a chromatin property rather than a sequence (genetic) property. We assessed chromatin variation in specific elements for the set of upregulated TE families in B73 for which at least two-thirds of the reads uniquely map to a single element and ≥2 expressed TEs. Our hypothesis was that the members of the family that respond would be enriched for UMRs, while the silent members of the family would lack UMRs. Examination of specific families provides evidence to support this hypothesis. For example, there are 11 members of the RLG00008 family that are expressed/upregulated under heat stress and each of these contain UMRs, but the vast majority (99.6%) of the members of this family that is silent lack a UMR (Figure 4A). We also see support for this hypothesis when looking at all elements in these families (Figure 4, B and C). Within these families, we find strong enrichments for UMRs within elements that are expressed in control or stress conditions compared to silent TEs for families that are expressed or upregulated in both conditions and in all three genotypes (Figure 4B and 4C). This suggests the potential for a specific TE family member to become transcriptionally active is dependent upon chromatin states. Furthermore, the chromatin state in control samples is important for potential transcriptional response to the stress condition.
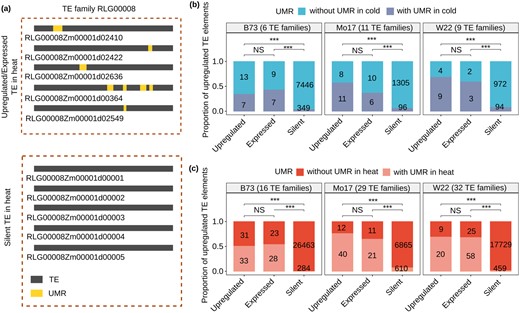
Methylation contributes to expression potential among members of TE families. A, An example of a TE family with variable expression responses and UMRs in some elements. There are 3,028 elements in family RLG0008 and 11 of these are expressed. Five of these 11 expressed elements contain UMR, and the locations of these UMRs are shown in yellow shading. The other 3,017 member of this family are silent and the vast majority (99.2%) do not have UMR. We show the five of these elements to indicate that they largely lack UMRs if they are not expressed. B, We focused on a set of families (number of families indicated by genotype label) that exhibit upregulation in cold stress that also have at least two-thirds of the expression derived from unique-mapping reads. The elements in these families were split into three groups; Expressed (>1 CPM but not significantly upregulated), Upregulated (log2foldchange >1 and adjust P ≤0.05 for per-element expression), and Silent. For each of these three groups, we assessed the number of elements within and without UMRs in cold stress. Fisher’s exact test was performed to compare the frequency of UMRs in TEs that are expressed, upregulated, or silent (***P <0.001; NS: not significant). In (C) the same analysis was performed for the set of TE families with more than two-thirds unique mapping reads that are upregulated in heat stress.
Documenting the basis for variable responses among genotypes
The observation that different genotypes exhibit quite distinct sets of TE families or TEs with response to abiotic stress could reflect differences in the specific TEs present in each genotype or regulatory differences at shared elements. In order to address this in more detail, we focused on the set of TEs that are upregulated based on per-element TE expression analyses. We relied upon a prior set of TE polymorphism calls made using synteny blocks for these genomes (Anderson et al., 2019a) and performed pairwise contrasts for the TEs that are upregulated in each genome. Among the upregulated B73 TEs with resolved presence/absence calls in the compared genome, the largest set of them are absent in the other genome (Figure 5A). Of the TEs that are present in both genomes a subset shows similar upregulation in both genomes (purple in Figure 5A), but many of them are not changed (green in Figure 5A) or not expressed in the other genome (orange in Figure 5A). Generally, similar proportions are seen in each of the comparisons of genomes (Figure 5, B and 5C; Supplemental Figure S10). This suggests that the differences in TE responses are driven both by polymorphic TE content and by regulatory variation of shared TEs.
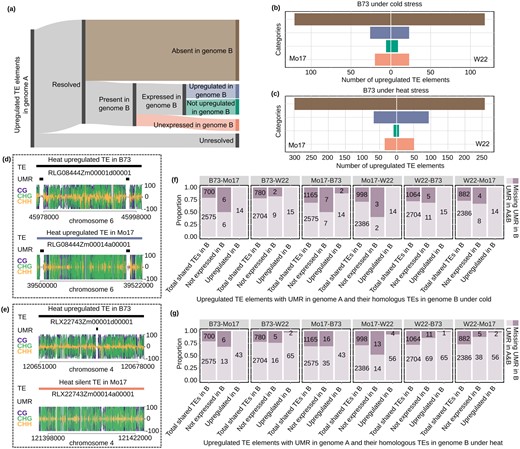
Assessing the factors that contribute to variable responses between genotypes. A, A schematic diagram showing how upregulated TEs in genome A are classified into different categories in a comparison with genome B. The presence/absence (or unresolved) nature of TEs in one genome relative to another was determined based on Anderson et al. 2019 and TEs that are classified as absent in genome B are shown in brown. For the subset of TEs present in both genomes, the expression in genome B is classified as silent (orange), significantly upregulated (blue), expressed but not significantly upregulated (green). B, The number of TEs in categories defined in (A) under cold condition when B73 served as genome A and compared to W22 or Mo17 as genome B using the same color scheme as described for (A). In (C) a similar plot is shown for comparisons of B73 heat upregulated elements with Mo17 or W22 using the same color scheme as described for (A). D, An example of a shared TE (homologous insertion present in both genomes) with a similar response in heat stress is shown. This shared insertion is found in both B73 and Mo17 and contains UMRs in both genotypes. E, An example of a shared TE with response in B73 but no expression in Mo17 is shown. There is an UMR for this TE in B73 but not in Mo17. F and G, The upregulated TEs in genome A with UMR were used to assess whether loss of UMRs might contribute to loss of stress-responsive expression. Total shared TEs indicate all shared TEs between the two genomes regardless of whether they are upregulated in response to heat or cold. For each contrast of two genomes, we investigated the proportion of elements with or without UMRs in genotype B for shared elements that are upregulated in both genomes compared to elements that are upregulated in one genome but not expressed in the other.
We further examined the potential causes for conserved and variable responses of shared TEs to heat or cold stress. We hypothesized that chromatin variation may explain at least some of the differences in TE expression responsiveness to the stress condition. As several examples of conserved or variable responses were investigated, we found that the shared TEs that responded in both inbred lines often had UMRs in both genotypes (example in Figure 5D). However, in examples in which a shared TE responded to stress in one genotype but not the other there was often variation for the presence of a UMR with only the genotype with expression containing the UMR (example in Figure 5E). A genome-wide analysis of shared TEs found evidence for frequent UMR polymorphisms in shared TEs that have variable response to stress in the two genotypes. In each genotype (genotype A), we identified the subset of TEs that are (1) upregulated in response to heat or cold, (2) contain a UMR, and (3) have a shared insertion in the genotype being compared (genotype B). We then classified whether the TE was also upregulated in genotype B or was silent in genotype B. We then evaluated the proportion of these cases in which the UMR was present in genotype B compared to cases in which the TE is fully methylated in genotype B. This was compared to the set of all TEs that are shared between the two genotypes regardless of whether they exhibit a response to heat or stress. In all pairwise contrasts we found that when the TE was upregulated in response to heat or cold stress, the UMR was enriched (>90% of examples in each case) for being found in both genotypes compared to the frequency of variable UMRs in all shared TEs (Figure 5, F and G). In contrast, for examples in which the TE was not expressed in genotype B, there was a much higher rate of UMR loss (Figure 5, F and G). This suggests that one reason for the polymorphic responsiveness of shared TEs in the different genotypes is due to differences in chromatin that influence the potential for transcriptional activation.
Discussion
TEs are ubiquitous components of many eukaryotic genomes, but we are still developing an understanding of how they contribute to the transcriptome. In this study, we have focused on a replicated analysis of the transcriptome of three maize inbreds in three environmental conditions. Our observations highlight the potential roles of both genetic and epigenetic variation in contributing to expression variation of different transposable elements.
Trade-offs in per-family and per-element analyses of TE expression
The highly repetitive nature of many TE families results in complications for the analysis of TE expression as well as the analysis of chromatin state. In addition, the lack of precise annotation of TE transcripts can also complicate the analysis of TE expression. In this study, we have employed two complementary approaches to monitor TE expression. One approach uses both unique and multi-mapping reads to monitor the expression of TE families. This casts a broad net that can identify the majority of transcripts arising from TEs, even in highly repetitive families. However, this type of analysis does not identify the specific elements, or genomic locations, that contribute to expression. This limits our ability to assess whether many members of the same family exhibit a coordinate response and also limits our ability to assess chromatin state at expressed elements. It is worth noting that the issue of multi-mapping also complicates comparisons of chromatin state. Many TEs cannot be assessed for methylation or the presence of UMRs as they are too repetitive. This complicates some of our analyses of the presence of UMRs in different categories of TEs as the lack of a UMR may reflect the true absence of a UMR or it could miss data due to lack of unique alignments.
Genomic variation contributes to polymorphic responses
A comparison of genic and TE transcriptome responses to heat/cold stress revealed that there is more variability among genotypes for TE responses than for gene expression responses. A detailed examination of the TEs that respond to heat or cold stress in one genotype revealed that many of these specific TEs are not present in the same genomic location in the other lines. In each contrast, over half of the TEs that are upregulated in one genome lack a syntenic insertion in other genomes. This suggests that much of the variable transcriptional response in a comparison of genomes actually is a result of genome content differences. This observation highlights a challenge of comparing transcriptional responses of TEs. These studies are highly reliant upon the genome being used for alignment. Many studies that compare transcriptional responses rely upon alignments to a common reference genome. However, the highly variable nature of TE insertions among maize lines will result in difficulties in comparing the expression responses.
Chromatin state influences TE expression potential
While variation in genome content explains some of the variation for TE expression responses there are also many shared insertions in two genomes that exhibit distinct expression responses. While there certainly can be examples of trans-regulatory differences that could affect abiotic stress response, there are more examples of cis-regulatory variation than trans-regulatory variation (Waters et al., 2017). However, shared TE insertions in two genomes are expected to have largely similar sequences. We hypothesized that differences in chromatin state may explain some of the variation in transcriptome responses among genotypes. We found that TEs that are expressed are highly enriched for detectable UMRs in maize. Deoxyribonucleic acid methylation remains virtually identical in the control and stress conditions with very few novel UMRs in cold or heat stressed samples. However, many of the TEs that exhibit expression only in heat or cold stress contain UMRs in control conditions. This suggests that the lack of DNA methylation allows for potential regulatory elements to respond to the presence of trans-acting factors that induce heat- or cold-responsive expression.
A comparison of TEs that show variable response in two genomes finds many examples in which there is evidence for changes in chromatin state. Often, the failure to respond to an environmental stress in a second genotype is accompanied by the loss of the UMR. This region exhibits variable methylation between genotypes and the highly methylated genotype losses the potential for expression.
The role of chromatin state could also play an important role in explaining the variability of responses of different TEs within a family. With a TE family, many of the elements can have highly similar sequences. While there are a small set of families that show coordinate expression changes of many elements in the same family, the majority of TEs that are activated by heat or cold stress reflect a small number of elements within the family. When we assessed the presence of UMRs in these elements, we found that the elements that are expressed or upregulated in stress conditions are much more likely to contain UMRs. This suggests that the presence of a UMR is likely important for providing expression potential for TEs. However, it is also worth noting that the presence of UMRs does not necessarily cause expression. Active transcription from promoters in TEs likely requires both permissive chromatin and appropriate TF binding nearby.
Materials and methods
Plant materials and conditions
Seeds from three maize (Zea mays) genotypes, B73, Mo17, and W22, were imbibed overnight and then planted in soil. Seedlings were grown in the growth chamber at University of Minnesota for 13 d, with water added every 2 d. Plants were grown under 16 h of light with a temperature of 30°C in the day and 20°C at night. On day 13 when the lights turned on, heat and cold stressed plants were moved to incubators while control plants remained in consistent conditions. The cold stress incubator was set to 6°C and the heat stress incubator was set to 42°C. All plants were removed after 4 h, and half of the third leaf was cut longitudinally from four plants and was pooled for each replicate. Every genotype under each treatment contains five biological replicates, except that B73 under control condition contains four biological replicates. All biological replicates were used for RNAseq, and a subset of these tissue samples was utilized to perform whole-genome bisulfite sequencing.
RNAseq data processing
RNAseq reads were generated using NovaSeq 6000 in paired-end 150-bp mode and deposited in the NCBI SRA database under the accession ID PRJNA657262. Raw reads per sample were trimmed and preprocessed using Trim_Galore in default settings (version 0.6.4; http://www.bioinformatics.babraham.ac.uk/projects/trim_galore/). Preprocessed reads per sample in each genotype (B73, W22, and Mo17) were aligned to their own indexed reference genome (B73 AGPv4, W22, and Mo17) using hisat2 (version 2.1.0; Kim et al., 2015) with up to 20 multi-mapping positions (version 2.1.0; -k 20 –no-mixed –no-discordant), respectively. Alignment files were converted to bam format using Samtools (version 1.9; Li et al., 2009).
Gene and TE expression calling
Both genes and TEs on chromosomes were retained for further analysis. Filtered TE annotations of B73 AGPv4, W22, and Mo17 in disjoined modes (https://github.com/SNAnderson/maizeTE_variation) were used for calculating TE expression. Gene annotation of B73 in version 4.41 was downloaded from Ensemble, and W22 and Mo17 were downloaded from the MaizeGDB database. Gene exon regions were subtracted from TE annotation due to ambiguous mapping reads in overlapped regions between genes and TEs. Gene body regions per genotype in gene annotation files were appended to subtracted TE annotation files, respectively. Same annotation files were used to check intersected regions with UMRs per genotype. Raw unique read counts per gene and TE element were calculated using HTSeq (Anders et al., 2015; version 0.11.2; -s no -m union -a 0). Because TEs were clustered into family levels based on their sequence similarity within each family, multi-mapping reads assigned to each TE family were also considered. Specifically, if a multi-mapping read assigned to TEs within the same TE family, then this multi-mapping read was counted to this TE family. As a result, the expression of a TE family was the sum of multi-mapping reads and unique mapping reads of its individual TEs (Anderson et al., 2019b). In summary, three count files—genes, TEs and TE families—were used in the analysis. Counts per million mapping (CPM) reads per gene/TE element/TE family were calculated in each sample separately. For each genotype, features (genes, TEs and TE families) were considered as expressed in each abiotic stress experiment when mean CPM >1 in either “control+cold” or “control+heat”. DE features were calculated using the DESeq function in R package DESeq2 for cold or heat conditions. Upregulated features were defined as log2FoldChange >1 with adjusted P ≤0.05. Downregulated features were defined as log2FoldChange <−1 with adjusted P ≤0.05. Non-upregulated features were defined as expressed features (mean CPM >1) that were not upregulated.
Expressed TEs in control were considered as mean CPM values in control samples >1. Cold-specific TEs were determined as mean CPM value of replicates in cold condition >1 and mean CPM value of replicates in both control and heat condition ≤0.1. The same parameter was applied on defining heat-specific TEs.
Sample clustering
Using inverse hyperbolic sine (asinh) transformed CPM values of expressed genes/TE families/TEs, the principal component analysis was performed using the prcomp function in R. The first two principal components were used to separate analyzed samples.
GO enrichment for upregulated genes
Aggregate GO terms without duplication and redundancy were downloaded from the maize GAMER project (Wimalanathan et al., 2018; https://dill-picl.org/projects/gomap/gomap-datasets/) for B73 AGPv4, W22, and Mo17 gene models. Gene ontology enrichment analysis was performed using Goatools (Klopfenstein et al., 2018) for upregulated genes per genotype under cold/heat stress condition and P-value per GO term was corrected using Bonferroni multiple testing correction methods. Gene ontology terms with corrected P <0.05 were reported.
Unique mapping ratio per TE family
For either cold or heat experiment, the unique mapping ratio per TE family was calculated using the mean value of raw multiple read counts per sample divided by the mean value of raw unique read counts per TE family in the identical sample per experiment.
Gene and TE correspondence across genotypes
Homologous genes across B73, W22, and Mo17 were identified using three complementary approaches (SynMap [Lyons et al., 2008]+MUMmer [Kurtz et al., 2004]+OrthoFinder [Emms and Kelly, 2015]) in an iterative manner (Anderson et al., 2019a). As duplicated genes in one genome could be assigned to one gene in another genome in this list, only the one of duplicated genes with the highest LASTZ (http://www.bx.psu.edu/miller_lab/dist/README.lastz-1.02.00/README.lastz-1.02.00a.html) alignment score compared to the gene in another genome was retained to produce a 1:1 syntenic gene list between two of three maize genomes. A set of nonredundant TEs was used to identify correspondence of individual TEs in B73, W22, and Mo17 (Anderson et al., 2019a). Based on the TE naming nomenclature in these three maize genomes, the full TE name indicates a specific TE (i.e. RLG00027Zm00001d00003) with the first eight letters as a shared TE family among maize genomes and the first three letters as a TE superfamily.
Phylogenetic tree construction of TEs within a TE family
For a selected LTR retrotransposon family, the 5'-LTR sequence was used to represent each individual TE. The multiple alignment file was produced using Mafft (version 7.464) L-INS-i algorithm (Katoh and Standley, 2013). FastTree (version 2.1.10; Price et al., 2010) was used to generate the maximum likelihood phylogenetic tree. The tree structure per selected TE family was visualized using the R package ggtree (Yu et al., 2017).
Identification of UMRs
In this study, we utilized whole-genome bisulfite sequencing (WGBS) of a subset of the same seedling leaf samples described above. WGBS was performed on two biological replicates from the control condition were used for the three inbreds (B73, Mo17, and W22) and a single replicate of the B73 cold- and B73 heat-stress samples. DNA extractions were performed using the DNeasy Plant Mini kit (Qiagen). Further, 1 µg of DNA in 50 µL of water was sheared using an Ultrasonicator (Covaris) to approximately 200–350 bp fragments. Then, 20 µL of sheared DNA was bisulfite converted using the EZ DNA Methylation-Lightning Kit (Zymo Research) as per the manufacturer’s instructions and eluted in a final volume of 15 µL. Then 7.5 µL of the fragmented, bisulfite-converted sample was used as input for library preparation using the ACCEL-NGS Methyl-Seq DNA Library Kit (SWIFT Biosciences). Bisulfite libraries were sequenced on a HiSeq 2500 in paired-end mode at the University of Minnesota Genomics Center. Output has been deposited in the NCBI SRA database under accession number PRJNA657677.
Trim_galore (Krueger, 2012) was used to trim adapter sequences and additional sequence noise, read quality was assessed with the default parameters and paired-end read mode. Reads that passed quality control were aligned to the corresponding genome assembly. Alignments were conducted using BSMAP-2.90 (Xi and Li, 2009) allowing up to five mismatches and a quality threshold of 20 (-v 5 -q 20). Duplicated reads were detected and removed using picard-tools-1.102 (http://broadinstitute.github.io/picard/) and SAMtools (Li et al., 2009).The resulting alignment file, merged for all samples with the same tissue, condition and genotype, was then used to determine methylation level for each cytosine using BSMAP tools. The methylratio.py script from bsmap v2.74 was used to extract per site methylation data summaries for each context (CH/CHG/CHH) and reads were summarized into nonoverlapping 100-bp windows tiling the genome. Unmethylated regions were determined following methods described in Crisp et al. (2020). Unmethylated tiles (UMTs) were those which contained CG, CHG, and CHH levels <10%. Adjacent UMTs were merged and those larger than 300 bp were kept and defined as UMRs.
Overlap between unmethylated and partial expressed regions in TEs
For each genotype, UMR regions were subtracted from three types of TEs, including: (1) expressed TEs (TEs expressed in either cold or heat experiment); (2) cold-specific TEs; (3) heat-specific TEs. For each selected UMR region, 10 100-bp bins were extended from upstream and downstream, and then counted the number of unique mapping reads per bin using bedtools intersect. The number of reads per bin that overlapped with another UMR will be labeled as missing. In total, each UMR would produce 21 bin regions, including 10 100-bp upstream bins, 1 UMR region, and 10 100-bp downstream bins. For each type of TE, read counts per 21 bins were normalized from 0 to 1 to generate heatmaps and mean normalized value per bin across all UMR regions with extended regions was calculated to visualize the line plot.
Transcriptome de novo assemblies and protein domain identifications
Replicates of raw RNAseq samples from B73 cold and heat conditions were merged and aligned to indexed B73 AGPv4 gene sequences using hisat2 (version 2.1.0; Kim et al., 2015) to identify all reads that map to annotated genes. Unmapped reads were then extracted and used as inputs for transcriptome assemblies using Trinity (version 2.2.1; Grabherr et al., 2011). Assembled contigs were then aligned to B73 AGPv4 reference genome using gmap (version 2020-10-14; Wu and Watanabe, 2015) to identify their physical coordinates and identify transcripts from TEs. Transdecoder (version 5.5.0; https://github.com/TransDecoder/TransDecoder) was used to detect potential ORFs in assembled contigs. To identify protein domains, the predicted protein sequences from the assembled contigs were used to search against Swiss-Prot database (version 2020-06) download from Uniprot (https://www.uniprot.org/) using phmmer with thresholds of “-E 1e-4 –domE 1e-4” (version 3.3.1; Finn et al., 2011).
Accession numbers
The RNAseq dataset used for the analyses in this manuscript is available at NCBI as accession PRJNA657262.
Supplemental data
The following materials are available in the online version of this article.
Supplemental Figure S1. Principal component analysis for all replicates under control, cold and heat conditions for B73, W22 and Mo17 using expressed genes, TE families or TEs.
Supplemental Figure S2. The distribution of TE families sizes for different groups of TEs.
Supplemental Figure S3. Transcript abundance clustering of expressed genes and TE families.
Supplemental Figure S4. Overlap of upregulated TE families in heat and cold conditions for each of the three genotypes.
Supplemental Figure S5. Comparison of per-family and per-element analyses of TE expression for W22 and Mo17.
Supplemental Figure S6. Comparisons of unmethylated regions and their overlapped TEs in B73.
Supplemental Figure S7. Localized expression within TEs often occurs near UMRs in W22 and Mo17.
Supplemental Figure S8. Monitoring the contribution of individual elements to per-family increase in expression.
Supplemental Figure S9. Investigations of factors can impact TE upregulation and expression.
Supplemental Figure S10. Number of TEs in categories defined in Figure 5a.
Supplemental Table S1. GO enrichment for upregulated genes in three maize genotypes under cold and heat stress.
Supplemental Table S2. Upregulated TE families under cold and stress conditions in three maize genotypes.
Supplemental Table S3. Identified protein domains in transcript assemblies of expressed transposable elements under cold and heat stress.
Acknowledgments
We are grateful to Peter Hermanson for generating the necessary plant materials and samples for these experiments. The Minnesota Supercomputing Institute at the University of Minnesota provided computational resources that contributed to this research. Research on this project was supported by grants from the NSF Plant Genome Research Program (IOS‐1934384), USDA‐NIFA (2016‐67013‐24747), and by Hatch funding from the Minnesota Agricultural Experiment Station (MIN 71-068). P.A.C. is the recipient of an Australian Research Council Discovery Early Career Award (project number DE200101748).
Conflict of interest statement. None declared.
Z.L., S.N.A. and N.M.S. conceived the experiments. S.N.A. and T.A.E. grew plants and collected RNA samples. Z.L., J.M.N. and P.A.C. analyzed data. Z.L., S.N.A., J.M.N., P.A.C. and N.M.S. drafted the manuscript. All authors discussed the results and contributed to the final manuscript.
The authors responsible for distribution of materials integral to the findings presented in this article in accordance with the policy described in the Instruction for Authors (https://dbpia.nl.go.kr/plphys/pages/general-instructions) is: Nathan M. Springer ([email protected])
References
Author notes
Senior author.
