


Abstract
The Antarctic green alga Chlamydomonas sp. UWO 241 (UWO 241) is adapted to permanent low temperatures, hypersalinity, and extreme shade. One of the most striking phenotypes of UWO 241 is an altered PSI organization and constitutive PSI cyclic electron flow (CEF). To date, little attention has been paid to CEF during long-term stress acclimation, and the consequences of sustained CEF in UWO 241 are not known. In this study, we combined photobiology, proteomics, and metabolomics to understand the underlying role of sustained CEF in high-salinity stress acclimation. High salt-grown UWO 241 exhibited increased thylakoid proton motive flux and an increased capacity for nonphotochemical quenching. Under high salt, a significant proportion of the up-regulated enzymes were associated with the Calvin-Benson-Bassham cycle, carbon storage metabolism, and protein translation. Two key enzymes of the shikimate pathway, 3-deoxy-d-arabinoheptulosonate 7-phosphate synthase and chorismate synthase, were also up-regulated, as well as indole-3-glycerol phosphate synthase, an enzyme involved in the biosynthesis of l-Trp and indole acetic acid. In addition, several compatible solutes (glycerol, Pro, and Suc) accumulated to high levels in high salt-grown UWO 241 cultures. We suggest that UWO 241 maintains constitutively high CEF through the associated PSI-cytochrome b6f supercomplex to support robust growth and strong photosynthetic capacity under a constant growth regime of low temperatures and high salinity.
During photosynthesis, light is transduced into stored energy through two major pathways, linear electron flow (LEF) and cyclic electron flow (CEF). In addition to satisfying the ATP shortage for efficient carbon fixation (Kramer and Evans, 2011), CEF-generated ATP may be used for other energy-requiring processes, such as the CO2-concentrating mechanism of C4 photosynthesis (Takabayashi et al., 2005; Ishikawa et al., 2016), N2 fixation in cyanobacteria heterocysts (Magnuson et al., 2011; Magnuson and Cardona, 2016), and survival under environmental stress (Suorsa, 2015). In addition, CEF is utilized under short-term stress by rapidly inducing a transthylakoid pH change and triggering nonphotochemical energy dissipation (Lucker and Kramer, 2013; Yamori et al., 2016). Previously, it was assumed that CEF was dependent upon state transitions (Iwai et al., 2010); however, recent studies suggest that CEF induction is independent of state transitions and is sensitive to other signals (Takahashi et al., 2013; Strand et al., 2015).
The formation of protein supercomplexes has been associated with CEF initiation (Minagawa, 2016; Nawrocki et al., 2019). The first supercomplex was isolated by Iwai et al. (2010) in Chlamydomonas reinhardtii under dark/anaerobiosis. The supercomplex is composed of PSI, light-harvesting complex II (LHCII), cytochrome b6f (cyt b6f), PGR5-like1 protein, and ferredoxin NADP reductase (Iwai et al., 2010). Terashima et al. (2012) identified another supercomplex in C. reinhardtii that is formed under conditions of anoxia and is regulated through the calcium-sensing protein, CAS. Recently, the structure of the C. reinhardtii PSI supercomplex was solved, which showed that dissociation of specific LHCI proteins (Lhca2 and Lhca9) is necessary prior to PSI supercomplex formation (Steinbeck et al., 2018).
Around the globe, there are communities of photosynthetic organisms that have adapted to capture light energy and fix carbon under environmental conditions that are untenable for most model plant and algal species, including permanent low-temperature environments in the Arctic and Antarctic (Morgan-Kiss et al., 2006; Dolhi et al., 2013). The McMurdo Dry Valleys form the largest polar desert on the Antarctic continent and harbor numerous permanently ice-covered lakes (Priscu et al., 1999; Morgan-Kiss et al., 2006). Microalgal communities residing in the McMurdo lakes are adapted to extreme conditions, including low temperatures, nutrient deficiency, supersaturated oxygen levels, and hypersalinity (Morgan-Kiss et al., 2006).
Chlamydomonas sp. UWO 241 (UWO 241) was isolated from Lake Bonney in the 1990s (Neale and Priscu, 1990, 1995). In its native environment, UWO 241 is exposed to year-round low temperatures (0°C–5°C), hypersalinity (700 mm NaCl), and extreme shade (<20 μmol photons m−2 s−1), with available light of a narrow spectral range (350–450 nm). In early studies, it was reported that UWO 241 appeared to exhibit permanent down-regulation of PSI, estimated by a weak P700 photooxidation and an absence of a discernible PSI chlorophyll a low-temperature (77K) fluorescence emission peak under a range of treatments (Morgan-Kiss et al., 2002a, 2005; Szyszka et al., 2007; Cook et al., 2019). Morgan-Kiss et al. (2002b) reported that UWO 241 lacks phosphorylation of LHCII and state transitions. Recently, Szyszka-Mroz et al. (2019) showed that UWO 241 exhibits some LHCII phosphorylation and cold-adapted forms of the thylakoid protein kinases Stt7 and Stl1. They suggested that UWO 241 may rely on energy spillover between PSII and PSI rather than state transitions (Szyszka-Mroz et al., 2019).
UWO 241 maintains sustained CEF under steady-state growth conditions that is associated with a PSI-cyt b6f supercomplex (Szyszka-Mroz et al., 2015; Cook et al., 2019). The formation of the UWO 241 PSI-cyt b6f supercomplex is present only in cultures acclimated to high salinity (700 mm NaCl), and its stability is disrupted in the presence of the kinase inhibitor, staurosporine (Szyszka-Mroz et al., 2015). These previous studies suggest a role for sustained CEF activity in UWO 241 to survive long-term exposure to high salinity; however, the specific benefits of this are not understood. Here, we investigated whether the outcomes of CEF provide UWO 241 with constitutive photoprotection ability or energy generation (i.e. ATP synthesis). We hypothesized that CEF-associated alterations in energy production would be associated with downstream changes in carbon metabolism. Therefore, in addition to CEF measurements, we conducted comparative whole-cell proteomics and metabolomics to understand the effect of these CEF-associated changes on downstream metabolism of UWO 241. Our results indicate that CEF under long-term acclimation to high salinity is associated with the rewiring of primary carbon metabolism.
RESULTS
UWO 241 Is Adapted to Low Temperature and High Salt
UWO 241 was isolated from the deep photic zone (17-m sampling depth) of the hypersaline, perennially ice-covered Lake Bonney (McMurdo Dry Valleys, Victoria Land; Neale and Priscu, 1990, 1995). As a consequence of more than two decades of study, this photopsychrophile has emerged as a model for photosynthetic adaptation to permanent low temperatures (Morgan-Kiss et al., 2006; Dolhi et al., 2013; Cvetkovska et al., 2017). In addition to psychrophily, UWO 241 exhibits robust growth and photosynthetic performance under high salt (0.7 m NaCl; Supplemental Fig. S1; Morgan et al., 1998; Pocock et al., 2011).
UWO 241 Possesses Constitutively High Rates of CEF
PSI activity was monitored by far-red (FR) light-inducible P700 photooxidation (Fig. 1). Following a rise in A820, reflecting FR light-induced P700 oxidation, we compared rates of P700 rereduction in the dark in low-salt (LS) cultures of C. reinhardtii as well as LS- and high-salt (HS)-grown cells of UWO 241 (Fig. 1). Since FR light preferentially excites PSI and not PSII, reduction of P700 following FR light exposure is mainly due to alternative electron donors (Ivanov et al., 1998). UWO 241 grown in standard LS growth medium exhibited a significantly shorter rereduction time for P700+ (t1/2 red) compared with LS-grown C. reinhardtii (P < 0.05; Fig. 1). Moreover, HS-grown UWO 241 exhibited a 1.71-fold faster t1/2 red compared with LS-grown cultures (P < 0.05; 170 ± 55 versus 290 ± 41 ms, respectively; Fig. 1). The P700 absorbance kinetics also revealed that the oxidation of P700 in UWO 241 was less complete in HS conditions (Supplemental Fig. S2). These data indicate that relative to the model C. reinhardtii, UWO 241 exhibits a high capacity for PSI-driven CEF, which is further enhanced during acclimation to long-term high-salinity stress.
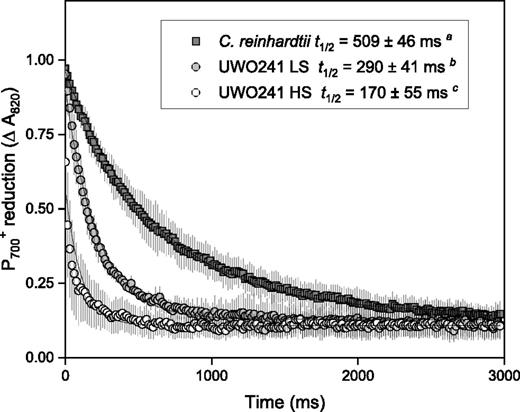
P700 rereduction kinetics of PSI in UWO 241 compared with the model mesophile C. reinhardtii. C. reinhardtii was grown in LS Bold’s Basal Medium (BBM) at 20°C/100 μmol m−2 s−1. UWO 241 was grown in either BBM (LS) or BBM + 700 mm NaCl (HS) and 8°C/50 μmol m−2 s−1. t1/2, Half-time for P700 rereduction. Data are means ± sd (n = 6–9). Values labeled with different lowercase letters indicate statistical differences (Student’s t test, unequal variance; P < 0.05).
Higher rates of CEF in UWO 241-HS were also confirmed by electrochromic shift (ECS) kinetics, which estimate transthylakoid proton flux driven by light-dependent photosynthesis (Fig. 2; Supplemental Fig. S3). The ECS signal was measured by the change in absorbance of thylakoid pigments at 520 nm during the application of light-dark interval kinetics (Baker et al., 2007). The total amplitude of ECS signal (ECSt) was used to estimate the total proton motive force (pmf) across thylakoid membranes (Kramer et al., 2003). UWO 241 grown in HS exhibited 6- to 7.5-fold higher ECSt than that of LS-grown cells under all light intensities (Fig. 2A), suggesting that HS-grown cells generate higher pmf than LS-grown cells at the same light intensity. To verify which process(es) contributed to high pmf in HS-grown cells, proton conductance (gH+) and fluxes through ATP synthase (νH+) were analyzed (Kanazawa and Kramer, 2002; Livingston et al., 2010; Carrillo et al., 2016). The inverse of the lifetime of the rapid decay of ECS (1/τECS) represents the proton permeability or conductivity (gH+) of the thylakoid membrane and is largely dependent on the activity of ATP synthase (Supplemental Fig. S3D; Baker et al., 2007). The gH+ of HS-grown cells was ∼50% to 60% compared with that of LS-grown cells (Fig. 2B); however, the νH+ showed that the amount of ATP produced was still higher in HS-grown cells (Fig. 2C). The relationship between νH+ and LEF can be used to estimate proton contribution from CEF (Baker et al., 2007). In the linear plots of νH+ versus LEF, the slope of the HS-grown cells was higher than that of LS-grown cells (Fig. 2D), indicating that CEF contributes significantly to the νH+ in HS-grown cells. Thus, in close agreement with our P700 findings, UWO 241-HS exhibited higher rates of CEF compared with UWO 241-LS (Figs. 1 and 2D). Lastly, HS-grown cells exhibited increased capacity for nonphotochemical quenching (NPQ; Supplemental Fig. S3, A and B), while PSI photochemical yield was higher in HS- versus LS-grown (P = 0.07) cells due to reduced PSI acceptor side limitation (Supplemental Fig. S4).
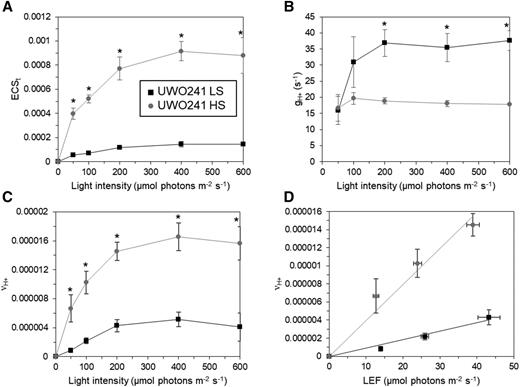
Photosynthetic properties of UWO 241 under various light intensities using ECS. A to C, The ECSt (proportional to pmf; A), gH+ (reflecting ATP synthase activity; B), and νH+ (reflecting proton flux through ATP synthase; C) of UWO 241 grown in LS (black squares) and HS (gray circles) conditions were measured from dark interval relaxation kinetics. D, The relationship between νH+ and LEF (measured by chlorophyll fluorescence; Supplemental Fig. S2) was assessed in UWO 241. Data are means ± sd (n = 3). Asterisks indicate statistical differences (Student's t test, unequal variance; *P< 0.05).
Isolation of a PSI Supercomplex in UWO 241
The formation of PSI supercomplexes has been shown to be essential for the induction of CEF in plants and algae (DalCorso et al., 2008; Iwai et al., 2010). An earlier report showed that high salinity-acclimated cultures of UWO 241 form a PSI supercomplex (UWO 241-SC); however, the yield of the UWO 241-SC from fractionated thylakoids was relatively low and only a few proteins were identified (Szyszka-Mroz et al., 2015). In agreement with this report, the Suc gradient from thylakoids isolated from UWO 241-LS had three distinct bands corresponding to major LHCII (band 1), PSII core complex (band 2), and PSI-LHCI (band 3; Fig. 3A). In contrast, UWO 241-HS thylakoids lacked a distinct PSI-LHCI band but exhibited several heavier bands, including the UWO 241-SC band (band 4; Fig. 3B). We significantly improved recovery of the UWO 241-SC by solubilizing thylakoids with the detergent n-dodecyl-α-maltoside (α-DDM) rather than β-DDM, which was used by other groups (Fig. 3B). As a control, we compared the banding pattern of C. reinhardtii thylakoids when cells were exposed to the treatment typically used by others to induce supercomplex formation (i.e. state 1 versus state 2 conditions; Iwai et al., 2010; Takahashi et al., 2013; Fig. 3, C and D, respectively). In contrast with UWO 241, band 3 (PSI) was more prominent while the supercomplex band (band 4) was diffuse in state 2-treated C. reinhardtii cells (Fig. 3D).
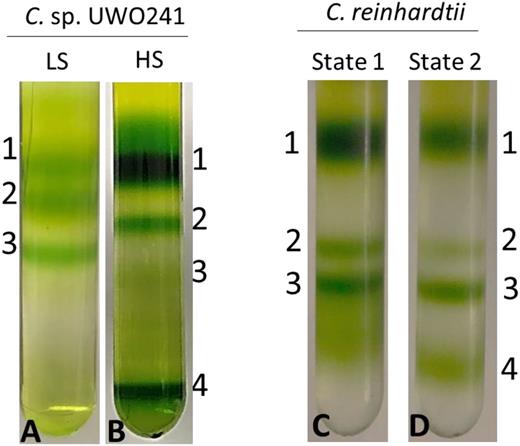
Supercomplex formation in UWO 241 versus C. reinhardtii. A and B, Fractionation of major thylakoid chlorophyll-protein complexes from UWO 241 by Suc density ultracentrifugation from LS- and HS-grown cultures (A and B, respectively). C and D, Fractionation of major thylakoid chlorophyll-protein complexes from C. reinhardtii exposed to state 1 and state 2 conditions (C and D, respectively). Cultures of C. reinhardtii were grown under control conditions (20°C/100 μmol m−2 s−1) and either dark adapted for 10 min (state 1; C) or incubated under anaerobic conditions for 30 min (state 2; D). Band 1, LHCII; band 2, PSII core; band 3, PSI-LHCI; band 4, supercomplex.
Low-temperature fluorescence spectra were analyzed for the four bands extracted from the Suc density gradients shown in Figure 3, B and D (i.e. UWO 241-HS and state 2-treated C. reinhardtii, respectively). In C. reinhardtii, band 1 exhibited a major emission peak at 680 nm (Fig. 4A, corresponding to fluorescence from LHCII; Krause and Weis, 1991). Band 2 exhibited an emission peak at 685 nm, consistent with the PSII core (Fig. 4A). Band 3 exhibited a peak at 685 nm and a strong peak at 715 nm; the latter was consistent with PSI-LHCI (Fig. 4A). However, band 4 exhibited a strong fluorescence peak at 680 nm and a minor peak at 715 nm (Fig. 4A).
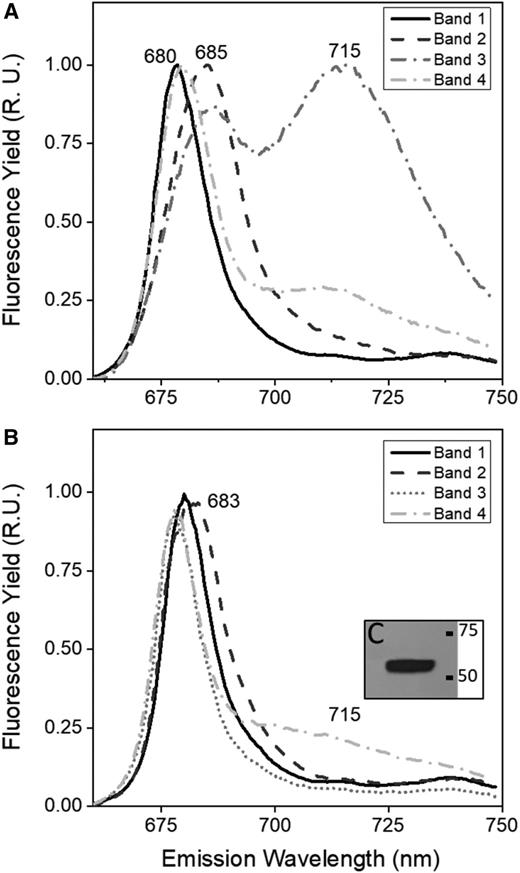
77K fluorescence emission spectra of chlorophyll-protein complexes from C. reinhardtii and UWO 241. Low-temperature chlorophyll a fluorescence emission spectra are shown for pigment-protein bands isolated from Suc density gradients shown in Figure 3. A, Low-temperature chlorophyll a emission spectra of bands from C. reinhardtii state II conditions. B, Emission spectra of bands from HS cultures of UWO 241. C, Immunoblot of the UWO 241-SC band with PsaA antibody. Spectra represent normalized data and the average of three scans. R.U., Relative unit.
Fractionated thylakoids from UWO 241-HS exhibited emission spectra for band 1 and band 2 that were comparable with that from C. reinhardtii (Fig. 4B). In contrast, both band 3 and band 4 (PSI and supercomplex bands, respectively) exhibited highly reduced or a lack of fluorescence associated with PSI. However, we confirmed the presence of the PSI reaction center protein, PsaA, in the UWO 241-SC by immunoblotting (Fig. 4C).
Protein Composition of the Supercomplex
Protein components of the UWO 241-SC were analyzed using liquid chromatography-tandem mass spectrometry (LC-MS/MS). We identified a total of 39 proteins in the isolated band 4. The most abundant proteins in the supercomplex were proteins of the PSI reaction center and cyt b6f. In total, we identified seven of 13 subunits of the PSI reaction center (Table 1; Supplemental Table S1). Only two LHCI subunits, Lhca3 and Lhca5, and one LHCII minor subunit, CP29, were associated with the UWO 241-SC. CAS was identified as the fourth most abundant protein in the UWO 241-SC. We also identified four subunits of ATP synthase in the UWO 241-SC (α, β, γ, and δ). Previously identified FtsH and PsbP proteins were also detected.
The UWO 241 supercomplex contains subunits of PSI, cyt b6f, ATP synthase, as well as several antenna proteins
Proteomic analysis is shown for band 4 isolated from cultures acclimated to high salinity (700 mm NaCl; Fig 3B). Percentage NSAF (normalized spectral abundance factor) values for selected proteins are shown. The identity of the organism with the protein of the closest homology is also reported.
| Protein | Percentage NSAF | UniProtKB | Organism |
|---|---|---|---|
| PSI | |||
| PsaD | 4.53 | Q39615 | C. reinhardtii |
| PsaE | 4.24 | P12356 | C. reinhardtii |
| PsaF | 3.12 | P12356 | C. reinhardtii |
| PsaH | 1.84 | P13352 | C. reinhardtii |
| PsaK | 6.13 | P14225 | C. reinhardtii |
| PsaL | 2.43 | Q39654 | Cucumis sativus |
| LHCI and LHCII antenna | |||
| Lhca3 | 1.35 | Q9SY97 | Arabidopsis |
| Lhca5 | 2.82 | Q9C639 | Arabidopsis |
| CP29 | 2.25 | Q93WD2 | C. reinhardtii |
| LHCII type I | 2.22 | P20866 | Physcomitrella patens |
| CB2 | 9.46 | P14273 | C. reinhardtii |
| Cyt b6f | |||
| PetA | 5.35 | P23577 | C. reinhardtii |
| PetB | 2.33 | Q00471 | C. reinhardtii |
| PetC | 1.15 | P49728 | C. reinhardtii |
| ATP synthase | |||
| ATP synthase α | 2.45 | P26526 | C. reinhardtii |
| ATP synthase β | 2.07 | P06541 | C. reinhardtii |
| ATP synthase δ | 1.15 | P26360 | Ipomoea batatas |
| ATP synthase γ | 1.12 | Q96252 | Arabidopsis |
| Other | |||
| CAS | 4.65 | Q9FN48 | Arabidopsis |
| FtsH1 | 0.49 | Q5Z974 | Oryza sativa |
| FtsH2 | 1.26 | O80860 | Arabidopsis |
| PsbP | 2.52 | P11471 | C. reinhardtii |
Bands 3 and 4 contained many PSI core proteins but lacked almost all Lhca proteins (Supplemental Table S1). To determine whether the absence of Lhcas in the UWO 241 proteome was due to a loss of Lhca genes, we searched a UWO 241 transcriptome generated from a culture grown under low temperature/high salinity (Raymond et al., 2009). We identified nine Lhca homologs that were transcribed under high salinity, suggesting that all or most of the Lhca genes are expressed in UWO 241 (Supplemental Fig. S5).
Whole-Cell Proteome Analysis
We wondered whether constitutively high CEF could be linked to changes in downstream metabolism in UWO 241. To address this question, whole-cell proteomes extracted from cultures of UWO 241-LS and UWO 241-HS under optimal temperature/light conditions were compared. Overall, 98 proteins from various functional categories were identified as significantly affected in the two treatments, out of which 55 were up-regulated and 43 were down-regulated in HS-acclimated cells. Proteins associated with photosynthesis (19%), translational machinery (19%), and other metabolism (18%) were most affected in the treatment. This was followed by proteins belonging to the carbohydrate and storage metabolism (11%) category (Supplemental Fig. S6).
Photosynthesis
Differentially regulated proteins participating in photosynthesis were identified in UWO 241-HS. Three photosystem reaction center proteins, PsaB and PsaN of PSI and D2 of PSII, as well as extrinsic proteins of the water-oxidizing complex, PsbO and PsbQ, were down-regulated in UWO 241-HS (Figs. 5 and 6A; Supplemental Table S2). One protein of chloroplastic ATP synthase, the ε-subunit, was up-regulated (3.8-fold) in UWO 241-HS. Last, both FtsH proteins that were detected in the UWO 241-SC, FtsH1 and FtsH2, were up-regulated in UWO 241-HS (Table 1; Supplemental Table S3).
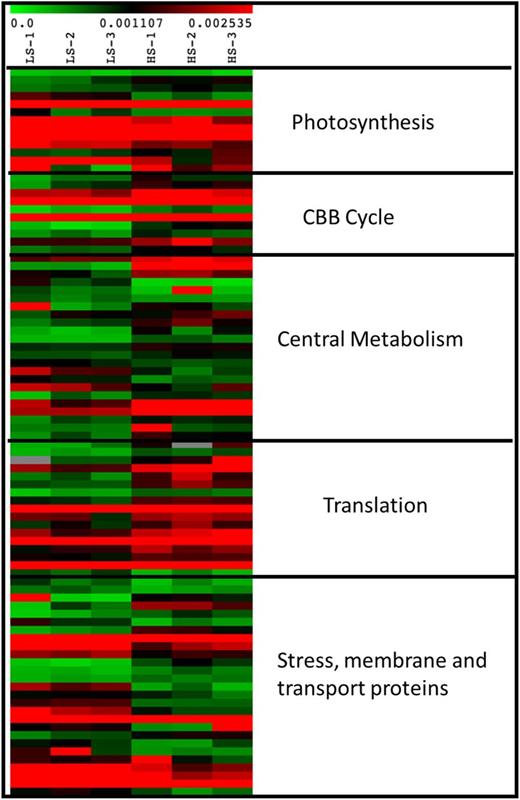
Heat map of differentially regulated proteins in UWO 241 under LS and HS conditions. The normalized spectral abundance factor values are plotted for each replicate in the two conditions (n = 3) using a color-based approach (green, low abundance; red, high abundance). The proteins are categorized into broad processes to which they belong.
![Changes in photosynthetic machinery and downstream metabolism in UWO 241 associated with high salinity. A, Proteins participating in photosynthetic machinery (photosynthetic electron transport chain [PETC], green; Calvin cycle, blue) significantly affected in UWO 241 under high salinity. B, Proteins participating in downstream metabolism that belong to primary (blue), storage (green), secondary (red), and amino acid biosynthesis (brown) metabolic pathways significantly affected in UWO 241 under high salinity. Proteins with fold change (FC) > 1.2 are shown (n = 3).](https://oup.silverchair-cdn.com/oup/backfile/Content_public/Journal/plphys/183/2/10.1104_pp.19.01280/2/m_plphys_v183_2_588_f6.jpeg?Expires=1750328538&Signature=RTS6FTNdMlI7KANCxtVRkBqDpZ7gYmys~AQTtv3ltpBBsuhT8RdPbS85pZ88JfQGa8X42eS4ludCm06NzondoeCq72x~-2zDKlrdFMPANVGzxpixLGTjB7F~DO4GFh~kG5wFmCNLz9wSrkVjPAVnY9dEtHBXt6f69oBKEhFoqtrsh09FxoUv3r034FsBeUHnmLQPmJMUiFcrSdQ8FlR-m7LfkIEB8lLGwaV3g7hAXgkNOlpaxmoN3Phe6YV6~zUo066tQjHyVutZZ4UGKkHOfU71ef4~zLowPYG7W9bRKyC65DGljRZb7~DqPA~nzzrCy4etIKDajaKPntTjoMoLeA__&Key-Pair-Id=APKAIE5G5CRDK6RD3PGA)
Changes in photosynthetic machinery and downstream metabolism in UWO 241 associated with high salinity. A, Proteins participating in photosynthetic machinery (photosynthetic electron transport chain [PETC], green; Calvin cycle, blue) significantly affected in UWO 241 under high salinity. B, Proteins participating in downstream metabolism that belong to primary (blue), storage (green), secondary (red), and amino acid biosynthesis (brown) metabolic pathways significantly affected in UWO 241 under high salinity. Proteins with fold change (FC) > 1.2 are shown (n = 3).
Several proteins associated with the Calvin-Benson-Bassham (CBB) cycle were significantly up-regulated in UWO 241-HS cells (Figs. 5 and 6A; Supplemental Table S3). The Rubisco large subunit was up-regulated in UWO 241-HS, along with two chaperone proteins involved in Rubisco assembly, RuBA and RuBB. A class 2 Fru-1,6-bisphosphatase (FBPase) was the third highest up-regulated protein (5-fold), and Fru bisphosphate aldolase and transketolase were also up-regulated in UWO 241-HS (Fig. 6; Supplemental Table S3).
Metabolism
The enzyme glycerol-3-phosphate dehydrogenase, involved in glycerol biosynthesis, was the highest up-regulated enzyme in UWO 241-HS cultures (6-fold; Fig. 6B; Supplemental Table S3). Fru bisphosphate aldolase, involved in gluconeogenesis and feeding into starch synthesis, as well as Glc-1-P adenylyltransferase (AGPase) and starch synthase1 (the last enzyme in the starch synthesis pathway) were also up-regulated in UWO 241-HS (Fig. 6B; Supplemental Table S3).
Two key enzymes from the shikimate pathway were significantly up-regulated in UWO 241-HS: (1) the first enzyme in the pathway, DAHP (3-deoxy-d-arabinoheptulosonate 7-phosphate) synthase (2.3-fold), and (2) the last enzyme in the pathway, chorismate synthase (1.9-fold; Fig. 6B; Supplemental Table S3). Indole-3-glycerol phosphate synthase was also up-regulated significantly in the HS conditions.
Primary Metabolome Analysis
We detected a total of 771 unique metabolic signatures, 179 of which were positively identified based on their mass spectra and retention times (Supplemental Table S4; Kind et al., 2009). A heat map of all measured (identified and unidentified) metabolites showing the relative changes in primary metabolite abundances indicated clustering and a discrete population of metabolites that accumulate at high levels in HS-grown cultures when compared with LS-grown cells (Supplemental Fig. S7). Overall, 59 metabolites (32%) were significantly different (false discovery rate-adjusted P < 0.05), out of which nine were present in higher abundance and 50 were present in lower abundance in HS- versus LS-grown UWO 241 cultures (Supplemental Tables S5 and S6).
We observed high levels of glycerol in the primary metabolome of HS-grown UWO 241 (8.7 FC) and high accumulation of the compatible solutes Suc (18.2 FC) and Pro (27.1 FC; Supplemental Table S5). We also observed a high accumulation of phytol (12.6 FC), suggesting chlorophyll degradation. UWO 241-HS cultures exhibited decreased amounts of 17 amino acids and compounds associated with amino acid metabolism (Supplemental Table S6). Most notable metabolites from this class were Lys (29.4 FC) and Orn (14 FC), which could signify a shift in amino acid metabolism to Pro during exposure to high salinities. We also observed lower levels of the amino acid Trp (2.8 FC) in HS-grown cultures. Metabolites involved in purine and pyrimidine metabolism were present in lower amounts in UWO 241 exposed to high salinity, suggesting that these cells have shifted their metabolism from maintenance of the cell cycle and nucleic acid synthesis to producing osmoprotectants and compatible solutes. We also observed a reduction of 3-phosphoglycerate (2.9 FC) in HS-grown cultures.
DISCUSSION
Our study shows that UWO 241 maintains robust growth and photosynthesis under the combined stress of low temperature and high salt. This ability differs markedly from other model plants and algae that typically display down-regulation of photosynthesis and growth when exposed to environmental stress, mainly as a consequence of bottlenecks in carbon fixation capacity (Hüner et al., 1998, 2003, 2016; Ensminger et al., 2006). Previous research has thoroughly described adaptive strategies for survival under permanent low temperatures, while survival under hypersalinity has received less consideration (Morgan et al., 1998; Morgan-Kiss et al., 2002a; Szyszka et al., 2007; Possmayer et al., 2011).
One of the more distinct photosynthetic characteristics of UWO 241 is the presence of a strong capacity for PSI-driven CEF (Morgan-Kiss et al., 2002b; Szyszka-Mroz et al., 2015; Cook et al., 2019). We validated that CEF rates are high in HS-grown cultures using the ECS signal, which was purported to mitigate problems with using P700 absorbance changes for CEF estimates (Lucker and Kramer, 2013). While CEF appears to be essential in plants and algae for balancing the ATP/NADPH ratio and protecting both PSI and PSII from photooxidative damage (Munekage et al., 2004; Joliot and Johnson, 2011; Huang et al., 2012), most studies report that CEF is part of short-term stress acclimation. Our work here, as well as other studies, suggest a larger role for CEF during long-term adaptation under permanent environmental stress (Morgan-Kiss et al., 2002b; Szyszka-Mroz et al., 2015; Cook et al., 2019).
Constitutively high rates of CEF in UWO 241 are associated with a general reorganization of PSI and PSII complexes (Szyszka-Mroz et al., 2019) and the formation of a PSI-cyt b6f supercomplex (Szyszka-Mroz et al., 2015). In this study, following optimization of thylakoid protein complex solubilization by substituting β-DDM with α-DDM, the vast majority of PSI shifted from free PSI in the LS-grown cultures to association with the UWO 241-SC in the HS-grown cultures. PSI supercomplexes have been described in several plant and algal species (Iwai et al., 2010; Li et al., 2018; Steinbeck et al., 2018). The UWO 241-SC is distinct from that of C. reinhardtii because (1) its assembly is independent of short-term exposure to dark anaerobic conditions or other state transition-inducing treatments (Fig. 3), (2) the vast majority of PSI in UWO 241 is associated with the UWO 241-SC (Fig. 3), and (3) isolated UWO 241-SC and PSI bands as well as whole cells lack typical PSI fluorescence emission at 77K, despite the presence of several PSI core proteins (Fig. 4; Table 1; Supplemental Table S1; Morgan et al., 1998; Morgan-Kiss et al., 2002a, 2002b; Cook et al., 2019). Thus, CEF combined with significant structural and functional changes to PSI are major targets for long-term stress acclimation in UWO 241 (Fig. 7A).
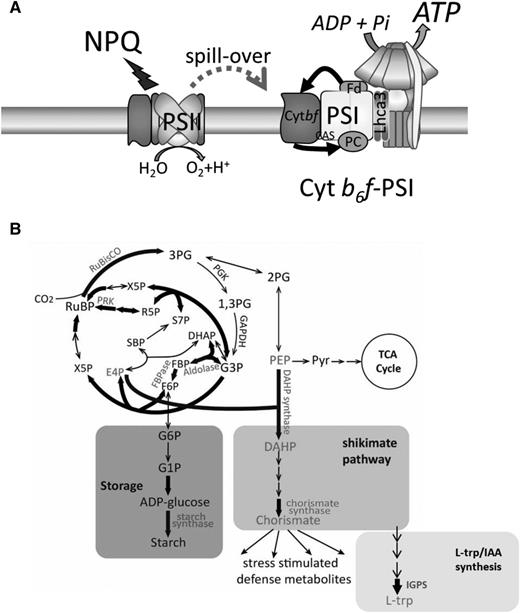
A restructured photosynthetic apparatus supports the rewiring of central metabolism in UWO 241. A, The photosynthetic apparatus of UWO 241 is assembled to promote high rates of CEF sustained by the formation of a PSI-cyt b6f supercomplex. CEF supports the photoprotection of PSII and PSI and provides additional ATP for downstream metabolism. B, ATP is consumed, in part, by the CBB cycle as well as an up-regulated shikimate pathway and carbon storage pathways (starch, glycerol). The model is based on data presented here and in other studies (Szyszka-Mroz et al., 2015, 2019; Cook et al., 2019). Fd, Ferredoxin; IAA, indole acetic acid; PEP, phosphoenolpyruvate; Pyr, pyrimidine; RuBP, ribulose-1,5-bisphosphate; TCA, trichloroacetic acid.
While the UWO 241-SC contains most of the PSI core proteins, both the UWO 241-SC and PSI bands, as well as whole-cell proteomes isolated from LS and HS conditions, lacked homologs for most LHCI proteins (Table 1; Supplemental Table S1). This agrees with an earlier study that was unable to detect most of the LHCI polypeptides by immunoblotting in UWO 241 thylakoids (Morgan et al., 1998). Cook et al. (2019) also reported that the absence of LHCI proteins in UWO 241 was not associated with adaptation to chronic iron deficiency, an additional stress experienced by natural communities of this alga. Transcriptomic analyses detected nine Lhca homologs in UWO 241 grown under low temperature/high salinity (Supplemental Fig. S5). Therefore, it appears that while most of the Lhca genes are encoded for and transcribed, few of the LHCI proteins are produced under the growth conditions tested thus far. These results fit well with numerous unsuccessful attempts to elicit typical 77K PSI long-wavelength fluorescence emission in UWO 241 (Morgan et al., 1998; Morgan-Kiss et al., 2002a, 2002b, 2005; Szyszka et al., 2007; Cook et al., 2019). It also explains the differences in the 77K emission spectra of the UWO 241-SC and PSI bands between UWO 241 and C. reinhardtii (Fig. 4). Lastly, a recent study reported that UWO 241 transfers light energy from PSII to PSI via constitutive energy spillover through an undescribed mechanism (Szyszka-Mroz et al., 2019). Thus, UWO 241 favors down-regulated LHCI and constitutive energy spillover in response to its extreme habitat, most likely the natural light environment of extreme shade enriched in blue wavelengths (Neale and Priscu, 1995).
The direct product of CEF is extra transthylakoid pmf at the expense of NADPH production (Lucker and Kramer, 2013; Dumas et al., 2016; Yamori et al., 2016), with the consequence of CEF impacting either cellular energy production or photoprotection. CEF-dependent formation of a pH gradient protects PSII by activating energy-dependent quenching, a major process for dissipation of excess light energy in PSII (Yamori et al., 2016). Alternatively, CEF-generated pmf can be used for the production of additional ATP for high-energy-consuming processes, including protein synthesis, transport processes, ion homeostasis (He et al., 2015), CO2-concentrating mechanisms (Horváth et al., 2000; Lucker and Kramer, 2013), or production of secondary metabolites (Murthy et al., 2014). Lastly, CEF prevents PSI photoinhibition by down-regulating LEF and alleviating overreduction of the acceptor side of PSI, thereby preventing reactive oxygen-induced PSI damage (Munekage et al., 2008; Shimakawa et al., 2016; Chaux et al., 2017; Huang et al., 2017). A strong constitutive CEF mechanism in UWO 241 could be beneficial for one or most of the above purposes. First, HS-grown cultures possess a higher capacity for NPQ (Supplemental Fig. S3), supporting a role for CEF in constitutive photoprotection ability. High CEF rates also match up with a higher PSI photochemical yield and a lower PSI acceptor side limitation in HS-grown cultures (Supplemental Fig. S4), suggesting enhanced PSI photoprotection in UWO 241-HS cells.
UWO 241-HS cells exhibited significantly higher levels of cellular ATP compared with UWO 241-LS cells (Supplemental Fig. S8). In addition, ATP synthase subunits were associated with the UWO 241-SC (Table 1), suggesting that CEF contributes extra ATP in UWO 241. HS-grown cultures exhibited significantly higher ECSt and νH+ compared with LS-grown cultures, suggesting a high flux of protons through the chloroplastic ATP synthase in spite of slow activity of ATP synthase (compare Fig. 2, A and C, with Fig. 2B). Slower activity of ATP synthase could be overcome by higher abundance of ATP synthase subunits in the UWO 241-HS, which is reported here (Figs. 5 and 6) and in an earlier report (Morgan et al., 1998). Recently, it was shown that in a salt-tolerant soybean (Glycine max), increased CEF contributes to excess ATP that is used to drive the import of Na+ in the vacuole (He et al., 2015). Taken together, constitutively high rates of CEF in UWO 241 are likely to provide dual benefits, that of constitutive photoprotection of both PSI and PSII and extra ATP to support downstream processes important for low-temperature and/or high-salinity adaptation (Fig. 7A).
Comparison of whole-cell proteomes and metabolomes revealed significant shifts in primary metabolism in LS- and HS-grown UWO 241. First, HS-grown cultures have a strong carbon fixation potential. Key enzymes within the CBB cycle are up-regulated under HS, including large subunit of Rubisco (EC 4.1.39) and a chaperone complex involved in Rubisco assembly (RuBA and RuBB proteins). Several enzymes important in regeneration of ribulose-1,5-bisphosphate, including FBPase (EC 3.1.3.11), Fru bisphosphate aldolase (EC 4.1.2.13), transketolase (EC 2.2.1.1), ribose-5 phosphate isomerase (EC 5.2.1.6), and phosphoribulokinase (EC 2.7.1.19), are also more abundant in HS-grown cells (Fig. 7B). Overexpression of key bottleneck CBB enzymes such as FBPase and SBPase enhances carbon fixation and ribulose-1,5-bisphosphate regeneration (Lefebvre et al., 2005; Tamoi et al., 2006) while also supporting improved photosynthesis during stress (Driever et al., 2017). Low levels of 3-phosphoglycerate, the direct by-product of Rubisco activity, also suggest strong carbon sinks for fixed CO2 in HS-grown cultures (Supplemental Table S6). Lastly, overproduction of these key CBB enzymes is supported by a robust protein translation ability, as several ribosomal proteins are also overexpressed in HS-grown cells (Supplemental Table S3).
Enhanced CBB pathway activity would support robust photosynthetic activity and growth in UWO 241. However, proteomic evidence revealed other potential carbon sinks, including carbon storage in the form of starch (Supplemental Table S3). Two key enzymes of starch synthesis were up-regulated under high salinity, AGPase (EC 2.7.7.27) and starch synthase (EC 2.4.1.242). AGPase catalyzes the formation of Glc-1-P to ADP-Glc and consumes one ATP. ADP-Glc serves as a substrate for starch synthase to extend the glucosyl chain in starch. In contrast with these findings, plant and algal fitness and survival under low temperatures or high salinity are associated with starch degradation (for review, see Thalmann et al., 2016). Under abiotic stress, starch is remobilized into sugars and other metabolites to provide carbon and energy when photosynthesis is compromised. In contrast with cold- or salt-sensitive plants and algae, the photosynthetic apparatus of UWO 241 is remodeled to support photosynthesis under continuous low temperatures and high salinity (Morgan et al., 1998; Szyszka et al., 2007; Pocock et al., 2011). Thus, the accumulation of starch in UWO 241 may act as a strong carbon sink to support high rates of carbon fixation (Fig. 7B). Starch stored in the chloroplast is also transitory and is often rapidly turned over (Thalmann et al., 2016). Starch content was comparable between LS- and HS-grown UWO 241 cultures (Supplemental Fig. S9). Thus, transiently stored starch could be an additional adaptive strategy in UWO 241, acting as an energy and carbon buffer that can be rapidly mobilized when needed. This theory is supported by other publications that reported accumulation of starch under cold or salinity stress (Siaut et al., 2011; Wang et al., 2013), suggesting that transitory starch synthesis and mobilization may be important during stress acclimation.
The shikimate pathway is an essential link between primary and secondary metabolism for producing precursors for aromatic amino acids (Trp, Phe, and Tyr) as well as many other aromatic metabolites (Maeda and Dudareva, 2012). It is a high-carbon-flux pathway, accounting for approximately 30% of all fixed CO2 in an organism (Tohge et al., 2013). Various biotic and abiotic stresses up-regulate genes of the shikimate pathway as well as downstream biosynthesis pathways that use the main product of the shikimate pathway, chorismate, as a substrate (Tzin and Galili, 2010). UWO 241-HS exhibited up-regulation of two key shikimate enzymes, DAHP synthase (EC 2.5.1.54) and chorismate synthase (EC 4.2.3.5). The substrates for DAHP synthase are erythrose-4-phosphate (E4P) and 2-phosphoenolpyruvate. E4P is a product of the CBB cycle enzyme transketolase. Up-regulation of transketolase in HS-grown cells indicates that E4P would be supplied in high levels to support high flux through the shikimate pathway. On the other hand, the supply of 2-phosphoenolpyruvate for chorismate synthesis is likely to come from glycolysis, as indicated by the higher level of expression of glycerol-3-phosphate dehydrogenase under the HS condition (Supplemental Table S3). Thus, the CBB cycle and glycolysis are likely to be coordinated to provide substrates to support high flux through the shikimate pathway. Lastly, there is evidence linking CEF with the shikimate pathway. One recent study involving a CEF mutant of Arabidopsis (Arabidopsis thaliana) lacking PGR5 protein showed that the levels of shikimate metabolites were significantly reduced in the CEF mutant as compared with the wild type, suggesting a link between CEF and chorismate synthesis (Florez-Sarasa et al., 2016).
Despite more than two decades of study on UWO 241, there are many questions that remain unanswered regarding how this enigmatic organism thrives in an environment inhospitable to most of life on Earth. Recent articles have added to the breadth of knowledge on the photosynthetic apparatus, including a cold-adapted ferredoxin isoform (Cvetkovska et al., 2018) and a thylakoid kinase exhibiting temperature-dependent phosphorylation patterns (Szyszka-Mroz et al., 2019). Here, we extend our understanding of long-term photosynthetic adaptation to permanent cold and hypersalinity by proposing a model for sustained PSI-CEF that supports a robust growth and photosynthesis (Fig. 7). Under permanent environmental stress, CEF supplies constitutive photoprotection of PSI and PSII while also producing extra ATP for downstream metabolism (Fig. 7A). The restructured photosynthetic apparatus is accompanied by a major rewiring of central metabolism to provide a strong carbon fixation potential that is used in part to produce stored carbon and drive high-carbon-flux pathways (Fig. 7B). Algae adapted to multiple stressors, such as low temperatures combined with high salinity, are robust fixers of CO2, providing new genetic targets for improving crop stress resistance and previously unconsidered sources of natural carbon sinks.
MATERIALS AND METHODS
Culture Conditions and Growth Physiology
Chlamydomonas sp. UWO 241 (CCMP1619) was grown in either BBM (0.43 mm NaCl; LS) or BBM supplemented with 700 mm NaCl (HS). Based on earlier studies (Morgan et al., 1998), UWO 241 cultures were grown under a temperature/irradiance regime of 8°C/50 photons μmol m−2 s−1. Chlamydomonas reinhardtii UTEX 90 was grown in BBM (LS) at 20°C/100 μmol photons m−2 s−1. All cultures were grown in 250-mL glass Pyrex tubes in temperature-regulated aquaria under a 24-h light cycle and were continuously aerated with sterile air supplied by aquarium pumps (Morgan-Kiss et al., 2008). Growth was monitored daily by optical density at a wavelength of 750 nm. Maximum growth rates were calculated using natural log transformation of the optical density values during the exponential phase. Three biological replicates were performed, and all subsequent experiments were conducted on log phase cultures. Oxygen evolution was measured at 8°C with Chlorolab 2 (Hansatech) based on a Clark-type oxygen electrode, following the method described by Jeong et al. (2017). Cellular ATP and starch were determined using commercial kits, an ATP colorimetric/fluorometric assay kit (catalog no. K354; BioVision) and a starch assay kit (catalog no. SA20; Sigma-Aldrich), respectively. For supercomplex isolation, C. reinhardtii cells were exposed to either state 1 or state 2 conditions. For state 1 induction, midlog phase cells were incubated in darkness for 10 min to completely oxidize the plastoquinone pool. For state 2 induction, midlog phase cells were incubated in the dark under anaerobic conditions (N2 bubbling) for 30 min.
Low-Temperature (77K) Fluorescence Spectra
Low-temperature chlorophyll a fluorescence emission spectra of whole cells and isolated chlorophyll-protein complexes were measured using Luminescence Spectrometer LS50B (Perkin-Elmer) as described by Morgan-Kiss et al. (2008) at 436 nm and 5-nm (isolate complexes) or 8-nm (whole cells) slit width. Prior to the measurement, cultures were dark adapted for 10 min. Decompositional analysis was performed using a nonlinear least-squares algorithm using Microcal OriginPro Version 8.5.1 (Microcal Origin). The fitting parameters for the Gaussian components (position, area, and full width half-maximum) were free-running parameters.
P700 Oxidation-Reduction and CEF
FR light-induced photooxidation of P700 was used to determine rates of CEF as described by Morgan-Kiss et al. (2002b). A volume of exponential phase cultures representing 25 μg of chlorophyll a was dark adapted for 10 min and then filtered onto 25-mm GF/C filters (Whatman). Filters were measured on the Dual-PAM 100 instrument using the leaf attachment. The proportion of photooxidizable P700 was determined by monitoring absorbance changes at 820 nm and expressed as the parameter ∆A820/A820. The signal was balanced and the measuring light switched on. FR light (λmax = 715 nm, 10 W m−2; Scott filter RG 715) was then switched on to oxidize P700. After steady-state oxidation levels were reached, the FR light was switched off to rereduce P700. The t1/2 red was calculated after the FR light was turned off as an estimate of relative rates of PSI-driven CEF (Ivanov et al., 1998). The rereduction time for P700 was calculated using Microcal Origin software (Microcal Software).
In Vivo Spectroscopy Measurements
Saturation-pulse chlorophyll fluorescence yield changes and dark interval relaxation kinetics of the ECS were measured at 8°C with the IDEA spectrophotometer as described previously with some modifications (Sacksteder and Kramer, 2000; Zhang et al., 2009). First, 2.5 mL of cells supplemented with 25 μL of 0.5 m NaHCO3 was preincubated in the dark for 10 min and followed by 10 min of illumination of FR light. The chlorophyll fluorescence and ECS were measured with the cells acclimated for 5 min in various actinic light intensities provided by red light-emitting diodes. The PSII operating efficiency (ΦPSII) was calculated as Fq′/Fm′ and NPQ as (Fm − Fm′)/Fm′. The LEF was calculated from the following equation: LEF = A × (fractionPSII) × I × ΦPSII, where I is the light intensity, A is the absorptivity of the sample, which is generally assumed to be 0.84, and fractionPSII is the fraction of absorbed light stimulating PSII (Baker, 2008). The fractionPSII values of UWO 241 grown in LS and HS, measured by 77K fluorescence spectra, were 0.709 and 0.746, respectively. The ECSt was used to estimate the pmf. The gH+ was estimated from the inverse of the lifetime of the rapid decay of ECS (Baker et al., 2007). All ECS signals were normalized to the rapid rise in ECS induced by a single turnover flash to account for changes in pigmentation (Livingston et al., 2010).
Thylakoid Isolation
Thylakoids were isolated according to Morgan et al. (1998). Midlog phase cultures were collected by centrifugation at 2,500g for 5 min at 4°C. All buffers were kept ice-cold and contained 1 mm Pefabloc Sc (Sigma) and 20 mm NaF. The pellet was resuspended in grinding buffer (0.3 m sorbitol, 10 mm NaCl, 5 mm MgCl2, 5 mm MgCl2, 1 mm benzamidine, and 1 mm aminocaproic acid). The cells were disrupted using a chilled French press at 10,000 pounds per square inch twice and then centrifuged at 23,700g for 30 min. The thylakoid pellet was resuspended in wash buffer (50 mm Tricine-NaOH [pH 7.8], 10 mm NaCl, and 5 mm MgCl2) and centrifuged at 13,300g for 20 min. The pellet was resuspended in storage buffer (0.3 m sorbitol, 10% [v/v] glycerol, 50 mm Tricine-NaOH [pH 7.8], 10 mm NaCl, and 5 mm MgCl2) and stored at −80°C until analysis.
SDS-PAGE and Immunoblotting
SDS-PAGE was performed using the Bio-Rad Mini-Protean system and a 12% urea-SDS gel (Laemmli, 1970). Thylakoid membranes were denatured using 50 mm DTT and incubated at 70°C for 5 min. Samples were loaded on an equal protein basis (10 μg of total protein). Proteins were transferred to a nitrocellulose membrane using cold-wet transfer at 100 V for 2.5 h. The membrane was blocked with Tris-buffered saline + Tween with 5% (w/v) milk (Carnation). A primary antibody against PsaA (catalog no. AS06-172; Agrisera) was used at a 1:1,000 dilution to probe for the major reaction center protein of PSI. Membranes were then exposed to Protein A conjugated to horseradish peroxidase, and blots were detected with ECL Select Western Blotting Detection Reagent (Amersham).
Supercomplex Isolation
Suc step density centrifugation was used to isolate supercomplexes from exponentially grown cultures according to Szyszka-Mroz et al. (2015) with some modifications. Every step was performed in darkness and on ice. All buffers contained phosphatase (20 mm NaF) and protease (1 mm Pefabloc Sc) inhibitor. Cells were collected by centrifugation, and the pellet was washed twice in buffer 1 (0.3 m Suc, 25 mm HEPES-KOH [pH 7.5], and 1 mm MgCl2). Cells were disrupted using a French press as described above, and broken cells were spun down at 50,000g for 30 min. The pellet was resuspended in buffer 2 (0.3 m Suc, 5 mm HEPES-KOH [pH 7.5], and 10 mm EDTA) and centrifuged at 50,000g for 30 min. The thylakoid pellet was resuspended gently in buffer 3 (1.8 m Suc, 5 mm HEPES-KOH [pH 7.5], and 10 mm EDTA) and transferred to an Ultra-clear tube (catalog no. 344060; Beckman Coulter). The thylakoid prep was overlaid with buffer 4 (1.3 m Suc, 5 mm HEPES-KOH [pH 7.5], and 10 mm EDTA) followed by buffer 5 (0.5 m Suc and 5 mm HEPES-KOH [pH 7.5]). This Suc step gradient was ultracentrifuged at 288,000g for 1 h at 4°C using an SW40Ti rotor (Beckman Coulter). Purified thylakoids were collected and diluted (threefold) in buffer 6 (5 mm HEPES-KOH [pH 7.5] and 10 mm EDTA) and centrifuged at 50,000g to pellet the membrane. Linear Suc gradients were made using the freeze-thaw method with buffer 7a (1.3 m Suc, 5 mm HEPES-KOH [pH 7.5], and 0.05% [w/v] α-DDM) and buffer 7b (0.1 m Suc, 5 mm HEPES-KOH [pH 7.5], and 0.05% [w/v] α-DDM). Briefly, two dilutions of buffers 7a and 7b were made, buffer 7-1 (2× buffer 7a + 1× buffer 7b) and buffer 7-2 (1× buffer 7a + 2× buffer 7b). To make the gradient, first, 3 mL of buffer 7a was poured into 12-mL Ultra-clear tubes followed by flash freezing in liquid nitrogen. Next, buffer 7-1 was poured on top, followed by flash freezing. This was repeated for buffer 7-2 and buffer 7b, respectively. The frozen gradients were kept at 4°C overnight to thaw. For supercomplex isolation, thylakoid membranes (0.4 mg of chlorophyll) were resuspended in 1% (w/v) α-DDM (catalog no. D99020; Glycon Biochemicals) and incubated on ice in the dark for 25 min. Membranes were spun down to remove insoluble material and loaded onto the linear Suc gradient described above (0.1–1.3 m Suc) containing 0.05% (w/v) α-DDM. Gradients were centrifuged at 288,000g for 21 h at 4°C using an SW40Ti rotor (Beckman Coulter). Protein complexes were extracted using a 21-gauge needle.
Sample Preparation for Proteomics
Whole-cell proteins were extracted as described previously (Valledor and Weckwerth, 2014). Midlog phase cells were collected by centrifugation at 2,500g for 5 min (50 mg wet weight). The cell pellets were resuspended in an extraction buffer containing 100 mm Tris-HCl (pH 8), 10% (v/v) glycerol, 2 mm Pefabloc Sc, 10 mm DTT, and 1.2% (v/v) plant protease inhibitor cocktail (catalog no. P9599; Sigma). Samples were transferred to 2-mL screw-cap tubes containing 25 mg of zirconia beads (catalog no. A6758; Bio-Rad) and homogenized three times for 45 s in a BeadBeater (BioSpec). Then, 20% (w/v) SDS solution was added to the tubes, and samples were incubated for 5 min at 95°C. The denatured proteins were centrifuged at 12,000g to pellet any insoluble material. Protein pellets were resuspended in 1.5 mL of Tris buffer (50 mm Tris-HCl, pH 8) containing 0.02% (w/v) β-DDM (Glycon Biochemicals) and supplemented with 1× Halt protease and phosphatase inhibitor cocktail (Thermo-Scientific). After the protein extraction, the sample preparation for proteomics was conducted following our previously published method (Wang et al., 2016). Specifically, 100 μg of total protein was treated with 8 m urea/5 mm DTT for 1 h at 37°C, followed by alkylation with 15 mm iodoacetamide in the dark for 30 min at room temperature. Samples were then diluted fourfold with 50 mm Tris-HCl buffer and digested using mass spectrometry-grade Trypsin Gold (Promega) at 1:100 (w/w) concentration for 16.5 h at 37°C. The digested samples were cleaned using Sep-Pak C18 plus desalting columns (Waters).
Proteomic Analyses by LC-MS/MS
The whole-cell proteomics were conducted using Multidimensional Protein Identification Technology-based shotgun proteomics by loading digested peptides onto a biphasic strong cation-exchange/reverse-phase capillary column. Two-dimensional LC-MS/MS was conducted on an LTQ ion-trap mass spectrometer (Thermo Finnegan) operated in the data-dependent acquisition mode. The full mass spectra were recorded at 300 to 1,700 mass-to-charge ratio, and the five most abundant peaks of each scan were selected for MS/MS analysis. The MS/MS raw data were analyzed by first converting into MS2 files, followed by database search using ProLuCID (Xu et al., 2006). The UWO 241 protein database was generated based on our transcriptomics data supplemented with 37 common contaminants and their reversed sequences as a quality-control system to restrain false-positive discovery to 0.05. Differentially expressed proteins were analyzed using PatternLab for Proteomics (Carvalho et al., 2008). The proteomics results have been deposited to the MassIVE repository with the identifier MSV000084382.
For identifying protein components in the supercomplex, the complex was harvested and 30 μg of total protein was processed similarly as described above to get the digested peptides. Different from the whole-cell proteomics, the processed peptides were directly loaded onto a capillary C18 column without fractionation and further analyzed in a Thermo LTQ Orbitrap XL mass spectrometer. The full mass spectra were recorded in the range of 350 to 1,800 mass-to-charge ratio with a resolution of 30,000. The top 12 peaks of each scan were selected for MS/MS analysis. The data analysis was conducted similarly as described above.
Homologs of Lhca proteins were identified from a transcriptome previously generated from UWO 241 (Raymond et al., 2009; National Center for Biotechnology Information BioProject no. PRJNA575885).
Gas Chromatography-Mass Spectrometry
For determination of the primary metabolome, UWO 241 was grown in four biological replicate cultures as described above. Algal cells were harvested by centrifugation (6,000g, 5 min, 4°C) and washed once with fresh medium. The supernatant was decanted, and the algal cells were flash frozen in liquid nitrogen and stored at −80°C. Metabolite extractions and gas chromatography-mass spectrometry measurements were performed at the West Coast Metabolomics Center (University of California, Davis) following protocols from Fiehn et al. (2008). Mass spectra were processed using BinBase, an application system for deconvoluting and annotating mass spectral data, and analyzed at the West Coast Metabolomics Center as described (Fiehn et al., 2005). Metabolites were identified based on their mass spectral characteristics and gas chromatography retention times, by comparison with compounds in a plant and algae reference library. Peak heights for the quantification ion at the specific retention index corresponding to each metabolite were normalized by the sum of peak heights in the sample. Data processing, normalization, and statistical analysis were performed in-house. Normalized data were processed by cube root transformation followed by range scaling (van den Berg et al., 2006). Statistical analyses were performed by the Metaboanalyst 4.0 software suite (Chong et al., 2018) and included principal component analysis, Student’s t test, heat map, and clustering analysis using Ward’s linkage for clustering and Pearson’s correlation as a measure of dissimilarity.
Accession Numbers
Sequence data reported in this article can be found in the GenBank database under the accession number PRJNA575885 for Lhca genes. The accession numbers of proteins from band 3 in Supplemental Table S1 are as follows: PsaB (P36492), PsaD (Q39615), PsaE (P12352), PsaF (P12356), PsaH (P13352), PsaK (P14225), PsaN (Q9SBN5), Lhca3 (Q9SY97), and Lhca5 (Q9C639). Other accession numbers are reported in Table 1 and Supplemental Tables S2 and S3.
Supplemental Data
The following supplemental materials are available.
Supplemental Figure S1. Photosynthetic growth of UWO 241 under low and high salinity.
Supplemental Figure S2. Representative traces of P700 photooxidation kinetics.
Supplemental Figure S3. Photosynthetic properties of UWO 241 under various light intensities.
Supplemental Figure S4. PSI and PSII energy partitioning in cultures of UWO 241 under LS versus HS conditions.
Supplemental Figure S5. Maximum likelihood tree of all Lhca protein homologs identified in the UWO 241 transcriptome from HS-grown cultures.
Supplemental Figure S6. Functional categories of proteins up-regulated and down-regulated under high salinity in UWO 241.
Supplemental Figure S7. Heat map showing the relative changes in primary metabolite abundances in UWO 241 cultures grown under HS or LS conditions.
Supplemental Figure S8. Cellular ATP content in UWO 241 grown under low-salinity (UWO 241-LS) versus high-salinity (UWO 241-HS) growth conditions.
Supplemental Figure S9. Starch content of UWO 241 under LS and HS conditions.
Supplemental Table S1. Composition of PSI and LHCI subunits in UWO 241.
Supplemental Table S2. Down-regulated proteins in UWO 241-HS.
Supplemental Table S3. Up-regulated proteins in UWO 241-HS.
Supplemental Table S4. All positively identified primary metabolites in UWO 241.
Supplemental Table S5. Metabolites present in higher abundance in UWO 241-HS.
Supplemental Table S6. Metabolites present in lower abundance in UWO 241-HS.
ACKNOWLEDGMENTS
We thank the staff (Dr. Andor Kiss and Xiaoyun Deng) of the Center for Bioinformatics and Functional Genomics at Miami University for instrumentation and computational support. We also thank people from the Kramer Laboratory (Drs. David Kramer, Jeffrey Cruz, Robert Zegarac, and Ben Lucker) for their suggestions to set up and optimize the IDEAspec for spectroscopic measurements in UWO 241. We thank the staff at the West Coast Metabolomics Center for performing the metabolite extraction and identification.
LITERATURE CITED
Author notes
This work was supported by the National Science Foundation (grant no. 1637708 to R.M.-K. and I.K.), the U.S. Department of Energy (grant no. DE-SC0019138 to R.M.-K., I.K., and X.W. and grant no. DE-SC0019464 to J.J., W.M., and R.Z.), and the Donald Danforth Plant Science Center startup fund (to R.Z.).
Articles can be viewed without a subscription.
Senior author.
The author responsible for distribution of materials integral to the findings presented in this article in accordance with the policy described in the Instructions for Authors (www.plantphysiol.org) is: Rachael Morgan-Kiss ([email protected]).
I.K. and R.M.-K. conceived of and designed the experiments; R.M.-K. supervised the experiments; I.K. performed growth physiology, fluorescence, and Suc density gradient experiments; X.W. and J.S.Y. performed and analyzed proteome experiments; J.J. and I.K. performed the in vivo spectroscopy measurements using IDEAspec; J.J. analyzed the IDEAspec data; W.M. optimized the spectroscopy measurements using IDEAspec; R.Z. supervised and designed the spectroscopy measurements using IDEAspec; M.C. and N.H. performed and analyzed metabolome experiments; I.K. and R.M.-K. wrote the article with contributions of all the authors.
