


Abstract
Chlorophyll degradation is one of the most visible signs of leaf senescence. During senescence, chlorophyll is degraded in the multistep pheophorbide a oxygenase (PAO)/phyllobilin pathway. This pathway is tightly regulated at the transcriptional level, allowing coordinated and efficient remobilization of nitrogen toward sink organs. Using a combination of transcriptome and metabolite analyses during dark-induced senescence of Arabidopsis (Arabidopsis thaliana) mutants deficient in key steps of the PAO/phyllobilin pathway, we show an unanticipated role for one of the pathway intermediates, i.e. pheophorbide a. Both jasmonic acid-related gene expression and jasmonic acid precursors specifically accumulated in pao1, a mutant deficient in PAO. We propose that pheophorbide a, the last intact porphyrin intermediate of chlorophyll degradation and a unique pathway “bottleneck,” has been recruited as a signaling molecule of chloroplast metabolic status. Our work challenges the assumption that chlorophyll breakdown is merely a result of senescence, and proposes that the flux of pheophorbide a through the pathway acts in a feed-forward loop that remodels the nuclear transcriptome and controls the pace of chlorophyll degradation in senescing leaves.
In vascular plants, leaf senescence is a tightly regulated process that is responsible for remobilization of nutrients like nitrogen and phosphorus from source to sink organs (Hörtensteiner and Feller, 2002). Degradation of photosynthetic proteins, representing up to 70% of total leaf proteins, is coregulated with chlorophyll (chl) degradation, while carotenoids are largely retained (Kusaba et al., 2009). Chl is degraded via a cascade of coordinated enzymes leading to cleavage and export of chl catabolites to the vacuole in the form of nontoxic linear tetrapyrroles, termed “phyllobilins” (Süssenbacher et al., 2014). Because all final phyllobilins are ultimately derived from the porphyrin ring-opening activity of PHEOPHORBIDE A OXYGENASE (PAO), this pathway of chl breakdown is referred to as the PAO/phyllobilin pathway (Hörtensteiner, 2006).
Two key chlorophyll catabolic genes (CCGs) that encode the chlorophyll catabolic enzymes (CCEs) and precede the opening of the porphyrin ring of chl, i.e. the magnesium dechelating enzyme NON YELLOWING (NYE) and PHEOPHYTIN PHEOPHORBIDE HYDROLASE (PPH), hydrolyzing the phytol tail, are tightly coregulated with PAO at the transcriptional level during leaf senescence. In addition, all three CCEs were shown to physically interact (Pružinská et al., 2007; Ren et al., 2007; Aubry et al., 2008; Sakuraba et al., 2012). This regulation may allow quick metabolic channeling of potentially phototoxic chl catabolites. A model based on the apparent coordinated expression of these genes and under the control of one or a few main transcriptional regulator(s) could therefore be hypothesized. However, the mechanism underlying this transcriptional coordination remains unclear.
Senescence is a complex process integrating hormonal and environmental signals from very distinct pathways (Kim et al., 2018). Only considering CCGs, at least three distinct hormonal signals and their respective signaling pathways have been shown to interact via some of their components with CCG promoters (for a recent review, see Kuai et al., 2018). Jasmonic acid (JA), ethylene (ET), and abscisic acid (ABA) signaling pathways together with some components of the light signaling cascade have been shown to modulate CCG expression directly (Kuai et al., 2018).
In particular, JA and its derivatives are key regulators of senescence (He et al., 2002) and typically synthesized in response to insects and necrotrophic pathogens (Kim et al., 2018; Wasternack and Feussner, 2018). Levels of JA increase during natural or dark-induced senescence (Breeze et al., 2011) and ectopic methyl JA induces early senescence (Ueda and Kato, 1980). JA and associated oxylipin signaling have pleiotropic effects on the cellular fate, for example changing expression of defense genes (Hickman et al., 2017). Default JA signaling is perceived via CORONATINE-INSENSITIVE1 (COI1) that in turn degrades the transcriptional repressors JA ZIM-domain proteins (JAZ; Howe et al., 2018). For example, JAZ7 blocks MYC2 transcription factor activity that act upstream of many genes involved in dark-induced leaf senescence (Yu et al., 2016). MYC2/3/4 and their downstream targets NAC019/055/072 directly interact with NYE1, NYE2, and NYC1 promoters (Zhu et al., 2015). In a very similar manner, NAC019 and MYC2 interact with each other to synergistically upregulate NYE1 (Zhu et al., 2015). Other transcription factors involved in ET signaling (EIN3, EEL, ORE1, and ERF17) and ABA signaling (NAC016, NAC046, NAP, ABF2/3/4, ABI5) were also reported as direct interacting transcription factors of some cis-elements in CCG promoters (Kim et al., 2014; Sakuraba et al., 2014, 2016; Qiu et al., 2015; Yin et al., 2016). These multiple intertwined hormonal cues eventually lead to chlorosis, by way of degradation of chl, as a visible landmark of dark-induced, aged-induced, and also (a)biotic stress-induced senescence. Interestingly, constitutive overexpression of single CCGs in Arabidopsis (Arabidopsis thaliana) led in most cases to an acceleration of chl breakdown after senescence induction (Sakuraba et al., 2012). This suggests a feedback mechanism by which the chloroplast coordinates the rate of chl degradation during leaf senescence. The extent to which the speed of chl degradation itself could regulate the various hormonal cues and thereby inform cells about the current status of their senescing chloroplasts remains to be shown.
Here, in an attempt to identify such a link and simultaneously shed more light onto these complex regulatory networks, we used genome-wide transcriptome analysis of CCG mutants during early dark-induced senescence. By combining these data with metabolite profiling, we aimed to understand processes that regulate the dynamics of the production of chl catabolites in the PAO/phyllobilin pathway and the extent to which accumulation of pathway intermediates remodel nuclear gene expression, and more precisely the JA response.
Based on our data, we propose a model where transient accumulation of the intermediate pheophorbide (pheide) a acts as a sensor for the rate of chl degradation, and thereby regulates the speed of leaf senescence tuned by JA signaling. This model highlights a new function for the PAO/phyllobilin pathway of chl breakdown, not only as an irreversible prerequisite to senescence-driven nitrogen remobilization, but also as a sensing mechanism of the stress status of the chloroplast.
RESULTS
Coordinated Variations of the Leaf Transcriptome During Dark-Induced Senescence
The extent of variations in gene expression during dark incubation of detached leaves (DET) was assessed using RNA sequencing (RNA-seq). Mature leaf number eight (see “Materials and Methods”) was sampled in triplicate at 0 and 2 d in the dark (dd). Using these time points allowed us to profile early events of the senescence program before any distinct visible phenotype (Fig. 1A).
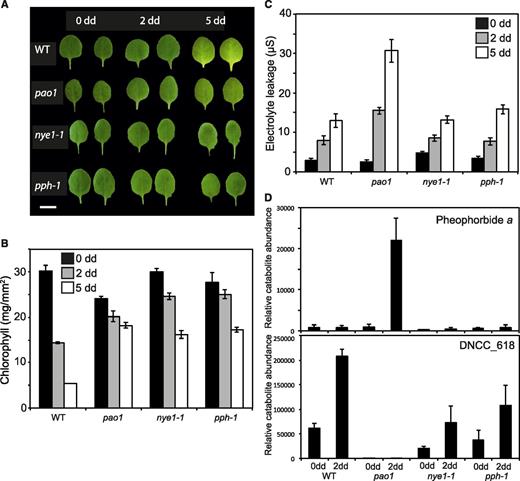
Phenotypic characterization of CCGs mutants during dark-induced senescence of detached leaves. A, Wild-type (WT), pao1, nye1-1, and pph-1 detached leaves before (0) and after 2 and 5 dd. Images of leaves were digitally abstracted and used to make a composite image for comparison. Scale bar = 5 mm. B, Chl degradation of CCG mutants during dark-induced senescence. C, Electrolyte leakage of CCG mutants during dark-induced senescence. D, Profile of the accumulation of pheophorbide a and the major phyllobilin (DNCC_618) in CCG mutants during dark-induced senescence. Data in (B) to (D) are mean values of a representative experiment with three (B), at least 10 (C), and five (D) replicates, respectively. Error bars indicate sd.
In wild-type leaf, a total of 21,403 genes were detected (genes with normalized counts ≥ 1 in at least one of the samples), among these 6,124 (29% of detected) genes were considered as being differentially expressed during DET (after applying the EBSeq [http://www.bioconductor.org/packages//2.13/bioc/html/EBSeq.html] test using a posterior probability of differential expression ≥0.95 and a minimum fold change [FC] of two times). Of these, 3,389 genes were upregulated after dark treatment (Table 1). In an analogous experiment on Arabidopsis leaf senescence using microarrays, 2,153 genes were differentially expressed between 0 and 2 dd, of which 65% (1,353) were common to our dataset (Supplemental Fig. S1; van der Graaff et al., 2006). Another microarray-based analysis of the transcriptome during natural leaf senescence in Arabidopsis showed perturbation in 6,370 genes, of which 2,825 (44%) were common to our differentially expressed genes (Supplemental Fig. S1; Breeze et al., 2011). These results show the biological relevance of our data. The differences observed are likely due to the biases associated with different techniques used to induce senescence. A relatively high number of genes have been shown to be similarly expressed when comparing different methods of senescence induction, such as DET, dark incubation of attached leaves, and natural senescence (van der Graaff et al., 2006).
Number of genes differentially expressed during dark incubation of DET in wild type and three CCG mutant lines
A total of 25,920 genes were detected in at least one of the 24 samples. PPDE, posterior probability of differential expression.
| Total Transcripts Detected (Non Zero) | 21,403 | ||
|---|---|---|---|
| Differentially Expressed during DET (PPDE ≥ 0.95 and FC ≥ 2) | Total | Upregulated | Downregulated |
| Wild type | 6,124 | 3,389 | 2,735 |
| nye1-1 | 6,227 | 3,325 | 2,902 |
| pph-1 | 6,764 | 3,777 | 2,987 |
| pao1 | 11,408 | 5,723 | 5,685 |
Disruption of Specific CCGs Modifies Phyllobilin Accumulation that Leads to Distinct Stay-Green Phenotypes
To determine the extent to which the disruption of the PAO/phyllobilin pathway influences the global leaf senescence process, we analyzed three mutants that are defective in this pathway: nye1-1, pph-1, and pao1, and analyzed senescence of detached leaves after dark incubation (Pružinská et al., 2003; Ren et al., 2007; Schelbert et al., 2009). After 2 dd, chl was retained in these lines (Fig. 1, A and B). Noteworthy, pao1 contained slightly less chl before dark incubation (0 dd) in comparison to wild type (Fig. 1B). In addition to chl retention, pao1 accumulated pheide a during dark incubation and exhibited a light-independent cell death (LICD) phenotype (Pružinská et al., 2003; Hirashima et al., 2009), as deduced from a gradual increase in electrolyte leakage of pao1 leaf tissue in the dark (Fig. 1C). The molecular basis of LICD in this line is unclear, but this phenotype is specific to pao1, and may to some extent be linked to pheide a accumulation (Fig. 1D; Supplemental Fig. S2; Hirashima et al., 2009). Absence of PAO in pao1 led to a complete halt of the PAO/phyllobilin pathway with virtually no phyllobilin accumulation (Fig. 1D). By contrast, nye1-1 and pph-1 accumulated the major phyllobilins of Arabidopsis to approximately one-third of the wild-type level after 2 d of dark treatment but virtually no pheide a (Fig. 1D; Christ et al., 2013).
Stopping the PAO/phyllobilin pathway artificially at various levels seems to imply largely distinct phenotypic modifications. On the top of its relatively well-described implication on nitrogen remobilization (mostly due to photosystem degradation), the control of chl catabolite homeostasis within the degradation pathway is a potentially overlooked signal that may inform the cell about the status of chloroplast integrity or metabolism.
Transcriptome Analysis of CCG Mutants Gives Insight Into Molecular Bases of Phenotypic Variations Observed in the Dark
Analysis of the wild-type transcriptome signature using gene-ontology (GO) terms revealed that photosynthesis, starch metabolism, glucosinolates, tetrapyrrole synthesis, and redox terms were underrepresented during DET (Fig. 2A), while terms gathering genes involved in lipid, amino acid, and protein degradation but, more interestingly, also micro-RNA, retrotransposons, and the bZIP family of transcription factors were overrepresented during senescence (Fig. 2A). This is consistent with described major gene expression changes during leaf senescence (van der Graaff et al., 2006; Breeze et al., 2011).
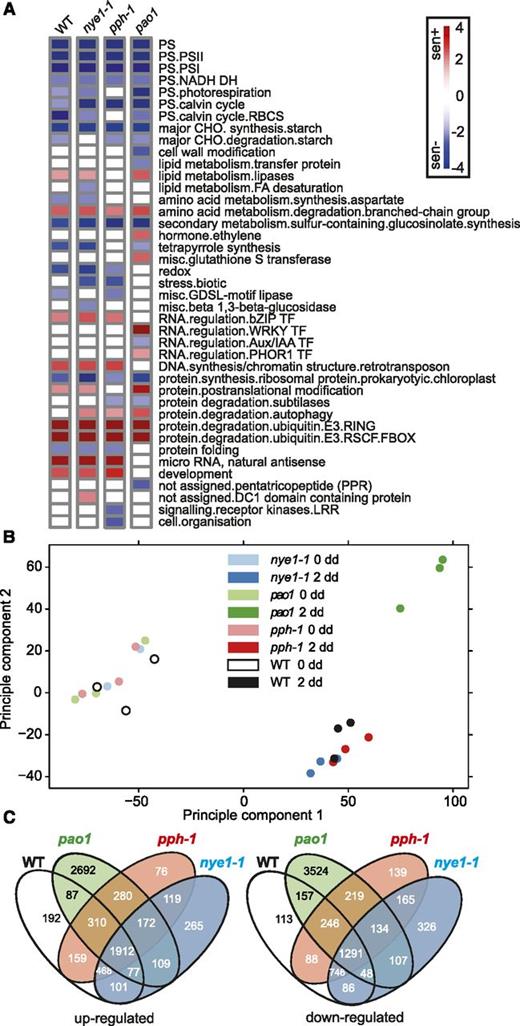
RNA-seq profiling of CCG mutants provide new insight into the relationship of the PAO/phyllobilin pathway to global leaf senescence. A, Major enriched GO terms identified in the three CCG mutants during dark-induced senescence (0 versus 2 dd) using the Wilcoxon test implemented within the program Pageman (Usadel et al., 2006). B, Principal component analysis of the RNA-seq data. C, Venn diagrams showing common patterns of differential expression (0 versus 2 dd) of up- and downregulated genes during dark-induced senescence. WT, wild type.
We then assessed alterations in the leaf transcriptome during DET in all three mutants (Supplemental Dataset S1). In nye1-1 and pph-1, 6,227 and 6,764 genes were differentially expressed between 0 and 2 dd, respectively, numbers that were comparable to the changes observed in wild type (Table 1). By contrast, approximately twice as many genes (11,408) were differentially expressed in pao1 during DET (Table 1). To detect variations in gene expression that were specific to mutations of one or several of the CCGs, genes differentially expressed during DET in every line were compared (Fig. 2, B and C). A total of 2,692 and 3,524 genes, respectively, was specifically down- and upregulated in pao1, while for pph-1 (76 and 139 genes, respectively) and nye1-1 (265 and 326 genes, respectively) these numbers were much smaller (Fig. 2C). A core set of 3,203 genes (1,912 up- and 1,291 downregulated) showed similar patterns of expression in all four lines. The most enriched genes among these were genes involved in catabolic processes, senescence, aging, and autophagy, while genes involved in chloroplast and various photosynthesis-related processes were the most repressed ones (Supplemental Dataset S2). Analysis of GO term enrichment showed that altered genes showing a very similar pattern in all four lines included genes involved in photosynthesis, starch metabolism, and glucosinolate synthesis (downregulated) as well as protein and amino acid degradation (upregulated; Fig. 2A). Collectively, this indicated that mutations in any of the three CCGs, despite clear phenotypic differences in these lines, had little effect on general background senescence processes.
Most of the genes whose expression specifically changed in pao1 while remaining unchanged in all other lines belonged to GO terms related to ET and WRKY and PHOR1 transcriptional regulators (Fig. 2A). Among GO terms that were substantially enriched in pao1, categories of genes involved in various stresses were the most enriched ones: these include response to stress, stimulus, chitin, carbohydrate, and chemical stimuli as well as genes involved in posttranscriptional processes (Supplemental Dataset S2).
Thirty-six of the 50 most highly expressed genes after 2 dd were different between pao1 and wild type (Supplemental Dataset S3), among them, PLEIOTROPIC DRUG RESISTANCE12/ABCG40, involved in ABA transport (Kang et al., 2010), LIPOXYGENASE1 (LOX2) involved in JA synthesis (Wasternack and Feussner, 2018), and NYE1. Taken together our data suggest major remodeling of gene expression in pao1 leaves upon dark incubation, while absence of NYE1 or PPH only mildly affects the senescence leaf transcriptome, at least at an early stage of senescence.
The PAO/Phyllobilin Pathway Is Mainly Regulated at the Transcriptional Level
Most of the core CCGs like PAO, PPH, and NYE1, as well as genes encoding some catabolite-modifying enzymes, i.e. METHYLESTERASE16 (MES16) and CYTOCHROME P450 MONOOXYGENASE89A9 (CYP89A9) were transcriptionally upregulated during DET in wild type (Fig. 3; Supplemental Dataset S1; Sakuraba et al., 2012). In all four lines studied, genes encoding enzymes involved in the oxidative half of the chl cycle, namely CHLOROPHYLL A OXYGENASE and CHLOROPHYLL SYNTHASE, were downregulated, whereas genes involved in chl b to chl a conversion (NYC1 and NOL) were upregulated. This is consistent with the assumption that conversion of chl b to chl a is a prerequisite for chl degradation (Sakuraba et al., 2010). Noteworthy, expression of red chlorophyll catabolite reductase was repressed during DET and, thus, not associated with the expression of PAO or of any of its proposed interacting partners (Fig. 3; Sakuraba et al., 2012). Except for a slight decrease in HCAR, nye1-1 and pph-1 did not exhibit substantial differences in CCG expression compared to wild type. By contrast, major changes were observed in pao1 with strong overexpression of NYE1 and NYC1 (but not NOL) and downregulation of CHLOROPHYLL A OXYGENASE and HCAR, suggesting a “feed-forward” regulation of the catabolic pathway.
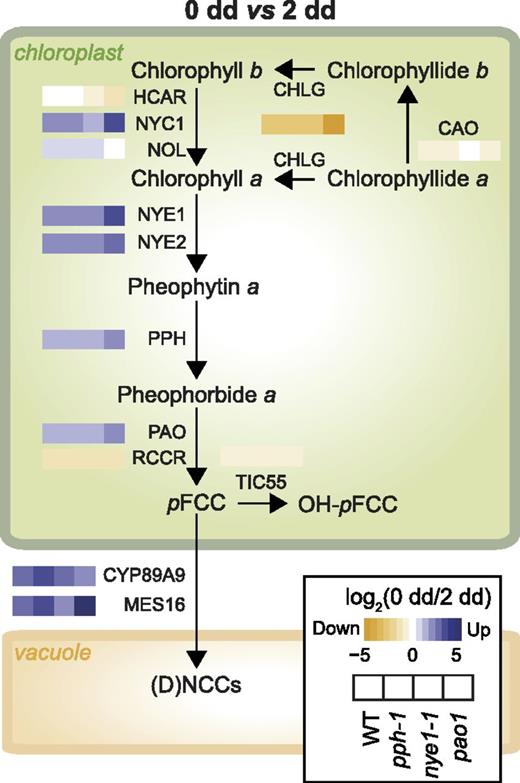
Influence of dark-induced senescence on the expression of the genes involved in the PAO/phyllobilin pathway. Heat maps represent log2 (FC) of gene expression in each of the four studied lines during dark-induced senescence, as indicated in the inset box. Genes/enzymes: CAO, chlorophyll a oxygenase; CHLG, chlorophyll synthase; HCAR, 7-hydroxymethyl chlorophyll a reductase; NOL, NYC1-like; NYC1, nonyellow coloring1 (chlorophyll b reductase); RCCR, RCC reductase; TIC55, translocon at the inner chloroplast envelope55. Phyllobilins: DNCC, dioxobilin-type NCC; NCC, nonfluorescent chlorophyll catabolite; pFCC, primary fluorescent chlorophyll catabolite. WT, wild type.
The PAO/Phyllobilin Pathway Is Controlled by Multiple Intertwined Signaling Pathways
To evaluate the impact of CCG mutations on upstream regulators of the pathway, we extracted expression data for signaling pathways involving JA, ET, ABA, and light signaling in all four lines as described in Kuai et al. (2018) and Figure 4. Out of the 41 genes represented here that are key genes involved in these hormonal pathways, only JAZ10 was substantially downregulated in pao1 as compared to wild type (none in pph-1 or nye1-1; Supplemental Dataset 4), suggesting only minor function of the hormonal cues before dark incubation. Expression of genes involved in ET and ABA signaling was mostly upregulated in all lines during dark-induced senescence. The most striking difference between pao1 and all other three lines was the pattern of expression of genes involved in JA signaling: COI1 expression was substantially increased during dark treatment in wild type, pph-1 and nye1-1, but not in pao1, while nine of the 12 JAZ proteins showed an inverse pattern of expression. Intriguingly, among the very few genes differentially expressed after dark treatment in both nye1-1 and pph-1, a subset of JAZ genes, namely JAZ1, JAZ5, JAZ7, JAZ8, and JAZ10, were substantially downregulated compared to wild type (Supplemental Dataset S1).
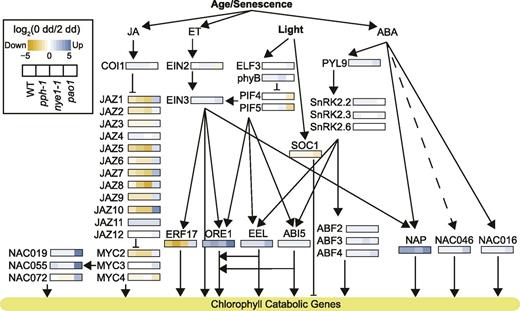
Transcriptional regulation of the PAO/phyllobilin pathway during dark-induced senescence is mainly affected in pao1. Heat maps represent log2 (FC) of gene expression in each of the four studied lines during dark-induced senescence, as indicated in the inset box. Genes/enzymes: ABF, ABA-responsive element binding factor; ABI5, ABA insensitive5; COI1, coronatine insensitive1; EEL, enhance em level; EIN, ethylene insensitive; ELF3, early flowering3; ERF17, ethylene response factor17; MYC, myelocytomastosis; NAC, NAM, ATAF1/2, and CUC2 domain protein; NAP, NAC-like, activated by PA3/PI; ORE1, oresara1; phyB, phytochrome B; PIF, phytochrome interacting factor; PYL9, pyrabactin resistance1-like9; SnRK2, Ser/Thr kinase2; SOC1, suppressor of overexpression of coi1. WT, wild type.
It also appears that expression of transcription factors that are repressed by JAZ proteins like MYC2/3 and downstream factors like NAC019/055 and 072 were also upregulated exclusively in pao1 at 2 dd (Fig. 4).
Accumulation of Pheide a in pao1 Modifies JA-Related Signaling
Having noticed strong variations of JA-related gene expression in pao1 after dark incubation, we analyzed whether JA synthesis and levels of JA metabolites were also modified in this line. To this end, JA precursors (12-OPDA, dn-OPDA, OPC-6, and OPC-4) as well as JA and some of its derivatives (JA-Val, JA-Ile, JA-Leu, 12OH-JA-Ile, 12COOH-JA-Ile, 12O-Glc-JA, and 12HSO4-JA) were quantified in both wild type and pao1 (Fig. 5; Supplemental Dataset S5). JA levels were not increased in wild type during dark incubation, but in pao1, JA accumulated with an order-of-magnitude higher, i.e. up to 2 nmol g−1 fresh weight (Fig. 5; Supplemental Dataset S5). Levels of endogenous JA after dark treatment have been shown to increase in wild type (Seltmann et al., 2010a) and are regulated under strong circadian control (Goodspeed et al., 2012). However, this does not necessarily trigger JA-signaling pathways (Seltmann et al., 2010b). In pao1, not only were JA levels dramatically increased, but also downstream metabolites, i.e. JA-Val, JA-Leu, 12OH-JA-Ile, and the active phytohormone JA-Ile (Fig. 5; Supplemental Dataset S5). Genes involved in JA biosynthesis (LOX2, AOC1, AOC2, and OPR3) and degradation (CYP94B1 and CYP94B3) were also strongly upregulated in pao1. Interestingly, expression of JMT and JAR1 were unchanged in both lines.
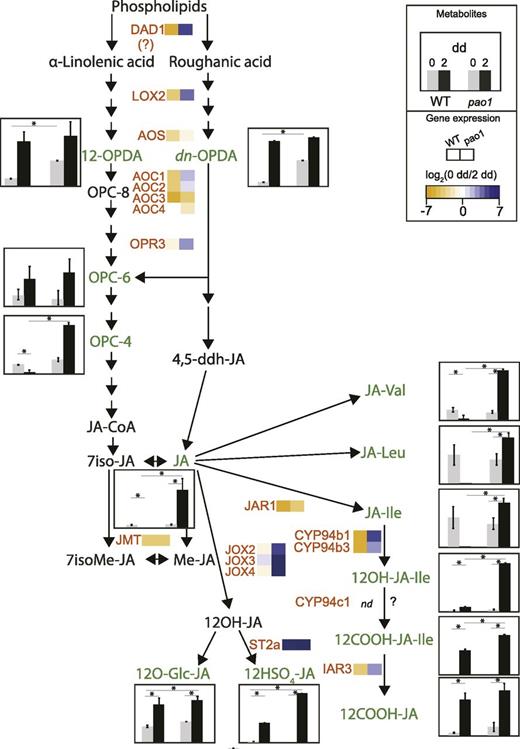
JA metabolism during dark-induced senescence in wild type (WT) and pao1. Levels of JA and JA-related metabolites in gray (0 dd) and black (2 dd) for wild type and pao1 are shown as histograms, as indicated in the inset box. Data are mean values of five replicates. Error bars indicate sd. Asterisks indicate significant differences (by one-sided t test with P ≤ 0.05). Expression levels are shown using heat maps of log2 (FC), as indicated in the inset box. Genes/enzymes (in red): AOC, allene oxide cyclase; AOS, allene oxide synthase; CYP, cytochrome P450 monooxygenase; DAD1, delayed anther dehiscence1; IAR3, IAA-Ala resistant3; JAR1, JA-amino acid synthetase1; JMT, jasmonate methyltransferase; JOX, JA-induced oxygenase; OPR3, OPDA reductase 3; ST2a, sulfotransferase 2a. Metabolites that were quantified (in green): dn-OPDA, dinor-12-oxo-phytodienoic acid; JA-Ile, jasmonyl-Ile; JA-Leu, jasmonyl-Leu; JA-Val, jasmonyl-Val; OPC-4, 3-oxo-2-cis-2-pentenyl-cyclopentane-tetranoic acid; OPC-6, 3-oxo-2-cis-2-pentenyl-cyclopentane-hexanoic acid; OPDA, 12-oxo-phytodienoic acid; 12COOH-JA, 12-carboxy-jasmonic acid; 12COOH-JA-Ile, 12-carboxy-jasmonyl-Ile; 12HSO4-JA, 12-sulfo-jasmonic acid; 12O-Gly-JA, 12-glycosyl-jasmonic acid; 12OH-JA-Ile, 12-hydroxy-jasmonyl-Ile. Further metabolites (in black): JA-CoA, jasmonyl-coenzyme A; Me-JA, methyl-jasmonic acid; OPC-8, 3-oxo-2-cis-2-pentenyl-cyclopentane-octanoic acid; 4,5ddh-JA, 4,5-didehydro-jasmonic acid; 7iso-JA, 7-iso-jasmonic acid; 7isoMe-JA, 7-isomethyl-jasmonic acid; 12OH-JA, 12-hydroxy-jasmonic acid.
To investigate possible deleterious effects of an accumulation of pheophorbide a on chloroplast membrane integrity, we quantified fatty acids and their peroxidation products (oxylipins, i.e. oxidized derivatives of polyunsaturated fatty acids) in wild type and pao1 during the first 48 h of dark incubation (Supplemental Fig. S3; Göbel and Feussner, 2009). Despite a significant increase in ion leakage in pao1 compared to wild type after 2 dd, only a nonsignificant trend toward some reduction of esterified fatty acids and accumulation of oxidized fatty acids in pao1 could be observed. Nevertheless, a possible involvement of some membrane damage in the JA response cannot entirely be ruled out. Taken together, these data show a complex rewiring of the JA signaling pathway and indicate a link between the pao1 phenotype and JA responses. Next, we tried to decipher the exact extent of this feedback using patterns of gene coexpression.
Co-Expression Analysis Reveals Structure of Regulatory Networks of the PAO/Phyllobilin Pathway
To further characterize a possible link between the PAO/phyllobilin pathway and JA signaling, we computed the genome-wide expression data for all four lines studied and tried to decipher coexpression patterns underpinning relevant gene networks. The basic assumption was that genes that show a similar pattern of expression during DET and/or in various genetic backgrounds could be involved in a similar process and most probably share similar regulating pathways. We used Weighted Genome Coexpression Network Analysis (WGCNA; Zhao et al., 2010) to perform comparative analysis of gene coexpressed modules among darkness treatment in all four lines. Genes were clustered in 16 coexpression modules, each harboring genes that generally showed a similar pattern of expression across genetic backgrounds and treatment (Fig. 6A; Supplemental Fig. S4). Three modules (blue, pink, and yellow) were highly associated with the darkness treatment. The pink and yellow modules contained genes that showed consistent changes in expression during dark incubation in all four lines, but not the blue motif that did not associate to pao1 after 2 dd (Fig. 6B). Modules were subsequently characterized using GO term enrichment (Fig. 6B; Supplemental Dataset S6). All three motifs were enriched in terms related to mRNA catabolic process, fatty acid catabolism, senescence, and autophagy (Supplemental Dataset S6). Red, black, and green modules that mostly associated with pao1 after dark incubation were enriched in terms representing various responses to stress as well as hormonal response (namely ET, JA, and ABA responses; Supplemental Dataset S6). Interestingly, PPH is the hub gene. i.e. the most highly connected gene in this module (Langfelder and Horvath, 2008), of the blue module that contains most CCGs (PAO, CYP89A9, PPH, NYE2; Fig. 6C). This module may gather conserved elements of the response to darkness. Finally, networks of genes neighboring expression for CCGs and known transcriptional regulators of the PAO/phyllobilin pathway (as in Fig. 4) were extracted and their respective position in the networks visualized (in Fig. 6C, for the sake of clarity, only the three most associated genes are shown). Surprisingly, not all CCGs were coexpressed in a unique cluster, and not necessarily with the predicted pathway they were shown to interact with (Fig. 6C). For example, MYC2/3/4 and JAZ genes were scattered across various modules, whereas genes involved in ET signaling (EIN2, EIN3, and ERF17) were mostly grouped within the blue module. As shown before (Hickman et al., 2017), differences in the networks of JA-related genes may be explained by the interplay among several factors that are linked to the treatment and genotypes used here and that are thus represented in these data, i.e. dark treatment, pheide a, and JA.
![WGCNA sheds new light on the regulation of the PAO/phyllobilin pathway. A, Heat map showing a module-sample association matrix. Each row corresponds to a module. The heat map color code from blue to red (see inset box) indicates the correlation coefficient between the module (first column) and either the treatment (second column = darkness) or the genetic background (wild type [WT], nye1-1, pph-1 or pao1). B, Patterns of gene expression (left) and size (i.e. number of genes; right) of gene coexpression modules. On the left, heat maps indicate mean expression (log2 [FC]) of the 10% most representative genes (highest connectivity) for each WGCNA module during dark-induced senescence. N/A, not applicable. C, The regulatory network of the PAO/phyllobilin pathway as exported from WGCNA and visualized in VisANT 5.51 (Hu et al., 2007). Larger nodes show the input genes (CCGs, transcriptional regulators according to Fig. 4). Smaller nodes were limited to the top three most connected genes for each input gene. The edges represent connections between the genes. Node colors represent the module in which the genes clustered during WGCNA analysis.](https://oup.silverchair-cdn.com/oup/backfile/Content_public/Journal/plphys/182/2/10.1104_pp.19.01115/2/m_plphys_v182_2_776_f6.jpeg?Expires=1747905917&Signature=ySvnQSiG7almwuYb9qIZBFxmi7FLT2NFskDyzoFc~BSgRn-QgdLHAQDww6KAxF7N7K5R9oX0ii595UAAMP1tKCysz8~305AafBjAQSSHwVVZ1ZwDgFzt13JdC0kPAXTh-3o07sB4VqV5mdcvpAEA57-jRyCrD9Gcy699mx0uSj03n3umXaYBrPKGDyUzA-sGk~AsQgXxxmevAoaj9SM36BJuWKQdH6L0wdm~dQdnGs0h0kGvBF93oopAF26N2bydMxVZKv-J5HbOzDjUkt7TuEY7NSOnFYKNQ6waNXkUBDJqjrvEQjce7-7sDJowh4HIX0SK2LsVKQLOXyndeQBZtg__&Key-Pair-Id=APKAIE5G5CRDK6RD3PGA)
WGCNA sheds new light on the regulation of the PAO/phyllobilin pathway. A, Heat map showing a module-sample association matrix. Each row corresponds to a module. The heat map color code from blue to red (see inset box) indicates the correlation coefficient between the module (first column) and either the treatment (second column = darkness) or the genetic background (wild type [WT], nye1-1, pph-1 or pao1). B, Patterns of gene expression (left) and size (i.e. number of genes; right) of gene coexpression modules. On the left, heat maps indicate mean expression (log2 [FC]) of the 10% most representative genes (highest connectivity) for each WGCNA module during dark-induced senescence. N/A, not applicable. C, The regulatory network of the PAO/phyllobilin pathway as exported from WGCNA and visualized in VisANT 5.51 (Hu et al., 2007). Larger nodes show the input genes (CCGs, transcriptional regulators according to Fig. 4). Smaller nodes were limited to the top three most connected genes for each input gene. The edges represent connections between the genes. Node colors represent the module in which the genes clustered during WGCNA analysis.
Validation of the clustering approach can be seen, for example, by the fact that NAC019, NAC055, and NAC072, clustering closely together, have already been shown to be homologs (Zheng et al., 2012). Similarly, ORE1 and ANAC046 are closely related, but act in distinct clusters, suggesting a distinct regulation mechanism as shown recently (Park et al., 2018). The WGCNA approach can also be a fruitful approach to identify new candidates in the PAO/phyllobilin pathway, like for example phytanoyl-CoA 2-hydrolase (phyH) that was suggested to be involved in phytol chain degradation (Araújo et al., 2011) and clustered within the yellow module with MES16 and NYC1. Taken together, the coexpression data suggest that the PAO/phyllobilin pathway is regulated by multiple layers of transcriptional factors. This approach may help in deciphering multiple gene networks involved in the regulation of chl degradation that are tightly associated with developmental cues, nitrogen levels, and biotic and abiotic stresses. Further work is necessary to confirm the relative influence of each of these clusters.
DISCUSSION
We have shown that the PAO/phyllobilin pathway is mostly regulated at the transcriptional level during dark-induced senescence. A tight control of the expression of genes involved in this pathway is necessary to prevent possible oxidative damage due to a release of toxic tetrapyrrole breakdown intermediates. By genetically modulating the homeostasis of chl catabolites, we unraveled a retrograde signaling function for the PAO/phyllobilin pathway that uses JA-signaling to coordinate chloroplasts and the nucleus during dark-induced senescence.
Pheide a Is a Key Signaling Molecule of Chloroplast Function
The pao1 mutant had originally been identified in a screen for lines that show abnormal response to pathogens by accelerated severe cell death (Greenberg and Ausubel, 1993). The basis of this light-dependent cell death phenotype is relatively well understood (Yang et al., 2004; Pružinská et al., 2005). Pheide a phototoxicity is even observable in mammalian systems (Jonker et al., 2002). However, another peculiar feature of pao1 is an LICD phenotype, whose underlying molecular basis is still unclear (Hirashima et al., 2009; Fig. 1C). Two hypotheses were proposed to explain cell death caused by pheide a accumulation in the dark: It may act directly on chloroplast membrane integrity (via lipid peroxidation or increased oxidative stress levels) or it may itself be a signaling molecule regulating cell death. The acd2-2 mutant that is deficient in the next committed step of the PAO/phyllobilin pathway, i.e. red chlorophyll catabolite reductase, accumulates red chlorophyll catabolite (RCC), a linear tetrapyrrole. Surprisingly, although RCC is phototoxic like pheide a, acd2-2 is exclusively affected in a light-dependent manner (Supplemental Fig. S5; Greenberg et al., 1994; Pružinská et al., 2007). The main difference is that pheide a, unlike RCC, is likely trapped within the chloroplast. Indeed, mis-targeting of the cytosolic phyllobilin-modifying enzyme MES16 into the chloroplast in a pao1 background revealed that in vivo pheide a is not a substrate for MES16. It can, therefore, be concluded that pheide a is unlikely to be released from the chloroplast (Christ et al., 2012), in contrast to RCC, which has been shown to (partially) localize to the vacuole (Pružinská et al., 2007).
Independent of the exact molecular basis underlying LICD in pao1, pheide a appears to have two specific properties: it is a metabolic “bottleneck” of degradation, i.e. once formed, chl molecules must be irreversibly degraded further; and it exhibits certain light-independent bioactive properties that act on chloroplast homeostasis. These two features render pheide a a very good candidate compound for sensing the rate at which chl is degraded, not only in the context of (natural/induced) senescence, but also during the pathogen-induced hypersensitive response (Mur et al., 2010). Sensing the rate at which chl is degraded is essential to coordinate various senescence processes such as nitrogen remobilization (Hörtensteiner and Feller, 2002). Taking advantage of our large dataset, we propose a model of how pheide a-dependent signaling possibly works.
Pheide a Metabolism Underpins a Specific JA Response
Absence of PAO during dark incubation and the concomitant accumulation of pheide a seem to be characterized by enhanced gene expression of most of the genes from JA synthesis and signaling pathways, as well as by an increase in JA and many of its derivatives. One common feature among the CCG mutant lines studied here is the variation of levels/flux of pheide a: lower amounts in nye1-1/pph-1 (formation blocked by up-stream mutations) versus higher amounts (further degradation blocked) in pao1. We propose a model in which the quantity of pheide a that accumulates in/flows through the PAO/phyllobilin pathway at a defined time may act as a signal that triggers a specific JA response (Fig. 7).
![Model illustrating the influence of pheophorbide a homeostasis on JA signaling. The middle (wild type [WT]) shows the PAO/phyllobilin pathway under normal senescence conditions, leading to the complete degradation of chl to vacuole-localized phyllobilins. Left and right show modulation of catabolite homeostasis caused by mutations of either nye1-1 or pph-1 (left) or pao1 (right), and the respective observed downstream modulation of the JA response (dashed arrows). Arrow sizes schematically represent relative flux (metabolite) and response (JA signaling) intensities. Among the few genes differentially expressed in nye1-1 and pph-1, jasmonate-ZIM domain genes were downregulated compared to wild type. On the other hand, in pao1, JA biosynthesis and signaling genes as well as some JA bioactive derivatives were induced. DNCC, dioxobilin-type nonfluorescent chlorophyll catabolite; NCC, nonfluorescent chlorophyll catabolite; pFCC, primary fluorescent chlorophyll catabolite.](https://oup.silverchair-cdn.com/oup/backfile/Content_public/Journal/plphys/182/2/10.1104_pp.19.01115/2/m_plphys_v182_2_776_f7.jpeg?Expires=1747905917&Signature=dL~gYT~gefKxL9YSGmPA5w6kGyqT8p9kcIt6gG0B-FIRtddYk2ywdPpXZGIGCWWT7wVgOx4ahMUWlokOaTy~LcGkKg15KhQWgHcvSwQyCe2wLz5ffGofDVSZoNxcNa7VwlLXGy2K0egPbH4SmI17FgRatDMdu0qnbhOIzR7sFVAlu-tNNeIllShfci5Qmjx7oQGCOl688Tnybrg8CbghwFc4k6w72LAZ1-SKeXHt57zE--oXny6unCMBb41iB6dwCR6wkk-EP6AQy7xz2cEaFStUgVO2ZBPtjm9dgrr5wNorGxZMW7Ds7KJR5TNGQv0cGha-5M6XdaDO94T-iNhsWA__&Key-Pair-Id=APKAIE5G5CRDK6RD3PGA)
Model illustrating the influence of pheophorbide a homeostasis on JA signaling. The middle (wild type [WT]) shows the PAO/phyllobilin pathway under normal senescence conditions, leading to the complete degradation of chl to vacuole-localized phyllobilins. Left and right show modulation of catabolite homeostasis caused by mutations of either nye1-1 or pph-1 (left) or pao1 (right), and the respective observed downstream modulation of the JA response (dashed arrows). Arrow sizes schematically represent relative flux (metabolite) and response (JA signaling) intensities. Among the few genes differentially expressed in nye1-1 and pph-1, jasmonate-ZIM domain genes were downregulated compared to wild type. On the other hand, in pao1, JA biosynthesis and signaling genes as well as some JA bioactive derivatives were induced. DNCC, dioxobilin-type nonfluorescent chlorophyll catabolite; NCC, nonfluorescent chlorophyll catabolite; pFCC, primary fluorescent chlorophyll catabolite.
Noteworthy, JA levels increase during dark-induced senescence in wild-type plants, but this is not necessarily followed by a coordinated JA response (Seltmann et al., 2010b). Prolonged darkness treatment is thought to induce degradation of chloroplast membranes and leads to an increase in lipid β-oxidation (Seltmann et al., 2010a). Breakdown of membrane lipids leads to a considerable increase in free α-linolenic acid, a precursor of JA. However, in pao1, even if the extent remains unknown to which dark-dependent pheide a accumulation may damage chloroplast membranes, we could observe a massive increase of JA, way above the levels of wild type, and a change in most genes associated with the JA response. All these elements are strongly indicative of a fully coordinated and transduced JA response. This response is partially similar to JA responses observed during defense processes against insects, necrotrophic pathogens, or ozone stress (Howe et al., 2018). It is important to note, however, that increase in LOX expression resulting in increased LOX activity might in itself be sufficient to increase lipid peroxidation and changes in α-linolenic acid availability and modulate oxidative stress that in turn would deteriorate chloroplast homeostasis (Wasternack, 2014; Mata-Pérez et al., 2015; Wasternack and Feussner, 2018). To control for the status of lipid peroxidation, we quantified the dynamics of accumulation of major fatty acids and oxylipins (oxidized derivatives of polyunsaturated fatty acids) during a time course of dark incubation (Supplemental Fig. S3). No significant differences in the pattern of oxylipin accumulation could be observed in pao1 as compared to wild type, indicating a similar level of chloroplast membrane disintegration in pao1 and wild type (Berger et al., 2001). Noteworthy, monitoring of ion leakage in dark-incubated leaves seems to indicate that JA responses are an early element of the complex pao1 leaf response in the dark and that part of the late phenotype observed is due to subsequent membrane damages, most likely as a secondary consequence of pheide a accumulation. The specificity of the JA response relative to most other fatty acid derivatives (especially hydroxy and hydroperoxy fatty acids) strongly suggests that chloroplast membranes in pao1 undergo “normal” dark-induced degradation, at least at this early stage of dark-induced senescence (here 2 dd). In other words, the JA response observed in pao1 may not be a consequence of a major disruption of chloroplast membranes but more likely a coordinated response to pheide a. In addition, we observed in pao1 a massive increase of JA and its active compound JA-Ile, way above the levels of wild type, and a change in most genes associated with the JA response. All these elements are strongly indicative of a fully coordinated and transduced JA response. The pheide a-dependent JA response could also be differentiated across the CCG mutants studied here, depending on their level of impairment in the pathway. Indeed, expression of several JAZ genes was reversed in pao1 as compared to nye1-1/pph-1 (Fig. 4). Simultaneous increase in JAZ expression and JA accumulation might be indicative of a heavy transduction load of the pathway (i.e. JAZ degradation by SCFCOI1) making new synthesis of JAZ transcriptional inhibitors necessary.
The coexpression patterns of the JA signaling networks confirm that some of the JA signaling elements were coexpressed with various CCGs, but also illustrate the underlying complexity of the JA response (Fig. 6; Hickman et al., 2017). For example, not all MYC2 target genes are triggered in the same manner after pheide a accumulation: The defensin gene PDF1.2 (At5g44420), a known marker of ET and JA (Lorrain et al., 2003), or VSP1 (At5g24780), induced by wounding and JA, were not differentially expressed in any of the CCG mutants, whereas PR4 (At3g04720), a pathogenesis-related gene, was substantially overexpressed during dark incubation in pao1 exclusively. Further studies deciphering the various interacting subnetworks involved in the JA response upon developmental and various pathogenic cues will be needed to possibly explain these discrepancies.
Several independent pieces of evidence point toward an effect of chl degradation on JA signaling. For example, NYE mutants are less sensitive to pathogens and have a reduced JA response compared to wild type (Mecey et al., 2011). Thus, preventing chl catabolites from metabolisis in the pathway by mutating NYE can apparently have some protective effect. Interestingly, pxa1, a mutant impaired in a peroxisomal ABC transporter essential for fatty acid degradation, accumulates α-linolenic acid and pheide a during extended darkness (Kunz et al., 2009; Nyathi et al., 2010). This further supports the idea of an intricate link among chloroplast membrane integrity, levels of pheide a, and JA signaling.
Pheide a Signaling: Another Porphyrin-Based Retrograde Signal?
Tetrapyrrole intermediates, like Mg-protoporphyrin IX or heme, have been long suggested to be involved in plastid-to-nucleus retrograde signaling (Chi et al., 2013). Coordination of chloroplast function with nuclear genome expression is equally important during early developmental stages as during senescence. Interestingly, hy1-101 (also referred to as gun2), a mutant deficient in HEME OXYGENASE1 that catalyzes heme degradation into biliverdin IX as a key step for phytochrome chromophore biosynthesis, constitutively accumulates high amounts of JA and high levels of JA-responsive genes (Zhai et al., 2007). Deficiency in HEME OXYGENASE1 leads to the accumulation in the chloroplast of protoporphyrin IX, a circular porphyrin with a structure similar to pheide a. It remains to be shown to what extent this phenotype is similar to the one observed in pao1 and whether porphyrin-induced JA responses could be effectively coordinated signaling mechanisms, by which the status of the chloroplast can be further transduced to the nucleus during both synthesis and degradation of chl (Lin et al., 2016).
CONCLUSION
Taken together, our data show that the homeostasis of chl derivatives in the PAO/phyllobilin pathway impacts leaf metabolism; specifically, the rate of accumulation of pheide a triggers JA-related responses that, to a certain extent, mimic pathogen responses. The JA-induced transcription factor MYC2 is involved in PAO/phyllobilin pathway activation by directly binding to the promoter of various CCGs, like PAO, NYC1, and NYE1 (Zhu et al., 2015; Kuai et al., 2018). Here, we show a positive feedback loop mediated by pheide a, that in turn activates JA-responsive genes. While JA signaling is central to senescence regulation, this suggests an additional signaling function of the PAO/phyllobilin pathway besides default porphyrin detoxification.
Pheide a has likely been recruited during evolution as a signaling molecule of the chloroplast’s metabolic status, due to its particular position within the chl degradation pathway and because of its intricate chloroplast toxicity. Pheide a signaling may act via accumulation of JA-Ile and its bioactive derivatives that in turn induce JA-Ile dependent responses. However, the exact molecular mechanism, in particular the nature of the retrograde signal(s) that links chloroplast pheide a-sensing to nuclear variation in gene expression, remains to be identified. This report shows that retrograde signaling occurs during leaf senescence. We show how critical the control of such signals is during late leaf development stages. This proposed mechanism allows a chloroplast-controlled remodeling of the nuclear transcriptome and aims at an efficient coordination of the cellular fate during senescence.
MATERIALS AND METHODS
Plant Material
Arabidopsis (Arabidopsis thaliana) wild type and CCG mutant lines, i.e. the T-DNA lines pao1 (Pružinská et al., 2005) and pph-1 (Schelbert et al., 2009) and the EMS line nye1-1 (Ren et al., 2007), were grown in short day conditions (8-h light/16-h dark, 23°C, 65% humidity) for eight weeks. At least four leaves, size no. 8 for each triplicate, were harvested and frozen in liquid nitrogen at 0 dd and after 2 d of incubation on water-soaked filter paper in complete darkness at 23°C.
RNA Isolation and Sequencing
RNA was isolated using an RNAeasy minikit (Qiagen) together with on-column DNAse treatment. Quality was assessed using a Bioanalyzer RNA nanochip (Agilent). Three replicate samples for each condition were multiplexed randomly on two lanes (12 samples per lane) of HiSeq 2500 (Illumina).
Read Processing and Gene Expression Analysis
Single-end 100-bp reads were subjected to adapter trimming and removal of low quality bases in leading, trailing, and sliding window (4 bp) mode with the tool Trimmomatic v0.35 (Bolger et al., 2014). Reads shorter than 40 bp after trimming were discarded. Remaining reads were aligned to the protein-coding transcripts from the ENSEMBL release of the TAIR10 A. thaliana transcriptome (Swarbreck et al., 2008) using the software BowTie v1.0.1 (Langmead, 2010). Expression of genes and transcripts was quantified using the software RSEM v1.2.11 taking into account strand-specific information (Li and Dewey, 2011). Differential expression was estimated using EBSeq (Bioconductor) by estimating the posterior probability of genes to be differentially expressed across all conditions (Leng et al., 2013). Coverage data were visualized using the IGV Viewer 2.3.34 (Thorvaldsdóttir et al., 2013) using RSEM-generated .bam files (see Supplemental Fig. S6). GO enrichment was performed using a corrected Benjamini–Hochberg enrichment score implemented in the program Pageman (Usadel et al., 2006).
Co-Expression Network Analysis
WGCNA was used to identify modules gathering genes showing similar pattern of expression across all conditions (Langfelder and Horvath, 2008). Genes below 50 mean read count were excluded, leaving 14,691 genes in the analysis. An unsigned network was constructed from a signed topological overlap matrix and module detection was performed using the default “deepSplit” setting of 2. To visualize the direct subset of genes coregulated with CCG and selected regulatory gene candidates, subnetworks were generated and visualized using the program VisANT 5.51 (Hu et al., 2007). To evaluate the extent to which expression of genes involved in the regulation of the PAO/phyllobilin pathway (all present in Fig. 4) were linked to CCE genes, subnetworks containing either of these genes (CCGs and regulators) were extracted from the WGCNA networks and the three most connected genes for each gene were displayed (Fig. 6C). Larger nodes show the input genes and smaller nodes the top three connected genes for each input gene. Edges represent connection between the genes, and node colors represent the modules in which the genes clustered.
Chl Extraction
Chl was extracted from liquid-nitrogen–homogenized tissue using extraction buffer (90% cold acetone and 10% 0.2 m of Tris-HCl, pH 8; Guyer et al., 2014). Chl content was determined by photospectrometry at A649 and A665. Chl concentrations were calculated as published (Strain et al., 1971).
Chlorophyll Catabolites Profiling
Metabolite profiling was performed by liquid chromatography–tandem mass spectrometry according to a published protocol (Christ et al., 2016). Briefly, leaf samples from five replicates were harvested, frozen, and homogenized in liquid nitrogen. Metabolites were extracted in five volumes of ice-cold extraction buffer (80% methanol, 20% water, and 0.1% [v/v/v] formic acid) and centrifuged (5 min at 18,000g, 4°C). Supernatants were then analyzed by liquid chromatography–tandem mass spectrometry.
Samples were run on an Ultimate 3000 Rapid Separation LC system (Thermo Fisher Scientific) coupled to a Compact ESI-Q-TOF (Bruker Daltonics). The system consisted of a 150-mm C18 column (ACQUITY UPLC BEH, 1.7 μm; Waters). To efficiently separate phyllobilins, the following gradient of solvent B (acetonitrile with 0.1% [v/v] formic acid) in solvent A (water with 0.1% [v/v] formic acid) was run at a flow rate of 0.3 mL min−1: 5% B for 0.5 min, 5% B to 100% B in 11.5 min, 100% B for 4 min, 100% B to 5% B in 1 min, and 5% B for 1 min. Pheide a and phyllobilins were quantified from extracted ion chromatograms as relative peak areas using the software QuantAnalysis (Bruker Daltonics).
Determination of Phytohormones
Extraction was performed as described for lipids in Matyash et al. (2008) with some modifications. Five replicates were used for each condition and each time point. Plant material (100 mg) was extracted with 0.75 mL of methanol containing 10-ng D5-JA (C/D/N Isotopes), 30 ng of D5-oPDA, and 10 ng of D4-JA-Leu (both kindly provided by Dr. Otto Miersch, Halle, Germany) as internal standards. After vortexing, 2.5 mL of methyl-tert-butyl ether were added and the extract was shaken for 1 h at room temperature. For phase separation, 0.6 mL of water was added. The mixture was incubated for 10 min at room temperature and centrifuged at 450g for 15 min. The upper phase was collected and the lower phase re-extracted with 0.7-mL methanol/water (3:2.5, v/v) and 1.3 mL of methyl-tert-butyl ether as described above. The combined upper phases were dried under streaming nitrogen and resuspended in 100 μL of acetonitrile/water (1:4, v/v) containing 0.3 mm of NH4COOH (adjusted to pH 3.5 with formic acid).
Reversed phase separation of constituents was achieved by liquid chromatography using an ACQUITY UPLC system (Waters) equipped with an ACQUITY UPLC HSS T3 column (100 mm × 1 mm, 1.8 µm; Waters). Aliquots of 10 μL were injected. Elution was adapted from a published procedure (Balcke et al., 2012). Solvent A and B were water and acetonitrile/water (9:1, v/v), respectively, both containing 0.3-mm NH4COOH (adjusted to pH 3.5 with formic acid). The flow rate was 0.16 mL min−1 and the separation temperature held at 40°C. Elution was performed with two different binary gradients. Elution profile 1 was as follows: 10% B for 0.5 min, to 40% B in 1.5 min, 40% B for 2 min, to 95% B in 1 min, 95% B for 2.5 min; elution profile 2: 10% B for 0.5 min, to 95% B in 5 min, 95% B for 2.5 min. In both elution profiles, the column was re-equilibrated in 10% B in 3 min.
Nano-electrospray ionization (nanoESI) analysis was achieved using a chip ion source (TriVersa Nanomate; Advion BioSciences). For stable nanoESI, 70 µL min−1 of 2-propanol/acetonitrile/water (7:2:1, v/v/v) containing 0.3 mm of NH4COOH (adjusted to pH 3.5 with formic acid) delivered by a Pharmacia 2248 HPLC pump (GE Healthcare) were added just after the column via a mixing tee valve. By using another post column splitter, 502 nL min−1 of the eluent were directed to the nanoESI chip with 5-μm internal diameter nozzles. Jasmonates were ionized in negative mode at −1.7 kV (after UPLC separation with elution profile 1) and in positive mode at 1.3 kV (after UPLC separation with elution profile 2), and determined in scheduled multiple reaction monitoring mode with an AB Sciex 4000 QTRAP tandem mass spectrometer (AB Sciex). Mass transitions were as described as Köster et al. (2012), with some modifications as follows: 214/62 (declustering potential [DP] 35 V, entrance potential [EP] 8.5 V, collision energy [CE] 24 V) for D5-JA, 209/59 (DP 30 V, EP 4.5 V, CE 24 V) for JA, 237/165 (DP 45 V, EP 6 V, CE 24 V) for OPC4, 265/221 (DP 50 V, EP 6 V, CE 24 V) for OPC6, 305/97 (DP 30 V, EP 4 V, CE 32 V) for 12HSO4-JA, 338/130 (DP 45 V, EP 10 V, CE 30 V) for 12OH-JA-IIe, 352/130 (DP 45 V, EP 10 V, CE 30 V) for 12COOH-JA-IIe, 387/59 (DP 85 V, EP 9 V, CE 52 V) for 12O-Glc-JA, 325/133 (DP 65 V, EP 4 V, CE 30 V) for D4-JA-Leu, 308/116 (DP 45 V, EP 5 V, CE 28 V) for JA-Val, 322/130 (DP 45 V, EP 5 V, CE 28 V) for JA-Ile, 296/170.2 (DP 65 V, EP 4 V, CE 28 V) for D5-OPDA, 263/165 (DP 40 V, EP 5 V, CE 20 V) for dn-OPDA and 291/165 (DP 50 V, EP 5 V, CE 26 V) for 12-OPDA. The mass analyzers were adjusted to a resolution of 0.7 amu full width at half-height. The ion source temperature was 40°C, and the curtain gas was set at 10 (given in arbitrary units). Quantification was carried out using a calibration curve of intensity (m/z) ratios of (unlabeled)/(deuterium-labeled) versus molar amounts of unlabeled (0.3–1,000 pmol) compound. Due to the lack of standards, only relative amounts of 12HSO4-JA, 12OH-JA-Ile, 12COOH-JA-Ile, and 12O-Glc-JA were determined.
Ion Leakage Measurements
For determining cell death in the lines during senescence, leaf discs (0.4 cm in diameter) were punched with a cork-borer under green safe light, avoiding the mid vein. They were placed in a multiwell plate ion conductivity meter (Reid & Associates; 1.5 mL of water and two discs per well) and relative ion leakage (displayed as microsiemens) was determined in the dark.
Determination of Peroxidation Products of Linoleic Acid and α-Linolenic Acid
Enzymatic and nonenzymatic peroxidation products of linoleic acid as well as α-linolenic acid were measured as described in Przybyla et al. (2008). For the analysis of lipid-bound fatty acids and oxylipins, 0.5 g of the plant material were extracted and transmethylated. The fatty acids and oxylipins were quantified using triheptadecanoate and triricinoleate as an internal standard to determine the recovery of the respective compounds.
Accession Number
The raw sequencing data from RNA-seq are available in the ArrayExpress database (www.ebi.ac.uk/arrayexpress) under the accession number E-MTAB-6965.
Supplemental Data
The following supplemental materials are available.
Supplemental Figure S1. Overlap between the data presented here and two independent leaf senescence transcriptome datasets.
Supplemental Figure S2. Concentration of pheophorbide a increases gradually in pao1 during dark-induced senescence.
Supplemental Figure S3. Time course of fatty acid quantification during dark-induced senescence in wild type and pao1 at 0, 12, 24, 36, and 48 h of dark incubation.
Supplemental Figure S4. Dendrogram of the modules generated by WGCNA.
Supplemental Figure S5. Electrolyte leakage data of pao1 and acd2-2 mutants during dark-induced senescence.
Supplemental Figure S6. Mapping of the RNA-seq reads to genes of interest in respective mutant lines.
Supplemental Dataset S1. RNA-seq gene expression data during DET in the four lines.
Supplemental Dataset S2. GO terms enrichment for each pairwise comparison of gene expression.
Supplemental Dataset S3. List of 50 most highly expressed genes after dark incubation.
Supplemental Dataset S4. Expression of hormone-related genes in the four lines before senescence induction.
Supplemental Dataset S5. Raw data from quantification of JA and its derivatives used to draw Figure 5.
Supplemental Dataset S6. GO terms enrichment of all 16 clusters originating from the WGCNA analysis and WGCNA scoring matrix for dark-treated leaves across all lines and for pao1 after 2-d dark incubation.
ACKNOWLEDGMENTS
We are thankful to Sirisha Aluri and Lennart Opitz from the Functional Genomics Centre Zürich for sequencing; to Otto Miersch from the University of Halle, Germany, for providing JA metabolite standards; and to Kathrin Salinger from the University of Zürich for technical assistance.
LITERATURE CITED
Author notes
This work was supported by the European Union Plant Fellow Program, the Swiss National Foundation/European Research Area Net (163504), the Swiss National Science Foundation (31003A_172977), and the Deutsche Forschungsgemeinschaft (INST 186/822-1).
Articles can be viewed without a subscription.
Senior authors.
The author responsible for distribution of materials integral to the findings presented in this article in accordance with the policy described in the Instructions for Authors (www.plantphysiol.org) is: Stefan Hörtensteiner ([email protected]).
S.A. and S.H. conceived the original research plans; S.A. and S.O. performed most of the experiments; K.Z., C.H., and I.F. analyzed jasmonic acid metabolites and oxylipins; S.A., A.P., M.S., and N.F. analyzed the data; S.A. and S.H. wrote the article with contribution of all the authors.
