


Abstract
SNF1-related protein kinases 2 (SnRK2s) are key signaling elements regulating abscisic acid-dependent plant development and responses to environmental stresses. Our previous data showed that the SnRK2-interacting Calcium Sensor (SCS) inhibits SnRK2 activity. Use of alternative transcription start sites located within the Arabidopsis (Arabidopsis thaliana) AtSCS gene results in two in-frame transcripts and subsequently two proteins, that differ only by the sequence position of the N terminus. We previously described the longer AtSCS-A, and now describe the shorter AtSCS-B and compare the two isoforms. The two isoforms differ substantially in their expression profiles in plant organs and in response to environmental stresses, in their calcium binding properties, and in their conformational dynamics in the presence and absence of Ca2+. Only AtSCS-A has the features of a calcium sensor. Both forms inhibit SnRK2 activity, but while AtSCS-A requires calcium for inhibition, AtSCS-B does not. Analysis of Arabidopsis plants stably expressing 35S::AtSCS-A-c-myc or 35S::AtSCS-B-c-myc in the scs-1 knockout mutant background revealed that, in planta, both forms are negative regulators of abscisic acid-induced SnRK2 activity and regulate plant resistance against water deficit. Moreover, the data highlight biochemical, biophysical, and functional properties of EF-hand–like motifs in plant proteins.
SNF1-related protein kinases 2 (SnRK2s) are plant-specific kinases involved in plant response to environmental stresses (e.g. water deficit, salinity) and in abscisic acid (ABA)-dependent development (for reviews, see Hubbard et al., 2010; Fujita et al., 2011; Kulik et al., 2011; Nakashima and Yamaguchi-Shinozaki, 2013; Yoshida et al., 2015). Based on phylogenetic analyses, SnRK2s have been classified into three groups. The classification correlates closely with their sensitivity to ABA; group 1 consists of SnRK2s, which are not activated by ABA treatment, group 2 includes kinases that are not or only weakly activated by ABA, and group-3 kinases are strongly activated by the phytohormone. Ample data demonstrate the role of group-3 SnRK2s in ABA signaling, both in plant development as well as in stress response. In Arabidopsis (Arabidopsis thaliana), group 3 comprises three members: SnRK2.2, SnRK2.3, and SnRK2.6. SnRK2.2 and SnRK2.3 are involved mainly in the regulation of seed dormancy and germination (Fujii et al., 2007), whereas SnRK2.6 regulates stomatal closure in response to water deficit, pathogen infection, CO2, ozone, and darkness (Mustilli et al., 2002; Yoshida et al., 2002; Melotto et al., 2006; Merilo et al., 2013). However, there is significant functional redundancy among the three kinases. The Arabidopsis triple knockout mutant snrk2.2/snrk2.3/snrk2.6 is extremely insensitive to ABA (much more than the single or double knockout mutants), exhibits severely impaired seed development and dormancy, and is oversensitive to water scarcity due to disruption of stomatal closure and downregulation of ABA- and water deficit stress-induced genes (Fujii and Zhu, 2009; Fujita et al., 2009; Nakashima et al., 2009). SnRK2s that are either not or only weakly activated in response to ABA are also involved in regulation of plant responses to abiotic stresses (Umezawa et al., 2004; Mizoguchi et al., 2010; Fujii et al., 2011; McLoughlin et al., 2012; Kulik et al., 2012; Soma et al., 2017).
The SnRK2 kinases are activated transiently in plant cells in response to environmental signals, and otherwise are maintained in inactive states. The best-known negative regulators of SnRK2s are protein phosphatases (Umezawa et al., 2009; Vlad et al., 2009; Hou et al., 2016; Krzywińska et al., 2016). Clade A phosphoprotein phosphatases 2C (PP2Cs) have been identified as major regulators of ABA-activated SnRK2s (Umezawa et al., 2009; Vlad et al., 2009; and for reviews, see Hubbard et al., 2010; Fujita et al., 2011; Nakashima and Yamaguchi-Shinozaki, 2013; Yoshida et al., 2015). Functional and structural studies showed that PP2Cs hold SnRK2s in an inactive state via a two-step inhibition mechanism (Soon et al., 2012; Zhou et al., 2012; Ng et al., 2014): specific Ser/Thr residues in the kinase activation loop are dephosphorylated, and a physical interaction between the kinase activation loop and the phosphatase active site persists to additionally block the kinase activity. Those results suggested that activity modulation is controlled not only by the phosphorylation state of SnRK2s but also by specific protein-protein interactions.
A few years ago, we identified and partially characterized another inhibitor of SnRK2 kinases and consequently of ABA signaling, SnRK2-interacting Calcium Sensor (SCS; Bucholc et al., 2011). SCS provides the link between SnRK2s and calcium signaling pathways.
Calcium ions are ubiquitous second messengers that play pivotal roles in plant response to a number of external signals, regulating plant development and responding to biotic and abiotic stresses. Several hundreds of plant proteins that potentially bind calcium have been identified; it was estimated that the Arabidopsis genome encodes ∼250 EF-hand– or putative EF-hand–containing proteins (Day et al., 2002; Reddy and Reddy, 2004). Arabidopsis, presumably along with other plants, contain many more proteins with canonical and noncanonical EF-hand (“EF-hand–like”) motifs than other organisms. In plants, noncanonical EF-hand motifs are especially abundant (Day et al., 2002). Only a small fraction of them has been characterized. Numerous proteins with putative EF-hand–like motifs are involved in signal transduction; most probably they evolved to sense different calcium levels. Many of them contain four EF-hand sequences, with variable degrees of conservation of canonical EF-hand calcium binding motifs. This group comprises both sensor responder proteins (activated directly upon calcium binding and transmitting the signal further), as well as sensor relay proteins, which do not have enzymatic activity; upon Ca2+ binding, they undergo conformational changes and trigger activation or deactivation of their cellular partners. The best examples of sensor responder proteins are calcium-dependent protein kinases (CDPKs), usually with four calmodulin (CaM)-like EF-hand motifs and a Ser/Thr protein kinase domain that is activated upon calcium binding (for a review, see Schulz et al., 2013). Sensor relay proteins involved in plant signaling constitute two main families: CaMs and calcineurin B-like (CBL) proteins. Like CDPKs, each of them has four EF-hand or EF-hand–like motifs. Some CBLs harbor one or two canonical EF-hand motifs; most, however, have only EF-hand–like motifs (Batistič and Kudla, 2009; Sánchez-Barrena et al., 2013). The variety in calcium binding motif sequences determines the diversity in sensor proteins needed for sensing various calcium signatures, and finally to achieve the response specificity. However, for most CBLs and other predicted calcium binding proteins, the actual calcium binding properties have not been characterized.
SCSs share several similar features with CBL proteins. According to the Prosite (https://prosite.expasy.org/scanprosite/) prediction of properties based on sequence, the Arabidopsis SCS protein (At4g38810) described earlier (Bucholc et al., 2011) contains four peptide sequences resembling EF-hand motifs, of which only one possesses all residues that define a canonical EF-hand. The other three are quite distinctly noncanonical and may be considered EF-hand–like. Also like CBLs, SCS is a sensor relay protein involved in signal transduction in plants via interactions with SnRKs, unique to the plant kingdom. While SCSs interact with SnRK2s, CBLs interact with the SnRK3 kinases, also known as CBL-interacting protein kinases (CIPKs) or protein kinases related to SOS2. Both CBLs and SCSs regulate kinase activity, but in opposite ways, as CBLs activate CIPKs (for a review, see Batistič and Kudla, 2009, 2012; Luan, 2009) whereas SCSs inhibit SnRK2s.
Information provided by The Arabidopsis Information Resource (https://www.arabidopsis.org/) indicates that in Arabidopsis two forms of AtSCS may exist, a longer one with 375 amino acids (denoted here as AtSCS-A), as described in Bucholc et al. (2011), and a shorter version with 265 amino acids (AtSCS-B) corresponding to the 111–375 amino acid fragment of AtSCS-A, in which the classical EF-hand motif is missing (Fig. 1, A and B). In silico analysis of the AtSCS gene (At4g38810) sequence indicates that expression of both forms is possible due to the alternative transcription start sites (TSS); one promoter region is located upstream of ATG codon of AtSCS-A, and the second one is responsible for AtSCS-B transcription within first AtSCS-A intron (Fig. 1A). Alternative mRNA transcription starting, like alternative mRNA processing, is a well-known regulatory process in eukaryotic organisms, including plants, which expands the genome’s coding capacity and generates protein variation (Tanaka et al., 2009; de Klerk and ’t Hoen, 2015). The results of alternative TSS are usually isoforms of proteins, which differ in their function, stability, localization, and/or expression levels.
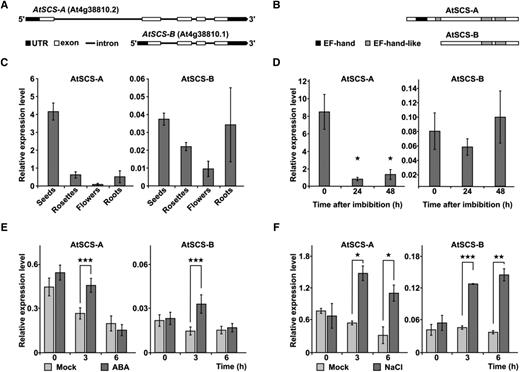
Expression of AtSCS-A and AtSCS-B varies across plant organs and in plant response to ABA or NaCl treatment. Alternative isoforms of AtSCS (At4g38810)—AtSCS-A and AtSCS-B—were predicted at transcript (A) and protein (B) levels. Prediction was based on The Arabidopsis Information Resource plant promoter database (PlantPromoterDB; http://ppdb.agr.gifu-u.ac.jp/ppdb/) and the Prosite protein database (prediction of EF-hand motifs; https://prosite.expasy.org/). Reverse transcription quantitative PCR analysis of AtSCS-A and AtSCS-B transcript levels in different organs (C), in seeds during germination (D), and in 2-week–old seedlings exposed to 10 μm of ABA (E) or 150 mm of NaCl (F). Expression levels in plants exposed to ABA or NaCl (dark gray) and control plants given mock treatment (light gray). Data represent means of triplicate biological repeats, and error bars indicate sd. For statistical analysis, a two-tailed t-test in Microsoft Office Excel was applied. Asterisks indicate significant difference from the wild type (★P < 0.05; ★★P < 0.01; ★★★P < 0.001). UTR, untranslated region.
In this study we confirmed the expression of both forms of AtSCS in Arabidopsis and showed significant differences in their expression profiles in plant organs and in response to abiotic stress. We compared both proteins with respect to Ca2+-binding properties, conformational dynamics with and without Ca2+, and regulation of the kinase activity in vitro and in vivo. Analysis of transgenic plants expressing 35S::AtSCS-A-c-myc or 35S::AtSCS-B-c-myc in the scs-1 knockout background showed that both forms inhibit the ABA-responsive SnRK2s and, as a consequence, ABA signaling. The results show that both isoforms play a role in the regulation of the plant response to dehydration, analogous to that of the A-clade PP2Cs. Moreover, our results provide novel biochemical and biophysical data on EF-hand–like motifs in plant proteins.
RESULTS
AtSCS-A and AtSCS-B Are Differently Expressed in Plant Tissues and in Arabidopsis Seedlings Subjected to ABA or Salt Stress
To verify that two forms of AtSCS are expressed in Arabidopsis, we analyzed the mRNA level of AtSCS-A and AtSCS-B in various plant organs (seeds, rosettes, flowers, and roots). Moreover, because the functional analysis of AtSCS done previously by a reverse genetic approach indicated that AtSCS is involved in ABA signaling (Bucholc et al., 2011), we monitored AtSCS-A and AtSCS-B expression in seedlings exposed to ABA (10 μm) or salt stress (150 mm of NaCl). To eliminate the potential influence of the circadian clock on the transcript levels, at each time point the transcript level of AtSCS-A and AtSCS-B was also monitored in plants not exposed to the stressor or ABA. The highest level of AtSCS-A transcript was observed in dry seeds, and the lowest in flowers (Fig. 1C; Supplemental Fig. S1). AtSCS-B expression was the highest in seeds and in roots; however, as it is shown in Figure 1C and Supplemental Figure S1, AtSCS-B was expressed at a much lower level than AtSCS-A in all organs studied. In dry seeds, expression of AtSCS-A was ∼100× higher than that of AtSCS-B. During seed imbibition, the transcript level of AtSCS-A rapidly declined; after 24 h of imbibition, the expression was ∼10× lower than that in dry seeds. In contrast, the transcript level of AtSCS-B did not change significantly during imbibition (Fig. 1D).
Analysis of AtSCS-A and AtSCS-B expression in seedlings exposed to 10 μm of ABA showed transient increases (1.7- and 2.3-fold, respectively, at 3 h) over levels in seedlings not exposed to ABA, with the differences disappearing by 6 h after treatment (Fig. 1E). Salinity stress (150 mm of NaCl) increased expression levels persistently (observed at both 3 and 6 h after treatment), to levels ∼3- to 4-fold higher for both isoforms (Fig. 1F). It should be noted that only AtSCS-A expression undergoes changes during diurnal rhythm.
AtSCS-B Interacts with Members of Groups 2 and 3 of the SnRK2 Family
To determine whether AtSCS-B, like AtSCS-A, interacts with SnRK2s, we used a yeast two-hybrid approach. Coding sequence of AtSCS-B was fused in-frame to cDNA encoding the Gal4 activation domain in the pGAD424 yeast expression vector, and cDNA encoding each of SnRK2s studied was fused to the Gal4 DNA-binding domain in pGBT9 vector. Using parallel constructions, we also studied interactions between AtSCS-A and SnRK2s. Those can be considered to be positive controls, because interactions between SnRK2s and AtSCS-A have been established previously (Bucholc et al., 2011). The results revealed that AtSCS-B interacts with SnRK2s from group 3 (SnRK2.2, SnRK2.3, and SnRK2.6) and from group 2 (SnRK2.7 and SnRK2.8), but does not interact with ABA-nonactivated SnRK2 kinases from group 1 (SnRK2.1, SnRK2.4, SnRK2.5, and SnRK2.10) or with SnRK2.9 (Fig. 2A). The results suggest that AtSCS-B is a cellular regulator of members of groups 2 and 3 but not group 1 of the SnRK2 family. In contrast, AtSCS-A does not discriminate between these kinases in respect to the interaction. The only Arabidopsis SnRK2 that does not bind to either form of AtSCS is SnRK2.9.
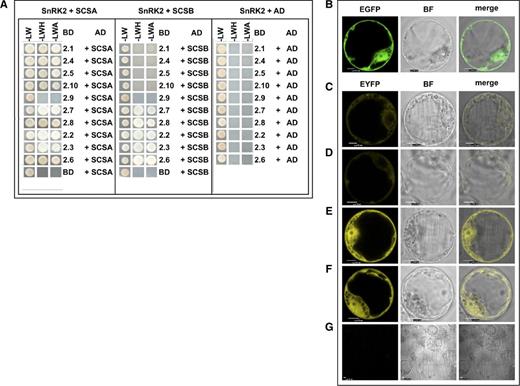
AtSCS-B interacts preferentially with kinases that belong to groups 2 and 3 of the SnRK2 family. Interactions between Arabidopsis SnRK2s and AtSCS-B, or AtSCS-A as a control, were analyzed by a yeast two-hybrid assay (A), as described in Bucholc et al. (2011). Yeast transformed with a construct with cDNA encoding one of the analyzed SnRK2s and complementary empty vector (BD − SnRK2 + AD), or a construct with AtSCS-B or AtSCS-A and the other empty vector (BD + AD − AtSCS) were used as controls. The growth of yeast expressing the indicated constructs was monitored on selective media: without Leu and Trp (-LW); without Leu, Trp, and His and with 8 mm AT (-LWH); and without Leu, Trp, and Ade (-LWA). AD, Gal4 activation domain; BD, Gal4 binding domain. The subcellular localization of AtSCS-B was analyzed in Arabidopsis protoplasts (B), as described in Bucholc et al. (2011). Protoplasts isolated from the T87 Arabidopsis cell line were transiently transformed with plasmid encoding AtSCS-B-EGFP and its localization was analyzed by confocal microscopy. Interaction between AtSCS-B and SnRK2s in planta was analyzed by BiFC assay. T87 protoplasts were transiently cotransformed with pairs of plasmids encoding: AtSCS-B-cEYFP and nEYFP-SnRK2.4 (C), AtSCS-B-cEYFP and nEYFP-SnRK2.10 (D), AtSCS-B-cEYFP and nEYFP-SnRK2.6 (E), and AtSCS-B-cEYFP and nEYFP-SnRK2.8 (F). The binding led to reconstitution of functional YFP from chimeric proteins bearing nonfluorescent halves of YFP. For negative control, AtSCS-B-cEYFP was coexpressed with AtSCS-B-nEYFP (G). Scale bars = 10 μm; BF, bright field. The data shown here represent one of three independent experiments, all with similar results.
The interactions between AtSCS-B and the selected SnRK2s were verified by bimolecular fluorescence complementation (BiFC) assays. The proteins were expressed in Arabidopsis protoplasts as described in Bucholc et al. (2011). First, we analyzed the subcellular localization of AtSCS-B. The protein was produced as a fusion with enhanced GFP (EGFP) using the pSAT6-EGFP-N1 or pSAT6-EGFP-C1 vector. As with AtSCS-A (Bucholc et al., 2011), AtSCS-B localized to the nucleus and cytoplasm (Fig. 2B). In a BiFC assay we analyzed interactions among AtSCS-B and SnRK2.4, SnRK2.10, SnRK2.6, and SnRK2.8 (Fig. 2, C–F). The kinases and AtSCS-B were each fused to complementary nonfluorescent fragments of yellow fluorescent protein (YFP) and transiently produced in Arabidopsis protoplasts. The BiFC assays showed that SnRK2.6 (from group 3) and SnRK2.8 (from group 2) interact with the AtSCS-B in planta. The interactions occur both in the cytoplasm and nucleus. SnRK2.4 and SnRK2.10 (from group 1) did not interact with AtSCS-B (in agreement with two-hybrid assay) or they interact very weakly, as the YFP signal is much weaker for these two kinases than that observed for SnRK2.6 or SnRK2.8. This supports the view that AtSCS-B is rather not a cellular regulator of non-ABA-activated SnRK2 kinases. A very low fluorescence signal detectable in the negative control samples was much weaker than YFP signal in BiFC samples (Fig. 2G). A comparison with AtSCS-A should be noted; as published previously, AtSCS-A interacts with all SnRK2 kinases studied, but exclusively in the cytoplasm (Bucholc et al., 2011).
AtSCS-B Inhibits SnRK2 Activity in Calcium-Independent Manner
Our previous results showed that AtSCS-A inhibits SnRK2 activity only in the presence of calcium ions (Bucholc et al., 2011). To check whether AtSCS-B inhibition of SnRK2 activity is similarly calcium-dependent, we monitored the in vitro activity of SnRK2.6 and SnRK2.8 in the presence of increasing amounts of purified recombinant AtSCS-B, with and without calcium ions in the reaction mixture. The kinase activity was analyzed using myelin basic protein (MBP) as a substrate. The results showed that AtSCS-B, in contrast to AtSCS-A, inhibits the SnRK2 activity both in the presence and in the absence of calcium ions (in the presence of EGTA; Fig. 3, A and B).
![AtSCS-A and AtSCS-B inhibit the SnRK2 activity in vitro and in vivo. AtSCS-B inhibition of SnRK2.6 (A) and SnRK2.8 (B) is calcium-independent. SnRK2.6, SnRK2.8, and AtSCS-B were expressed in E. coli and the kinase activity was measured in the presence of increasing amounts of AtSCS-B (0, 40, 80, and 160 ng per microliter) without or with Ca2+ (2 mm of EGTA or 1 mm of CaCl2, respectively) in the reaction mixture. The kinase activity was monitored using MBP and [γ32P]ATP as substrates. Reaction products were separated by SDS-PAGE and MBP phosphorylation was determined by autoradiography. The data represent one of three independent experiments showing similar results. The expression of AtSCS-A and AtSCS-B in seedlings of homozygous transgenic lines 35S::AtSCS-A-c-myc (A26 and A35) and 35S::AtSCS-B-c-myc (B12 and B31) was measured at protein (C) and transcript (D) levels. The production of AtSCS-A-c-myc and AtSCS-B-c-myc proteins was monitored in seedlings of the transgenic plants by western blotting using anti-myc antibodies. AtSCS mRNA level was monitored in the transgenic plants expressing AtSCS-A-c-myc or AtSCS-B-c-myc, or c-myc (vector control: P1, P17), the scs-1 and scs-2 mutants, as well in the wild-type (WT) plants by qRT-PCR analysis. Data represent means of triplicate biological repeats, and the error bars indicate sd. Analysis of the SnRK2 activity in 2-week–old seedlings of the wild type, transgenic plants expressing AtSCS-A-c-myc or AtSCS-B-c-myc, and selected snrk2 knockout mutants subjected to 100 μm of ABA (E) or 350 mm of NaCl (F) shows significant in planta inhibition by AtSCS isoforms. The kinase activity was monitored by in-gel-kinase activity assay using as substrate GST-ABF2 (G73-Q120) or MBP, respectively. The representative results from one of three independent experiments are shown.](https://oup.silverchair-cdn.com/oup/backfile/Content_public/Journal/plphys/182/2/10.1104_pp.19.00900/2/m_plphys_v182_2_1142_f3.jpeg?Expires=1747909686&Signature=oZND4q1ZTN4B-T8tEJjMEpFduZCDj~CO3RlKmcSg8DkB20zPglvdsjlMRJ6I158Od2Nsb4EODegpASI7Lv-vcZUStmHl9zcyFgvXzEag33ELYg4Kh2Qq8CYslJUKGfrXcJi2GiYUg~512FVpHZllPGopLx1VZlXU7o9RTRME9ZWvCP3f7Io9nXCgIhmrypIHKF4Qk19AyjWNub63zU5tatKiPYAimVgCa7ULn5bu95v1bXobqXxcq1PeG02w7kkvhTkeOaFcq0ecyBBKmMhKjQoG8CFPdJdcwPW7vh7qpAT4svryvbN3G5MHfqx1GKtS1kK7sUB9fcxu8KMae3dUtg__&Key-Pair-Id=APKAIE5G5CRDK6RD3PGA)
AtSCS-A and AtSCS-B inhibit the SnRK2 activity in vitro and in vivo. AtSCS-B inhibition of SnRK2.6 (A) and SnRK2.8 (B) is calcium-independent. SnRK2.6, SnRK2.8, and AtSCS-B were expressed in E. coli and the kinase activity was measured in the presence of increasing amounts of AtSCS-B (0, 40, 80, and 160 ng per microliter) without or with Ca2+ (2 mm of EGTA or 1 mm of CaCl2, respectively) in the reaction mixture. The kinase activity was monitored using MBP and [γ32P]ATP as substrates. Reaction products were separated by SDS-PAGE and MBP phosphorylation was determined by autoradiography. The data represent one of three independent experiments showing similar results. The expression of AtSCS-A and AtSCS-B in seedlings of homozygous transgenic lines 35S::AtSCS-A-c-myc (A26 and A35) and 35S::AtSCS-B-c-myc (B12 and B31) was measured at protein (C) and transcript (D) levels. The production of AtSCS-A-c-myc and AtSCS-B-c-myc proteins was monitored in seedlings of the transgenic plants by western blotting using anti-myc antibodies. AtSCS mRNA level was monitored in the transgenic plants expressing AtSCS-A-c-myc or AtSCS-B-c-myc, or c-myc (vector control: P1, P17), the scs-1 and scs-2 mutants, as well in the wild-type (WT) plants by qRT-PCR analysis. Data represent means of triplicate biological repeats, and the error bars indicate sd. Analysis of the SnRK2 activity in 2-week–old seedlings of the wild type, transgenic plants expressing AtSCS-A-c-myc or AtSCS-B-c-myc, and selected snrk2 knockout mutants subjected to 100 μm of ABA (E) or 350 mm of NaCl (F) shows significant in planta inhibition by AtSCS isoforms. The kinase activity was monitored by in-gel-kinase activity assay using as substrate GST-ABF2 (G73-Q120) or MBP, respectively. The representative results from one of three independent experiments are shown.
Both AtSCS-A and AtSCS-B Inhibit the SnRK2 Activity In Planta
To investigate the involvement of AtSCS-A and AtSCS-B in the regulation of SnRK2 activity in vivo, we obtained homozygous transgenic Col-0 Arabidopsis plants expressing AtSCS-A-c-myc (five independent lines) or AtSCS-B-c-myc (three independent lines) under control of the 35S promoter, as well as plants expressing an empty vector, in an scs-1 knockout background deficient in both AtSCS forms. For the studies, we selected the two transgenic lines of 35S::AtSCS-A-c-myc (A26 and A35) and 35S::AtSCS-B-c-myc (B12 and B31) with the highest expression of the transgene (Fig. 3, C and D; Supplemental Fig. S2). We analyzed the kinase activity phosphorylating ABF2 (Gly-73–Gln-120) peptide (in the case of plants exposed to ABA) or MBP (in the case of plants exposed to NaCl) in 2-week–old seedlings of A26, A35, B12, and B31 lines, and the wild-type Arabidopsis. The activity was analyzed before and after treatment with 100 μm of ABA (or 350 mm of NaCl) by in-gel kinase activity assay according to Wang and Zhu (2016). The SnRK2 activity induced in response to ABA was significantly lower in both 35S::AtSCS-A-c-myc lines (A26 and A35) and in one 35S::AtSCS-B-c-myc line (B12) compared to wild-type plants (Fig. 3E). In the B31 line, with its lower expression of AtSCS-B-c-myc compared to B12 line, the ABA-induced SnRK2 activity was similar to that observed in the wild-type plants. These results indicate that both AtSCS-A and AtSCS-B inhibit the kinase activity induced by ABA treatment; however, the inhibition is stronger in the presence of AtSCS-A. The analysis of the kinase activity in the same Arabidopsis lines treated with NaCl showed only very weak, if any, inhibition of the SnRK2 activity by AtSCSs (Fig. 3F). In summary, these results indicate that both forms of AtSCS are able to inhibit the SnRK2s in vivo, especially those kinases that are involved in ABA signaling.
AtSCS-A and AtSCS-B Have an Impact on the Plant Sensitivity to Dehydration
Our results showed that expression of AtSCS-A and AtSCS-B is induced in the response to ABA (Fig. 1E). Moreover, the activity of ABA-responsive kinases in Arabidopsis seedlings overexpressing AtSCS-A or AtSCS-B exposed to exogenous ABA is significantly reduced in comparison to that observed in the wild-type plants (Fig. 3E). Because the ABA-responsive SnRK2s are key regulators of the plant response to dehydration, we studied the impact of AtSCSs on the plant response to water deficit. We analyzed the survival rate of the Col-0 wild type, the scs knockout mutants (lines scs-2 and vector control P1, 35S::c-myc in scs-1 background), 35S::AtSCS-A-c-myc (A26 and A35 lines), and 35S::AtSCS-B-c-myc (B12 and B31 lines) transgenic plants under drought conditions (the watering was withdrawn for 14 d) and after rewatering. In our assay we also included an abi1-2/pp2ca-1 mutant deficient in two clade A PP2C phosphates, ABI1 and PP2CA, well-known inhibitors of ABA-dependent SnRK2s and ABA signaling (Rubio et al., 2009; Umezawa et al., 2009; Vlad et al., 2009), as a control. Our results confirmed the data of Rubio et al. (2009) that the abi1-2/pp2ca-1 mutant exhibits enhanced resistance to drought stress and showed that the scs-2 mutant and P1 line similarly as abi1-2/pp2ca-1 were more resistant to dehydration than all other lines studied (Fig. 4, A and B). The data indicated similar regulation of the response to dehydration of AtSCSs and the clade A PP2Cs. The results also showed that expression of AtSCS-A (lines A26 and A35) or AtSCS-B (especially line B12 with a higher level of AtSCS-B) alone only partially complement the phenotype of the scs mutant, which suggests that both forms of SCS are needed for the full complementation.
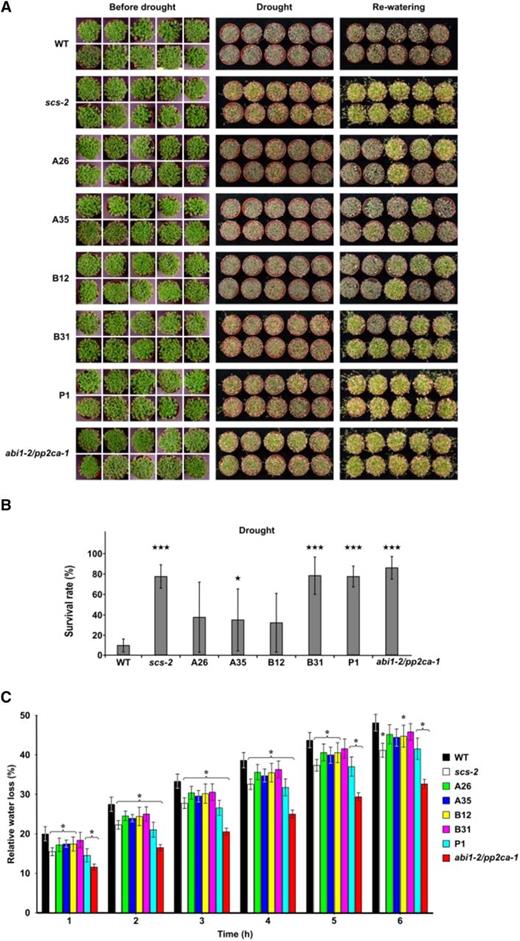
AtSCS-A and AtSCS-B regulate the response of Arabidopsis to water deficit. The drought survival rate test (A). The Arabidopsis plants were grown in pots for 17 d under long-day conditions and for an additional 2 weeks without watering. The photographs were taken before watering was stopped (before drought), after 2 weeks without water (drought), and 2 d after rewatering (rewatering). Ten pots with ∼50 plants per pot for each line per experiment were used. Representative plants are presented. The drought survival rate (B) was estimated by analysis of at least 1,000 plants per each line. For the statistical analysis, a t test was applied. The stars indicate significant differences from the wild type (★P < 0.05; ★★★P < 0.001). The average values ± se are shown. Water loss from detached Arabidopsis rosettes (C). Rates of water loss from the whole rosettes of 6-week–old plants of wild type and different mutant lines were measured at the time points indicated. Finally, the rosettes were dried at 70°C overnight and weighed. The Cut Rosette Water Loss was calculated. The representative results from one of four independent experiments are shown. Eight plants were used for each line per experiment. For the statistical analysis, a t test was applied. The asterisks indicate significant differences from the wild type (*P < 0.05; ***P < 0.001). The average values ± se are shown. WT, wild type.
Additionally, we measured water loss in detached rosettes of 6-week–old plants of all the lines listed here. The water loss was lower in rosettes of the scs mutants (scs-2 and P1, vector control in scs1 background) than in other lines (Fig. 4C), which is in agreement with the result of drought survival test (Fig. 4, A and B).
Using Arabidopsis lines with differing AtSCS-A or AtSCS-B levels, we also investigated the involvement of AtSCSs in regulation of the expression of ABA-induced stress-related genes. For the analysis we chose two genes regulated by SnRK2s in an ABA-dependent manner, Rab18 and RD29B. We did not observe any significant differences in the expression of genes studied in response to ABA between lines studied (Supplemental Fig. S3), indicating that SCSs are not involved in the regulation of gene expression. This result is consistent with our data showing that SCSs interact with SnRK2s mainly in the cytoplasm; AtSCS-A interacts exclusively in the cytoplasm (Bucholc et al., 2011; Fig. 2B); and AtSCS-B interacts in the cytoplasm and in the nucleus. However, we cannot exclude the possibility that transiently overexpressed AtSCS-B-GFP/YFP is passively diffused to the nucleus (that is why we observe its presence both in the cytoplasm and the nucleus).
AtSCS-B Binds Ca2+ Without a Substantial Effect on the Protein Conformation
To compare calcium-binding properties of AtSCS-B to that of AtSCS-A described earlier (Bucholc et al., 2011), we monitored changes in fluorescence of AtSCS-B and AtSCS-A (as a control) accompanying binding of calcium. The proteins were excited at 280 nm (monitoring the fluorescence of all fluorophores) or at 295 nm (monitoring the fluorescence of a Trp residue). AtSCS-B protein has three fluorophores: Trp-72, Tyr-29, and Tyr-168 (corresponding to Trp-182, Tyr-139, and Tyr-278 in AtSCS-A). The protein fluorescence spectrum is dominated by the broad Trp fluorescence band, and the Tyr fluorescence band is apparent as well. The binding of calcium caused small changes: the small intensity decrease and very small red shift of the maximum, λmax (apo) = 342.5 nm → λmax (holo) = 343 nm (for the fluorescence excitation at 280 nm) and λmax (apo) = 350 nm → λmax (holo) = 351 nm (excitation at 295 nm; Fig. 5A). Also, the small increase of the intensity was observed for the fluorescence band of the Tyr residue(s), near 305 nm. The fluorescence spectrum of AtSCS-B suggests that the Trp residue is buried and inaccessible to an energy transfer from the Tyr residue(s), and located in an environment that quenches its fluorescence strongly. The calcium binding entails a subtle rearrangement of Trp-72 environment, linked with the small red shift of Trp-72 fluorescence (at 295-nm excitation; Fig. 5A).
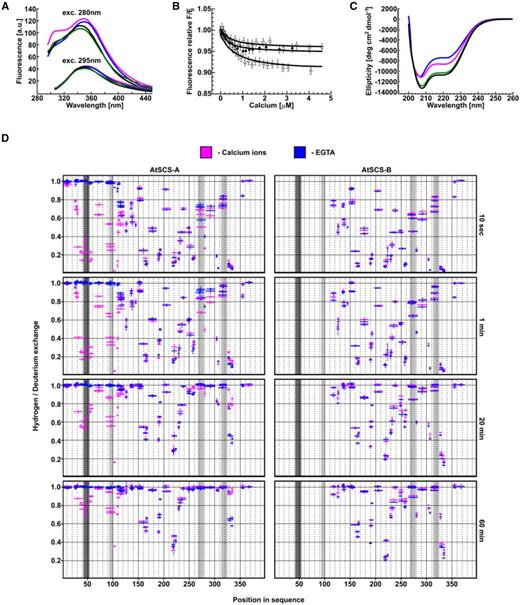
AtSCS-B binds Ca2+ without a substantial effect on the protein conformation. The fluorescence spectra of AtSCS-B and AtSCS-A proteins (A). The fluorescence spectra of 1.2-μm solution of AtSCS-A or AtSCS-B protein, excited at 280 nm (upper curves) or at 295 nm (bottom curves). apo AtSCS-A protein (blue line), apo AtSCS-B protein (black line), holo AtSCS-A (magenta line), and holo AtSCS-B (green line) are presented. The fluorescence spectra represent one of three independent measurements. The fluorescence titration curves of AtSCS-B protein by calcium ions (B). The fluorescence excitation and the emission were at 280 and 342 nm (open triangles) or 280 and 340 nm (black circles, open squares), respectively. The calcium ions titration of 1.5-μm solutions of AtSCS-B and the theoretical curves, calculated for a single-site ligand binding model (solid lines), are shown. Error bars represent experimental errors due to the instrument accuracy. Conformational changes of AtSCS-A and AtSCS-B proteins upon Ca2+ binding (C). CD spectra of 2 μm solutions of AtSCS-B or AtSCS-A with 1 mm of Ca2+ (green and magenta lines, respectively) or without Ca2+ (100 μm of EDTA; blue for apo AtSCS-A and black for apo-AtSCS-B). Changes of conformational dynamics of AtSCS-A and AtSCS-B upon Ca2+ binding (D). H/D exchange in AtSCS-A (left) and AtSCS-B (right) in the presence (magenta) or in the absence of Ca2+ (EGTA, blue). The proteins were incubated in heavy water buffer for various times (10 s, 1 min, 20 min, and 60 min) and the extent of H/D exchange was determined by mass spectrometry. The horizontal magenta and blue bars indicate individual peptides identified by mass spectrometry. The x axis indicates their position in the amino acid sequence of the AtSCS-A. The y axis shows relative deuterium uptake calculated as described in “Material and Methods”; the value “1” represents maximal deuteration level, meaning that all hydrogens in amide bonds of particular peptide were exchanged to deuterium. Error bars are sds from at least three independent experiments. Dark gray is the position of calcium binding loops of the canonical EF-hand motif; light gray are the positions of calcium binding loops of potential noncanonical EF-hand motifs.
In parallel, analogous experiments were performed for the AtSCS-A protein, as was also studied previously (Bucholc et al., 2011). AtSCS-A protein is longer than AtSCS-B by 110 amino acid residues and richer by one Tyr residue, Tyr-80. The protein is also more sensitive to calcium ions due to the presence of the canonical EF-hand motif. The fluorescence spectra of the AtSCS-A, for the apo form of the protein, are similar to those of AtSCS-B (Fig. 5A). The most significant fluorescence changes after calcium binding were observed as an increase in the intensity of the Tyr fluorescence band (Fig. 5A). The contribution of Trp residue to those changes is small. The fluorescence spectra, excited at 295 nm, are almost the same for the calcium-free and the calcium-bound protein (Fig. 5A, bottom curves), supporting the conclusion that the conformation of the protein in the environment residues Trp-182 is only slightly altered by calcium ions. In contrast, the conformation of the protein in the environment of the one or more of the Tyr residues changes dramatically. Tyr-80 present in the N-terminal fragment of AtSCS-A (absent in AtSCS-B protein) seems responsible for these changes. Its fluorescence is influenced most probably by the rearrangement of the canonical EF-hand motif upon calcium binding.
The affinity for calcium of AtSCS-B protein was determined from the fluorescence titration experiments (Fig. 5B). The fluorescence, excited at 280 nm, was measured at 340 or 342 nm, in the fluorescence maximum. The maximal fluorescence intensity changes were small; they did not exceed 10% of the initial fluorescence of the protein (Fig. 5B). To the resulting titration curve, the function describing the binding of calcium ion (Eq. 3 from “Materials and Methods”) was fitted. The function is analogous with Equation 8 in Eftink (1997) describing single-site ligand binding. The calcium association constant K1 was estimated as 2.4 (±1.0) × 103 M−1, as the average of three independent measurements. The value of K1 = 2.4 × 10³ M−1 corresponds to a dissociation constant of 0.4 mm.


where x = mole fraction of the complex protein-ligand; F′ = relative observed fluorescence (relative to the initial fluorescence without the ligand); fB = relative fluorescence of the complex protein-ligand; Lt = the total (free and bound) concentration of ligand; and Ka is the overall Ka value of protein-ligand. This result indicates that AtSCS-B molecule most probably binds one calcium ion.
Structural changes of AtSCS-B upon calcium binding were analyzed by far-UV circular dichroism (CD) spectroscopy. The binding of calcium ions by the AtSCS-B protein was accompanied by minor structural changes, seen as a decrease of negative CD signals (Fig. 5C), indicating very mild disruption of the protein structure in response to calcium binding, limited to some reduction of helix content or some helix reorientation. In parallel, as a control, the CD spectrum of AtSCS-A protein in the same conditions was analyzed (Fig. 5C). The values of residual molar ellipticity agreed well with the earlier data (Bucholc et al., 2011). The Ca2+-free AtSCS-A protein is 28% helical, and the contribution of helical structures in the Ca2+-bound protein is higher, but less than in AtSCS-B protein (both calcium-free and calcium-bound).
Differences in Conformational Dynamics Between AtSCS-A and AtSCS-B upon Calcium Binding
The analysis of AtSCS proteins using fluorescence and CD spectroscopy methods revealed that the structure of AtSCS-A, but not AtSCS-B, undergoes significant change upon Ca2+ addition; they do not, however, indicate where the conformational changes occur. Therefore, to investigate the structure and conformational dynamics of AtSCS proteins in the absence and in presence of Ca2+ ions, hydrogen/deuterium (H/D) exchange monitored by mass spectrometry (HDX-MS) was applied. HDX-MS is an analytical technique that maps protein conformational dynamics in solution to specific regions of the protein. The approach applied in this study gave structural information with peptide resolution because the measured degree of exchange is an average over the lengths of the peptides resulting from pepsin digestion. This is especially informative, as to our knowledge no structure of AtSCS-A or AtSCS-B (or any similar proteins) has been determined by x-ray crystallography, Cryo-EM, or NMR; none has been deposited in the Protein DataBank (PDB; https://www.rcsb.org/).
The H/D exchange patterns along the AtSCS-A and AtSCS-B proteins were obtained for two conditions, one in the presence and one in the absence of Ca2+ (in buffer with EGTA). Regions could be classified variously as stable or labile, and the stability of some of these regions was calcium-dependent, as we describe next.
Conformational Dynamics of AtSCS-A
The HDX-MS data show that AtSCS-A protein contains several regions of retarded exchange, independent of the presence of Ca2+ (Fig. 5D; Supplemental Figs. S5–S7). Peptides spanning 151–169, 187–196, and 215–226 residues can be classified as the most protected (i.e. most stable) regions. These are thus regions involved in the hydrogen-bonding network that constitute the structural core of the molecule. There are also regions along the AtSCS-A sequence for which the level of H/D exchange is very high, independent of the presence of Ca2+ ions. Peptides spanning positions 1–19, 110–123, 133–140, 147–160, 197–214, 233–244, 307–325, and 351–375 can be classified as the most labile regions. Highly dynamic regions in the inner parts of the SCS protein sequence are probably located within loops and extended turns that connect adjacent elements of the protein.
Some segments of AtSCS-A showed drastically different conformational dynamics depending on the presence of calcium ions. In the presence of EGTA (and absence of calcium), an N-terminal segment of AtSCS-A (region from ∼20–110 amino acid) undergoes very fast H/D exchange. This region exhibits no protection even at the lowest measured experimental time of 10-s labeling (Fig. 5D; Supplemental Figs. S5–S7), indicating a lack of secondary structure of this domain. The presence of Ca2+ ions dramatically changes the pattern of H/D exchange in this region, strongly decreasing the uptake of deuterium in two segments. One of them spans the calcium-binding loop of classical EF-hand motif (fragment 42–53). Unexpectedly, significant changes in the deuterium uptake after Ca2+ addition occur also in the region of residues 85–112 (Fig. 5D; Supplemental Figs. S5–S7). In that part of the AtSCS-A, a Prosite motif search algorithm predicted the occurrence of the putative noncanonical EF-hand motif.
Some changes in levels of H/D exchange upon Ca2+ binding also appear in the AtSCS-A segments 254–301 and 325–337 (Fig. 5D; Supplemental Figs. S6 and S7). Two hypothetical EF-hand–like loops (positions: 267–278 and 313–324) are predicted within and close to these fragments. Here, several regions characterized by relatively stable structure were detected. Notably, the retarded exchange is observed in segments directly flanking the putative calcium binding motifs, indicating the presence of stable secondary structure elements there (positions: 245–263 and 325–337). The flanking regions seem to be structured both in the presence and in the absence of calcium ions, whereas the putative EF-hand–like calcium-binding loops exhibit quite high H/D exchange levels independent of calcium ions (Fig. 5D; Supplemental Figs. S5 and S6) and can be classified as dynamic regions. Interestingly, the flexibility of fragment 262–301 is decreased when calcium is present (Fig. 5D; Supplemental Figs. S5 and S6). The opposite effect, i.e. destabilization in the presence of calcium, was observed for the region 325–337.
The Structure of the Common Region Is More Stable in AtSCS-B than in AtSCS-A, Both in the Presence and in the Absence of Calcium Ions
Patterns of H/D exchange obtained in the same experimental conditions for AtSCS-A and AtSCS-B indicate that, in general, both forms do not differ much from each other in the region 110–250, which is common for both forms (Fig. 5D; Supplemental Figs. S5 and S7). There are some differences, however—mainly near putative calcium binding loops (region 157–168 in AtSCS-B, corresponding to 267–278 in AtSCS-A, and 203–214 in AtSCS-B, corresponding to 313–324 in AtSCS-A. Strikingly, in the longer variant (AtSCS-A), regions flanking the predicted calcium-binding loops reveal lower stability than in the shorter variant, which lacks residues 1–110 (AtSCS-B). Thus, the native stability of the C-terminal fragment is disturbed in the structural context of the longer variant. This strongly indicates that the N-terminal domain, absent in AtSCS-B, is structurally coupled to the C-terminal part in AtSCS-A and destabilizes its structure. On the other hand, the HDX data show that, in the presence of calcium, the third predicted EF-hand–like calcium-binding loop (region 267–278) in AtSCS-A is stabilized in the presence of calcium and becomes similar to that of AtSCS-B. (Fig. 5D; Supplemental Figs. S5 and S6).
Models of AtSCS-A/AtSCS-B Structure
Due to the lack of relevant templates in the PDB, the 3D structure of AtSCS-A was modeled separately for two regions, defined by residue ranges of 1–175 and 211–330, respectively. For these protein fragments, homology modeling was carried out based on the rationally selected subsets of PDB structures, as described in “Materials and Methods.”
N-Terminal Domain of AtSCS-A
The best models for the fragment-covering residues 1–175 were built using either 4MBE or 1SL8 PDB records as templates. However, in the hybrid model, obtained by the combination of fragments of 4MBE, 4OR9, 1SL8, and 4N5X, modeled structures were scored even better. Because the N-terminal fragment 1–26 was strongly divergent in all models, and was also found flexible in HDX experiments, the subsequent round of modeling was restricted to residues 26–175. The final hybrid model, based on the combination of structural motifs adopted from 2ZND, 1Y1X, 5B8I, 2TN4, and 4OR9, scored higher than any of the single structure-based models. The fold of the modeled N-terminal domain shows two pairs of EF-hand–like motifs, the relative orientation of which visibly varies between individual models. However, in the majority of them, the 42 DQDEDGKLSVTE53 loop (Fig. 6A, magenta tube) adopts the canonical conformation characteristic for the calcium-loaded form of EF-hand, whereby calcium is coordinated by the side-chain carboxyl groups of Asp-42, Asp-44, Asp-46, and Glu-53, along with the carbonyl oxygen of Lys-48 (magenta in Fig. 6A). However, it should be mentioned that, according to the review on conservation of individual residues located at the Ca2+ binding loop (Halling et al., 2016), Gln, Glu, Lys, Leu, Val, and Thr are rarely identified at positions 2, 4, 7, 8, and 11 of CaM EF-hand motifs (1.0%, 1.1%, 5.2%, 1.8%, 2.0%, and 3.0%, respectively). The sequences of the paired loop (88 THGSQEKVSKTE99, blue in Fig. 6A) preclude calcium binding. Interestingly, the side chain of Lys-94 located in this loop may compete with Ca2+ for the binding site, thus stabilizing an EF-hand fold for the apo form. Both findings suggest that the N-terminal domain of AtSCS-A binds a single Ca2+ cation with an affinity substantially lower than that of CaM, which confirms our previous data describing Ca2+-binding properties of AtSCS-A (Bucholc et al., 2011).
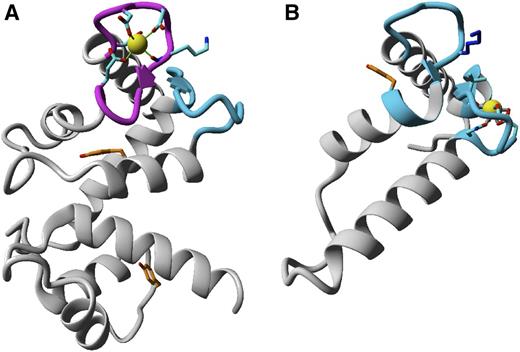
Structures modeled by homology of N-terminal (residues 26–175; A) and C-terminal (residues 251–330; B) parts of AtSCS-A. The ribbon representation follows the protein backbone. In magenta and blue are marked peptides predicted, respectively, as canonical or noncanonical EF-hand calcium binding loops. Residues putatively involved in calcium binding are denoted by sticks; yellow spheres represent calcium ions. Tyr residues are labeled by orange color.
Finally, it should be mentioned that both Tyr residues (Tyr-80 and Tyr-139, orange in Fig. 6A) are buried, and fluorescence of Tyr-80 should be affected by calcium binding—which is in agreement with our results of the analysis of AtSCS-A in respect of changes in fluorescence upon binding of calcium.
C-Terminal Domain of AtSCS-A/AtSCS-B
There were no appropriate templates for the C-terminal fragment (residues 331–378). The best model for the fragment defined by residues 211–330 was based on 1PRW, and no further improvement was achieved for the hybrid models. However, detailed inspection of the alternative highly scored models (e.g. based on 1QTX or 4AQR) clearly shown that only the fragment covering residues 251N–A330 could be reasonably modeled, while the homology-modeled structure of 211–250 critically depends on the template protein used. The subsequently built hybrid model for 251N–A330 was based on 3TZ1, with some parts improved using alternative models based on 1QTX, 1RFJ, 3WFN, and 1PRW. The resulting structure represents pairs of EF-hand–like motifs, one of which (313NGDDGNVVKEEE324) may display propensities toward binding of calcium via side-chain oxygen atoms of N313, D315, and E324, and backbone carbonyl groups of G317 and V319, the affinity of which must be expected to be much lower than that for N-terminal part of the protein. This loop is putatively paired with (267PKDRQGKVSKGY278), the sequence of which precludes any interaction with calcium (Fig. 6B). It should be noted that the side chain of K273 might interact with the 313NGDDGNVVKEEE324 loop, thus mimicking the calcium-loaded EF-hand state.
Our HDX data indicate interplay between the N-terminal part of AtSCS-A (containing the canonical EF-hand motif) and the C-terminal part (containing only EF-hand–like motifs). Both domains seem to be structurally coupled in AtSCS-A, and strong structuring of the N-terminal region of the AtSCS-A upon Ca2+ binding affects this interaction. Calcium-induced structuring of the AtSCS-A N-terminal domain may influence the dynamics of distant parts, which are already well structured in the apo form (Fig. 5D). It is possible that the small changes observed in the C-terminal fragment of AtSCS-A upon binding of calcium do not indicate direct calcium binding to this domain, but may originate from an allosteric transmission caused by the calcium binding to the canonical site in the N-terminal domain. Fragment 325–337 FKKTMAEILGSIM, whose stability in AtSCS-B is nearly independent of the presence of Ca2+, is definitely less stable in AtSCS-A apo, and is even much more destabilized in AtSCS-A in the presence of calcium ions (Fig. 5D; Supplemental Figs. S6 and S7). In contrast, the region 278–283 YLRAVL (Supplemental Figs. S7 and S8) in AtSCS-A in the presence of Ca2+ becomes stabilized, and at least in 1 min of exchange resembles this fragment within AtSCS-B.
According to the model, the first calcium-binding domain (canonical EF-hand motif) forms a classical helix–turn–helix structure with helices 26–40 and 57–63 (Fig. 6A). This model agrees well with the HDX data. In the presence of Ca2+, regions characterized by the strongest retardation of H/D exchange cover the 28–62 fragment (representing the canonical EF-hand motif), and additionally the 85–115 one, where the EF-hand–like motif is predicted. The helices of canonical EF-hand and noncanonical EF-hand exhibit similar H/D exchange patterns, with a strongly retarded exchange in the presence of Ca2+ with the exception of the helix at 77–87, where H/D exchange is much faster. The model predicts proximity of the canonical EF-hand motif and the noncanonical one. For the canonical EF-hand motif, the lowest level of H/D exchange is observed within loop 41–56 constituting Ca2+ binding sites; for noncanonical EF-hand, the lowest level of H/D exchange refers to fragment 101–106 within helix 99–117 (Fig. 5D; Supplemental Figs. S7 and S8).
Modeling of the region 250–330 predicts the existence of four helices (252–256, 275–287, 297–313, and 321–326; Fig. 6B). Indeed, in the HDX experiment there is significant retardation in H/D exchange within helix 252–256, 275–287, 297–313, and 321–326 (Fig. 5D; Supplemental Fig. S8). The structural model predicts direct contact between helices. HDX technique confirms the stability of these regions, consistent with the modeled interaction between adjacent helices, which should significantly stabilize the network of hydrogen bonds and create a connected and coherent structure (Fig. 6B).
DISCUSSION
Depending on a variety of environmental cues, plants trigger appropriate responses from among diverse signaling pathways, activating specific defense mechanisms and adjusting plant development to new conditions. SnRK2 kinases play a key role in the regulation of the ABA-dependent development and responses to water deficit, as well as several other stresses. They are known as calcium-independent enzymes; however, several data indicate their interplay with calcium signaling pathways. Calcium-dependent kinases, CIPKs, together with SnRK2.6, phosphorylate and regulate activity of NADPH oxidase (respiratory burst oxidase homolog F; Sirichandra et al., 2009 and Han et al., 2019), whereas CDPKs along with SnRK2s activate the guard cell S-type anion channel in response to ABA (Geiger et al., 2010; Brandt et al., 2012). Importantly, in the snrk2.2/snrk2.3/snrk2.6 knockout mutant, the Ca2+-dependent S-type anion channel regulation was impaired (Brandt et al., 2015), indicating interconnection between SnRK2s and calcium signaling pathways. Furthermore, in 2003, Harmon predicted that calcium could somehow regulate SnRK2s (Harmon, 2003); C-terminal parts of SnRK2 kinases are rich in acidic amino acids, and those can be potentially involved in Ca2+-binding. Our previous results showed that indeed Ca2+ added to SnRK2s slightly affected their kinase activity (Bucholc et al., 2011). However, a much more significant Ca2+-dependent effect on their activity arises via their cellular inhibitory partner, SCS, a calcium sensor (Bucholc et al., 2011).
Our present results show that, in Arabidopsis, due to alternative TSSs, two forms of AtSCS are expressed—AtSCS-A and AtSCS-B. They encode proteins that differ only in the N-terminal region; AtSCS-B is thus a shorter version of AtSCS-A in which the first 110 amino acids are missing. This region includes the classical EF-hand and the first EF-hand–like motifs. The basic properties of AtSCS-A have been described by Bucholc et al. (2011). Now, we analyzed biophysical and biochemical features of AtSCS-B, and performed detailed comparative studies of both proteins in respect to their conformational dynamic with and without calcium, inhibition of the SnRK2 activity, and their role in the plant response to water deficit.
The data presented here indicate that only AtSCS-A can play a role as a calcium sensor. The calcium-binding constant of this protein as determined previously by the protein fluorescence titration was 2.5 (±0.9) × 105 M−1, corresponding to a dissociation constant of 4 μm (Bucholc et al., 2011). The calcium binding induces significant conformational changes of the protein as revealed by CD spectroscopy and HDX-MS analysis, indicating a possible function of AtSCS-A as a calcium sensor in plant cells. In vitro studies demonstrate the SnRK2 inhibition by AtSCS-A occurs only in the presence of calcium. On the other hand, the inhibition by AtSCS-B is calcium-independent. Our data showed that even though AtSCS-B binds calcium ions, the binding is two orders-of-magnitude weaker than that for AtSCS-A and there are no conformational consequences of the calcium binding. The inhibition of the SnRK2 activity by both AtSCSs indicates that for that regulation is responsible the region, which is present in AtSCS-A and AtSCS-B. The primary structures of both proteins in the common region are identical; the question then appears to be why AtSCS-A requires Ca2+ for the inhibition and AtSCS-B does not. The mechanism of the SnRK2 inhibition by SCS is still an open question and needs further study, but the conformational dynamics of both AtSCSs in the presence and absence of calcium ions sheds light on calcium dependence on the SnRK2 inhibition in the case of AtSCS-A. Our results showed clearly that the domain common to both variants, i.e. the C-terminal fragment of AtSCS-A, is much less stable in the longer form than in the shorter form. HDX-MS and CD analysis indicate that, in AtSCS-B, this region forms stable structures independent of calcium, with no significant increase in stability in the presence of calcium. In AtSCS-A, the N- and C-terminal segments, though distant in sequence, are structurally coupled, so the C-terminal part has properties distinct from those of AtSCS-B. In AtSCS-A, the dynamics of the elements of the C-terminal domain become calcium-sensitive, unlike in AtSCS-B, where calcium-induced changes are negligible. Binding of calcium destabilizes region 321–340 in the C-terminal domain while it reverses the destabilization of the loop of the predicted third EF-hand–like motif (267–278) and the flanking region (278–283). In the presence of calcium ions, the conformational dynamics of this fragment becomes similar to that of the same region in AtSCS-B. Based on these data, we predict that the third EF-hand–like motif in AtSCS-A and the motif corresponding to this region in AtSCS-B are probably critical for inhibition of the SnRK2 activity. The conformation of this region required for the kinase inhibition is the one that is present in AtSCS-B (independent of calcium), but which in AtSCS-A requires the presence of calcium. This would explain why AtSCS-A needs calcium ions for the inhibition, whereas AtSCS-B does not.
Moreover, our HDX-MS results show interesting data on the cooperation of Ca2+ binding by canonical and noncanonical EF-hand motifs. Upon calcium binding, the region of the predicted calcium-binding loop of the classical EF-hand motif present in AtSCS-A and adjacent regions become much more stable (HDX-MS data), and the overall structure becomes more helical (CD data). Interestingly, according to HDX results, the segment 85–115 (predicted putative EF-hand–like motif with very low identity with the canonical motif) also undergoes significant stabilization in response to Ca2+ addition. The changes in deuterium uptake after Ca2+ addition in this region were similar to those observed for the canonical motif. It is plausible that the changes observed in the noncanonical motif are not a result of calcium binding in this region, but they are an indirect effect of calcium binding at the canonical site. The vast majority of EF-hand motifs (and almost all fully functional ones) exist in pairs, usually structurally coupled by a short β-sheet (β-scaffold) that maintains a direct contact between metal ion-binding loops (for a review, see Nelson and Chazin, 1998). It is possible that the noncanonical motif cooperates with the canonical motif in calcium ion binding and plays a role of a structural scaffold, influencing the properties of the canonical site. The HDX-MS technique is not able to distinguish between conformational changes resulting from direct ligand binding or allosteric effects triggered by an interaction in a different part of the molecule.
Finally, we analyzed the effect of AtSCS-A and AtSCS-B on plant response to stress using a transgenic approach. We generated transgenic Arabidopsis plants expressing AtSCS-A-c-myc or AtSCS-B-c-myc in the scs-1 knockout mutant background. We did not observe any significant differences among the plants of the transgenic lines, the wild-type plants, and the scs knockout mutants grown in optimal conditions. Because SnRK2s are key regulators of the plant response to water deficit (Fujii and Zhu, 2009; Fujita et al., 2009; Nakashima et al., 2009), we analyzed the effect of AtSCS-A and AtSCS-B in the plant response to dehydration. The results showed that both forms of AtSCS are involved in response to this stress; the scs mutants were more resistant to dehydration than the wild-type plants and plants expressing AtSCS-A-c-myc or AtSCS-B-c-myc. We did not observe significant differences between the transgenic lines expressing one or another form of AtSCS. The only difference we observed was a less pronounced effect of AtSCS-B than that of AtSCS-A; only in the line B12, in which the expression of AtSCS-B was very high, we observed inhibition of the SnRK2 activity and a meaningful effect on the dehydration response. Importantly, the expression of each of the forms was not able to fully compensate the scs mutation, suggesting that both forms are involved in the regulation and their role is not fully overlapping. We obtained similar results using two independent assays—the drought tolerance test and water loss in detached rosettes. Based on observed differences in the localization of SnRK2-AtSCS-A and SnRK2-AtSCS-B complexes in planta (BiFC assays), we can speculate that both AtSCS forms might regulate phosphorylation of diverse proteins in plant cells. It should be noted that the effect of both AtSCSs on the plant response to water withdrawal is similar to but less pronounced than the effects of clade A phosphatases, which are considered the major negative regulators of the SnRK2s activity.
The analysis of the kinase activity in the transgenic plants showed that both SCSs inhibit the ABA-responsive SnRK2s. Still, we cannot exclude that AtSCS-A also inhibits the ABA-nonresponsive SnRK2s, because AtSCS-A in contrast to AtSCS-B interacts not only with the ABA-activated SnRK2s but also with the kinases of group 1, which are not activated by ABA. However, the evolution studies performed by Holappa et al. (2017) have shown that SCS proteins appeared in the earliest land plants at about the same time as the ABA receptors Regulatory Component of ABA Receptor/Pyrabactin Resistance1/PYR1-like, PP2Cs, and ABA-activated SnRK2s (from group 3) that constitute the prototype of the SnRK2 family (Umezawa et al., 2010; Komatsu et al., 2013; Shinozawa et al., 2019). The ABA-nonresponsive SnRK2s evolved later, in vascular plants. Thus, the ABA-activated SnRK2s, ABA receptors Regulatory Component of ABA Receptor/Pyrabactin Resistance1/PYR1-like, PP2Cs, and SCSs seem to consist of ancient regulatory modules of ABA signaling, allowing adaptation to a terrestrial environment.
CONCLUSION
Our studies showed that two isoforms of ASCSs (AtSCS-A and AtSCS-B) are expressed in Arabidopsis. They differ significantly in their expression profiles, calcium binding properties, and conformational dynamics. Both of them inhibit the activity of the ABA-activated SnRK2s and regulate the plant response to water deficit similar to the clade A PP2C phosphatases, although the effect of AtSCSs is not as strong as the one observed in the case of the phosphatases. Moreover, the results provide information on calcium binding properties and conformational dynamics of EF-hand and EF-hand–like motifs present in plant proteins. This extends our knowledge on proteins involved in fine-tuning of the SnRK2 activity in stress signaling in plants, connecting calcium-independent and calcium-dependent pathways.
MATERIALS AND METHODS
Plant Materials, Growth Conditions, and Stress Treatments
Arabidopsis (Arabidopsis thaliana) lines used in this study comprised Col-0 as the wild type background and the following the transfer DNA insertion lines: scs-1 (Salk_051356) and scs-2 (Salk_104688) as described in Bucholc et al. (2011); snrk2.6 (Salk_008068) obtained from the Nottingham Arabidopsis Stock Centre (http://nasc.nott.ac.uk); double mutant snrk2.2/2.3 (GABI-Kat 807G04/Salk_107315) provided by Jian-Kang Zhu (Purdue University); a quadruple knockout mutant snrk2.1/2.4/2.5/2.10 (SAIL_519_C01/Salk_080588/Salk_075624/WiscDsLox233E9) described by Maszkowska et al. (2019); and double mutant abi1-2/pp2ca-1 (Salk_72009/Salk_28132) obtained from Pedro L. Rodriguez (Instituto de Biologia Molecular y Celular de Plantas). The seeds of Arabidopsis were grown under long-day conditions (16-h-light/8-h-dark photoperiod) at 22°C/18°C in soil or in hydroponic culture (Araponics System) as described by Kulik et al. (2012). For expression analysis of AtSCS-A and AtSCS-B in response to ABA or salt, plants were grown at 21°C/21°C under midday conditions (12-h-light/12-h-dark cycle) for 2 weeks in hydroponic culture and seedlings were either mock-treated or with 10-μm ABA or 150-mm NaCl, respectively, at specific times. After treatment plants were collected, frozen in liquid nitrogen, and stored at −80°C until analyzed. For aseptic cultures, seeds were sterilized in 70% ethanol for 2 min, then in 10% (v/v) sodium hypochlorite solution for 20 min. After sterilization, the seeds were extensively washed with sterile water. Seeds were stratified in the dark at 4°C for 3 d. For transient expression experiments, protoplasts were isolated from Arabidopsis T87 cells grown in Gamborg B5 medium as described by Yamada et al. (2004), 6 d after subculturing.
AtSCS-A and AtSCS-B Expression Analysis in Arabidopsis
AtSCS-A and AtSCS-B expression was analyzed by two-step reverse transcription quantitative PCR. Total RNA was extracted from Arabidopsis seedlings or different organs using a GeneJet Plant RNA purification mini kit (Thermo Fisher Scientific) and treated with a RapidOut DNA removal kit (Thermo Fisher Scientific). The efficiency of DNA removal was monitored by PCR with primers for PP2A (Supplemental Table S1). First-strand cDNA synthesis was performed using 1.5 μg of total RNA with oligo(dT)18 primer and a RevertAid First Strand cDNA synthesis kit (Thermo Fisher Scientific) according to standard manufacturer’s protocol. Relative expression levels were determined by quantitative PCR in a LightCycler 480 Roche device, using SYBR GREEN mix (Roche). For each target gene amplification, two gene-specific primers were used (listed in Supplemental Table S1) and all cDNA samples (three replicates) and standards (two replicates) were assayed in a single run. Relative gene expression in each sample was calculated using a standard curve method (5-point), normalized using geometric mean-of-expression values for two reference genes (PDF2 and UBC21) and scaled to the calibrator sample (Col-0 control).
Expression of Recombinant Proteins
Expression of recombinant proteins in Escherichia coli was performed as described in Bucholc et al. (2011). cDNA encoding AtSCS-B or fragment of ABF2 (Gly-73 to Gln-120) was PCR-amplified using appropriate primers (listed in Supplemental Table S1) and cloned into pGEX-4T-1 vector (GE Healthcare Life Sciences). The PCR reaction was performed using a high-fidelity Pfu DNA polymerase (Stratagene) and verified by sequencing.
Purification of Recombinant Proteins
All recombinant proteins were purified using glutathione-sepharose beads (GE Healthcare Life Sciences) as described by Bucholc et al. (2011). To obtain highly purified AtSCS-A and AtSCS-B proteins, the last step of purification was reverse-phase HPLC on an analytical ACT C18 column (ACE; for analysis of calcium binding) or Mono Q column (GE Healthcare Life Sciences) using an FPLC system (GE Healthcare Life Sciences). Purity of the proteins was analyzed by SDS-PAGE and electrospray ionization mass spectrometry on a Micromass Q-TOF spectrometer (Micromass). GST-ABF273-120 fusion protein after purification using glutathione-sepharose beads (GE Healthcare Life Sciences) was precipitated with chloroform/methanol according to Wessel and Flügge (1984) and resolubilized in 10-mm Tris-HCL at pH 8.8 and 0.1% (w/v) SDS.
Protein Kinase Activity Assays
The kinase activity assay in solution was performed as described by Bucholc et al. (2011).
In-gel kinase activity assays were performed according to Wang and Zhu (2016) with some modifications. Proteins were extracted from 14-d–old seedlings grown in hydroponic culture in flasks that were either mock-treated or with 100 μm of ABA and 350 mm of NaCl for 0, 30, and 60 min. Plant materials from wild-type (Col-0) and different mutant lines were ground in liquid nitrogen and sonicated three times in the buffer (50 mm of HEPES-KOH at pH 7.5, 5 mm of EDTA, 5 mm of EGTA, 2 mm of DTT, 25 mm of NaF, 1 mM of Na3VO4, 50 mm pf β-glycerophosphate, 10,% [v/v] glycerol, 1 mm of PMSF, and 1× protease inhibitor cocktail [Roche], and 1× PhossSTOP [Roche]). Proteins (40 μg/lane) in Laemmli buffer (without boiling) were separated on a 10% SDS-PAGE containing 0.25 mg/mL of GST-ABF2Gly-73-Gln-120 or 0.5 mg/mL of MBP (Sigma-Aldrich) as a kinase substrate. The gels were run overnight at 30 V and next washed for 3 × 30 min at room temperature (RT) in SDS removal buffer (25 mm of Tris-HCl at pH 7.5, 0.5 mm of DTT, 5 mm of NaF, 0.1 mm of Na3VO4, 0.5 mg/mL of BSA, and 0.1% [v/v] Triton X-100). After that, the gels were incubated in renaturing buffer (25 mm of Tris-HCl at pH 7.5, 1 mM of DTT, 5 mm of NaF, and 0.1 mm of Na3VO4) for 2 × 30 min at RT, overnight at 4°C and 1 × 30 min at RT. After 30 min of incubation at RT in cold kinase reaction buffer (25 mm of Tris-HCl at pH 7.5, 1 mm of EGTA, 30 mm of MgCl2, 2 mm of DTT, and 0.1 mm of Na3VO4), the gels were incubated in 10 mL of hot kinase reaction buffer supplemented with 50 μCi of [Ĉ-32P] ATP for 5 min at RT followed by addition of 20 μM of cold ATP for 90 min at RT. The reaction was stopped with “stop” washing solution (5% [w/v] TCA and 1% [w/v] sodium pyrophosphate). After extensive washing with washing buffer, the gels were stained with Coomassie Brilliant Blue R250 (Thermo Fisher Scientific), dried, and exposed to autoradiography.
Yeast Two-Hybrid and BiFC Assays
Yeast two-hybrid analysis was carried out as described by Bucholc et al. (2011). The cDNAs encoding SnRK2s were cloned into pGBT9 vector (Clontech) and AtSCS-A or AtSCS-B were cloned into pGAD424 (Clontech). Primers used for cloning are listed in Supplemental Table S1.
For subcellular localization analysis, coding sequences for AtSCS-A and AtSCS-B were introduced into pSAT6-EGFP-N1 or pSAT6-EGFP-C1. For BiFC assays, constructs for SnRK2s expression were prepared in pSAT4-nEYFP-C1 and AtSCS-A or AtSCS-B in pSAT1-cEYFP-N1, respectively. For negative control, AtSCS-B-cEYFP (in pSAT1-cEYFP-N1) was coexpressed with AtSCS-B-nEYFP (in pSAT1-nEYFP-N1). The pSAT vectors were provided by Prof. T. Tzfira (Tzfira et al., 2005). Primers are listed in Supplemental Table S1. Subcellular localization and BiFC analyses were performed as described by Bucholc et al. (2011). Subcellular localization of the EGFP fusion proteins and EYFP fluorescence after complementation were evaluated using a model no. C1 confocal system built on a model no. TE2000E inverted microscope (Nikon) and equipped with a 60×/1.4 NA Plan-Apochromat oil immersion objective (Nikon). EGFP and EYFP were excited with a Sapphire 488-nm laser (Coherent) and observed using the 515/530 emission filter. For publication, single optical sections with distinctly visible nucleus and nucleoli were selected to ensure that similar focal planes were compared for all tested variants. Images were processed using the software EZ-C1 Free Viewer (v3.90; Nikon).
Calcium Ion Binding Analysis
For calcium binding analysis, the recombinant proteins were purified by reverse-phase HPLC on an analytical ACT C18 column (ACE); their purity was estimated by electrospray ionization mass spectrometry. Protein concentration was determined from UV absorption at 280 nm, using the molar extinction coefficients of 10,500 m−1 cm−1 and 9,300 m−1 cm−1 for AtSCS-A and AtSCS-B, respectively, as calculated for one Trp and three Tyr residues (AtSCS-A) or one Trp and two Tyr residues (AtSCS-B; Mach et al., 1992). The UV absorption spectra were measured on a Cary 3E spectrophotometer (Varian) in thermostated cells of 10-mm path length. A total of 20-mm Tris buffer at pH 7.4, with 100 mm of NaCl, was used as a solvent for the calcium binding experiments. All measurements were performed at 20°C.
Fluorescence Measurements
The protein fluorescence was measured on an Cary Eclipse fluorimeter (Varian). Spectra were collected with an average time of 2 s for each point and a step size of 0.5 nm from 295 (or 305) to 450 nm. In fluorescence titration experiments, small aliquots of concentrated calcium chloride solution were added until the protein fluorescence no longer changed. The measurements were performed at least three times. All protein solutions used in the fluorescence titration experiments were checked for possible calcium contamination by comparing the protein fluorescence signals in the presence and absence of calcium chelator (100 μm of EGTA).
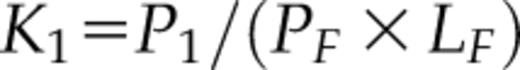
Calcium Ion Binding Constant
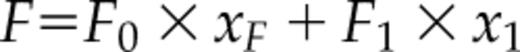
where F0 and F1 are fluorescence of the protein without and with the ligand, respectively. The xF and x1, are mole fractions of free protein (PF, no ligand bound) relative to total protein (P0), xF = PF/P0, and ligand-bound protein (P1), x1 = P1/P0, respectively. The two mole fractions sum to one: xF + x1 = 1.
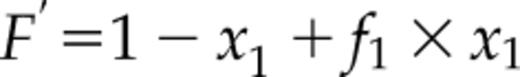
The equation is analogous with that of Equation 8 in Eftink (1997) describing single-site ligand binding, where the variables are F′ (from experimental measurements), L0 = total ligand concentration, P0 = protein concentration, K1 = the ligand binding constant, and f1 = relative fluorescence signal. Here, the ligand is the Ca2+ ion. The parameter values were determined by least-square fitting of theoretical curves to experimental data using the program NiceFit (http://pracownie1.fuw.edu.pl/optometria/).
CD Measurements
CD experiments were carried out at 20°C on a model no. J-815 spectropolarimeter (Jasco) with a 10-mm path-length cuvette. The protein solutions (close to 2 μm) were prepared in 5 mm of Tris buffer at pH 7.4, with 100 mm of NaCl. CD spectra were collected twice with an average time of 2 s for each point and a step size of 1 nm from 200 to 270 nm. All spectra were corrected against the buffer. The data were converted to molar residue ellipticity using the relationship [Ǝ]= θ/(10 × n × l × c), where [Ǝ] = molar residue ellipticity in (degree cm2 dmol−1); θ = observed ellipticity in millidegrees; n = the number of amino acid residues in the protein; l = the path length in centimeters; and c = protein concentration in molar.
The secondary structure content of the proteins was estimated using the program CDNN (a CD spectroscopy deconvolution software; Böhm et al., 1992).
H/D Exchange Coupled to Mass Spectrometry
The HDX-MS was performed as described in Sitkiewicz et al. (2013), with minor modifications. Initially, the list of peptides was established by diluting each analyzed protein to 5–10 μM in a nondeuterated buffer (50 mm of Tris at pH 7.4 and 150 of mm NaCl). Each sample (50 μL) was acidified by adding 10 μL of “stop” buffer (2 m of Gly at pH 2.5, 150 mM of NaCl, and 4 M of GuHCl) and then injected into a nanoACQUITY UPLC system (Waters) equipped with an HDX Manager system (Waters) with the column outlet coupled directly with a SYNAPT G2 HDMS mass spectrometer (Waters). Rapid online digestion on an immobilized pepsin column (Poroszyme; Applied Biosystems) was performed at a flow of 200 μL/min. Peptides were captured on a trapping BEH C18 1.7-mm, 2.1 × 5-mm Vanguard Pre-Column (Waters) and separated by 1.0 × 100-mm BEH C18 1.7-mm Analytical Reversed Phase Column (Waters) with a gradient of 8% to 40% (v/v) acetonitrile (0.1% [v/v] formic acid) in 6 min at a flow of 40 μL/min. All capillaries, valves, and columns were maintained at 0.5°C inside a HDX cooling chamber, while the pepsin column was kept at 13°C inside the temperature-controlled digestion compartment. Mass spectra were acquired in MSE mode over the m/z range of 50–2,000 both with and without ion mobility separation. Spectrometer ion source parameters were as follows: electrospray ionization positive mode; capillary voltage 3 kV; sampling cone voltage 35 V; extraction cone voltage 3 V; source temperature 80°C; desolvation temperature 175°C; and desolvation gas flow 800 L/h. Infusion and scanning every 30 s of leu-enkephalin (556.277 m/z) was used for continuous lock mass correction. Rigorous washing steps were performed between each injection. The peptides were identified with the software ProteinLynx Global Server (Waters) using a randomized database and with a false discovery rate threshold = <4%.
Deuterium labeling was initiated with a 10-fold dilution of the protein sample into a buffer containing 50 mm of Tris at pH 7 (uncorrected meter reading), 150 mm of NaCl and 5 mm of CaCl2, or 5 mm of EGTA in 99.8% heavy water (Cambridge Isotope Laboratories). After a specified time (10 s, 1 min, 20 min, 60 min) the labeling reaction was quenched by adding “stop” buffer and then the sample was immediately snap-frozen in liquid nitrogen and stored at −80°C until analyzed. Quenched samples were rapidly thawed and injected into a nanoACQUITY LC system (Waters) equipped with HDX Manager (Waters) coupled directly with a SYNAPT G2 HDMS mass spectrometer (Waters). “Out” controls of back-exchange level were performed by incubation of the protein in heavy water buffer for 48 h to obtain maximum exchange for each peptide. The experimental maximum is always lower than the maximal theoretical exchange due to a certain degree of back-exchange. Each experiment was repeated at least three times and the results represent the mean of all replicates.
Data Analysis

where (Mex 0) and (Mex 100) = average peptide mass measured in the unlabeled sample and mass from “out” control, respectively. Error bars for fraction exchanged represent sds calculated from at least three independent experiments. The difference in the fraction exchanged (Ɗ fraction exchanged) was calculated by subtracting the fraction-exchanged values for peptides in the selected state from the values for the same peptides in the control state. The error bars were calculated as the square root of the sum of the variances from compared states. Student’s t test for two independent samples with unequal variances and unequal sample sizes (also known as Welsh’s t test) was carried out to evaluate differences in fraction exchanged between the same peptides in two different states.
Construction and Selection of Transgenic Arabidopsis Plants
To generate the transgenic lines in scs-1 background, coding sequences for AtSCS-A and AtSCS-B were cloned into pENTR-d/TOPO vector (Thermo Fisher Scientific) and then the cDNAs were recombined by Gateway LR reaction into pGWB617 destination vector (Nakamura et al.,2010). The pGWB617-AtSCS-A and pGWB617-AtSCS-B constructs were transformed via Agrobacterium tumefaciens strain GV3101 into mutant background scs-1 by the floral dip method as described by Clough and Bent (1998) and Zhang et al. (2006). The selection of the transgenic lines was performed by spraying soil-grown seedlings with 0.033% (v/v) BASTA (BASF) solution supplemented with 0.01% (v/v) Silwet l-77 (Momentive) at 7 and 9 d after germination. Recombinant proteins were confirmed by western-blot analysis using a c-Myc monoclonal antibody (9E10; Santa Cruz Biotechnology) according to the protocol recommended by the manufacturer.
Rosette Water Loss Measurement
The Arabidopsis plants of the appropriate genotype were grown for 6 weeks under short-day conditions (8-h light at 22°C/16-h dark at 20°C) in a plant growth incubator chamber (CLF PlantClimatics) and watered copiously 1 d before harvest. The Cut Rosette Water Loss was determined as described by Bouchabke et al. (2008) with minor modifications. Freshly cut rosettes were weighed immediately, incubated in windless conditions under constant temperature (22°C to 24°C) and weighed five times hourly. After overnight drying at 70°C to a constant mass, the rosettes were weighed for dry mass, and water loss was calculated.
Drought Tolerance Test
The Arabidopsis plants were grown in pots (∼50 plants per pot) for 17 d under long-day conditions (16-h light at 22°C/8-h dark at 20°C) and for an additional 2 weeks without watering. After that time, the plants were watered. Photographs were taken before rewatering and 2 d after rewatering.
Modeling of AtSCS-A/B Structure
Because no structures of AtSCS variants have been available in the PDB, they were modeled by homology using algorithms implemented in the software Yasara (Krieger et al., 2002, 2009). In every round of modeling, 12 protein structures sequentially close to the target were used as initial templates. For each template, up to five alternative alignments with the target sequence were used, and up to 50 different conformations were tested for each loop being modified. The resulting models were individually scored according to their structural quality (dihedral distribution, backbone, and side-chain packing), and those with the highest scores were further used to form a hybrid model, which was built using the best fragments (e.g. loops) identified among the single-template models. However, due to limited coverage with sequences of proteins with known structure, AtSCS-A has to be modeled as the two separate domains, the relative orientation of which remains unknown. In accordance with HDX-MS data, the N-terminal one covered residues 26–175, while the C-terminal corresponded to residues 211–330.
Accession Numbers
Sequence data from this article can be found in the GenBank (https://www.ncbi.nlm.nih.gov/genbank/) and European Bioinformatics Institute (EMBL-EBI; https://www.ebi.ac.uk/ena) databases under the following accession numbers: AY056249 (AtSCS); ABD85157 (AtSnRK2.1); BT025246 (AtSnRK2.2); BX830791 (AtSnRK2.3); BT008850 (AtSnRK2.4); AK318826 (AtSnRK2.5); AY081538 (AtSnRK2.6); CP002687 (AtSnRK2.7); BT020608 (AtSnRK2.8); BT003142 (AtSnRK2.9); BT002546 (AtSnRK2.10).
Supplemental Data
The following supplemental materials are available.
Supplemental Figure S1. AtSCS-A and AtSCS-B transcript levels in different organs.
Supplemental Figure S2. AtSCS-A-c-myc and AtSCS-B-c-myc protein levels in homozygous 35S::AtSCS-A-c-myc and 35S::AtSCS-B-c-myc transgenic plants.
Supplemental Figure S3. Analysis of expression of Rab18 and RD29B in Arabidopsis plants with different levels of AtSCS-A and AtSCS-B.
Supplemental Figure S4. Stoichiometry of the binding of calcium ions to AtSCS-B.
Supplemental Figure S5. Differences in the H/D exchange pattern in AtSCS-A and AtSCS-B upon Ca2+ binding.
Supplemental Figure S6. Differences in the H/D exchange pattern between AtSCS-A and AtSCS-B in common regions in the presence and absence of calcium ions.
Supplemental Figure S7. Kinetics of H/D exchange in AtSCS-A and AtSCS-B in the presence or absence of Ca2+.
Supplemental Figure S8. Model of N-terminal domain of AtSCS-A (region 16–119) and C-terminal domain of AtSCS-A and AtSCS-B (region 241–339) with overlaid H/D exchange results.
Supplemental Table S1. List of primers.
ACKNOWLEDGMENTS
We thank Dr. Olga Sztatelman (Institute of Biochemistry and Biophysics, Polish Academy of Sciences) for providing the pGBT9-SnRK2.3, pGBT9-SnRK2.7, pGBT9-SnRK2.9 plasmids, and the snrk2.1/4/5/10 knockout mutant. We are also grateful to Jian-Kang Zhu (Purdue University) and Pedro L. Rodriguez (Instituto de Biologia Molecular y Celular de Plantas) for sharing with us the snrk2.2/2.3 and abi1-2pp2ca-1 knockout mutants, respectively, and all members of our laboratory for stimulating discussions. We also thank the Nottingham Arabidopsis Stock Centre for providing the snrk2.6 mutant.
LITERATURE CITED
Author notes
This work was supported by the Norwegian Research Council and the Research Program of the EEA/Norway Grants (grant PolNor/203156/70/2013 to G.D. and R.A.E.), the National Science Centre (grants UMO-2011/01/B/NZ3/02899 to M.B., MAESTRO UMO-2014/14/A/NZ1/00306 to M.D., UMO-2016/23/B/NZ3/03182 to G.D., and UMO-2014/13/D/NZ3/03101 to A.K.), the Centre of Preclinical Research and Technology (POIG.02.02.00-14-024/08-00), and the National Multidisciplinary Laboratory of Functional Nanomaterials (POIGT.02.02.00-00-025/09-00).
Articles can be viewed without a subscription.
These authors contributed equally to the work.
Present address: Norwegian Ice Service, Norwegian Meteorological Institute, Kirkegårdsveien 60, NO-9023 Tromsø, Norway.
Senior authors.
The author responsible for distribution of materials integral to the findings presented in this article in accordance with the policy described in the Instructions for Authors (www.plantphysiol.org) is: Maria Bucholc ([email protected]).
M.B., G.D., M.D., and R.A.E. supervised the experiments; K.T., M.K., M.B., A.C., G.G., H.F., J.P., M.L., A.K., and M.P. performed the experiments; M.B., G.D., M.K., K.T., G.G., and J.P. designed the experiments and analyzed the data; G.D., M.B., M.K., and R.A.E. conceived the project and wrote the article with contributions of all the authors; G.D. supervised and complemented the writing.
