


Abstract
Salinity impairs seed germination and seedling establishment. We investigated the role of Arabidopsis (Arabidopsis thaliana) CALMODULIN-BINDING TRANSCRIPTION ACTIVATOR 6 (CAMTA6) in salinity stress responses during early germination. Compared with the wild type, the camta6-4 and camta6-5 mutants were more tolerant to NaCl and abscisic acid (ABA) and accumulated less Na+. In contrast, 4- to 11-d-old camta6 seedlings were more sensitive to NaCl. In camta6, expression of HIGH-AFFINITY K+ TRANSPORTER1 (AtHKT1;1), encoding an Na+/K+ transporter, was restricted to the radicles and was not enhanced by NaCl or ABA. During germination, the camta6 hkt1 double mutant was as sensitive as the wild type and hkt1 to NaCl, suggesting that HKT1;1 is crucial for the salt tolerance of camta6. An ABA response element in the HKT1;1 promoter was found to be indispensable for the enhanced expression of the gene in response to NaCl and to ABA. Transcriptome analysis of the wild type and camta6-5 with and without salt treatment revealed 1,020 up-regulated and 1,467 down-regulated salt-responsive genes in the wild type. Among these, 638 up-regulated and 1,242 down-regulated genes were classified as CAMTA6-dependent. Expression of several known salt stress-associated genes, including SALT OVERLY SENSITIVE1 and Na+/H+ ANTIPORTER, was impaired in camta6 mutants. Bioinformatics analysis of the 5′ upstream sequences of the salt-responsive CAMTA6-dependent up-regulated genes revealed the CACGTGTC motif as the most prominent element, representing an ABA response element and a potential CAMTA-binding site. We suggest that CAMTA6 regulates, directly or indirectly, the expression of most of the salt-responsive genes in germinating seeds, including genes that are crucial for Na+ homeostasis and salt stress tolerance.
High salt concentrations in the growth medium arrest seed germination and impair seedling establishment. In view of the enhanced salinization of arable lands worldwide (Wang et al., 2003), there is an urgent need to better understand the mechanisms governing plant responses to salinity at this early stage of plant development. Moreover, crop production in marginal lands has been suggested to have great potential to mitigate food shortages and improve food security (Tester and Langridge, 2010). Arabidopsis (Arabidopsis thaliana) has been used as a model plant to elucidate the mechanisms underlying salinity stress responses (Zhu, 2000; Yang and Guo, 2018). Typically, exposing seeds to 75 mM NaCl or more in the growth medium significantly decreases the germination rate of wild-type (Columbia-0 [Col-0]) seeds (Xiong and Zhu, 2002). Subsequently, several Arabidopsis mutants were isolated based on their improved tolerance to high NaCl levels during germination: salt resistant (rs; Saleki et al., 1993), reduced salt sensitivity (Werner and Finkelstein, 1995), salobreno (san; Quesada et al., 2000), low expression of osmotic stress-responsive genes5 (los5), also referred as abscisic acid deficient3 (aba3; Xiong et al., 2001), and los6/aba1 (Xiong et al., 2002). Interestingly, the seeds of two alleles of rs (rs17 and rs20) accumulated less sodium ions (Na+), compared with wild-type seeds, when sown on medium containing 150 mM NaCl (Saleki et al., 1993), suggesting that the improved tolerance in these mutants is achieved, at least in part, by adjusting the Na+ levels, which allows germination under such unfavorable conditions. Prevention of excess Na+ accumulation in seedlings or mature plants could be achieved by reducing Na+ entry into the plant tissue to minimize transport to the shoot, which is more sensitive than the root (Munns, 2002; Essah et al., 2003; Shkolnik-Inbar et al., 2013), by compartmentation into the vacuoles of specific tissues (Apse et al., 1999), or by export of Na+ to the external medium (Shi et al., 2000, 2003). However, how Na+ transport systems are regulated and coordinated with seed metabolism and growth during germination remains to be elucidated.
The phytohormone abscisic acid (ABA) plays an essential role in abiotic stress responses during seed germination (Nakashima and Yamaguchi-Shinozaki, 2013). ABA levels were elevated dramatically in response to salt or osmotic stress (Ribaut and Pilet, 1991; Park et al., 2008; Zhang et al., 2016), which is required for activating a cascade of genes (Shinozaki and Yamaguchi-Shinozaki, 1997; Yuan et al., 2011). The reduced sensitivity to NaCl during germination of san5, an allele of the ABA-regulated APETALA2 (AP2) transcription factor (TF) abscisic acid insensitive4 (abi4), which is impaired in ABA perception (Finkelstein, 1994), and the ABA biosynthesis-defective aba1 and aba3 mutants suggests a salt tolerance mechanism that involves ABA signaling. However, numerous dehydration- and salt-induced genes were found not to be responsive to exogenous ABA treatment, suggesting the existence of ABA-independent signaling pathways (Yoshida et al., 2014). Moreover, the ability to germinate in the presence of relatively high NaCl concentrations does not mean that the developing seedlings will survive the stress (Saleki et al., 1993; Quesada et al., 2000).
Interestingly, abi4 seeds display improved tolerance to salinity during germination (Quesada et al., 2000) and maturity (Shkolnik-Inbar et al., 2013). ABI4 was found to limit Na+ transfer from the root to the shoot via the xylem, by direct negative regulation of the transcript level of the Na+/K+ transporter AtHKT1;1 (Shkolnik-Inbar et al., 2013). Indeed, in Arabidopsis, hkt1 seedlings are hypersensitive to salinity, a phenotype that was attributed to the role of HKT1;1 in unloading Na+ from the root vascular tissues, and thus limiting their accumulation in sensitive shoot tissues (Mäser et al., 2002; Rus et al., 2004; Sunarpi et al., 2005; Horie et al., 2006). In wheat (Triticum aestivum), improved tolerance to NaCl, associated with reduced Na+ uptake, was obtained by silencing the HKT1 gene by antisense RNA (Laurie et al., 2002), consistent with the suggested ability of AtHKT1;1 and wheat HKT1 to facilitate Na+ entry into plant cells (Gassman et al., 1996; Uozumi et al., 2000). Another important Na+ homeostasis regulator is the plasma membrane Na+/H+ antiporter SALT OVERLY SENSITIVE1 (SOS1; Shi et al., 2000, 2003). Nevertheless, how these and other transport mechanisms function in maintaining Na+ homeostasis during early germination in conjunction with other salt stress responses is currently not fully understood.
Calcium ion (Ca2+) was reported to promote salt tolerance during germination and in the early stages of seedling development of many plant species. It was suggested to improve the selectivity of potassium ion (K+) uptake as well as the K+/Na+ ratios when Na+ levels in the medium are high (LaHaye and Epstein, 1969, 1971; Bernstein et al., 1970; Kent and Läuchli, 1985; Bliss et al., 1986). NaCl induces a rapid elevation of cytosolic Ca2+ levels in root cells (Choi et al., 2016). Ca2+ functions as a second messenger that regulates the expression of many salt-responsive genes (Knight et al., 1997; Tracy et al., 2008) and modulates other cellular functions including Na+ transporters (Zhu, 2002). Bioinformatics analysis of transcriptome changes in response to artificially generated cytosolic Ca2+ transients revealed 230 Ca2+-responsive genes, with a high occurrence of ABA-related cis-regulatory elements in their upstream sequences: an ABA-responsive element (ABRE; CACGTG[C/T/G]) and its coupling element ([C/A]ACGCG[T/C/G]; Kaplan et al., 2006; Whalley and Knight, 2013). Therefore, the ABA and Ca2+ signaling pathways in response to abiotic stress, including salt, most likely merge at specific key points (Reddy et al., 2011).
Previously, while investigating the mechanisms of Ca2+ signaling under abiotic stress, a family of six genes encoding calmodulin (CaM)-binding transcription activators (CAMTAs; also referred to as SRs) was identified in Arabidopsis (Bouché et al., 2002; Yang and Poovaiah, 2002; Mitsuda et al., 2003; Finkler et al., 2007a; Doherty et al., 2009; Shen et al., 2015), all with similar DNA-binding domains. These genes were suggested to mediate responses to various external and hormonal stimuli, including abiotic stresses and ABA (Yang and Poovaiah, 2002; Finkler et al., 2007a). Similar CAMTAs are present in other plant species, including crops such as maize (Zea mays; Yue et al., 2015), tomato (Solanum lycopersicum; Li et al., 2014), rice (Oryza sativa; Choi et al., 2005; Rahman et al., 2016), and others. To date, in Arabidopsis, the major focus has been on investigating the roles of CAMTA1 (Kaplan et al., 2006; Galon et al., 2010; Kim et al., 2013; Pandey et al., 2013), CAMTA3 (Galon et al., 2008; Du et al., 2009; Laluk et al., 2012; Kim et al., 2013, 2017; Jacob et al., 2018), and to a lesser extent CAMTA2 (Kim et al., 2013, 2017) and CAMTA5 (Kidokoro et al., 2017), whereas the functions of Arabidopsis CAMTA4 and CAMTA6 remain unclear. In Medicago truncatula, overexpression of the CaM-like protein MtCML40 resulted in down-regulation of the expression of MtHKT1;1 and MtHKT1;2 (Zhang et al., 2019), both of which encode proteins associated with Na+ removal from the shoot, and caused enhanced sensitivity to salt at germination. Thus, Ca2+ signaling is involved in maintaining Na+ homeostasis during germination, partly by regulation of HKT1 expression. However, the TFs mediating the regulation of salt-responsive genes at early stages of germination have not been reported. The research presented herein reports on the importance of CAMTA6 (also designated SR3; At3G16940) in maintaining Na+ homeostasis in germinating Arabidopsis seeds by mediating both ABA-dependent and -independent signaling pathways, including the regulation of AtHKT1.
RESULTS
camta6 Mutants Display Reduced Sensitivity to Salt and ABA during Germination
In order to determine the germination behavior of camta6 mutants in the presence of NaCl, seeds of the wild type (Col-0) and two alleles of camta6 mutants (camta6-4 and camta6-5) were sown on 0.25× Murashige and Skoog (MS)/agar-solidified medium, supplemented with 0 (control) or 200 mm NaCl. When sown on 200 mm NaCl-containing medium, Col-0 seeds displayed a 1.7% ± 1.5% germination rate, in contrast to 46.3% ± 4.5% germination for camta6-4 and 30.3% ± 8% for camta6-5 (Fig. 1, A and B). All genotypes displayed germination rates of ∼100% when no NaCl was added to the medium (Fig. 1B). Alternatively, when sown on mannitol-containing medium, Col-0 and camta6 seeds showed similar germination rates (Supplemental Fig. S1), indicating that the camta6 salt-tolerance phenotype is not due to a general tolerance to osmotic stress. Complementation assays, performed by introducing a CAMTA6pro:CAMTA6-EGFP construct to camta6 mutants, resulted in full restoration of the sensitivity to 200 mm NaCl (Supplemental Fig. S2), confirming that the enhanced salt tolerance of the mutants is indeed due to the lack of active CAMTA6.
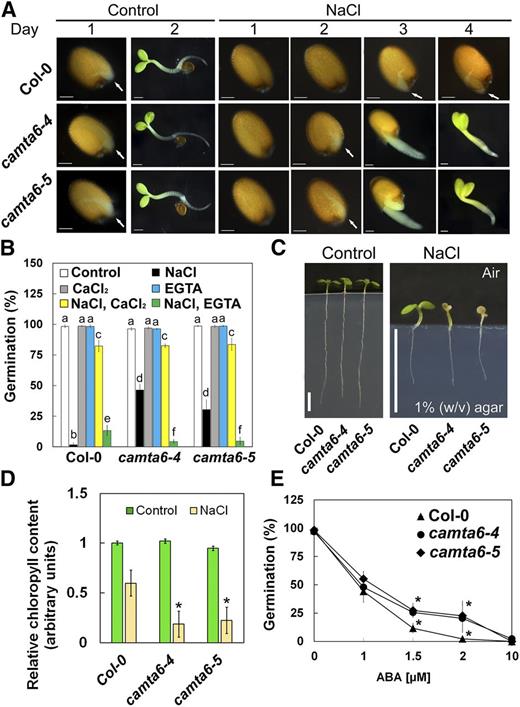
camta6 seeds display reduced sensitivity to NaCl and ABA during germination but enhanced sensitivity to NaCl in older seedlings. A, Photographs of germinating seeds of the wild type (Col-0), camta6-4, and camta6-5 on control (0.25× MS) medium and medium supplemented with 200 mm NaCl (days post 48 h of stratification are indicated). Arrows show the emerging radicles. Bars = 100 µm. B, The medium was supplemented with the indicated combinations of chemicals (NaCl, 200 mm; CaCl2, 10 mm; and EGTA, 1 mm), and germination rates were monitored 5 d after plating. Data represent means ± se (three biological independent experiments, ∼100 seeds each), and letters above the bars represent statistically different values by Tukey’s honestly significant difference post hoc test (P < 0.01). C, Three-day-old Col-0, camta6-4, and camta6-5 plants were transferred to 0 (control) or 250 mm-supplemented MS medium (see “Materials and Methods”). Images were taken 5 d following seedling transfer. Bars = 5 mm. D, Total chlorophyll was extracted from treated seedlings as described in A. E, The medium was supplemented with the indicated concentrations of ABA, and germination rates were monitored 5 d after plating. In D and E, *, P < 0.01, Student’s t test, versus Col-0. Data represent means ± se (four biological independent experiments, 10 seedlings each). In B and E, seed germination was scored 5 d post stratification.
To further study the effect of Ca2+ on germination in the presence of NaCl, Col-0 and camta6 seeds were sown on a medium supplemented with 10 mm CaCl2, or with 1 mm of the highly selective Ca2+ chelator EGTA, or with combined treatments of NaCl with CaCl2 or NaCl with EGTA. Interestingly, in the presence of CaCl2, the germination rate on NaCl-containing medium was similar for all genotypes (Fig. 1B; ∼83%), confirming the previously described effect of Ca2+ on improving salt tolerance during germination (Kent and Läuchli, 1985; Bliss et al., 1986). In contrast, the addition of EGTA increased seed sensitivity to NaCl, with a significantly more severe effect on camta6 seeds (Fig. 1B). As controls, the addition of CaCl2 or EGTA at the same concentrations, but without NaCl, did not impair seed germination (Fig. 1B).
To broaden our understanding of CAMTA6 function in NaCl stress tolerance, we examined camta6 mutants at later stages of development (4- to 11-d-old plants, grown on agar-solidified medium; see “Materials and Methods”), supplemented with 0 (control) or 250 mm NaCl (Fig. 1, C and D). Both camta6 alleles displayed hypersensitivity to NaCl compared with Col-0. Although root growth was similarly arrested in all lines, the shoots of camta6 seedlings appeared more wilted and bleached as a result of enhanced chlorophyll degradation in the presence of NaCl (Fig. 1, C and D). No significant phenotypic differences were observed among the three genotypes grown under control conditions (Fig. 1, C and D). Observation of 5- to 6-week-old, soil-grown plants revealed earlier senescence of rosette and cauline leaves of camta6 mutants compared with leaves of Col-0 (Supplemental Fig. S3, A–C). Interestingly, the phenotype of early senescence was more pronounced in cauline leaves (Supplemental Fig. S3, D and E), in agreement with data indicating highest mRNA levels of CAMTA6 in cauline leaves (Supplemental Fig. S3, F and G; http://bar.utoronto.ca/efp/cgi-bin/efpWeb.cgi).
To determine whether CAMTA6 activity is associated with ABA signaling during early germination, seeds of Col-0 and camta6 mutants were sown on medium supplemented with 0, 1, 1.5, 2, or 10 µm ABA. Seed germination of all genotypes in the presence of 0, 1, or 10 µm ABA was ∼100%, 50%, or 0%, respectively (Fig. 1E). However, in the presence of 1.5 or 2 µm ABA, the germination rate of Col-0 seeds was very low (∼10%), whereas both camta6 alleles maintained significantly higher germination rates, above 25% (Fig. 1E).
The phenotypes of Arabidopsis camta6 mutants at different stages of development, from germination to maturity, with or without NaCl or ABA, suggest various key roles of CAMTA6 in response to stress, phytohormone signaling, and development.
CAMTA6 Expression Is Enhanced by Salt during Germination
CAMTA6 (SR3) transcript levels were reported to be enhanced by salt in 3-week-old Col-0 plants (Yang and Poovaiah, 2002). Prasad et al. (2016) suggested that CAMTA3 (SR1) acts as a negative regulator of salt tolerance. However, the expression pattern during the early stages of germination, under control and salt stress conditions, has not been reported. Therefore, CAMTA6 transcript levels were first examined by reverse transcription quantitative PCR (RT-qPCR) in pregerminating Col-0 seedlings ejected from seeds that were treated with 200 mm NaCl for 16 h. CAMTA6 transcript levels rose by 2.3-fold and ∼2-fold in response to NaCl and ABA treatments, respectively (Fig. 2A). Examination of CAMTA6 promoter activity in planta, performed by GUS staining of pregerminated transgenic seedlings harboring the CAMTA6pro:GUS construct, showed significant increases of expression levels in response to NaCl and to ABA treatments compared with controls, mainly in the cotyledon margins (Fig. 2B). Enhanced expression levels of CAMTA6 in response to NaCl and ABA were confirmed by fluorometric GUS assays of seed extracts, showing ∼2-fold increase of CAMTA6 promoter activity following exposure to NaCl or to ABA (Fig. 2C), consistent with the RT-qPCR results. Thus, salt-enhanced expression of the CAMTA6 gene during germination is consistent with its involvement in the response to salt stress at this early developmental stage and at later stages (4–11 d old; Fig. 1, C and D).
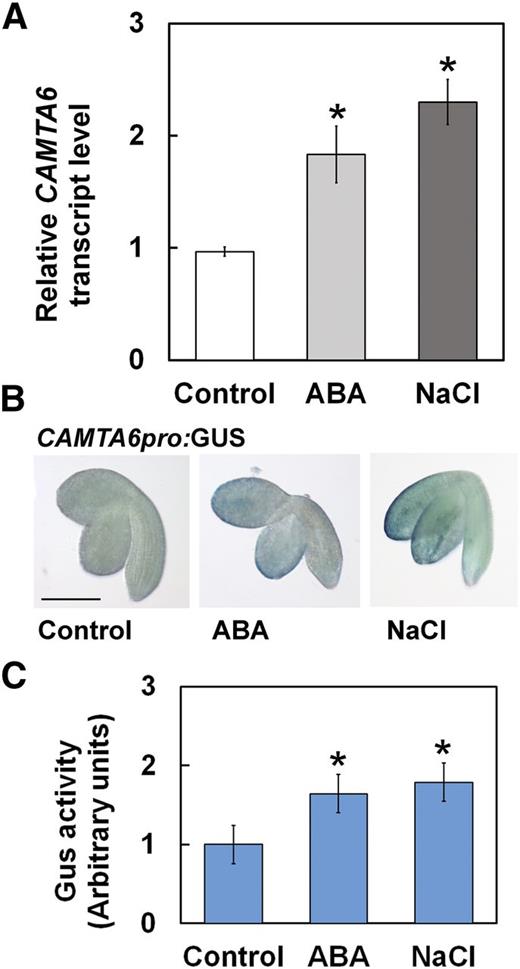
CAMTA6 expression is enhanced by NaCl and ABA. A, RT-qPCR analysis for relative CAMTA6 transcript quantification in pregerminated seedlings. Data represent means ± sd (three biological experiments, ∼30 seeds each). B, GUS staining of CAMTA6pro:GUS pregerminated transgenic seedlings. Bar = 1 mm. C, Fluorometric assay of the expression levels of GUS activity in CAMTA6pro:GUS pregerminated transgenic seedlings. The values were normalized versus the GUS activity in the control (designated as 1) and are presented in arbitrary units. Data represent means ± sd (three biological experiments, ∼20 seeds each). In A, B, and C, seeds were treated with 0 (control) or 200 mm NaCl or 10 µm ABA for 16 h prior to seedling ejection. In A and C, *, P < 0.01, Student’s t test, versus control.
camta6 Mutants Accumulate Less Sodium Ions during Germination under Salt Stress
One mechanism of salt tolerance relies on limiting Na+ accumulation in cells (Munns and Tester, 2008; Almeida et al., 2017). To quantify the Na+ accumulation in Col-0 and camta6 pregerminated seedlings, extracts of very young germinating seedlings that were ejected from seeds treated with 0 (control) or 200 mm NaCl for 16 h (as shown for day 1 in Fig. 1A) were analyzed for Na+ content by inductively coupled plasma optical emission spectrometry. Col-0 seedlings were found to accumulate 1.5 ± 0.2 µg of Na+ per seedling under control conditions and 2.9 ± 0.2 µg of Na+ per seedling when exposed to 200 mm NaCl during germination (Fig. 3). Interestingly, both camta6 alleles accumulated slightly (albeit not statistically significant) more Na+ than the wild type when sown on control medium (Fig. 3), whereas, strikingly, no increase in Na+ content was found in these mutants after salt treatment (Fig. 3). These data strongly suggest that CAMTA6 is involved in the regulation of factors that maintain Na+ homeostasis in germinating seedlings under salt stress. Moreover, the reduced accumulation of Na+ in the camta6 mutants may explain, at least in part, their higher tolerance to NaCl compared with the wild type.
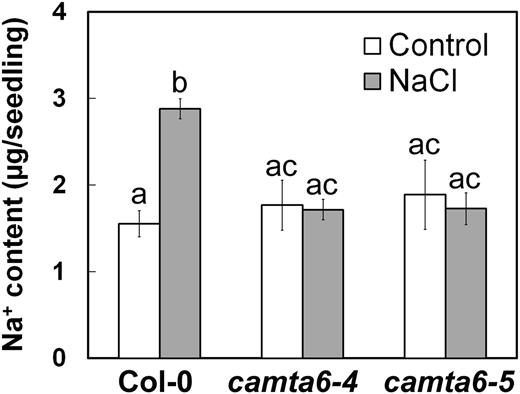
camta6 mutants accumulate less Na+ under salt stress conditions. Na+ content was determined as described in “Materials and Methods” in pregerminated Col-0, camta6-4, and camta6-5 seedlings following treatment with 0 (control) or 200 mm NaCl for 16 h prior to seedling ejection. Data represent means ± sd (three biological experiments, ∼50 seeds each). Letters above the bars represent statistically different values by Tukey’s honestly significant difference post hoc test (P < 0.01).
CAMTA6 Regulates the Expression of HKT1;1
To further assess the function of CAMTA6 in germinating seedlings in response to ABA or NaCl, the relative transcript levels of several key Na+ transporters were determined in Col-0 and camta6 mutants using RT-qPCR. In Col-0, the expression of the HKT1;1 antiporter gene was enhanced by either salt (5.1-fold) or ABA (1.9-fold) treatment, compared with control conditions (Fig. 4A). Interestingly, the basal relative HKT1;1 transcript level in the background of camta6-4 or camta6-5 alleles was found to be higher than in Col-0 (1.8- and 1.9-fold, respectively). In contrast, the expression of HKT1;1 was not increased by ABA or NaCl treatment in camta6 mutants (Fig. 4A).
![Analysis of HKT1;1 expression in response to ABA and NaCl, and effects of hkt1 loss-of-function mutants on seed germination. A, RT-qPCR analysis for relative HKT1;1 transcript levels in pregerminated seedlings. Data represent means ± sd (three biological experiments, ∼30 seeds each). B, Seed germination assay of the indicated lines in the presence of 0 (control) or 200 mm NaCl. Germination rate was scored 5 d after plating. Data represent means ± se (three biological independent experiments, ∼100 seeds each), and letters above the bars represent statistically different values by Tukey’s honestly significant difference post hoc test (P < 0.01). C, GUS staining of Col-0 and camta6 mutant pregerminated transgenic seedlings harboring the HKT1;1pro:GUS or the HKT1;1[ABRE mutation]pro:GUS construct (wild type and mutated ABRE, respectively). Wild-type and mutated promoter sequences are depicted. The ABRE/mutation site is presented in larger, boldface letters. Bar = 1 mm. In A and C, seeds were treated with 0 (control) or 10 µm ABA or 200 mm NaCl for 16 h prior to seedling ejection.](https://oup.silverchair-cdn.com/oup/backfile/Content_public/Journal/plphys/180/2/10.1104_pp.19.00119/3/m_plphys_v180_2_1101_f4.jpeg?Expires=1750266510&Signature=MuLfeLDNu7YQDHdCQfFoy4oJxPAuTzEu6wPiuWwh807PWv~9qt5bpEX8z8RrTLHoPw-iGzM0JzReDgaUteSNrMqQlha69LBr5U9PxThT~AgeuHnf8Wba5q~eEYbNwwOSh5tJtztEUmY3Acq60JRlc3a-DxaytT60mO3AlIY3jzq-AXdQLmN2tRGxF6RhlB06d6UmoYHR9EwzoSWxTyDSL~qXICF0bYeECSZEPEA5U7sufx3LaBBkJl7XYOsqjFt2i4I~VlqLLeehlCsH82~cDKm1xKKieGkEMEwVkfqtT3hRjGfvkpbD5MRJ1DxntJ-LSoYXnegALH1VI3mqA3sIhg__&Key-Pair-Id=APKAIE5G5CRDK6RD3PGA)
Analysis of HKT1;1 expression in response to ABA and NaCl, and effects of hkt1 loss-of-function mutants on seed germination. A, RT-qPCR analysis for relative HKT1;1 transcript levels in pregerminated seedlings. Data represent means ± sd (three biological experiments, ∼30 seeds each). B, Seed germination assay of the indicated lines in the presence of 0 (control) or 200 mm NaCl. Germination rate was scored 5 d after plating. Data represent means ± se (three biological independent experiments, ∼100 seeds each), and letters above the bars represent statistically different values by Tukey’s honestly significant difference post hoc test (P < 0.01). C, GUS staining of Col-0 and camta6 mutant pregerminated transgenic seedlings harboring the HKT1;1pro:GUS or the HKT1;1[ABRE mutation]pro:GUS construct (wild type and mutated ABRE, respectively). Wild-type and mutated promoter sequences are depicted. The ABRE/mutation site is presented in larger, boldface letters. Bar = 1 mm. In A and C, seeds were treated with 0 (control) or 10 µm ABA or 200 mm NaCl for 16 h prior to seedling ejection.
To better understand the nature of the interaction between HKT1;1 and CAMTA6 in response to salt stress during germination, we crossed the hkt1 mutant with the two alleles of camta6 to create camta6 hkt1 double mutants. Germination assays with and without NaCl were performed with the double mutants alongside Col-0 and the camta6 and hkt1 single mutants (Fig. 4B). Interestingly, while camta6 seeds displayed the aforementioned improved tolerance to salt, hkt1, hkt1-4, and the camta6 hkt1 double mutant displayed similar germination rates to the wild type (Fig. 4B). These data suggest that HKT1 is necessary for salt tolerance in the absence of a functional CAMTA6, even though HKT1 expression levels are not enhanced by NaCl or ABA in the camta6 mutant.
One possible explanation for these observations is a change in HKT1’s spatial expression pattern in camta6. To test this possibility, we assessed the HKT1;1 promoter activity in Col-0 and camta6 by generating transgenic plants that express the GUS reporter gene under the transcriptional regulation of the native HKT1;1 promoter (2,000 or 500 bp upstream of the translation start codon, HKT1;1pro:GUS). GUS staining in HKT1;1pro:GUS (500-bp promoter segment) transgenic pregerminated seedlings, under control conditions, showed expression mainly in the cotyledons and radicle, excluding the radicle tip and the shoot meristem (Fig. 4C). In agreement with the RT-qPCR results, ABA or NaCl treatments significantly enhanced the activity of the HKT1;1 promoter (Fig. 4C). In contrast, in the camta6 genetic background, HKT1;1 expression was restricted to the radicle and was not affected by ABA or NaCl (Fig. 4C), consistent with the aforementioned RT-qPCR findings (Fig. 4A). The change in spatial expression of HKT1;1 in the camta6 mutant may be a key factor in the apparent enhanced tolerance to NaCl in the camta6 mutant. Similar GUS expression profiles were obtained with a 2,000-bp promoter segment in Col-0 (data not shown). Further analysis proceeded with the 500-bp promoter segment.
Bioinformatics analysis of the HKT1;1 promoter sequence revealed an ABRE (ACGTGT) located 75 bp upstream of the translation start codon (Fig. 4C). In order to assess the importance of this ABRE in the responsiveness of HKT1;1 to ABA or NaCl treatment, the ABRE was replaced by the TTTAAA sequence (the recognition site of the DraI restriction enzyme). As a result of this substitution, and in contrast to the wild-type promoter, GUS activity regulated by the mutated ABRE (HKT1;1[ABRE mutation]pro:GUS) was restricted to the cotyledons’ upper parts, around the vascular tissues, and was not significantly enhanced or spread to other leaf parts following ABA or NaCl treatments (Fig. 4C). These results suggest that the ABRE mediates the expression of HKT1;1 both in response to salt and to ABA and under nonstressful (control) conditions.
Interestingly, under control conditions, the spatial GUS expression pattern driven by the HKT1;1 promoter differed in the genetic backgrounds of Col-0 and the camta6 mutant. In Col-0, expression was almost evenly spread throughout the germinating seedling, whereas in the mutant, it was confined (and even enhanced) to the radicle. These results suggest that CAMTA6 is important for the regulation of HKT1;1 expression in germinating seeds, both under salt stress and under nonstressful conditions. Finally, comparing the expression of HKT1;1pro:GUS with that of the HKT1;1[ABRE mutation]pro:GUS in the genetic background of camta6 revealed no major differences in the spatial expression pattern under control conditions, NaCl, or ABA treatment. This confirms that CAMTA6 is required for the enhanced expression of HKT1;1 in response to NaCl and ABA. However, basal expression of HKT1;1 likely involves other cis-elements that are not dependent on CAMTA6. We note that the mechanism by which CAMTA6 regulates HKT1;1 expression (e.g. by direct binding to its promoter or indirectly through another TFs) has yet to be determined.
CAMTA6 Mediates the Expression of the Majority of the Salt-Responsive Genes in Germinating Seeds
To further assess the extent of CAMTA6 involvement in salt stress responses in germinating seeds, transcriptome analysis was performed on the wild type and the camta6-5 mutant under control or salt stress conditions (three biological repeats of each genotype for each treatment). Expression reads higher than 10 were filtered for differential expression using Partek Genomics Suite v6.6. Differentially expressed gene lists of wild type-salt versus wild type-control (cutoff fold change [FC] ≥ 3 and positive false discovery rate [pFDR] < 0.05) and camta6-5-salt versus camta6-5-control were extracted. Venn diagrams were created to compare differentially expressed gene lists (cutoff FC ≥ 3 and pFDR < 0.05; Supplemental Fig. S4; see “Materials and Methods”). Using these selected cutoffs, 1,020 up-regulated and 1,467 down-regulated salt-responsive genes were obtained for the wild type (Supplemental Table S1), whereas only 404 up-regulated and 240 down-regulated salt-responsive genes were found in the camta6-5 mutant (Fig. 5; Supplemental Table S2). These results imply that the expression of the majority of the salt-responsive genes (up- and down-regulated) in the wildtype are affected by CAMTA6 (62% and 84%, respectively). To further dissect the role of CAMTA6 in the salt stress response, we defined two groups of genes: those whose expression was responsive to salt in the wild type but not in the camta6 mutant were designated as CAMTA6-dependent (638 up-regulated and 1,242 down-regulated genes; Supplemental Fig. S4; Supplemental Table S3), whereas those with common salt-regulated expression in both the wild type and camta6-5 were designated as CAMTA6-independent (382 up-regulated and 225 down-regulated; Supplemental Fig. S4; Supplemental Table S4).
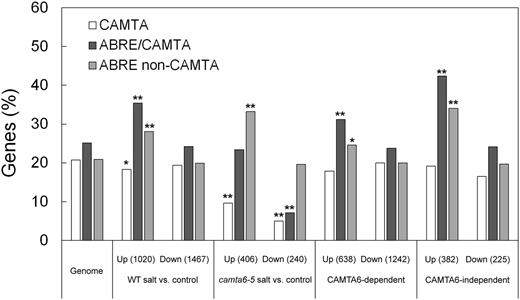
Occurrence of CAMTA and ABRE motifs in the promoters of differentially expressed genes. Occurrence of CAMTA (A/CCGCGG/T/C), ABRE/CAMTA (A/CCGTGT), and ABRE/non-CAMTA (ACGTGC/G) motifs in the 1,000 b of genomic sequences (reference genome TAIR10) of the presumed promoters of differentially expressed genes of wild type (WT)-salt versus wild type-control, camta6-5-salt versus camta6-5-control, and CAMTA6-dependent and CAMTA6-independent was determined by Promomer (http://bbc.botany.utoronto.ca/ntools/cgi-bin/BAR_Promomer.cgi.; see “Materials and Methods”). The percentage of genes containing the relevant motif out of the number of differentially expressed genes in the respective group is depicted. Fisher’s exact test was calculated for each motif relative to the motif distribution in the genome. Significant motifs are marked with asterisks: *, P ≤ 0.05 and **, P ≤ 0.001.
Heat maps of differentially expressed genes of wild type-salt versus wild type-control (cutoff FC ≥ 3 and pFDR < 0.05) and camta6-5-salt versus camta6-5-control were made using Partek Genomics Suite hierarchical clustering (Supplemental Fig. S5). Pearson’s correlation of 2,524 differentially expressed gene lists of salt versus control of both the wild type and camta6-5 (cutoff FC ≥ 3 and pFDR < 0.05) was performed using Partek (Supplemental Fig. S6). Both the Pearson’s correlation diagram and the heat maps indicate that the wild type and the camta6-5 mutant are very similar under control (nonstressed) conditions (99%; Supplemental Table S5; using FC ≥ 3 and P ≤ 0.05), whereas the transcriptomes of salt-treated wild type and camta6-5 have a similarity of only 85%. The similarity of wild type-control versus wild type-salt is 41%, whereas for the mutant control versus the mutant salt-treated it is 77%. This again shows that CAMTA6 mediates a substantial change of the transcriptome profile in response to salt stress.
Dot-plot analysis of the expression levels of some genes of interest, known to be associated with salt stress, is depicted in Supplemental Figure S7. These include SOS1, CATION/PROTON EXCHANGER3 (CAX3), Na+/H+ ANTIPORTER (NHX1), Ca2+-ATPase12 (ACA12), ABI5, and DEHYDRATION RESPONSE ELEMENT-BINDING PROTEIN19 (DREB19). This plot validates the observation that major differences occurred when the wild type-control and wild type-salt samples were compared; moreover, it demonstrates that the biological repeats have been accurately handled. However, although the replicates were found to be reproducible, the transcript levels of CAMTA6 and HKT1;1 were below the detection threshold of the transcriptomic analysis, in contrast with the confirmed expression revealed by RT-qPCR and promoter activity (Figs. 2 and 4, respectively). Collectively, these results demonstrate that CAMTA6 is indispensable for salt-responsive modulation of the transcriptome during early germination, including some of the well-known salt stress-responsive genes. However, we note that this analysis does not discern the direct CAMTA6 target genes from the other salt-responsive genes that may be regulated by other TFs, some of which may be direct CAMTA6 targets.
Promoter Analysis of Salt-Responsive Genes Suggests a Key Role for ABA-Dependent Signaling
In order to better understand the signaling pathways involved in salt stress responses in germinating seeds, we analyzed 1,000 bp of genomic sequence (representing the presumed promoters upstream of each up- and down-regulated salt-responsive gene in the wild type and the camta6-5 mutant and in the CAMTA6-dependent and -independent groups (Fig. 5; Supplemental Tables S1–S4). First, a specific motif search (targeted approach) in the differentially expressed genes was performed by using Promomer (http://www.bar.utoronto.ca/ntools/cgi-bin/BAR_Promomer.cgi; see “Materials and Methods”). Based on Choi et al. (2005) and Finkler et al. (2007a, 2007b), we first tested the occurrence of the following ABRE- and CAMTA-binding cis-elements in the differentially expressed genes relative to their respective distribution in the genome: C/ACGCGC/G/T, representing the CAMTA-binding sites (CGCG-core); C/ACGTGT, representing ABRE/CAMTA (CGTGT-core); and ACGTGG/C, representing the ABRE/non-CAMTA-binding motifs (Fig. 5). In the wild type, the salt-responsive up-regulated gene list (1,020 genes) consisted of 187 genes (18%) with 222 occurrences of CAMTA-binding CGCG motifs, 361 genes (35%) with 470 occurrences of ABRE/CAMTA, and 287 genes (28%) with 353 occurrences of ABRE/non-CAMTA motifs. The salt-responsive down-regulated gene list (1,467 genes) contained 284 genes (19%) with 353 occurrences of CAMTA-binding motifs, 357 genes (24%) with 433 occurrences of ABRE/CAMTA motifs, and 293 genes (20%) with 356 occurrences of ABRE/non-CAMTA motifs. Fisher’s exact test was calculated for each motif relative to the respective motif occurrence in the genome. Statistically significant P values (P ≤ 0.05) are indicated in Figure 5. Relative to the occurrence of these cis-elements in the genome, the occurrence in the wildtype up-regulated genes of both ABRE motifs was significantly higher, at P ≤ 0.001 (Fig. 5). The representation of the CAMTA motif was slightly lower than its occurrence in the genome, at P ≤ 0.06.
In the camta6-5 mutant, the salt-responsive up-regulated gene list (406 genes) consisted of 39 genes (10%) with 46 occurrences of CAMTA-binding motifs, 95 genes (23%) with 131 occurrences of ABRE/CAMTA, and 135 genes (33%) with 167 occurrences of ABRE/non-CAMTA motifs. The salt-responsive down-regulated gene list (240 genes) contained 12 genes (5%) with 15 occurrences of CAMTA-binding motifs, 16 genes (7%) with 17 occurrences of ABRE/CAMTA motifs, and 47 genes (20%) with 61 occurrences of ABRE/non-CAMTA motifs (Fig. 5). Fisher’s exact test was calculated for each motif, relative to the respective motif occurrence in the genome. Significant P values (P ≤ 0.05) are indicated in Figure 5, with the majority of results at P ≤ 0.001.
In the salt-responsive up-regulated genes of camta6-5 there was a significantly lower occurrence of the CAMTA-binding motif, compared with its occurrence in the genome, and a significantly higher occurrence of the ABRE/non-CAMTA motif. In the down-regulated genes, there was a substantially significant occurrence of both CAMTA- and ABRE/CAMTA-binding motifs. Comparison of the motifs in the salt-responsive genes in the wild type versus the camta6-5 mutant indicated that the CAMTA-binding motif is an important cis-element in both up- and down-regulated differentially expressed genes. It is evident that the occurrence of CAMTA-binding motifs is significantly lower in the regulatory sequences of the transcriptome of salt-treated camta6-5, in both the up- and down-regulated groups, compared with their occurrence in the wild type. In addition, this analysis also suggested that the salt-responsive transcriptome is partly mediated by ABREs that are not directly dependent on the binding of CAMTA6. Apparently, analysis of the motifs in the group of the CAMTA6-dependent genes revealed a picture very similar to that of the wild type (Fig. 5). In contrast, in the CAMTA6-independent group of up-regulated genes, there was a substantially higher occurrence of ABRE/CAMTA and ABRE/non-CAMTA motifs (42% and 34%, respectively) and a lower occurrence of the CAMTA-binding motif in both up- and down-regulated differentially expressed genes (19% and 17%, respectively).
Promoter Analysis of Up- and Down-Regulated Salt-Responsive Genes: An Unbiased Motif Scan
To learn more about the possible involvement of other cis-elements mediating the salt response, we analyzed the predicted promoters of the salt-responsive genes by using an unbiased motif scan tool (Amadeus-Allegro [http://acgt.cs.tau.ac.il/allegro/download.html]; see “Materials and Methods”). Analysis of 1,000 bp of genomic sequences of the presumed promoter regions of the corresponding genes was carried out in order to detect overrepresentation of cis-elements for TF binding. The JASPAR cis-element database was used for motif detection. In the wild type (Fig. 6, left), the unbiased motif analysis of up-regulated salt-responsive genes revealed a motif that consists of the palindromic G-box cis-element CACGTG (P value of 4.4E−68), which is also the scaffold for the ABRE motif ACGTGG/T. This element may serve as the binding site for numerous TFs, such as bZIP (Hobo et al., 1999) and basic helix-loop-helix (bHLH) TFs such as ABI5, ABF1, PHYTOCHROME INTERACTING FACTOR4 (PIF4), ELONGATED HYPOCOTYL5 (HY5), MYC, and others (Choi et al., 2000; Uno et al., 2000). Indeed, analysis of these promoters using Pscan (http://159.149.160.88/pscan/) identified those TFs with a significant P value (Supplemental Table S6). The other detected motif with a consensus AGTCGGTA and a P value of 2.6E−27 is DRE-like, known to mediate salt and drought responses through binding of TFs including several DREBs (Chen et al., 2002). Analysis of 1,467 salt-responsive down-regulated genes in the wild type revealed an 8-bp motif with a consensus CCACGTGC and a P value of 2.2E−22, which represents a G-box and an ABRE (non-CAMTA) motif for the binding of bHLH TF family members such as PIFs, SPT, MYC, and others. The other motif contains the consensus ACTAGTAC with a P value of 2.9E−20, which may represent promoter motifs involved in light-regulated gene expression, such as SORLREP1 (Hudson and Quail, 2003).
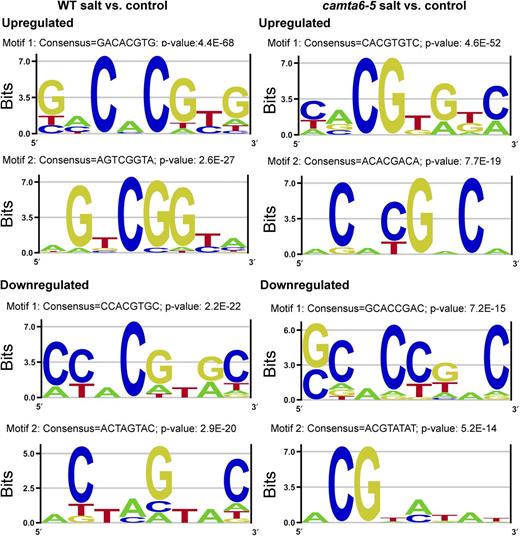
Highly represented sequence motifs in the promoters of differentially expressed genes in the wild type (WT) and the camta6-5 mutant. Promoter analyses of differentially expressed genes derived from comparisons of wild type-salt versus wild type-control and camta6-5-salt versus camta6-5-control were performed using the Amadeus-Allegro software (http://acgt.cs.tau.ac.il/allegro/download.html) on the 1,000 b genomic sequences upstream of the transcription start sites of the corresponding genes. Motifs of eight bases were derived from the JASPAR regulatory motif database. The recommended statistically significant P value is 1E−20 or less. Left, Promoter motifs in differentially expressed genes from wild type-salt versus wild type-control. In the up-regulated genes, motif 1 with a consensus GACACGTG and a P value of 4.4E−68 represents a G-box TF found in bZIP and bHLH TFs, like ABI5, ABF1, PIF4, HY5, and MYC. Motif 2 with a consensus AGTCGGTA and a P value of 2.6E−27 is a DRE-like motif known to mediate salt and drought tolerance, as in many DREBs. In the down-regulated genes, motif 1 with a consensus CCACGTGC and a P value of 2.2E−22 represents a G-box and ABRE motifs representing bHLH TFs like PIFs, SPT, MYC, and others. Motif 2 with a consensus ACTAGTAC and a P value of 2.9E−20 might represent promoter motifs involved in the network of light-regulated genes, like SORLREP1. Right, Promoter motifs in differentially expressed genes from camta6-5-salt versus camta6-5-control. In the up-regulated differentially expressed genes, motif 1 with a consensus CACGTGTC and a P value of 4.6E−52 is an ABRE- and CAMTA-binding motif (C/ACGTGT/G) representing TF-binding sites such as ABI5, ABFs, bHLH, MYC, and others. Motif 2 with a consensus ACACGACA and a P value of 7.7E−19 is a G-box cis-acting element involved in light responsiveness. In the down-regulated differentially expressed genes, motif 1 with a consensus GCACTGA and a P value of 7.2E−15 is not as significant as the up-regulated motifs. It may be associated with cytokinin responses. Motif 2 with a P-value of 5.2E−14 represents an ABA-responsive element termed the A-box (ACGTAG) known to occur in genes expressed in seed embryos.
Promoter analysis of camta6-5-salt versus camta6-5-control differentially expressed genes was also conducted by using Amadeus-Allegro software (Fig. 6, right). The most significant overrepresented motif in the up-regulated genes contains the consensus CACGTGTC with a P value of 4.6E−52. This is an ABRE- and CAMTA-binding motif (C/ACGTGT/G) representing binding sites of TFs such as ABI5, ABFs, bHLH, MYC, and others. The second most significant motif with the consensus ACACGACA and a P value of 7.7E−19 is a G-box cis-element involved in light responses. The most significant overrepresented motif in the down-regulated genes contains the consensus GCACCT/GAC with a P value of 7.2-E−15. This may represent the W-box binding of WRKY1. Another motif with the consensus ACGTATAT and a P value of 5.2E−14 represents an ABA-responsive element termed the A-box (ACGTAG), known in genes expressed in the seed embryo (Izawa et al., 1994). The TF-binding sites provided by Pscan are listed in Supplemental Table S7.
The Amadeus analysis of overrepresented motifs in the CAMTA6-dependent and CAMTA6-independent gene list is presented in Figure 7. In the CAMTA6-dependent group (Fig. 7, left), in the up-regulated differentially expressed genes, the most prominent motif is the ABRE/CAMTA, ACGTGT (P value of E−28). The second motif, with a consensus CAGGCGGT/C and a P value of 4.3E−24, represents the DRE-like GCC-box, which is a binding motif of the DREB family TFs. This box is also known to mediate ethylene responsiveness (Solano et al., 1998). Analysis of the down-regulated differentially expressed genes in the CAMTA6-dependent group revealed a motif with the consensus CCACATGG (P value of 3.1E−18), representing a MYC recognition site in the promoters of the dehydration-responsive gene RD22, and a MYC sequence in the DREB1A promoter, the binding site of ICE1 (Chinnusamy et al., 2003). Another motif with a consensus ACTAGTAC (P value of 3.5E−18) represents SORLREP1, involved in light-regulated gene expression (Hudson and Quail, 2003). Thus, it appears that when the germinating embryo copes with salt stress, certain activities such as light-mediated pathways are down-regulated, whereas activities essential for coping with stress are elevated.
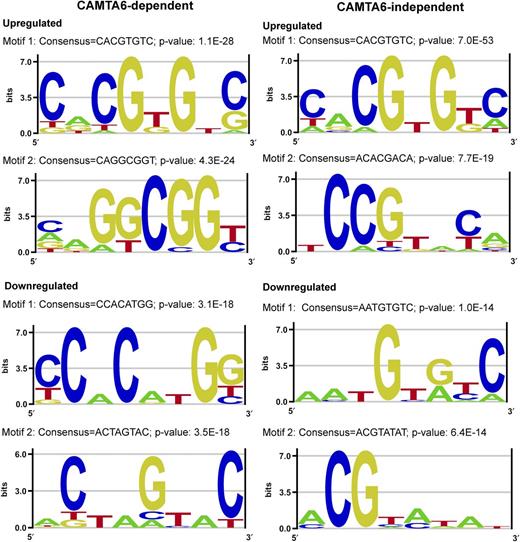
Highly represented sequence motifs in the promoters of differentially expressed genes in the CAMTA6-dependent and CAMTA6-independent groups. Promoter analyses of differentially expressed genes in the CAMTA6-dependent and CAMTA6-independent groups were performed using the Amadeus-Allegro software (http://acgt.cs.tau.ac.il/allegro/download.html) on the 1,000 bp genomic sequences upstream of the transcription start sites of the corresponding genes. Motifs of eight bases were derived from the JASPAR regulatory motif database. The recommended statistically significant P value is 1E−20 or less. Left, CAMTA6-dependent genes. In the up-regulated group, motif 1 with a consensus CACGTGTC and a P value of 1.1E−27 represents an ABRE- and CAMTA-binding site. Motif 2 with a consensus CAGGCGGT/C and a P value of 4.3E−24 represents a GCC-box, DRE-like, which is a binding motif of the DREB family TFs. This box is also known as an ethylene-responsive element (Solano et al., 1998). In the down-regulated differentially expressed CAMTA6-dependent genes, motif 1 with a consensus CCACATGG and a P value of 3.1E−18 represents a MYC recognition site in the promoters of the dehydration-responsive gene rd22 and in the DREB1A promoter and ICE1-binding site. Motif 2 with a consensus ACTAGTAC and a P value of 3.5E-18 represents SORLREP1, a motif involved in light-regulated gene expression (Hudson and Quail, 2003). Right, CAMTA6-independent genes. Promoter analysis in the up-regulated genes revealed the classical ABRE (with a consensus CACGTGT/GC), which also represents the ABRE/CAMTA motif, the major motif in the up-regulated genes (P value of 7.0E−53). The major motif in the down-regulated salt-responsive CAMTA6-independent genes has a consensus AATGTG/AT/CC (P value of 1.0E−14), but the identity of this motif could not be verified and its occurrence is not considered statistically significant.
Regarding CAMTA6-independent genes (Fig. 7, right), promoter analysis of the up-regulated genes revealed the classical ABRE (with a consensus CACGTGT/GC), which also represents the ABRE/CAMTA motif, as the major motif in the up-regulated genes (P value of 7.0E−53). The major motif in the down-regulated salt-responsive CAMTA6-independent genes has a consensus AATGTG/AT/CC (P value of 1.0E−14). The identity of this motif could not be verified, and it is not considered statistically significant. These results reiterate the suggestion that at least some of the salt-responsive ABA-mediated pathways are independent of CAMTA6. They could be, but not necessarily are, dependent on other CAMTAs.
Functional Classification of Salt Stress-Responsive Genes
Functional classification of the salt-responsive up- and down-regulated genes was conducted by using a number of tools. Overall, the most coherent results were obtained using the Funrich and BAR tools (see “Materials and Methods”). The highest enrichment of differentially expressed (salt versus control) up- and down-regulated genes in the wild type and in the CAMTA6-dependent groups was of nuclear proteins (Fig. 8; Supplemental Table S8), with TFs being the most prominent group (∼18% and ∼20%, respectively), which is more than double the proportion of TF genes in the Arabidopsis genome (Riechmann et al., 2000; Riaño-Pachón et al., 2007; Supplemental Table S8). Additional unique functional classes that are enriched in the up-regulated wild-type and CAMTA6-dependent groups include genes associated with response to salt stress (6% of the differentially expressed genes and a 5.5-fold enrichment relative to genome occurrence), response to osmotic stress (3%; 9-fold enriched), and response to GA (3%; 13-fold enriched). Additional unique pathways in the CAMTA6-dependent down-regulated genes include response to high light intensity (1%; 8-fold enriched) and cell division (3%; 4-fold enriched). Over 100 TFs, obtained by Funrich analysis and enriched in the CAMTA6-dependent genes, are listed in Supplemental Table S9. These include different isoforms of AP2, WRKYs, DREBs, NACs, MYBs, bHLH, and other TFs. The most significant (P ≤ 0.05) include the AP2 and WRKY TFs (in the up-regulated genes) and AP2, Leu-rich repeats, and bHLH in the down-regulated genes.
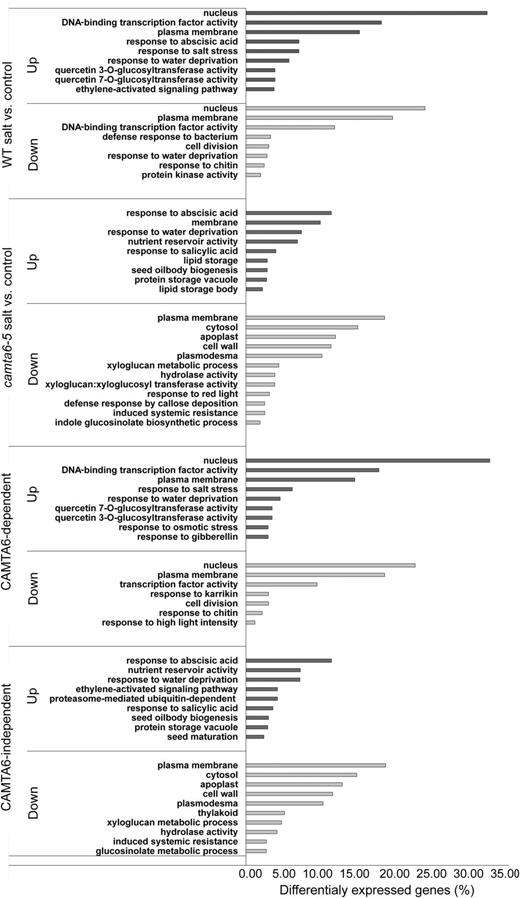
Functional classification of differentially expressed genes by the Funrich enrichment tool (http://www.funrich.org). The tool was used with the Uniprot identifiers and Benferroni-corrected P values (P ≤ 0.05). The enrichment analysis of the differentially expressed up- and down-regulated genes was classified based on the following: biological process, molecular function, and cellular component. WT, Wild type.
Functional classification of the CAMTA6-dependent genes by the BAR tool using the MapMan database supports the results obtained by the Funrich tool (Supplemental Fig. S8). Namely, RNA regulation is the major pathway in both up- and down-regulated genes. Stress responses and signaling are both activated and suppressed, whereas photosynthesis and cell wall activities are down-regulated. Genes associated with interesting functional classes, such as Ca2+ (ACA11, ACA12, CAX3, and SnRK3), salt stress-responsive genes (ABI5, DREB19, LEA2, SOS1, CHX18, CHX20, and CIR1), osmotic stress response (NAC19, GID1A, UGT74E2, HSP90, EDL3, and BGLU23), water deprivation (F-box protein, DREB19, DREB2B, DREB1B, JAZ1, and ERF13), and regulation of transcription (WRKY, NAC, ERF, bZIP, bHLH, ABF, MYB, DREB, IAA, and PIF) are presented in Supplemental Table S9. Classification analysis of the camta6-5-salt versus camta6-5-control and CAMTA6-independent differentially expressed genes is functionally similar (Fig. 8). The main pathways of the up-regulated genes are associated with their response to ABA (11%; 10-fold enriched).
In addition, MapMan and Gene Ontology analyses classified 92 up-regulated and 276 down-regulated CAMTA6-dependent genes that are associated with seed development (Supplemental Table S10). Genes that were identified by both MapMan and Gene Ontology are marked in boldface in Supplemental Table S10. Notably, genes that are involved in secondary wall formation and auxin transport (WAT1), microtubule organization (SP1L3), cell differentiation (CLE41), growth factor activity (PSK3), root morphogenesis (WDL1), embryo development (ATS3), cell elongation (DWF1), leaf vascular tissue patterning (AS2), polar auxin transport (PIN2, PIN3, PIN4, PIN7, LAX2, and AUX1), and 17 TFs, including the ABA response mediator HY5, were found to be down-regulated in response to salt stress. Among the up-regulated genes, 19 were identified as TFs, including members of the NAC family (NAC032, NAC060, NAC019, NAC40, NAC50, ATAF1, and ATAF2), the ABA signaling during seed maturation and germination TF ABI5, and a regulator of cotyledon development (WOX2). Moreover, other biological pathways were found to be associated with seed development, including lipid storage body and seed oil body biogenesis. The down-regulated major biological pathways are associated with cell wall activities, defense responses, and thylakoid component activity.
DISCUSSION
Phenotypes of camta6 Mutants: Salt Tolerance during Early Germination and Dependence on Ca2+
The early stages of germination are critical for establishing the emerging seedling; therefore, stressful growth conditions in the vicinity of the germinating seed could be detrimental to the germination rate, the establishment of seedlings, and the yield in the case of crops. Surprisingly, in spite of ample investigations of salt stress responses in plants and the identification of crucial mechanisms involved in these responses, the effects of salt stress at the specific stage of early germination have not been thoroughly investigated. Here, we sought to assess the possible role of CAMTA6 at the stage of early germination. CAMTA6 is a member of a six-gene family of TFs in Arabidopsis (Bouché et al., 2002; Yang and Poovaiah, 2002; Finkler et al., 2007a). Like all CAMTAs, it contains a Ca2+-dependent CaM-binding domain and is therefore assumed to function in vivo in response to Ca2+ signaling. Analysis of germinating camta6 mutants (two alleles and several complementation lines tested) revealed that the mutants are more tolerant than the wild type to salt stress (Fig. 1, A and B). Moreover, the mutants also appear to be more resistant to exogenous ABA (Fig. 1E), suggesting that at least some of the CAMTA6-dependent pathways that are relevant to salt stress responses are mediated by ABA, consistent with promoter analysis of the salt-responsive CAMTA6-dependent genes. Interestingly, in the presence of exogenous Ca2+, germination rates in the presence of NaCl were much higher (greater than 80%) than those without Ca2+ and were similar in the wild type and the camta6 mutants (Fig. 1B). This responsiveness of camta6 seeds indicates the existence of more than one signaling pathway in response to Ca2+ and NaCl. In contrast, in the presence of NaCl and exogenous EGTA, germination rates in the camta6 mutants were significantly lower than those in the wild type (Fig. 1B).
These results suggest that the role of CAMTA6, as a salt stress regulator of gene expression, is associated with Ca2+ signaling, as expected for a CaM-binding protein and consistent with early studies that revealed the role of Ca2+ in salt stress tolerance (LaHaye and Epstein, 1969). Consistent with the enhanced tolerance of germinating camta6 mutants to salt stress, the mutants accumulated less Na+ than did wild-type seeds when exposed to high concentrations of NaCl (200 mm; Fig. 3). The reduced Na+ accumulation in the camta6 mutants could be the result of impaired transcription levels (or spatial and/or temporal profiles) of genes encoding Na+ transporters, including SOS1, NHX1, HKT1, or others, in response to NaCl (Fig. 4; Supplemental Fig. S7). However, sos1 germinating seeds were reported to display hypersensitivity to salt during germination (Wu et al., 1996), suggesting that the attenuated induction of SOS1 transcription in response to NaCl in camta6 is not related to the enhanced tolerance of camta6 germinating seeds to salt. The enhanced expression of CAMTA6 in response to salt stress (Fig. 2) and the extent of CAMTA6-dependent salt-responsive genes revealed by transcriptomic analysis support the involvement of CAMTA6 in salt stress responses. Finally, the observed hypersensitivity of camta6 older seedlings to salt (Fig. 1, C and D) suggests different roles of CAMTA6 in response to salt at different stages of development, which is reminiscent of the previously described hypersensitivity of hkt1 seedlings to salt (Mäser et al., 2002; Rus et al., 2004; Sunarpi et al., 2005; Horie et al., 2006).
Regulation of Salt-Responsive Genes by CAMTA6: The HKT1;1 Gene as a Case Study
HKT1;1 is an Na+/K+ transporter that plays an important role in plant responses to salt stress (Rus et al., 2001; Laurie et al., 2002) and whose expression is regulated by both NaCl and ABA (Shkolnik-Inbar et al., 2013; Zhang et al., 2019). Here, we tested the importance of CAMTA6 in the regulation of HKT1;1. Both transcript analysis and promoter activity tests in vivo confirmed that CAMTA6 is indispensable for NaCl- and ABA-regulated expression of HKT1;1. Moreover, based on HKT1;1 promoter:GUS activity, CAMTA6 is also likely important for the basal expression levels and in determining the spatial pattern of HKT1;1 expression under control conditions (Fig. 4C). Furthermore, we identified an ABRE (ACGTGT) in the promoter of HKT1;1 as a crucial element in the response of the gene to both NaCl and ABA. This ABRE could be a target for different types of TFs, including CAMTA (Finkler et al., 2007b). However, we do not know whether CAMTA6 regulates HKT1;1 by directly binding to it or by mediating other TFs, perhaps related to ABA signaling. To further assess the nature of the interaction between CAMTA6 and HKT1;1, we examined the germination rate of camta6 and hkt1 single mutants and camta6 hkt1 double mutants in the presence of NaCl. Interestingly, hkt1 and hkt1 camta6 seeds germinated at the same rate as Col-0 seeds in the presence of 200 mm NaCl, in contrast to the tolerance observed in camta6 germinating seeds (Fig. 4B).
Examination of the promoter activity of HKT1;1 in camta6-5 indicates an exclusive expression in the radicle, which was not affected by salt treatment and which might explain the improved salt tolerance of germinating camta6 mutants and the sensitivity of the wild type, hkt1, and hkt1/camta6 (Fig. 4C). In this case, it is possible that HKT1;1, which facilitates the removal of Na+ from the xylem sap to reduce its mobilization to the salt-sensitive shoot tissues (Sunarpi et al., 2005; Davenport et al., 2007; Møller et al., 2009), promotes the removal of Na+ from the nondifferentiated radicle tissue of a germinating seedling, which results in the observed reduced Na+ accumulation (Fig. 3) and enhanced tolerance (Fig. 1, A and B). The lack of expression of HKT1 in the cotyledons of the germinating seeds of the camta6 mutant (Fig. 4) may also contribute to the enhanced tolerance to Na+. However, analysis of the double mutants compared with the single mutants indicates that in the absence of a functional CAMTA6, HKT1;1 is necessary for the salt tolerance phenotype even though the overall expression levels of HKT1;1 are not enhanced by NaCl in the camta6 mutant (Fig. 4A). Finally, the possible contribution of other mechanisms to salt tolerance in germinating camta6 mutants cannot be ruled out, possibly by the regulation of other Na+ transporters. However, the down-regulation of the potential regulators of Na+ cellular level, NHX1 and SOS1, in camta6 (Supplemental Fig. S7) is unlikely to result in Na+ accumulation, as nhx1 nhx2 double mutants were found to accumulate more Na+ and SOS1 overexpressors were reported to accumulate less Na+ (Shi et al., 2003; Bassil et al., 2011; Barragán et al., 2012), further supporting the suggested role of HKT1;1 in the regulation of Na+ levels in germinating seedlings.
CAMTA6 Is a Master Regulator of Salt-Responsive Genes in Germinating Seeds
Comparison of the transcriptomes of the wild type and the camta6 mutant under control conditions and under salt stress revealed that in the wild type, 62% and 84% of the salt-responsive up- and down-regulated genes, respectively, are CAMTA6-dependent. Moreover, the most prominent cis-elements in the salt-responsive genes are ABREs, consistent with the known role of ABA in salt stress responses and with the phenotypes of the camta6 mutants regarding their tolerance to both NaCl and ABA. The majority of the salt-responsive genes contain the core element for the ABRE/CAMTA (C/ACGTGT)- and ABRE/non-CAMTA (ACGTGG/C)-binding sites but no enrichment of CAMTA-binding motifs (A/CCGCGG/C/T). However, a substantial and significant depletion of CAMTA-binding motifs in the camta6 salt-treated mutant suggests a prominent role in salt stress regulation by CAMTA6 (Fig. 5). Therefore, CAMTA6 regulates the transcription of many of the salt-responsive genes through ABA signaling and other TFs. Consistent with this suggestion is the fact that TFs are the most prominent class of salt-responsive genes in the wild type and in the CAMTA6-dependent group (Fig. 8; Supplemental Fig. S8; Supplemental Table S9). Indeed, 20% and 30% of the TF genes, which are CAMTA6-dependent in response to salt stress, contain CAMTA-binding sites and ABRE/CAMTA-binding sites, respectively (Supplemental Table S9). Moreover, 40% of the CAMTA6-dependent up-regulated genes in response to salt were identified as associated with seed development processes (Supplemental Table S10). Collectively, these data indicate that CAMTA6 operates upstream of several TFs that regulate the expression of numerous downstream salt-responsive genes. The extent of gene regulation by CAMTA6 in response to salt stress is not surprising in view of reports that CAMTA1, CAMTA2, and CAMTA3 are involved in regulating thousands of genes in response to cold stress (Kim et al., 2013). Furthermore, identification of the rapid stress response element by Walley et al. (2007), as the CAMTA-binding cis-element CGCGTT, and the role of both Ca2+ and CAMTA in activation of the rapid stress response element (Benn et al., 2014) collectively imply that CAMTAs are master regulators of gene expression in response to environmental cues.
CAMTA6-Dependent and -Independent ABA Signaling in Response to Salt Stress
Coinciding cis-elements for Ca2+ and ABA responsiveness have been previously described (Kaplan et al., 2006; Finkler et al., 2007b; Galon et al., 2010; Whalley and Knight, 2013). Moreover, whereas the core sequence for CAMTA binding is CGCG, CAMTAs may also bind to the ABRE sequence C/ACGTGT (Choi et al., 2005; Finkler et al., 2007a, 2007b). Other ABREs are not CAMTA-binding sites (e.g. ACGTGG/C; Finkler et al., 2007a). Thus, it is not surprising that among the salt-responsive genes in the camta6 mutant, the most prominent motif in both the up-regulated (33%) and down-regulated (20%) genes is the ABRE/non-CAMTA motif (ACGTGG/C; Fig. 5), whereas the ABRE/CAMTA motif is the most prominent in the CAMTA6-dependent class, both in the up-regulated (31%) and down-regulated (24%) genes.
The transcriptome analysis of salt-treated Arabidopsis germinating seeds strongly suggests that salt stress signaling is mediated by ABA-dependent and ABA-independent pathways. Further evidence supports cross talk between these pathways, which are involved in the regulation of osmotic/salt stress, but thus far, very little is known about the mechanisms underlying this cross talk (Yoshida et al., 2014). The role of ABFs and DREB2 TFs in mediating salt stress signaling via ABA-dependent and ABA-independent pathways, respectively, was further expanded by the analysis of camta6-5 and wild-type salt-treated differentially expressed genes. The identification of numerous CAMTA6-dependent genes encoding TFs, such as the AP2 family (DREB2G, DREB2B, DREB2C, DREB19, DREB1B, and DREB1C), the ABFs (ABF1), MYBs/MYCs, and NACs, all known to mediate the regulation of salt stress gene expression (Boudsocq and Laurière, 2005; Yamaguchi-Shinozaki and Shinozaki, 2006), suggests a role for CAMTA6 as an upstream master regulator of salt stress signaling.
How Ca2+ signaling modulates CAMTA6 function is not known. From the studies of CAMTA3 (SR1) in conjunction with defense responses to pathogens, it is clear that CAMTA3 functions as a repressor of gene expression of some of its targets, which is removed upon stimulation. Yet, if and how Ca2+ and CaM are involved in the repression and activation stages are not clear (Fromm and Finkler, 2015). Du et al. (2009) suggested that CaM binding to CAMTA3 is required for repression of its target gene EDS1 in response to biotic defense. On the other hand, Kim et al. (2017) recently reported that repression of the CAMTA3 target genes operates through a CAMTA3 module that does not involve CaM binding. However, gene activation in this case does require the binding of Ca2+/CaM (Kim et al., 2017). Activation of CAMTA-repressed genes may also involve ubiquitin-mediated degradation of CAMTA, as described for CAMTA3 (Zhang et al., 2014). Therefore, different modes of regulation and signaling pathways may regulate each CAMTA under different physiological conditions. These pathways remain to be elucidated.
MATERIALS AND METHODS
Plant Materials, Growth, and Stress Assays
Arabidopsis (Arabidopsis thaliana) Col-0 plants were used in this research. The following mutants were obtained from the Arabidopsis Stock Center in Columbus, Ohio: camta6-4 (WiscDsLox473C09), camta6-5 (GABI-KAT 227H02), hkt1 (CS68521), hkt1-4 (CS68091), and CAMTA6pro:GUS (Mitsuda et al., 2003). HKT1;1pro:GUS-expressing plants were created by subcloning the 2,000-bp genomic DNA fragment upstream of the HKT1;1 (At4G10310) translation start codon into pCAMBIA 1391Z (CAMBIA) at the SalI and EcoRI sites upstream of the GUS coding sequence. For creating plants that express HKT1;1pro:GUS with mutated ABRE, a 500-bp fragment of the promoter was subcloned to pCAMBIA 1391Z followed by replacement of the ABRE (ACGTGT) to TTTAAA (DraI recognition site) using Q5-DNA polymerase (New England Biolabs) for site-directed mutagenesis. Mutation was verified by DraI digestion. The CAMTA6pro:CAMTA6-EGFP construct was prepared by subcloning of EGFP+linker (for primers, see Supplemental Table S11) to the SalI and EcoRI sites of pCAMBIA 1391Z followed by insertion of CAMTA6 promoter (2,000 bp upstream of the translation start codon) and full genomic sequence to the SalI and HindIII sites. The CAMTA6 insert was amplified such that the HindIII and SalI recognition sequences are downstream of the BbsI restriction enzyme site (for primers, see Supplemental Table S11) for digestion specificity. All constructs were introduced to Arabidopsis by the floral dip method (Clough and Bent, 1998).
Seed surface sterilization and germination assays in the presence of different NaCl concentrations were performed as previously described (Shkolnik and Bar-Zvi, 2008). The germination on mannitol assays was performed in the same way. Treatments with NaCl prior to GUS staining, qRT-PCR, or RNA isolation for RNA sequencing analysis were performed by imbibing seeds at 4°C for 3 d prior to plating onto Whatman filter paper (grade 1) soaked with 0.25× MS medium (Murashige and Skoog, 1962) and supplemented with 0 (control) or 200 mm NaCl. Pregerminating seedlings were ejected manually, using fine forceps, 16 h following the start of the treatment. GUS staining was performed as previously described (Weigel and Glazebrook, 2002), and images were taken using a stereoscope equipped with a Zeiss Axiocam ERc 5s camera. Seedling NaCl treatment was performed by the preparation of 0 (control) or 250 mm NaCl containing 0.25× MS and 1% (w/v) agar solidified medium in square petri dishes (120 × 120 × 17 mm) filled with 50 mL of medium, then the upper 2 cm was cut using a sterile scalpel and removed to allow placing the seedlings such that the root-shoot junction is at the medium edge. This method of NaCl treatment allows avoiding direct contact of the shoot with the medium and thus provides a more physiologically relevant assay, as previously described (Shkolnik-Inbar and Bar-Zvi, 2012). Fluorometric GUS assay was performed as previously described (Morey et al., 2011) using 5 µg of total protein extracted from ejected CAMTA6pro:GUS pregerminating seedling and incubation time at 37°C for 2 h. Protein concentration was determined by the Bradford assay (Sigma).
Determination of Chlorophyll Content
Quantification of chlorophyll content in control and salt-treated seedlings was performed by total chlorophyll extraction using 80% (v/v) acetone aqueous solution as previously described (Porra et al., 1989). In mature pot-grown plants, quantification was performed using the CCM-200 plus Chlorophyll Content Meter (Opti-Sciences) according to the manufacturer’s instructions. In both methods, values of chlorophyll content were normalized relative to Col-0 control values, and the data are presented as relative chlorophyll content.
RT-qPCR Analysis
Total RNA was isolated from pregerminating seedlings using the ZR Plant RNA MiniPrep kit (Zymo Research), and total cDNA was synthesized using the High Capacity cDNA Reverse Transcription kit (Thermo Fisher Scientific). The reaction mixture was prepared according to the manufacturer’s instructions, with random primers, and supplemented with 1 µg of total RNA. Ten-microliter PCR mixtures, containing 5 µL of Fast SYBER Green Master Mix (Applied Biosystems by Thermo Fisher Scientific), 500 nm reverse and forward primers, designed to amplify 80 to 120 bp of genes of interest, and 20 ng of cDNA were subjected to the StepOnePlus real-time system (Thermo Fisher Scientific) using the default program. For endogenous control, the PP2A (At1G6990) gene was used. Relative quantification data were analyzed in the Step One Software V2.3 (Thermo Fisher Scientific).
Mineral Analysis
Control and NaCl-treated pregerminated seedlings (see “Plant Materials, Growth, and Stress Assays”) were ejected from seeds and samples for Na+ content determination and prepared as previously described (Kalifa et al., 2004; Shkolnik-Inbar et al., 2013) with a minor modification, using 1 mL of HNO3:HClO4 (1:2, v/v) mix, in a 1.5-mL Eppendorf tube with a punctured lid. In each experimental repetition, 50 seedlings of each line were sampled. Na+ content was determined using Arcos inductively coupled plasma optical emission spectrometry (Spectro/Ametek).
RNA Sequencing and Bioinformatics Analysis
RNA was isolated from ∼50 pregerminated seedlings (three independent replicates, total n ∼ 150) of Col-0 and camta6-5 mutants that were treated without (control) or with 200 mm NaCl for 16 h (see “Plant Materials, Growth, and Stress Assays”) using the ZR Plant RNA MiniPrep kit (Zymo Research). Illumina RNA sequencing was performed in triplicate (Illumina HiSeq 2500; Illumina TruSeq RNA Library Preparation Kit v2), resulting in 50-bp reads. Adaptors were removed and quality values above phred33 were used for analysis (cutadapt version 1.9). Mapping and alignment was performed using TopHat version 2.1.0 using Bowtie2 (v2.2.6; reference genome TAIR10), followed by gene counting performed by HTseq-count version 0.6.1. Values above 10 were used for normalization and gene expression analysis (DESeq2 version 1.10.0). Principal component analysis and cluster analysis showed clear separation between treatments and homogeneity of samples in the same treatment. Both untreated samples (wild type and mutant) showed similar expression values. Partek Genomics Suite (v7.17) was used for obtaining differentially expressed genes (cutoff FC ≥ 3 and pFDR < 0.05), including dot plots, heat maps, and Pearson’s correlations. Functional enrichment was determined with BAR: Classification Superviewer at the Bio-Analytic Resource for Plant Biology (http://bar.utoronto.ca) using the MapMan or Gene Ontology classification sources; pathways with P ≤ 0.05 and normalization values ≥ 1 to the frequency in the Arabidopsis set are described. Functional classification of differentially expressed genes was provided by the Funrich enrichment tool (http://www.funrich.org; Pathan et al., 2015). The tool was used with the Uniprot identifiers and Benferroni corrected (P ≤ 0.05). Enrichment of the differentially expressed up- and down-regulated genes was classified by biological process, molecular function, and cellular component. Venn diagrams were created using the Venny tool (http://bioinfogp.cnb.csic.es/tools/venny/index.html; Oliveros, 2015). The motif analysis software used was the Amadeus-Allegro tool (http://acgt.cs.tau.ac.il/allegro/download.html; Orenstein et al., 2012). Motif enrichment was performed on 1,000 b of genomic sequences upstream of the presumed transcription start site of the differentially expressed genes. Eight-base-long motifs were searched based on the JASPAR regulatory motif database. The recommended P value is ≤ 1E−20. Promomer (http://www.bar.utoronto.ca/ntools/cgi-bin/BAR_Promomer.cgi) was used for identifying potential motifs within the 1,000 b of the genomic sequences of presumed promoters of differentially expressed genes. In this data set, DNA of the 1,000 b of genomic sequences was taken from immediately upstream of the 5′ untranslated region for those genes with annotated untranslated regions and upstream of the translational start for the remainder.
Statistical Analysis
Data were analyzed using Microsoft Excel ToolPak and R version 3.1.1. Fisher’s exact test was used to evaluate the significance of results.
Accession Numbers
Accession numbers of the major genes that were addressed in this research are as follows: CAMTA6, At3G16940; HKT1;1, At4G10310; SOS1, At2G01980; NHX1, At5G27150; CAMTA3, At2G22300; ABI5, At2G36270; ACA12, At3G63380; CAX3, At3G51860; and DREB19, At2G38340. The complete expression data set is available as accession numbers GSM3208267 to GSM3208256 in the Gene Expression Omnibus (http://www.ncbi.nlm.nih.gov/geo).
Supplemental Data
The following supplemental materials are available.
Supplemental Figure S1. Germination assay on mannitol-containing medium.
Supplemental Figure S2. Complementation assay of camta6 phenotype.
Supplemental Figure S3. Senescence phenotype examination.
Supplemental Figure S4. Venn diagrams of differentially salt-responsive genes.
Supplemental Figure S5. Heat maps of differentially expressed gene lists.
Supplemental Figure S6. Pearson’s correlation of differentially expressed gene lists.
Supplemental Figure S7. Dot-plot analysis of some interesting differentially expressed genes.
Supplemental Figure S8. Functional classification of differentially expressed genes.
Supplemental Table S1. Differentially expressed gene list of wild type-salt versus wild type-control.
Supplemental Table S2. Differentially expressed gene list of camta6-5-salt versus camta6-5-control.
Supplemental Table S3. CAMTA6-dependent gene list.
Supplemental Table S4. CAMTA6-independent gene list.
Supplemental Table S5. Gene list of camta6-5-control versus wild type-control.
Supplemental Table S6. Promoter scan analysis for TF-binding sites in wild type-salt versus wild type-control differentially expressed genes.
Supplemental Table S7. Promoter scan analysis for TF-binding sites in camta6-5-salt versus camta6-5-control differentially expressed genes.
Supplemental Table S8. Functional classification of salt-responsive differentially expressed genes of wild type-salt versus wild type-control, camta6-5-salt versus camta6-5-control, and CAMTA6-dependent and CAMTA6-independent classes
Supplemental Table S9. Functional classification of CAMTA6-dependent up- and down-regulated genes.
Supplemental Table S10. CAMTA6-dependent development-associated up- and down-regulated genes.
Supplemental Table S11. Primer list.
LITERATURE CITED
Author notes
This work was supported by the Israel Science Foundation (grant No. 743/16 to H.F.).
Present address: Robert H. Smith Institute of Plant Sciences and Genetics in Agriculture, Faculty of Agriculture, Food, and Environment, Hebrew University of Jerusalem, Rehovot 76100, Israel.
Author for contact: [email protected].
Senior author.
The author responsible for distribution of materials integral to the findings presented in this article in accordance with the policy described in the Instructions for Authors (www.plantphysiol.org) is: Doron Shkolnik ([email protected]).
D.S. and H.F. designed the experiments and research plan; D.S. and A.F. performed the experiments; D.S., H.F., A.F., and M.P.-C. analyzed the data and wrote the article.
Articles can be viewed without a subscription.
