


Abstract
Phosphatidylcholine (PC) is a primary class of membrane lipids in most eukaryotes. In plants, the primary PC biosynthetic pathway and its role in plant growth and development remain elusive due to lack of a mutant model with substantially decreased PC content. Recently, a double mutant of Arabidopsis (Arabidopsis thaliana) PHOSPHO-BASE N-METHYLTRANSFERASE 1 (PMT1) and PMT3 was reported with reduced PC content and defective plant growth. However, residual PC content as well as the nonlethal phenotype of the mutant suggests an additional enzyme contributes to PC biosynthesis. In this article, we report on the role of three PMTs in PC biosynthesis and plant development, with a focus on PMT2. PMT2 had the highest expression level among the three PMTs, and it was highly expressed in roots. The pmt1 pmt2 double mutant enhanced the defects in root growth, cell viability, and PC content of pmt1, suggesting that PMT2 functions together with PMT1 in roots. Chemical inhibition of PMT activity in wild-type roots reproduced the short root phenotype observed in pmt1 pmt2, suggesting that PMT1 and PMT2 are the major PMT isoforms in roots. In shoots, pmt1 pmt2 pmt3 enhanced the phenotype of pmt1 pmt3, showing seedling lethality and further reduced PC content without detectable de novo PC biosynthesis. These results suggest that PMTs catalyze an essential reaction step in PC biosynthesis and that the three PMTs have differential tissue-specific functions in PC biosynthesis and plant growth.
Phosphatidylcholine (PC) is an important class of phospholipid in eukaryotes. In Arabidopsis (Arabidopsis thaliana), PC represents an abundant lipid class in extraplastidic membranes (Devaiah et al., 2006). PC is synthesized by incorporating the phosphocholine (PCho) polar head group into the sn-1,2-diacylglycerol (DAG) backbone, which is catalyzed by aminoalcohol aminophosphotransferase (AAPT; Liu et al., 2015). DAG is a common precursor for the biosynthesis of different glycerolipid classes, so its biosynthetic pathway has been studied extensively. On the other hand, the biosynthesis of polar head groups, such as PCho, has been less well investigated. It is known that biosynthesis of PCho involves three sequential methylations of phosphoethanolamine (PEtn) catalyzed by phospho-base N-methyltransferase (PMT; Bolognese and McGraw, 2000). The product, PCho, is converted to cytidine diphosphocholine (CDP-Cho) by CTP:phosphorylcholine cytidylyltransferase (CCT; Inatsugi et al., 2002, 2009), then is incorporated into the DAG backbone by AAPT to produce PC (Liu et al., 2015). Because PEtn is a common precursor for the biosynthesis of PC and phosphatidylethanolamine (PE; Mizoi et al., 2006), PMT catalyzes the beginning reaction step of the PC biosynthetic pathway and thus may have a critical role in PC biosynthesis.
Methylation of the ethanolamine group occurs either at the phospho base or phosphatidyl base. For example, in Arabidopsis and other seed plants, the first methylation in the synthesis of choline (Cho) moieties occurs exclusively at the level of PEtn (Hanson and Rhodes, 1983; Datko and Mudd, 1988; Summers and Weretilnyk, 1993; Nuccio et al., 2000), while the second and third methylation occur either at the phospho base or the phosphatidyl base. In contrast, the methyltransferases in Saccharomyces cerevisiae take only a phosphatidyl base as a substrate, so they convert PE to PC but not PEtn to PCho (Kodaki and Yamashita, 1989). Arabidopsis has three PMTs and one phosphatidyl-base N-methyltransferase (PLMT). PLMT1 is involved in the second and third but not the first methylation of PE (Keogh et al., 2009). Knocking out PLMT1 does not alter PC level significantly (Keogh et al., 2009), suggesting that the PLMT1-mediated pathway is not the primary PC biosynthesis pathway in Arabidopsis. The three PMTs, PMT1 (or NMT1, PEAMT1, XPL1; At3g18000), PMT2 (or PMEAMT; At1g48600), and PMT3 (or NMT3, At1g73600), are shown to catalyze all of the three methylation steps in vitro (Lee and Jez, 2017). Knocking out of PMT1 causes root growth defects and a slight reduction in PC content (Cruz-Ramírez et al., 2004). Disruption of PMT2 by transfer DNA (T-DNA) has no effect on PC level and plant growth (BeGora et al., 2010). Gene knockout of PMT3 did not cause major defects in plant growth or PC content (Lee and Jez, 2017; Chen et al., 2018); however, the pmt1 pmt3 double mutant significantly affected PC content (Chen et al., 2018). Although this result indicates that PMT1 and PMT3 are the major PMT isoforms in PC biosynthesis and plant growth, the residual PC content and nonlethal phenotype of pmt1 pmt3 suggest the involvement of another enzyme in PC biosynthesis.
To provide a comprehensive understanding of the function of the three PMT isoforms in PC biosynthesis and plant growth, we herein focused on PMT2, a less-characterized isoform with regard to its function in vivo. We showed that PMT2 has a distinct expression profile with the highest expression in roots. Indeed, the pmt1 pmt2 double mutant had enhanced defective root growth, cell viability, and PC content compared with the pmt1. Moreover, the pmt1 pmt2 pmt3 triple mutant enhanced the severe growth defect of pmt1 pmt3. The triple mutant had no detectable de novo PC biosynthesis activity, resulting in about 20% the PC content of the wild type and seedling lethality. These results suggest that the three PMTs play critical roles in PC biosynthesis, providing evidence that PC is an essential phospholipid class in Arabidopsis.
RESULTS
Expression of PMT2
To investigate the in vivo function of PMT2, we referred to a public gene expression database to analyze the tissue-specific and developmental stage-specific expression patterns of the three PMTs; we used GENEVESTIGATOR (Hruz et al., 2008). PMT2 showed a distinct tissue-specific expression pattern (Fig. 1A). Compared with PMT1 and PMT3, PMT2 showed higher expression in roots, including the primary and lateral roots, elongation and maturation zones, and the stele. Next, we compared the developmental stage-specific expression profiles (Fig. 1B). Among the three PMTs, PMT2 showed the highest expression level in all developmental stages analyzed. The expression level was lower in germinating seeds, mature siliques, and during senescence compared with the other stages. These data suggest that PMT2 is the major isoform of the three PMTs and is consistently expressed in most developmental stages with a root-specific expression pattern.

Expression pattern of PMT2. A, A heatmap of the tissue-specific gene expression patterns of PMT1, PMT2, and PMT3. Data shown were obtained from GENEVESTIGATOR. B, Expression patterns of PMT1, PMT2, and PMT3 at different developmental stages. Stage of development (left to right); germinating seed, seedling, young rosette, developed rosette, bolting rosette, young flower, developed flower, flowers and siliques, mature siliques, and senescence. “High,” “Medium,” and “Low” expression were calculated by microarray assay. The number of samples indicates microarray gene expression data collected by GENEVESTIGATOR. C to G, Tissue-specific expression of PMT2-GUS in Arabidopsis ProPMT2:PMT2-GUS pmt1-1 pmt2-1 in a 14-d-old seedling (C), flowers at different developmental stages (D), a young floral bud (E), a flower before anther dehiscence (F), and a mature flower (G). Bars = 10 mm (C), 500 μm (D), 50 μm (E), 100 μm (F), and 200 μm (G).
To confirm the results of the database analysis, we produced a construct of the genomic sequence of PMT2 including the 5′ promoter region and open reading frame followed by a β-glucuronidase (GUS) reporter and transduced it into the pmt1-1 pmt2-1 mutant background (ProPMT2:PMT2-GUS pmt1-1 pmt2-1). In the T2 generation, we isolated 34 independent transgenic lines that harbor the transgene. We selected three representative lines (7, 17, and 23) for histochemical GUS staining. During vegetative growth of line 7, PMT2-GUS was highly expressed in leaf veins and in both mature root tissue and root tips (Fig. 1C). In floral organs, PMT2-GUS expression was observed clearly in young stamens (Fig. 1, D and E), but faintly in mature flowers (Fig. 1, F and G). This expression pattern was consistent with that of the other two lines. Moreover, ProPMT2:PMT2-GUS pmt1-1 pmt2-1 complemented the short root phenotype of pmt1-1 pmt2-1, suggesting that PMT2-GUS is functional in vivo (Supplemental Fig. S1). Thus, GUS staining supported the higher expression level of PMT2 in roots, and the method showed leaf vasculature as an additional site where PMT2 is highly expressed.
Mutation of PMT2 Enhanced the Defective Root Growth of pmt1-1
Expression of PMT2 was highest in the roots (Fig. 1A). However, in agreement with the previous report (BeGora et al., 2010), no root phenotype was found in the pmt2 mutants. We anticipated a possible overlap in function between PMT1 and PMT2 in root growth, because PMT1, but not PMT3, was also highly expressed in roots (Fig. 1A) and the pmt1 mutant shows a short root phenotype (Cruz-Ramírez et al., 2004). We therefore created the pmt1-1 pmt2-1 double mutant to investigate whether the root phenotype in pmt1-1 is enhanced by pmt2-1. Significantly reduced root length characterized the 20-d-old pmt1-1 and pmt1-2 seedlings, whereas pmt2-1 and pmt2-2 did not show such a reduction (Fig. 2A). Here, we found that pmt1-1 pmt2-1 had further reduced root length as compared with pmt1-1 and pmt1-2. Indeed, quantitative measurement of the root length showed that the primary root length of pmt1-1 pmt2-1 was about 25% that of the wild type and about 50% that of pmt1-1 (Fig. 2B). A closer look at the root morphology during the first 6 d after germination showed that pmt1-1 pmt2-1 showed reduced growth of the main root as compared with pmt1-1 or the wild type (Fig. 2, C to E). At 3 d after germination, the mutants showed significantly retarded growth in the main root but generated precocious lateral branches, whereas the wild-type roots still had no lateral branches. From 4 to 6 d after germination, the mutants produced more extensive lateral branches at the expense of primary root elongation. The pmt1-1 pmt2-1 mutant showed swelling of the root in addition to entirely reduced growth of lateral roots (Fig. 2D), whereas pmt1-1 showed relatively competent lateral root growth (Fig. 2C).
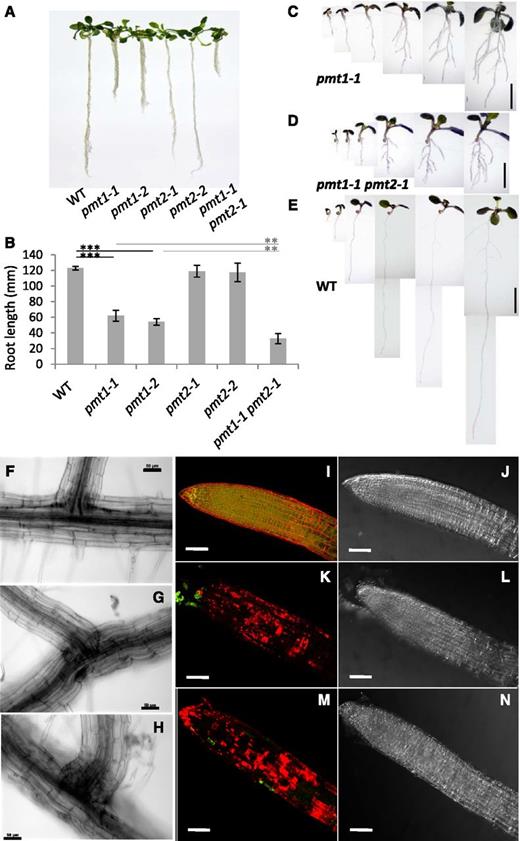
Mutation of PMT2 enhanced the root phenotype of the pmt1 mutant. A, Phenotype of 20-d-old seedlings of the pmt1-1, pmt1-2, pmt2-1, pmt2-2, and pmt1-1 pmt2-1 mutants as compared with the wild type (WT). B, Quantitative measurement of root length observed in (A). Data are mean ± sd from 16 seedlings with three biological replicates. Statistical significance was analyzed by Student’s t test (**, P < 0.01; ***, P < 0.001). C to E, Daily observation of seedling root development in pmt1-1 (C), pmt1-1 pmt2-1 (D), and the wild type (E) from 1 to 6 d after germination (from left to right). Bars = 5 mm. F to H, Epidermal morphology of main roots producing lateral branches in the wild type (F), pmt1-1 (G), and pmt1-1 pmt2-1 (H). Bars = 50 μm. I to N, Viability of root cells by double staining with propidium iodide (PI; red) and fluorescein diacetate (FDA; green). Shown are fluorescent (I, K, M) and bright-field (J, L, N) images of the wild type (I and J), pmt1-1 (K and L), and pmt1-1 pmt2-1 (M and N). Bars = 0.1 mm.
To obtain further evidence of the enhanced root growth defect in the pmt1-1 pmt2-1 mutant, we observed the cellular architecture of the branching part of the root (Fig. 2, F to H). In the wild type, epidermal cells were orderly shaped, for a flat root surface (Fig. 2F). In pmt1-1, the surface of the main root was swollen, despite the normal shape of the epidermal cells at the base of the lateral branch (Fig. 2G). However, in pmt1-1 pmt2-1, the main root surface was swollen, and epidermal cells at the base of the lateral branch bulged abnormally (Fig. 2H). Thus, in pmt1-1 pmt2-1, cell growth may be impaired at the branch points of roots, causing abnormal lateral root development.
To determine the viability of root cells in these mutants, we performed double fluorescent staining with propidium iodide (PI) and fluorescein diacetate (FDA) as previously used (Cruz-Ramírez et al., 2004). PI staining indicates dead cells and FDA staining reveals viable cells (Celenza et al., 1995). PI stains cell walls independently of cell viability (Kirik et al., 2001; Chaves et al., 2002). Wild-type root cells showed extensive FDA staining but PI staining was limited to the external surface (Fig. 2, I and J). Root cells of pmt1-1 showed substantial PI staining but diminished FDA staining (Fig. 2, K and L), a result that suggests viable cells of pmt1-1 were limited to the tip of roots (Fig. 2K). In pmt1-1 pmt2-1 roots, PI staining was further enhanced and FDA was barely detectable, even at the root tips (Fig. 2, M and N), a finding that suggests cell viability was further impaired in pmt1-1 pmt2-1 as compared with pmt1-1. Taken together, we concluded that mutation in PMT2 enhanced the defective root growth of pmt1-1.
Genetic and Chemical Complementation of the Root Phenotype in pmt1-1 and pmt1-1 pmt2-1
To determine whether the enhanced root growth defects in pmt1-1 pmt2-1 were due to mutations in PMT1 and PMT2, we conducted genetic complementation of the phenotype by introducing transacting genomic sequences of the respective genes (ProPMT1:PMT1 and ProPMT2:PMT2) into pmt1-1 pmt2-1. We isolated 10 independent transgenic lines of each. In contrast to the root length of pmt1-1 pmt2-1, the root length of ProPMT1:PMT1 pmt1-1 pmt2-1 was indistinguishable from that of the wild type. Furthermore, the root length of ProPMT2:PMT2 pmt1-1 pmt2-1 was similar to pmt1-1 (Fig. 3, A and B). We confirmed this result by measuring the root length of all transgenic lines we isolated (Supplemental Fig. S2). Thus, the root growth defect in pmt1-1 pmt2-1 was caused by mutations in PMT1 and PMT2.
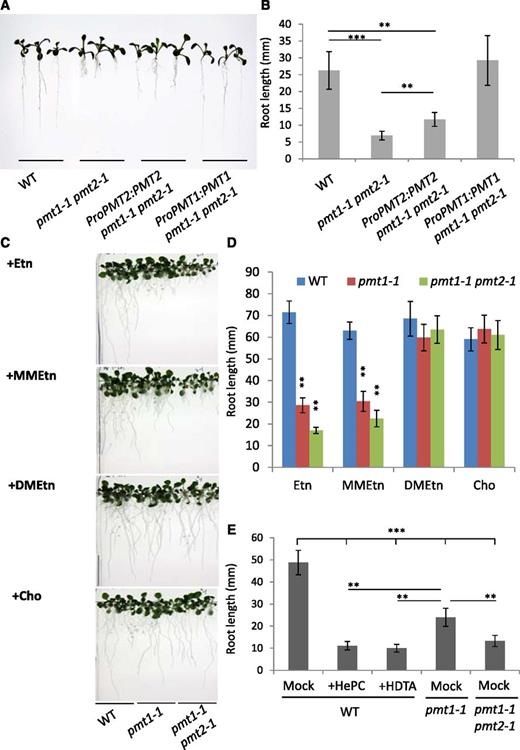
Genetic and chemical complementation of root growth in pmt1-1 pmt2-1. A and B, Overall seedling phenotype (A) and root length (B) of the 7-d-old seedlings of the wild type, pmt1-1 pmt2-1, ProPMT1:PMT1 pmt1-1 pmt2-1, and ProPMT2:PMT2 pmt1-1 pmt2-1. C and D, Chemical complementation of root phenotype by 100 μm of ethanolamine (Etn), N-monomethylethanolamine (MMEtn), N-dimethylethanolamine (DMEtn), and choline (Cho). Overall seedling phenotype (C) and root length (D) of 14-d-old pmt1-1, pmt1-1 pmt2-1, and the wild-type seedlings. E, Chemical inhibition of PMT activity reproduced the defective root growth phenotype of pmt1-1 pmt2-1. Root length of the 10-d-old wild-type seedlings treated with 100 μm of hexadecylphosphocholine (HePC) or hexadecyltrimethylammonium bromide (HDTA) as compared with mock treatment (Mock) of the wild type, pmt1-1, and pmt1-1 pmt2-1. Data for the measurement of root length are mean ± sd from 16 seedlings and three biologically independent experiments. Statistical significance was analyzed by Student’s t test (**, P < 0.01; ***, P < 0.001). WT, the wild type.
To examine whether the short root phenotype in pmt1-1 pmt2-1 is due to defective PCho biosynthesis, we conducted a chemical complementation experiment. The short root phenotype of pmt1 is rescued by exogenous supplementation of Cho to the Murashige and Skoog (MS) agar plate, which is readily taken up and is phosphorylated by endogenous Cho kinase activity to produce PCho (Cruz-Ramírez et al., 2004). As shown in Figure 3C, exogenous supplementation of 100 μm Cho to the MS medium rescued the short root phenotype of pmt1-1 pmt2-1 and pmt1-1 (Fig. 3D), whereas ethanolamine (Etn) supplementation did not complement the phenotype (Fig. 3, C and D). Interestingly, we found that dimethylethanolamine (DMEtn) but not monomethylethanolamine (MMEtn) complemented the root phenotype (Fig. 3, C and D), suggesting that dimethylation is sufficient for functional complementation of the root phenotype in pmt1-1 pmt2-1 and pmt1-1.
To further examine the link between PMT activity and root growth, we employed chemical inhibitors against PMT activity. Hexadecylphosphocholine (HePC) and hexadecyltrimethylammonium bromide (HDTA) are known to inhibit PMT activity (Bobenchik et al., 2010), so we treated the wild-type seedlings with these compounds and observed the effect on root growth. As shown in Figure 3E, the 10-d-old wild-type roots treated with HePC and HDTA were significantly shorter compared with mock-treated roots, and these shorter roots were indistinguishable from those of pmt1-1 pmt2-1 with mock treatment. Thus, chemical inhibition of PMT in the wild type reproduced the pmt1-1 pmt2-1 root growth defect, suggesting that PMT1 and PMT2 are responsible for the PMT activity required for root growth.
Polar Glycerolipid Contents Were Differently Affected in the Shoot and Root of pmt1-1 pmt2-1 Seedlings
Because PCho is a precursor for the biosynthesis of PC, a predominant membrane phospholipid class, we analyzed the contents of polar glycerolipid classes in the shoots and roots of 20-d-old seedlings of the wild type, pmt1-1, and pmt1-1 pmt2-1. In shoots, no significant difference was found in the lipid contents among these lines (Fig. 4A). However, in roots, pmt1-1 pmt2-1 showed a significant decrease in PC content and an increase in PE content, whereas the other lipid classes did not show any significant changes (Fig. 4B). These results suggest that PMT1 and PMT2 play roles in PC biosynthesis in roots. Thus increased PE content may be due to reduced PMT activity, which altered the metabolic flux toward PE biosynthesis.
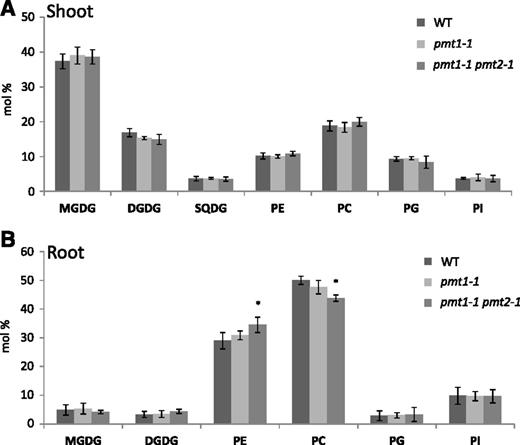
Polar glycerolipid profiles in the shoot (A) and root (B) of 20-d-old seedlings of pmt1-1 pmt2-1 as compared with the wild type and pmt1-1. Seedlings were grown on MS medium at a half-strength concentration. Data are mean ± sd from three biological replicates. Statistical significance among the wild type and each mutant was analyzed by Student’s t test (*, P < 0.05). DGDG, digalactosyldiacylglycerol; MGDG, monogalactosyldiacylglycerol; PC, phosphatidylcholine; PE, phosphatidylethanolamine; PG, phosphatidylglycerol; PI, phosphatidylinositol; SQDG, sulfoquinovosyldiacylglycerol; WT, wild type.
Three PMTs Differently Affected PMT Activity in Shoot and Root
To dissect the differential contribution of the three PMT isoforms in shoot and root, we performed a pulse-chase assay using 14C-labeled Etn in 14-d-old seedlings of the wild type, pmt1-2, pmt2-1, and pmt3-1. Following 15 min of labeling, labeled PEtn and PCho were chased at 0, 4, and 6 h in shoots and roots. As shown in Figure 5, no significant difference was observed in the levels of PEtn at 4 h and 6 h in shoot and root, although a slight difference was observed at 0 h, possibly due to the short period of time for chasing. However, profiles of labeled PCho showed some marked differences among the mutants. In shoots, pmt3-1 showed significantly reduced levels of labeled PCho at 4 h and 6 h compared with the wild type. At 6 h, pmt2-1 also showed a significant reduction of labeled PCho compared with the wild type, albeit to a lesser extent compared with pmt3-1. In roots, all of the pmt mutants showed a significantly reduced level of labeled PCho at 4 h. These results suggest that all PMT isoforms contribute to the PMT activity in roots, whereas PMT3 is the primary contributor in shoots, with minor contribution from PMT2.
![Pulse-chase assay of 14-d-old seedlings of the wild type (WT), pmt1-2, pmt2-1, and pmt3-1 using 14C-labeled Etn. Following 15 min of labeling, seedlings were harvested at 0, 4, and 6 h. Shoot and root were separated for the analysis of labeled compounds by TLC. Radioactive intensity of [14C]PEtn and [14C]PCho were quantified and plotted by % of total intensity of labeled compounds. Data are mean ± SEM from three biological replicates. Statistical significance was analyzed by Student’s t test (*, P < 0.05; **, P < 0.01; ***, P < 0.001).](https://oup.silverchair-cdn.com/oup/backfile/Content_public/Journal/plphys/179/2/10.1104_pp.18.01408/2/m_plphys_v179_2_433_f5.jpeg?Expires=1747878036&Signature=kFgTTw-SwF107nMGxGDNDjedVPb22WoTofiwkICi-VKArAYiT0cPO12~BgFDYWt37NBYCaJUQ-gFJBZwMfBGtQyN75vM~B-CoFRSSjFhaGaDmFXgUZLGfebTdLeL2wJ5KB1wnvlcN562HICeoqv9dq8IUeVRd-X86Vw446J~cK35vn5vEaKAL9ajB0yPVN55QpgUgCvftDPF3itvc7cpJ3y0v-9yUvFGXaswGfg0h6hnESANgXb50oKr9xHbnlhFXxTrkulNrqXIoBomQYjwwyy146YIDWf7k66sNuAg107wm~osiMl2CvBGnadJW5~L0LyGtIXa74k~t0Ng3IJn2g__&Key-Pair-Id=APKAIE5G5CRDK6RD3PGA)
Pulse-chase assay of 14-d-old seedlings of the wild type (WT), pmt1-2, pmt2-1, and pmt3-1 using 14C-labeled Etn. Following 15 min of labeling, seedlings were harvested at 0, 4, and 6 h. Shoot and root were separated for the analysis of labeled compounds by TLC. Radioactive intensity of [14C]PEtn and [14C]PCho were quantified and plotted by % of total intensity of labeled compounds. Data are mean ± SEM from three biological replicates. Statistical significance was analyzed by Student’s t test (*, P < 0.05; **, P < 0.01; ***, P < 0.001).
The PMT Triple Mutant Was Seedling Lethal
We next focused on the contribution of PMT2 in shoot growth. The pmt1 pmt3 double mutant was shown to severely affect both vegetative and reproductive growth (Chen et al., 2018; Liu et al., 2018b). However, PC biosynthesis is not completely blocked and the genotype is nonlethal. We hypothesized that the remaining PC biosynthesis is owed to PMT2. To find out, we created the triple mutant pmt1 pmt2 pmt3 and examined its growth and lipid phenotypes. Because pmt1 pmt3 severely reduces fertility, we crossed pmt1 pmt2 with pmt3 to obtain the triple mutant. About 25% of germinating seedlings from pmt1-2 pmt2-2 pmt3-1/+ offspring showed a chlorotic phenotype (Fig. 6A), and these were confirmed by polymerase chain reaction (PCR)-based genotyping to be the triple homozygous mutants. As compared with the wild type, 10-d-old seedlings of pmt1-2 pmt2-2 pmt3-1 showed pale cotyledons without visible emerging true leaves (Fig. 6B). We wanted to observe whether the severe seedling phenotype of pmt1-2 pmt2-2 pmt3-1 is enhanced as compared with the pmt1-2 pmt3-1. We performed time-course observation of seedling growth from 11 to 37 d after germination (Fig. 6C). We produced a second triple mutant (pmt1-1 pmt2-1 pmt3-2) to confirm the enhancement of the phenotype. Eleven days after germination, pmt1-2 pmt3-1 and pmt1-2 pmt2-2 pmt3-1 showed no clear morphological differences, except that the cotyledons of pmt1-2 pmt3-1 were more greenish. By 17 d after germination, the shoot apices of pmt1-2 pmt3-1 remained green and then started to produce underdeveloped true leaves at 21 d. However, pmt1-2 pmt2-2 pmt3-1 had lost all green tissue by day 14, and no further development occurred at subsequent days. At the 37-d-old growth stage, pmt1-2 pmt3-1 was dwarfed but alive, whereas pmt1-2 pmt2-2 pmt3-1 appeared dead—no morphological change was observed after 14 d. The pmt1-1 pmt2-1 pmt3-2 mutant also showed a similar growth profile to pmt1-2 pmt2-2 pmt3-1, although pmt1-1 pmt3-2 plants were slightly healthier than pmt1-2 pmt3-1 in their seedling growth. We performed chemical complementation of the seedling growth. Seeds obtained from a pmt1-1 pmt2-1 pmt3-2/+ mutant were planted on an MS agar plate with (+PCho) or without (-PCho) 100 μm of PCho; seedlings were observed at 14 d old. Seedlings of the triple mutant (indicated with red arrows in Supplemental Figure S3) in the presence of PCho recovered the cotyledons compared with those without PCho. However, true leaf formation was not fully rescued as they produced narrow leaves even in the presence of PCho. Thus, these observations demonstrate that mutation in PMT2 enhances the severe growth phenotype of pmt1 pmt3, and that pmt1 pmt2 pmt3 is lethal at postembryonic seedling growth at 14 d after germination.
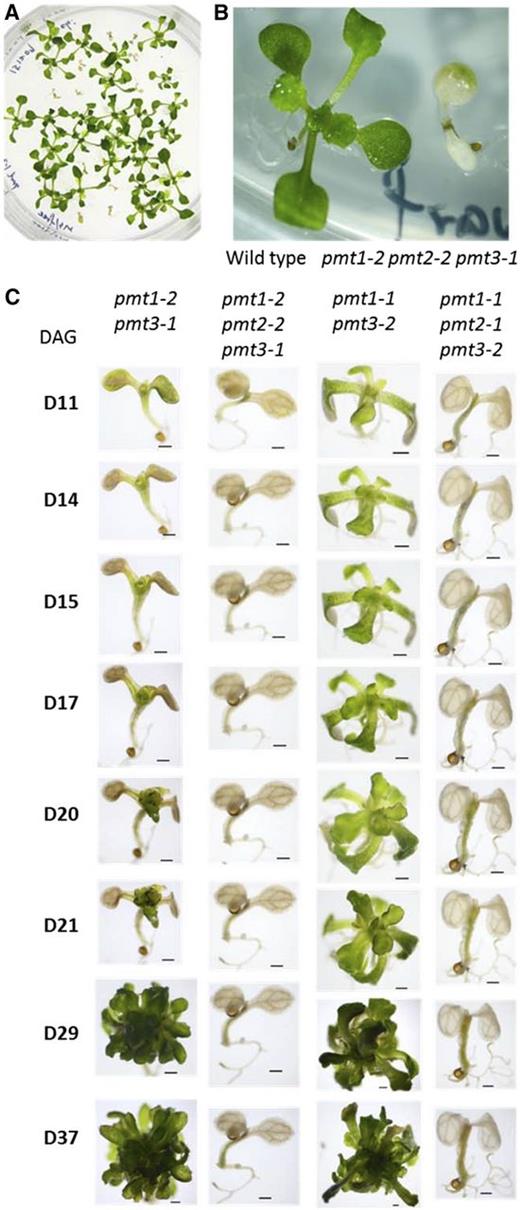
Isolation and observation of the pmt1 pmt2 pmt3 triple mutants. A, Isolation of pale seedlings from the germinating offspring of a pmt1-2 pmt2-2 pmt3-1/+ plant. Pale seedlings were found at a frequency of about 25% in the population of pmt1-2 pmt2-2 pmt3-1/+ offspring. B, A magnified image of the 10-d-old wild type and pmt1-2 pmt2-2 pmt3-1 seedlings. C, Time-course observation from 11 to 37 d after germination (DAG) of defective seedling growth for two different alleles of pmt1 pmt2 pmt3 triple mutants compared with the respective alleles of pmt1 pmt3 double mutants.
The pmt1 pmt2 pmt3 Triple Mutant Was Devoid of de Novo PC Biosynthesis
To investigate PC profiles associated with the lethal phenotype of pmt1 pmt2 pmt3, we quantified the amount of PC in 14-d-old seedlings of the wild type, pmt1-2 pmt3-1, and pmt1-2 pmt2-2 pmt3-1. As shown in Figure 7A, PC content in pmt1-2 pmt3-1 was about half that of the wild type. In the triple mutant, a further significant reduction in PC content was observed, which was about 20% that of the wild type. We also analyzed the fatty acid composition of PC (Fig. 7B). Compared with the wild type, the fatty acid composition of PC in pmt1-2 pmt2-2 pmt3-1 showed a significant increase in 16:0, 16:2, and 18:0 but a decrease in 18:1, 18:2, and 18:3 contents. Thus, PC in pmt1-2 pmt2-2 pmt3-1 possessed considerably saturated fatty acid profiles with increased C16/C18 ratio. We further analyzed the abundance of four major membrane glycerolipid classes, namely monogalactosyldiacylglycerol (MGDG), digalactosyldiacylglycerol (DGDG), PE, and PC (Fig. 7C). Compared with the wild type, pmt1-2 pmt2-2 pmt3-1 showed considerable reduction in MGDG but not DGDG content. Besides, PE content increased markedly while the PC level decreased. Thus, pmt1-2 pmt2-2 pmt3-1 showed an unusual membrane lipid composition, with PE as the predominant lipid class at the expense of MGDG and PC.
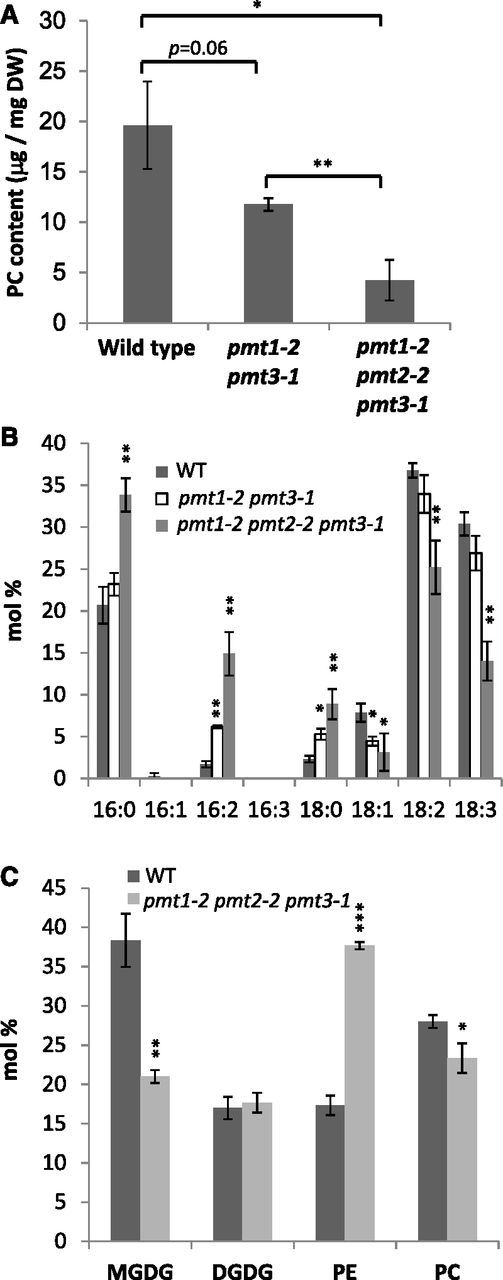
Analysis of PC and other primary membrane glycerolipid classes (MGDG, DGDG, and PE) in the 14-d-old seedlings of the wild type (WT) and pmt1-2 pmt2-2 pmt3-1. A, Amount of PC in the wild type, pmt1-2 pmt3-1, and pmt1-2 pmt2-2 pmt3-1 per dry tissue weight (DW) in 14-d-old seedlings. B, Fatty acid composition (mol %) of PC analyzed in (A). C, Contents of MGDG, DGDG, PE, and PC shown by mol % in the 14-d-old seedlings of the wild type and pmt1-2 pmt2-2 pmt3-1. Data are mean ± sd from three biological replicates. Statistical significance was analyzed by Student’s t test (*, P < 0.05; **, P < 0.01; ***, P < 0.001). In (B) and (C), significance was analyzed as compared with the wild type.
To examine whether pmt1 pmt2 pmt3 is capable of de novo PC biosynthesis, we labeled the 14-d-old wild-type and pmt1-1 pmt2-1 pmt3-2 seedlings with [14C]Etn and quantified the amount of labeled PCho. As shown in Figure 8A and Supplemental Figure S4, no labeled PCho was detected in the extract of pmt1-1 pmt2-1 pmt3-2, whereas significant amounts were found in the wild-type extracts. To test if PC biosynthesis was affected, we quantified the amount of labeled PC, which again showed no detectable amount in pmt1-1 pmt2-1 pmt3-2 (Fig. 8A). This suggests that pmt1-1 pmt2-1 pmt3-2 is devoid of de novo PC biosynthesis, and the remaining PC is derived from a carry-over of Cho-containing compounds from embryonic growth. Indeed, seedlings of pmt1-1 pmt2-1 pmt3-2 and pmt1-2 pmt2-2 pmt3-1 whose seed coats and aleurone were removed before germination were smaller at the time of growth arrest (Fig. 8B).
![Characterization of pmt1 pmt2 pmt3 triple mutants. A, Levels of radiolabeled PCho and PC in the 14-d-old seedlings of the wild type and pmt1-1 pmt2-1 pmt3-2 following [14C]Etn labeling. Radioactive intensity (arbitrary unit) was normalized to the fresh weight of seedlings. Data are mean ±sd from three biological replicates. N.D., not detectable. B, Phenotype of the 14-d-old seedlings of the wild type, pmt1-1 pmt2-1 pmt3-2 and pmt1-2 pmt2-2 pmt3-1 with or without removing the seed coat before germination. A representative image was shown for each condition (n > 30). Bars = 2mm.](https://oup.silverchair-cdn.com/oup/backfile/Content_public/Journal/plphys/179/2/10.1104_pp.18.01408/2/m_plphys_v179_2_433_f8.jpeg?Expires=1747878036&Signature=y40wqLymk~aDDtGh-ghbCVK1u5~2Lvml62QiflkbjZDB7Gd5eCp4U41FqlyTq~2mcA3I11f5pFCfAh78Yg0KabnXuIuAJ~QTk-SJEOGm5EUfvX9bJmg6yCM4OraZep-mrpXQzN1MSSb1Iq75WFs3bXRU0t6ndt7qfqMu~AZvOuqWuxyYZhnp3c-gOLvLjEwrywLhqS7b5gl8e8WS8SGqki9~8IGdmTzwrAKoF7UrowZUDKgFDA~qMpl3c5DMfilsJQqOEJApe8NUsfcHU~9Fktku-mRTJ4S3ayTBYku90g1hXU8soUYkeUEi~2jYhkmAz1nfZ4Xz3edPSmPJEf3U3Q__&Key-Pair-Id=APKAIE5G5CRDK6RD3PGA)
Characterization of pmt1 pmt2 pmt3 triple mutants. A, Levels of radiolabeled PCho and PC in the 14-d-old seedlings of the wild type and pmt1-1 pmt2-1 pmt3-2 following [14C]Etn labeling. Radioactive intensity (arbitrary unit) was normalized to the fresh weight of seedlings. Data are mean ±sd from three biological replicates. N.D., not detectable. B, Phenotype of the 14-d-old seedlings of the wild type, pmt1-1 pmt2-1 pmt3-2 and pmt1-2 pmt2-2 pmt3-1 with or without removing the seed coat before germination. A representative image was shown for each condition (n > 30). Bars = 2mm.
DISCUSSION
Role of PMTs in PC Biosynthesis and Plant Growth
We found that PMT2 is highly expressed in roots. Mutation of PMT2 did not affect root growth; however, the double mutant pmt1-1 pmt2-1 enhanced the growth defect and reduced PC content in roots of pmt1-1. Although pmt3-1 showed reduced PMT activity in roots (Fig. 5), neither single mutation of PMT3 nor double mutation of PMT2 and PMT3 showed a seedling phenotype, including in roots (Lee and Jez, 2017; Liu et al., 2018b). Chemical inhibition of PMT activity reduced the root length in the wild type as short as that of the pmt1-1 pmt2-1. This reduction suggests that PMT activity is required for root growth, and that PMT1 and PMT2 contribute to this activity. The pmt1 pmt3 mutant has reduced root growth (Chen et al., 2018). Although PMT3 transcript was hardly detectable in roots (Fig. 1A) and the pmt3 single mutant does not affect root growth (Lee and Jez, 2017), our pulse-chase experiment showed that pmt3-1 roots have reduced PMT activity (Fig. 5). It is possible that reduced root growth in pmt1 pmt3 may be due to further reduction of the PMT activity rather than a secondary effect of defective shoot growth. The pmt1-1 pmt2-1 mutant had further reduced epidermal cell viability (Fig. 2, F to N) and main root length (Fig. 2, A and B) compared with pmt1-1. We have no further explanation as to why defective PMT activity causes such phenotypes. Results of a chemical complementation experiment suggest that at least dimethylated Etn is required to fully rescue root growth in the PMT mutants. Exogenous supplementation of choline or PCho also rescues the root growth in pmt1 (Cruz-Ramírez et al., 2004); however, whether these compounds or some derivatives thereof rescued the phenotype remains open to discussion.
The pmt1-1 pmt2-1 mutant showed a significant decrease in root PC content (Fig. 4B), which was in line with the result of pulse-chase labeling (Fig. 5). However, a substantial amount of PC remained in the roots. Remaining PC biosynthetic activity can be explained by PMT3 or PLMT1. PMT3 is hardly expressed in roots (Fig. 1A), but our pulse-chase experiment showed that pmt3-1 roots have reduced PMT activity (Fig. 5). The pmt triple mutant is devoid of de novo PC biosynthesis (Fig. 8A) and is seedling lethal. Because PCho is abundant in the vasculature, shoot-derived PCho can compensate for its loss in roots, possibly through vascular transport. Indeed, a mutant of CHOLINE TRANSPORTER-LIKE 1 (CTL1) affects root growth (Dettmer et al., 2014). Involvement of PLMT1 postulates that the first methylation occurs at phospho-base level, because PLMT1 does not catalyze the first methylation step at the phosphatidyl base (Keogh et al., 2009). The lethal phenotype of the pmt triple mutant demonstrates an essential role of PMTs in postembryonic growth. However, considering that knockout of most other phospholipid enzymes causes embryonic or gametophytic lethal phenotypes, this phenotype is somewhat mild. Although the triple mutant is devoid of de novo PC biosynthesis (Fig. 7), the mutant still possesses a detectable amount of PC (Fig. 7A). It is possible that the remaining PC is derived from a carry-over of Cho-containing compounds from embryonic growth or from an as-yet-unknown PC biosynthetic pathway independent of PMT. Indeed, we observed that removal of the seed coat before germination considerably affects the seedling growth of the triple mutants (Fig. 8B). Thus, our data clearly demonstrate that three PMTs are essential in de novo PC biosynthesis and plant growth, as shown by their different contributions to PMT activity in shoot and root (Fig. 5). This highlights the reaction catalyzed by the phospho-base methyltransferase as an essential reaction step in the primary PC biosynthesis pathway.
An Updated Metabolic Map of PC Biosynthesis
Because the triple mutant pmt1 pmt2 pmt3 has been characterized in this work, we propose an updated metabolic map for the biosynthesis of PC and PE in Arabidopsis (Fig. 9). The initial reaction step is the conversion of Ser to Etn by SERINE DECARBOXYLASE 1 (SDC1; Yunus et al., 2016; Liu et al., 2018a). The product Etn is then phosphorylated to PEtn by CHOLINE/ETHANOLAMINE KINASE 4 (CEK4; Lin et al., 2015). Because overexpression of SDC1 or CEK4 increases PC content (Lin et al., 2015; Yunus et al., 2016), the pathway catalyzed by these enzymes contributes to PC biosynthesis. The product PEtn has two alternative metabolic fates. To synthesize PE, PEtn is converted to CDP-Etn by CTP:PHOSPHORYLETHANOLAMINE CYTIDYLYLTRANSFERASE 1 (PECT1; Mizoi et al., 2006), then CDP-Etn is converted to PE by AAPT1 and AAPT2 (Liu et al., 2015). To synthesize PC, PMT1, PMT2, and PMT3 redundantly function to produce PCho (shown in this work). PCho is converted to CDP-Cho by CCT1 and CCT2 (Inatsugi et al., 2002, 2009), then CDP-Cho is converted to PC by AAPT1 and AAPT2 (Liu et al., 2015). In animal cells, PCho biosynthesis from Cho by Cho kinase contributes significantly to PC biosynthesis because Cho is provided through the food intake (Wu and Vance, 2010). In plants, Cho is produced from Etn through PMT activity (Rhodes and Hanson, 1993), thus phosphorylation of Cho may not be a major pathway for PC biosynthesis. Indeed, none of the putative Cho kinases (CEK1, 2, and 3) affect PC contents when knocked out (Lin et al., 2015). In addition, double knock out of two PCho phosphatases (PECP1 and PS2) does not affect PC (Hanchi et al., 2018). Gene knockout studies have shown that SDC1, CEK4, and PECT1 are essential in embryogenesis because their null mutants show an embryonic-lethal phenotype (Mizoi et al., 2006; Lin et al., 2015; Yunus et al., 2016). Besides, the double knockout mutant of AAPT1 and AAPT2 cannot be isolated, possibly due to a reproductive defect (Liu et al., 2015). Considering the similar embryonic defects in these mutants, it is possible that PE biosynthesis is required for embryogenesis and thus is an essential phospholipid class. On the other hand, the requirement of PC in plant development has remained obscure. Single mutants of cct1 and cct2 showed no defective growth (Inatsugi et al., 2002, 2009), and knock-down mutants of AAPT1 and AAPT2 do not affect PC content (Liu et al., 2015). Because our study on the triple mutant demonstrated an essential role of PC biosynthesis in plant growth, further investigation is required with regard to the specific developmental defects caused by PC deficiency.
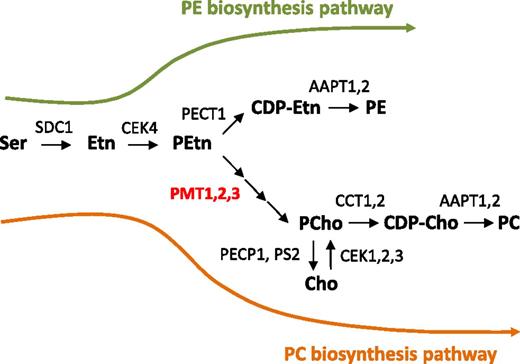
An updated metabolic pathway for the biosynthesis of PE and PC in Arabidopsis. A critical step in PC biosynthesis is methylation of PEtn to produce PCho, catalyzed by PMT1, PMT2, and PMT3. AAPT, aminoalcohol aminophosphotransferase; CCT, CTP:phosphorylcholine cytidylyltransferase; CDP-Cho, cytidine diphosphocholine; CDP-Etn, cytidine diphosphoethanolamine; CEK, choline/ethanolamine kinase; Cho, choline; Etn, ethanolamine; PC, phosphatidylcholine; PCho, phosphocholine; PE, phosphatidylethanolamine; PECP1, phosphoethanolamine/phosphocholine phosphatase 1; PECT1, CTP:phosphorylethanolamine cytidylyltransferase 1; PEtn, phosphoethanolamine; PMT, S-adenosylmethionine:phospho-base N-methyltransferase; PS2, phosphate starvation-induced gene 2; Ser, serine; SDC1, Serine decarboxylase 1.
In conclusion, our results demonstrated that PMT activity plays an essential role in PC biosynthesis and that three PMTs have tissue-specific functions in PC biosynthesis and plant growth.
MATERIALS AND METHODS
Plant Materials and Growth Conditions
Arabidopsis (Arabidopsis thaliana) plants (Columbia-0 ecotype) were grown under 16-h light/8-h dark conditions at 22°C. An MS medium was used at half-strength concentration for plant culture (Murashige and Skoog, 1962). Chemical supplementation to seedlings grown on MS agar medium involved commercially available Etn (E9508, Sigma-Aldrich), N-MMEtn (192171, Sigma-Aldrich), N-DMEtn (391263, Sigma-Aldrich), and Cho (C7527, Sigma-Aldrich) at a final concentration of 100 μM, and hexadecylphosphocholine (HePC/miltefosine, 63280, Cayman) and hexadecyltrimethylammonium bromide (HDTA, AM-0833, Amersco) at a final concentration of 100 μM. The T-DNA–tagged mutants, pmt1-1 (CS801444), pmt1-2 (SALK_036458), pmt3-1 (SALK_016929), and pmt3-2 (CS827717) were obtained from The Arabidopsis Information Resource (TAIR). The pmt2-1 (FLAG_115A04) and pmt2-2 (FLAG_423E12) mutants were obtained from the Institut National de la Recherche Agronomique (INRA). The original pmt2-1 and pmt2-2 lines were in the Wassilewskija (WS) ecotype, so they were backcrossed six times with the Columbia-0 ecotype to replace the ecotype background. These mutants were shown to be null (Liu et al., 2018b). The double and triple mutants were created by genetic crossing of the respective single mutants. Homozygous plants were isolated by PCR-based genotyping with gene-specific primers and T-DNA–specific primers (Supplemental Table S1). The combination of primers used to isolate each line was the following: pmt1-1 (YN1051/YN1052 and YN1051/YN144), pmt1-2 (YN1051/JL71 and YN902/KK8), pmt2-1 (YN904/YN905 and YN904/YN795), pmt2-2 (YN906/YN907 and YN795/YN907), pmt3-1 (JL73/JL74 and KK8/YN909), and pmt3-2 (YN912/YN1283 and YN912/YN144). The location of T-DNA was confirmed by DNA sequencing following information available on TAIR’s official Web site (www.arabidopsis.org). None of these T-DNA lines were leaky mutants —we did not detect any full-length transcripts of the tagged genes by reverse transcription-polymerase chain reaction (RT-PCR).
Vector Construction and Plant Transformation
ProPMT1:PMT1 pmt1-1 pmt2-1 and ProPMT2:PMT2 pmt1-1 pmt2-1: genomic sequences for PMT1 (ProPMT1:PMT1) and PMT2 (ProPMT2:PMT2) were amplified by PCR with the primers YN1286 and YN1287, YN1288 and YN1289, respectively. The amplicon was cloned into the pENTR/D-TOPO plasmid vector (Invitrogen) to obtain pCC15 and pCC16, respectively, which was then recombined into the pHGW destination vector with use of LR Clonase (Invitrogen; Karimi et al., 2002) to obtain pCC21 and pCC22, respectively. The plasmids were transduced into the pmt1-1 pmt2-1 background via Agrobacterium tumefasiens GV3101. Transformants were screened on MS media containing hygromycin. Ten independent transformants were screened for each construct, all of which complemented the short root phenotype (Supplemental Fig. S2). Lines 2 and 3, respectively, were selected as representative lines.
ProPMT2:PMT2-GUS pmt1-1 pmt2-1: the genomic sequence of PMT2 without the stop codon and 3′-untranslated region was amplified by PCR with oligonucleotide primers YN1288 and YN1388. The amplicons were cloned into the pENTR/D-TOPO plasmid vector (Invitrogen) to obtain pYL20, which was recombined with the pGWB533 (Nakagawa et al., 2007) by LR Clonase to obtain pYL24. The plasmid was transduced into the pmt1-1 pmt2-1 background by Agrobacterium tumefasiens GV3101. Transformants were screened on MS media containing hygromycin. Twenty-six independent transformants were screened, 21 of which complemented the short root phenotype with detectable GUS staining. We confirmed the consistent GUS staining pattern in three independent transgenic lines (7, 17, 23), and line 7 was selected as a representative line.
Extraction and Analysis of Polar Glycerolipids
Analysis of polar glycerolipid contents was conducted as previously described in Nakamura et al. (2003). Total lipid was extracted as described in Bligh and Dyer (1959), and each glycerolipid class was separated on a silica gel thin-layer chromatography (TLC) plate using the solvent system of chloroform:methanol:aqueous ammonia (120:80:8 by volume) for the first dimension and chloroform:methanol:acetic acid:water (170:20:15:3 by volume) for the second dimension. Each lipid spot was detected under UV light using purimuline, scraped off, and collected for hydrolysis and methylesterification of the acyl moieties with HCl-MeOH containing pentadecanoic acid (15:0) as an internal standard. Obtained fatty acid methyl esters were quantified by gas chromatography (GC-2010, Shimadzu, Japan) equipped with a ULBON HR-SS-10 column (Shinwa Chemical Industries, Japan). Data shown are means ± sd from three biological replicates.
Radiolabeling Experiment
For the pulse-chase experiment, 14-d-old seedlings of the wild type, pmt1-2, pmt2-1, and pmt3-1 were submerged into 4 mL of one-half-strength MS containing 220 pmol of [14C]Etn (55 mCi/mmol) for 15 min. After washing the seedlings with one-half-strength MS, samples were incubated under light and harvested at 0, 4, and 6 h after the start of chasing. Tissues were ground under liquid N2, and extraction was carried out on ice by 90 μL of dichloromethane:acetone (3:1, v/v), and 20 μL of 50 mm ammonium formate (pH 3; Tannert et al., 2018). The aqueous phase (containing Cho, PCho, Etn, and PEtn) was separated by centrifugation at 13,000g, 4°C for 5 min. The extracts of the upper aqueous phase for each of the above assays were spotted on Silica gel 60G TLC plates (Merck) and resolved by using a developing solvent of 95% ethanol and 2% NH4OH (1:1, v/v; Monks et al., 1996). Radioactive spots were visualized by Imaging Plate (Fuji Film) and quantified by image analyzer (Typhoon FLA 7000, GE Healthcare). For radiolabeling of the wild-type and pmt1-1 pmt2-1 pmt3-2, 14-d-old seedlings were labeled and analyzed as described in the pulse-chase labeling section except the labeling time was 3 h. For PC analysis, total lipids from labeled seedlings were extracted as described in Bligh and Dyer (1959). The lipid extracts were then separated on a TLC plate using solvent system of chloroform:methanol:acetic acid (65:25:15 by volume). Radioactive spots were visualized and quantified as described in the pulse-chase experiment section.
Histochemical GUS Staining
GUS staining was performed as described previously in Lin et al. (2015).
Observation of Roots
Root cells stained with propidium iodide (PI) and fluorescein diacetate (FDA) were observed with a confocal microscope (LSM 510 Meta, Zeiss) as described previously by Cruz-Ramírez et al. (2004), except that the FDA concentration was 5 μg/mL and staining time was 5 min.
Removal of Seed Coat
Seed coat was removed as reported previously by Lee and Lopez-Molina (2013).
Nomenclature
The phospho-base N-methyltransferases have been abbreviated differently in Arabidopsis. The abbreviation “NMT” has been used in a few reports (such as in Bolognese and McGraw, 2000; Chen et al., 2018). However, NMT also stands for the N-myristoyltransferases (Pierre et al., 2007); thus NMT is not a unique abbreviation.
XPL
The abbreviation “XPL” was given to At3g18000 because a forward-genetic screen found that mutation in this gene causes swelling in epidermal cells. XPL stands for “xipotl,” which means swelling or tumefaction in the Mexican Nahuatl language (Cruz-Ramírez et al., 2004). However, knockout mutants of the second and third isoforms (At1g48600 and At1g73600) do not cause any swelling phenotype, which suggests that XPL may not be a suitable name for this entire gene family.
PEAMT
The abbreviation “PEAMT” stands for S-adenosyl-Met:phospho-ethanolamine N-methyltransferase, and it was used in a few papers (such as in Mou et al., 2002; Zhang et al., 2010). However, in vitro enzyme activity assay and heterologous complementation assay have shown that this enzyme accepts mono- and di-methylethanolamine as substrates (Bolognese and McGraw, 2000; Chen et al., 2018), so this abbreviation does not accurately reflect the enzymatic feature.
PMEAMT
The abbreviation “PMEAMT” stands for phospho-methylethanolamine N-methyltransferase. It was used to name At1g48600 because yeast heterologous complementation assay showed that this isozyme does not catalyze the first methylation reaction (BeGora et al., 2010). However, later, this isozyme was shown to catalyze the first methylation reaction as well in vitro (Lee and Jez, 2017). Because the other two isozymes also catalyze all the methylation reactions, this abbreviation does not accurately reflect the enzymatic feature.
PMT
The abbreviation “PMT” stands for phospho-base N-methyltransferase. It has been used in Arabidopsis (Lee and Jez, 2017) and other models, including Plasmodium falciparum (a human malaria parasite; Bobenchik et al., 2011). Because this abbreviation describes features of this enzyme family without problems and it also is in accordance with the community standard of nomenclature (Meinke and Koornneef, 1997), we have used the abbreviation PMT in this article.
Accession Numbers
Sequence data from this article can be found under the following Arabidopsis Genome Initiative accession numbers: PMT1 (At3g18000), PMT2 (At1g48600), and PMT3 (At1g73600).
Supplemental Data
The following supplemental materials are available.
Supplemental Figure S1. Measurement of root length in 7-d-old seedlings of ProPMT2:PMT2-GUS pmt1-1 pmt2-1 (Line 7) in comparison with the wild type, pmt1-1, and pmt1-1 pmt2-1.
Supplemental Figure S2. Measurement of root length in 7-d-old seedlings of 10 independent T2 lines of ProPMT1:PMT1 pmt1-1 pmt2-1 and ProPMT2:PMT2 pmt1-1 pmt2-1 compared with the wild type, pmt1-1, and pmt1-1 pmt2-1.
Supplemental Figure S3. Chemical complementation of the seedling phenotype of pmt1-1 pmt2-1 pmt3-2.
Supplemental Figure S4. A TLC image showing spots of radioactive compounds produced by labeling 14-d-old seedlings of the wild type and pmt1-1 pmt2-1 pmt3-2 with [14C]Etn.
Supplemental Table S1. List of oligonucleotide sequences used in this study
ACKNOWLEDGMENTS
We thank Chia-En Chen (Institute of Plant and Microbial Biology, Academia Sinica) for molecular construction. We appreciate research support from the Institute of Plant and Microbial Biology, Academia Sinica (to Y.N. and K.K.) and from the Ministry of Science and Technology, Taiwan (to Y.N).
LITERATURE CITED
Author notes
This work was supported by the core budget of the Institute of Plant and Microbial Biology, Academia Sinica (Y.N. and K.K.) and the Ministry of Science and Technology, Taiwan (no. 106-2628-B-001-002 to Y.N).
Author for contact: [email protected].
Senior author.
The author responsible for distribution of materials integral to the findings presented in this article in accordance with the policy described in the Instructions for Authors (www.plantphysiol.org) is: Yuki Nakamura ([email protected]).
Y-C. Liu and Y-C. Lin performed experiments and analyzed data; K.K. conceived the research plan, supervised experiments, and provided technical support; Y.N. conceived the research plan, performed transgenic plant management and genetic crossing, supervised experiments, and wrote the article. All authors commented on the article and approved the contents.
Articles can be viewed without a subscription.
