


Abstract
Rice (Oryza sativa) endosperm is mainly occupied by homogeneous polygonal starch from inside to outside. However, morphologically different (heterogeneous) starches have been identified in some rice mutants. How these heterogeneous starches form remains unknown. A high-amylose rice line (TRS) generated through the antisense inhibition of starch branching synthase I (SBEI) and SBEIIb contains four heterogeneous starches: polygonal, aggregate, elongated, and hollow starch; these starches are regionally distributed in the endosperm from inside to outside. Here, we investigated the relationship between SBE dosage and the morphological architecture of heterogeneous starches in TRS endosperm from the view of the molecular structure of starch. The results indicated that their molecular structures underwent regular changes, including gradually increasing true amylose content but decreasing amylopectin content and gradually increasing the ratio of amylopectin long chain but decreasing the ratio of amylopectin short chain. Granule-bound starch synthase I (GBSSI) amounts in the four heterogeneous starches were not significantly different from each other, but SBEI, SBEIIa, and SBEIIb showed a gradually decreasing trend. Further immunostaining analysis revealed that the gradually decreasing SBEs acting on the formation of the four heterogeneous granules were mainly due to the spatial distribution of the three SBEs in the endosperm. It was suggested that the decreased amylopectin in starch might remove steric hindrance and provide extra space for abundant amylose accumulation when the GBSSI amount was not elevated. Furthermore, extra amylose coupled with altered amylopectin structure possibly led to morphological changes in heterogeneous granules.
Starch granules are composed of two glucan polymers: linear amylose and frequently branched amylopectin. Most cereal starches have an amylose content of approximately 15% to 25% (Jobling, 2004). Granule-bound starch synthase I (GBSSI) is reported to contribute to the polymerization of amylose and tends to be buried in the starch granule in order to function (Denyer et al., 2001). Amylopectin is the main component of starch, accounting for 75% to 85%, and is composed of clustered short- to intermediate-length glucan chains. Amylopectin is synthesized by the combined action of several isoforms, including starch synthases (SSs), starch branching synthases (SBEs), and debranching enzymes (DBEs; Nakamura, 2002; Davis et al., 2003; Tetlow, 2006). In addition, starch phosphorylase 1 (Pho1) also has been reported to play a role in starch synthesis, although its precise role remains elusive (Yu et al., 2001; Satoh et al., 2008).
Starches from different botanical sources have different granule morphology and shape. Sometimes, even in a single seed, the starch morphology can be diverse. Rice (Oryza sativa) seeds are mainly occupied by compound starch, consisting of several polygonal granules with a sharp edge in each amyloplast, except that the central region of endosperm is more densely packed than that of the peripheral region. By separating the starch granules located in different regions of the rice endosperm, it has been shown that the granules have not only a similar appearance but also the same molecular structure (Kubo et al., 2008; Cai et al., 2014). However, when diverse ranges of genes are mutated, distinct effects on granule morphology in a seed are detected. For example, once the soluble starch synthase OsSSIIIa/Flo5, which is responsible for the extension of relatively long chains of both amylopectin B2 and B3 to B4 (Gao et al., 1998; Jane et al., 1999; Fujita et al., 2006), is eliminated from the genome, a phenotype of loosely packed central portions exhibiting a floury white-core endosperm is detected. The granules located in this region are smaller than those of the parental control and exhibit round morphology with no sharp edges, while the peripheral region in ssIIIa/flo5 contains normal compound starch (Ryoo et al., 2007). A similar phenotype was identified in previously reported knockouts of BT1, RSR1, and FLO4, which encode an ADP-Glc transporter, APETALA2/ethylene-responsive element-binding protein family transcription factor, and pyruvate orthophosphate dikinase, respectively (Kang et al., 2005; Fu and Xue, 2010; Li et al., 2017). Recently, Zhang et al. (2016) reported that a mutation in a gene of unknown function, FLO7, causes an interestingly converse phenotypic variation with a normally developed core but aberrant periphery. Overall, the spatially distributed phenotypes of morphologically different starch granules in these mutants suggest the essential role of these genes in the starch development of crops. Furthermore, in wild-type varieties, the starch granules located in the different regions in one seed may have different formation and regulation mechanisms, despite these granules displaying uniform appearance and parallel molecular structures from inside to outside of the endosperm (Cai et al., 2014). However, why this occurs still remains unknown.
In high-amylose crops, the spatially distributed phenotype of starch granules in one seed also is recognized. In the maize (Zea mays) amylose extender (ae) mutant, in which the amylose content is increased to approximately 60% from 30% (Li et al., 2008), the granules range from blue in color, through a range of biphasic forms containing both blue- and pink-stained regions, to completely pink in color, from the outer to the inner regions of the endosperm when stained with I2/KI (Liu et al., 2013). High-resolution topographical atomic force microscopy images of the growth rings and Raman microscopy reveal that differently stained granules have different molecular structures (Wellner et al., 2011; Liu et al., 2013). A transgenic resistant starch rice line (TRS) has been developed by the antisense RNA inhibition of both SBEI and SBEIIb of the indica rice ‘Teqinq’ (TQ) in our laboratory. In contrast to TQ, which has approximately 25% amylose content, the amylose content in TRS reaches approximately 60% (Wei et al., 2010; Zhu et al., 2012). In situ observation of whole sections of mature seeds shows that TRS contains four heterogeneous starch granules, including polygonal, aggregate, elongated, and hollow granules, that are regionally distributed in a single seed from inside to outside of the endosperm (Cai et al., 2014). The TRS polygonal granule has polygonal morphology and forms into compound starch, as do normal varieties (Wei et al., 2010; Cai et al., 2014). The aggregate granules consists of some subgranules, similar to compound starch to some extent, but encircled by a thick band, causing these subgranules to pack together during separation. TRS elongated granules are composed of several spherical granules arranged in a line. TRS hollow granules resemble aggregate granules in shape, but there are no granules located in the interior. A series of investigations have indicated that these heterogeneous starch granules contain different structures, thermal properties, and digestive properties (Cai et al., 2014; Man et al., 2014; Huang et al., 2016). The above previous reports are focused on mature seeds and mainly investigate the properties of heterogeneous starch granules and their spatial distribution in endosperm. However, from the points of endosperm development and starch synthesis, how these heterogeneous granules are formed, why they exist exclusively in some regions of the endosperm, and the changes of their molecular structures all remain unknown.
Herein, we analyzed in detail the molecular structures of four TRS heterogeneous starch granules and the relationship of their molecular structures with starch synthesis-related enzymes. The results indicated that the gradually increasing amylose content in four TRS heterogeneous granules was due to decreased amylopectin synthesis and enhanced amylose synthesis but that their GBSSI amounts were not significantly different from those of the control. The granule-associated proteins of four heterogeneous starch granules and immunostaining analysis of developing rice kernels both indicated that the gradually decreasing dosages of SBEI, SBEIIa, and SBEIIb were responsible for the differences in molecular structure and morphological architecture of the granules. The questions of why the amylose content of the four TRS heterogeneous starches from polygonal to hollow granules showed gradually increasing trends when there were similar GBSSI amounts and why three SBEs displayed a regional distribution in a single TRS seed are discussed.
RESULTS
Dynamic Deposition of Four Heterogeneous Starch Granules in Developing Endosperm
Similar to the deposition mode of normal rice starch, the accumulation pattern of starch in TRS endosperm first began in the core and then spread to the outer region of the endosperm (Fig. 1). At 4 d after flowering (DAF), the whole TRS endosperm was observed to be dominated by compound starch granules (Fig. 1, A‒D). With the continual outspread of endosperm cells, morphologically different granules gradually appeared in these newly generated endosperms. At 7 DAF, aggregate and elongated granules were detected in regions II and III of the endosperm, respectively (Fig. 1, G and H). After this stage, the peripheral subaleurone layer (region IV) began to be filled with hollow granules (Fig. 1L). By this phase, four heterogeneous starch granules had formed and were distributed regionally in the four regions, and then the differentially located endosperms in each seed were gradually filled with corresponding granules (Fig. 1, M‒P) until maturity.
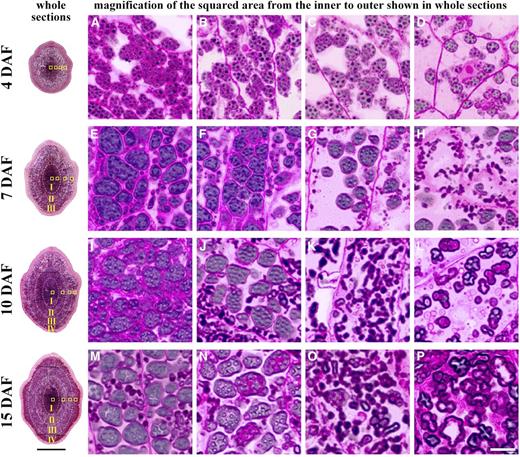
Dynamic deposition of four heterogeneous starch granules in TRS developing kernels in 2016. Whole sections of 2 μm thickness are sectioned transversely at the midregion of developing kernels and stained with safranine and I2/KI. The endosperm after 7 DAF is divided into four regions, I, II, III, and IV, from the inner to the outer part. The four squared areas in the whole sections from the inner to the outer part are successively magnified, showing that the polygonal, aggregate, elongated, and hollow granules are gradually deposited regionally in the endosperm from the inner to the outer part. Bars = 1 mm for the whole sections and 10 μm for the magnified photographs.
Changes in Amylose and Amylopectin Contents in Developing Endosperm
Amylose and amylopectin synthesis was not significantly different between TQ and TRS at 4 DAF (Fig. 2; Supplemental Fig. S1), a stage at which only compound starch granules were detected (Fig. 1, A‒D). Afterward, due to the genesis of heterogeneous starch granules (Fig. 1, G, H, and J‒L), their starch accumulations became different. Amylose synthesis showed a nearly identical increasing trend in the two materials, but its accumulation in TRS was more than that of the control after 4 DAF, and this gap between them became larger along with endosperm development (Fig. 2; Supplemental Fig. S1). Ultimately, the amylose content in TRS seed was approximately 40% higher than that of the control. However, the GBSSI amount and activity were almost the same as those of TQ (Fig. 3, A, B, and D; Supplemental Fig. S2, A and C). On the contrary, amylopectin deposition in TRS was continually lower than that of TQ after 4 DAF, and the deposition modes were significantly different between the two materials. TRS showed a moderate accumulation from 7 to 10 DAF in contrast to the control, which showed a faster rate during this stage. In the following stage, amylopectin synthesis was extremely low in TRS, but a mild amylopectin increase in TQ was detected (Fig. 2). Ultimately, the amylopectin content per seed in TRS decreased by approximately 70%, which was responsible for the markedly reduced starch content and seed weight. Overall, the increased amylose content in TRS flour or starch was attributed to two factors, amylose increases and amylopectin decreases, and the latter contributed more to it.
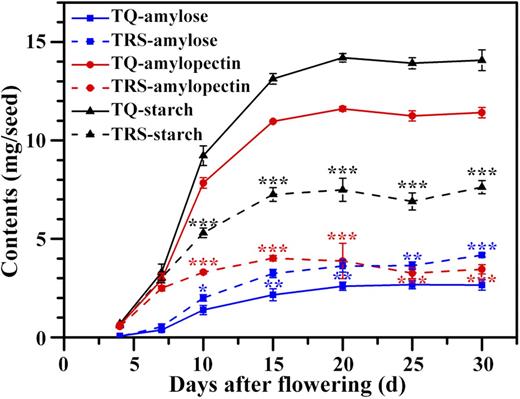
Changes of amylose, amylopectin, and starch contents in developing kernels in 2016. The contents are standardized by one seed. Values are means ± sd from three biological replicates. Asterisks highlight significant differences in amylose, amylopectin, and starch contents between TQ and TRS by Student’s t test (*, P < 0.05; **, P < 0.01; and ***, P < 0.001).
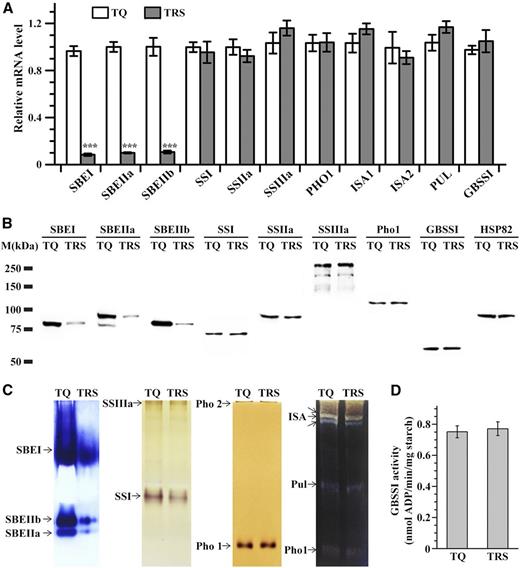
Pleiotrophic effects of SBEI and SBEIIb down-regulation on other starch biosynthesis-related enzymes in developing endosperm at 10 DAF in 2016. A, Reverse transcription-PCR analysis of starch biosynthesis-related enzyme genes. The actin gene is used as a reference for comparative quantitation. Values are means ± sd from three biological replicates each with technical triplicates. Asterisks highlight significant differences in starch synthesis-related enzymes between TQ and TRS by Student’s t test (***, P < 0.001). B, Immunoblotting of starch biosynthesis-related enzymes. Anti-HSP82 antibody is used as a loading control. C, Native PAGE/activity staining of SBEs, SSs, Pho, and DBEs. D, GBSSI activities of starch granules isolated from TQ and TRS endosperm. Values are means ± sd from three biological replicates.
Pleiotropic Effects of SBEI and SBEIIb Down-Regulation on Other Starch Biosynthesis-Related Enzymes
The results from quantitative real-time PCR (Fig. 3A), immunoblotting assays (Fig. 3B; Supplemental Fig. S2A), and native PAGE/activity staining (Fig. 3C; Supplemental Fig. S2B) of starch synthesis-related enzymes indicated that the antisense inhibition of SBEI and SBEIIb in TRS not only resulted in the largely decreased expression of SBEI and SBEIIb themselves but also caused the significantly reduced expression of SBEIIa. This might be due to the sequence similarity between SBEIIa and SBEIIb, allowing the antisense inhibition designed for SBEIIb to also play a role in SBEIIa repression. Therefore, in TRS, a series of changes including amylose increases and the occurrence of heterogeneous starch granules was the result of three SBE isoform deficiencies instead of deficiencies in only SBEI and SBEIIb. It has been reported that SBE isoforms are responsible for the branching of amylopectin, and their reduction may be expected to reduce the overall rate of amylopectin synthesis (Fig. 2; Supplemental Fig. S1) through a decrease in the number of available nonreducing termini of glucan chains available for SSs (Liu et al., 2012a). Further dynamic expression analysis of the three SBEs indicated that the SBEs were inhibited gradually along with endosperm development in TRS, while in TQ, it showed an increased protein level until 10 DAF but then a decreasing trend (Fig. 4A; Supplemental Fig. S3A). This suggested that there might be regular SBE amounts acting on the formation of TRS heterogeneous granules based on the spatial and temporal development characteristics of the granules (Fig. 1).
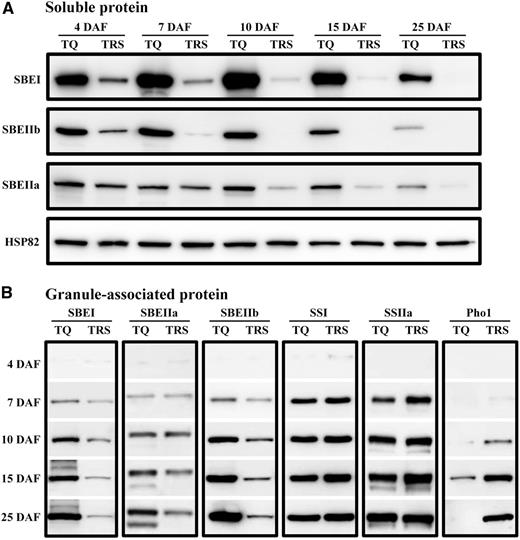
Dynamic expression and deposition of amylopectin synthesis-related enzymes in soluble fraction (A) and granule-associated fraction (B) of developing kernels in 2016. The amount of soluble protein is standardized by HSP82, and granule-bound fraction is standardized by one seed.
SSI activity in TRS was approximately 50% lower than that in TQ (Fig. 3C; Supplemental Fig. S2B), although SSI mRNA levels and protein amounts were not significantly different between TQ and TRS (Fig. 3, A and B; Supplemental Fig. S2A). A reduction in SSI activity was demonstrated previously in sbe2b-related mutants, including the sbe2b single mutant (Nishi et al., 2001), and ss1L/be2b and ss3a/be2b double mutants (Abe et al., 2014; Asai et al., 2014). For other starch biosynthesis-related enzymes, including SSIIa, SSIIIa, isoamylase1 (ISA1), ISA2, pullulanase, and Pho1, their mRNA levels, soluble protein amounts, and activity were not significantly different between these two materials (Fig. 3; Supplemental Fig. S2, A and B).
Molecular Structures of Four Heterogeneous Starch Granules in TRS
The total amylose increase and amylopectin decrease in TRS starch or flour were the averaged results derived from the four heterogeneous starch granules. Through isolation and purification of heterogeneous starch granules from TRS kernels at 25 DAF, gel-permeation chromatography (GPC) profiles of isoamylase-debranched starches indicated that these starches had different M r distributions (Fig. 5, A‒F; Table I). The innermost-situated polygonal granule contained the lowest amylose proportion (30.3%–30.7%). Aggregate and elongated starch granules located in the middle region of the TRS endosperm accounted for 41% to 42.7% and 67% to 67.2% of the amylose content, respectively. The outermost-enriched hollow granule had the highest amylose percentage (77.4%–78.6%; Table I). The GPC profiles of isoamylase-debranched amylopectins indicated that amylopectin extra-long chains in the polygonal, aggregate, elongated, and hollow TRS heterogeneous starch granules accounted for 4.2%, 2.7%, 4.6%, and 2.5%, respectively, which were not more than that of the control, 7.2% (Fig. 5, A‒F; Table I). The true amylose contents in TRS polygonal, aggregate, elongated, and hollow starch were 26.1% to 26.5%, 38.3% to 40%, 62.4% to 64.5%, and 74.9% to 76.7%, respectively (Table I). The above results indicated that the enriched amylose content in TRS heterogeneous starches was true amylose instead of amylopectin extra-long chains. However, their GBSSI amounts were not significantly different from those of the wild type (Fig. 6).
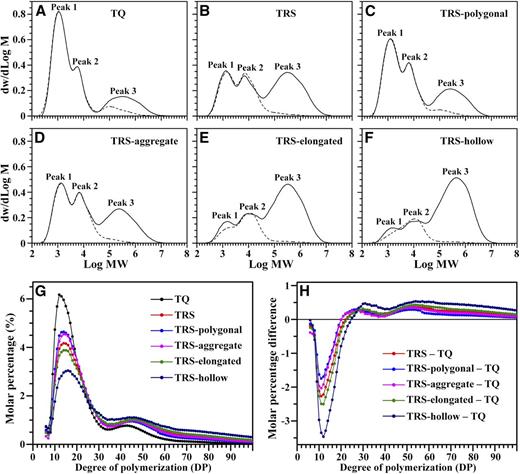
Starch components and amylopectin molecular structure of TQ and TRS developing kernels at 25 DAF in 2016. A to F, GPC profiles of isoamylase-debranched starch (solid lines) and purified amylopectin (dotted lines). Peak 1 and peak 2 consist of short and long branch chains of amylopectin, respectively. Peak 3 is a mixture of amylose and amylopectin extra-long chains. MW, Molecular weight. G, Chain-length distribution of amylopectin by FACE. H, Differences in amylopectin chain lengths between TQ and TRS starches.
Carbohydrate composition of starch and purified amylopectin from developing TQ and TRS kernels at 25 DAF in 2015 and 2016
Values are means ± sd from two biological replicates. Values in the same column with different lowercase letters for starch and uppercase letters for amylopectin are significantly different (P < 0.05) as determined by one-way ANOVA and Tukey’s test. Peak 1, Peak 2, and Peak 3 are the amylopectin short branch chain, amylopectin long branch chain, and amylose, respectively. Peak 1/Peak 2 is the area ratio of Peak 1 and Peak 2; other values are percentages. Asterisks represent the amount of extra long chain of amylopectin. TAC (true amylose content) = amylose content (Peak 3 of starch) ‒ extra long chains (Peak 3 of amylopectin).
| Kernals | Product | 2016 | 2015 | |||||
|---|---|---|---|---|---|---|---|---|
| Peak 1 | Peak 2 | Peak 3 | TAC | Peak 1/Peak 2 | Peak 3 | TAC | ||
| TQ | Starch | 57.3 ± 1.4 f | 19.0 ± 0.1 b | 23.7 ± 1.3 a | 16.5 ± 1.8 a | 3.01 ± 0.09 d | 25.5 ± 0.1 a | 18.2 ± 0.1 a |
| Amylopectin | 57.6 ± 1.7 F | 18.7 ± 0.4 B | 7.2 ± 0.6 D* | – | 3.07 ± 0.16 D | 7.3 ± 0.1 E* | – | |
| TRS | Starch | 24.8 ± 0.5 c | 23.8 ± 0.7 c,d | 51.4 ± 1.2 d | 48.5 ± 1.0 d | 1.04 ± 0.01 b | 58.9 ± 0.8 d | 56.6 ± 0.8 d |
| Amylopectin | 24.0 ± 0.1 C | 24.6 ± 1.3 D | 2.9 ± 0.2A D* | – | 0.98 ± 0.06 B | 2.3 ± 0.1 B* | – | |
| TRS-polygonal | Starch | 44.7 ± 1.0 e | 24.9 ± 1.7 d | 30.3 ± 0.7 b | 26.1 ± 0.8 b | 1.80 ± 0.16 c | 30.7 ± 0.2 b | 26.5 ± 0.2 b |
| Amylopectin | 43.9 ± 0.5 E | 25.8 ± 0.3 D | 4.2 ± 0.1 B,C* | – | 1.70 ± 0.01 C | 4.2 ± 0.1 D* | – | |
| TRS-aggregate | Starch | 29.5 ± 1.8 d | 29.5 ± 0.7 e | 41.0 ± 2.5 c | 38.3 ± 2.6 c | 1.00 ± 0.03 b | 42.7 ± 0.1 c | 40.0 ± 0.2 c |
| Amylopectin | 31.6 ± 1.3 D | 27.3 ± 1.2 D | 2.7 ± 0.1 A* | – | 1.16 ± 0.01 B | 2.6 ± 0.1 C* | – | |
| TRS-elongated | Starch | 11.4 ± 0.1 b | 21.6 ± 1.1 b,c | 67.0 ± 1.0 e | 62.4 ± 1.7 e | 0.53 ± 0.03 a | 67.2 ± 1.2 e | 64.5 ± 1.3 e |
| Amylopectin | 11.6 ± 0.2B | 21.4 ± 0.7 C | 4.6 ± 0.8 C* | – | 0.54 ± 0.01 A | 2.7 ± 0.1 C* | – | |
| TRS-hollow | Starch | 7.5 ± 1.1 a | 15.1 ± 0.3 a | 77.4 ± 0.8 f | 74.9 ± 1.1 f | 0.50 ± 0.08 a | 78.6 ± 0.9 f | 76.7 ± 1.0 f |
| Amylopectin | 6.7 ± 0.6 A | 15.9 ± 0.3 A | 2.5 ± 0.3 A* | – | 0.42 ± 0.03 A | 1.9 ± 0.1 A* | – | |
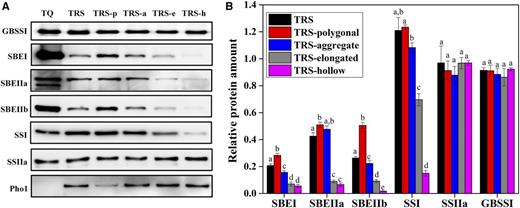
Distribution (A) and relative protein amount (B) of granule-bound proteins in starch granules from TQ and TRS developing kernels at 25 DAF in 2016. A, The protein amount is standardized by milligrams of starch. TRS-p, TRS-a, TRS-e, and TRS-h represent the polygonal, aggregate, elongated, and hollow starch granules from TRS, respectively. B, The relative protein amount is the proportion of protein in TRS to that in TQ. Values are means ± sd from three biological replicates. Values for the same protein indicated by different lowercase letters are significantly different (P < 0.05) as determined by one-way ANOVA and Tukey’s test.
The fine structure of amylopectin measured using fluorophore-assisted capillary electrophoresis (FACE) indicated that the chain length of amylopectin in TRS heterogeneous starches also presented a regular distribution (Fig. 5, G and H; Table II). From polygonal to hollow starch granules, the results showed a moderately gradual reduction in the short-chain proportion of degree of polymerization (DP) 6-12 and DP 13-24 and a significantly gradual increase in the proportion of DP ≥ 37. The proportion of DP 25-36 in the four starch granules was almost maintained at the same state but displayed a slightly elevated trend in contrast to that of the TQ counterpart. The averaged chain length of the four heterogeneous granules was longer than that of the control.
Chain length distribution of amylopectin from developing TQ and TRS kernels at 25 DAF in 2016
Values are means ± sd from two biological replicates. Chain length values are given in DP; other values are percentages. Values in the same column with different lowercase letters are significantly different (P < 0.05) as determined by one-way ANOVA and Tukey’s test.
| Kernals | DP 6-12 | DP 13-24 | DP 25-36 | DP ≥ 37 | Average Chain Length |
|---|---|---|---|---|---|
| TQ | 22.0 ± 0.8 d | 50.4 ± 0.3 e | 11.3 ± 0.4 a | 16.4 ± 0.1 a | 22.8 ± 0.1 a |
| TRS | 13.1 ± 0.3 b,c | 41.3 ± 0.5 c | 14.1 ± 0.1 b | 31.6 ± 0.3 d | 31.2 ± 0.2 d |
| TRS-polygonal | 15.2 ± 0.1 c | 45.0 ± 0.1 d | 14.0 ± 0.1 b | 25.8 ± 0.1 b | 28.1 ± 0.1 b |
| TRS-aggregate | 13.2 ± 0.2 b,c | 44.4 ± 0.2 d | 13.5 ± 0.1 b | 28.8 ± 0.2 c | 29.8 ± 0.2 c |
| TRS-elongated | 12.2 ± 1.3 b | 39.2 ± 0.6 b | 14.3 ± 0.5 b | 34.3 ± 1.3 e | 32.9 ± 0.7 e |
| TRS-hollow | 9.6 ± 0.2 a | 32.3 ± 0.6 a | 15.4 ± 0.1 c | 42.7 ± 0.8 f | 37.6 ± 0.4 f |
Taken together, the structural analysis indicated that, in TRS endosperm, from the inside to the outside, the four morphologically different starch granules contained gradually enriched amylose and decreased amylopectin contents. At the same time, their amylopectin structures changed greatly, with increasing amounts of long chains but decreasing amounts of short chains. In contrast to TQ, the molecular structures of the four heterogeneous starch granules in TRS changed greatly, except the polygonal ones, which were not significantly different from that of TQ.
Dynamic Deposition of Amylopectin Biosynthetic Enzymes in the Granules
The regular alterations of molecular structures in four TRS heterogeneous starch granules were reminiscent of the effects of different SBEIIb dosages on molecular structures. Butardo et al. (2011) reported that amylose content and amylopectin long chains (DP ≥ 36) were promoted more markedly but amylopectin short chains decreased more significantly in transgenic lines with more pronounced decrease of SBEIIb. Tanaka et al. (2004) further detected that SBEIIb dosage was positively related to amylopectin short chains and negatively related to amylopectin long chains. Therefore, the question about whether the different molecular structures in TRS heterogeneous starch granules originated from the different dosages of the three SBE isoforms was raised. In addition, the fact that SBEs were inhibited gradually along with endosperm development in TRS supported this idea again (Fig. 4A; Supplemental Fig. S3A).
A series of biochemical evidence has shown that SBEs are prone to forming a great variety of multisubunit complexes with SSs, DBEs, and Pho1 in the soluble fraction of amyloplasts in order to function (Hennen-Bierwagen et al., 2008, 2009; Crofts et al., 2015). This fact, coupled with the complexity of starch development, makes it difficult to quantity SBEs that act directly on starch formation in TRS heterogeneous granules. Therefore, we skipped the possible interactions between starch biosynthetic enzymes in the stromal fraction, because no matter how the interactions changed among those enzyme proteins in the soluble fractions, those proteins were stably buried in the granule during starch development (Fig. 4B; Supplemental Fig. S3B). Regarding the dynamic deposition mode of starch during the development process in the control, the fast seed-filling stage occurred from 4 to 10 DAF, moderate accumulation occurred from 10 to 15 DAF, and then a relatively low accumulation occurred until maturity along with the dehydration process (Fig. 2). The three SBEs bound with the granule also behaved consistently in TQ: a fast rate occurred from 4 to 10 DAF, a mild rate occurred from 10 to 15 DAF, and then a relatively low rate occurred until maturity (Fig. 4B). In TRS, the three SBEs still exhibited an accumulating trend in the granule-bound fraction before 10 DAF, although their abundance decreased continuously in the soluble fraction (Fig. 4A). Following this stage, the SBEs seemed to be maintained at a stable level in the granule due to the markedly repressive effect in the soluble part (Fig. 4; Supplemental Fig. S3).
A similar deposition mode also was detected for SSI and SSIIa in these two materials, whereas Pho1 only displayed an accumulating trend in TRS. Regardless of whether these soluble enzyme proteins were fixed completely in the granule, these proteins had a dynamic deposition or maintained a sustainable level in the granules throughout starch development. This finding suggests that granule-bound enzymes are a valuable indicator of enzymes acting on the formation of starch granules. Importantly, the dynamic accumulation of these enzymes in the granule made it possible to quantify the six enzymes acting on starch synthesis in the four heterogeneous starches, as these heterogeneous granules were capable of being well separated and were used for the dosage analysis of starch biosynthetic enzymes.
Allocations of Granule-Bound Enzymes among Four Heterogeneous Starch Granules
How the six amylopectin biosynthetic enzymes were distributed into the four heterogeneous granules was examined (Fig. 6). The abundance of three SBE isoforms in the four heterogeneous starches was obviously less than that of TQ, and they showed a gradually decreasing trend from polygonal to hollow starch granules. In addition, the distribution of SSI in the four types of granules also showed a similar tendency, which was consistent with their gradually decreasing ratio of amylopectin short chains (Fig. 5, G and H; Table II). SSIIa maintained almost the same level in the four heterogeneous granules. In contrast to the other three granules, which revealed a thick band of Pho1, only a faint band existed in the innermost polygonal starch (Fig. 6A).
Regional Distribution of Three SBE Isoforms in Developing Endosperm
To further demonstrate the different dosages of three SBE isoforms on four TRS heterogeneous starches, an immunofluorescence analysis was conducted on the developing endosperm at 10 DAF, the stage at which the four heterogeneous starch granules had formed (Fig. 1). The results revealed that SBEI, SBEIIa, and SBEIIb were broadly associated with all granules in TQ (Fig. 7, A, C, and E). At the outermost region of the endosperm, the residual stroma with bright SBE signals in the amyloplast was discovered (Fig. 7, A4, C4, and E4). This was due to the fact that the amyloplasts located in this region developed more slowly and were less densely packed than those of the inner regions, resulting in the fact that they were not completely filled with starch granules. However, in TRS, it seemed that the fluorescence signals of SBEI, SBEIIa, and SBEIIb were distributed mainly in the grain center, the region in which polygonal granules locate (Fig. 7, B1, D1, and F1), and the outline of granule morphology could be easily drawn by the fluorescence signals, as it could in the control. However, weak and diffuse signals were barely detected in the other three regions when these regions were magnified (Fig. 7, B2‒B4, D2‒D4, and F2‒F4), and these dots became less and less frequent when they were closer and closer to the peripheral region of the endosperm. Overall, these fluorescence signals of the three SBEs exhibited a spatial distribution throughout the whole TRS endosperm and a gradual reduction from the inside to the outside of the endosperm, which indicated that the gradually decreasing SBE dosages acting on the formation of heterogeneous starches were due mainly to the regional distribution of SBEI, SBEIIa, and SBEIIb in the rice endosperm.
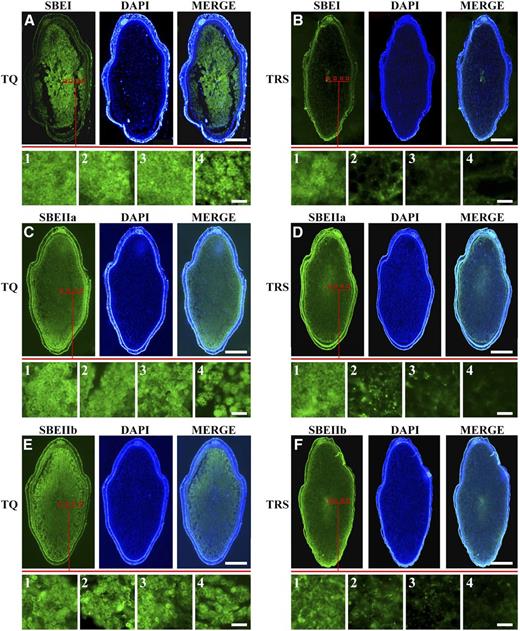
Immunostaining analysis of three SBEs in developing kernels at 10 DAF in 2016. SBEI, SBEIIa, and SBEIIb are broadly associated with all the granules in TQ (A, C, and E), while their fluorescence signals display a gradually decreased trend in endosperm from the inner to the outer part in TRS (B, D, and F). Bars = 1 mm for A to F and 10 μm for A1 to F4.
DISCUSSION
Expanded Physical Space Resulting from Reduced Amylopectin Synthesis May Be a Key Factor for the Large Enrichment of Amylose
An amylose increase can be achieved by enhancing the expression levels of GBSSI. For example, the elevated level of GBSSI caused by the introduction of Waxya into a japonica waxy mutant leads to amylose increase (approximately 25%), in contrast with that of the japonica cv Waxyb (approximately 20%; Itoh et al., 2003). However, when further overexpressing GBSSI in normal cereal crops that usually contain approximately 25% to 30% amylose content, no or little amylose promotion is detected (Flipse et al., 1996; Itoh et al., 2003; Sestili et al., 2012), which means that the Waxy dosage effect is restricted within a range and that GBSSI is not always the key factor to promote amylose content. Flipse et al. (1996) suggested that, except for GBSSI, the amylose content of starch potentially correlates with the availability of ADP-Glc and the limited physical space available within the matrix of amylopectin. However, even though the BRITTLE1 (Bt1) gene was overexpressed in an up-regulated AGPase background, generating a rice line with enhanced ADP-Glc synthesis and import into amyloplasts, only a limited carbon flow into starch was observed (Cakir et al., 2016). Therefore, substrate amount is not the rate-limiting step for increasing amylose. Starch is synthesized as discrete semicrystalline granules having a layered organization with alternating semicrystalline and amorphous growth rings (Gallant et al., 1997). The semicrystalline ring consists of the lamellar structure of alternating crystalline and amorphous regions. Amylopectin branch chains form double helices and are packed laterally to form crystalline lamellae. The large portion of amylose resides in amorphous growth rings, and some amylose molecules also accumulate in crystalline and amorphous lamellae (Blazek and Gilbert, 2011). During starch granule formation, the amylopectin is synthesized first and forms the architecture of the granule, then GBSSI is bound into the granule and synthesizes the amylose molecules. When amylopectin synthesis is reduced, the steric hindrance for amylose accumulation in crystalline and amorphous lamellae is partly vanquished, indicating that the expanded physical space due to the reduced amylopectin content might be a key factor for amylose increase.
In TRS, amylose content per grain increased by 40% (Fig. 2; Supplemental Fig. S1), although GBSSI amounts and activity were not significantly different between TQ and TRS (Fig. 3, A, B, and D; Supplemental Fig. S2, A and C). Cakir et al. (2016) reported that, when enriched ADP-Glc supply was provided, starch content could be elevated somewhat (about 10%) in the condition that the activity of starch synthase was kept unchanged. This indicated that starch content could be elevated even though the amounts and activity of starch synthase including GBSSI were not increased and only a limited amount of starch increase was detected. Therefore, such an abundant amylose increase in TRS is attributed mainly to amylopectin decrease. Amylopectin synthesis per grain in TRS decreased by 70%, resulting in abundant soluble substrate (Supplemental Fig. S4) and enlarged physical space. From polygonal to hollow starch granules, three SBEs showed a gradually decreasing trend, indicating that their amylopectin synthesis was decreased gradually. This meant that more and more space was released for amylose synthesis and accumulation in lamellae from TRS polygonal to hollow starch granules, even though GBSSI contents were not increased (Fig. 6). In barley (Hordeum vulgare), when three SBEs were reduced simultaneously by more than 70% compared with the control, amylopectin synthesis was completely inhibited and pure amylose was derived (Carciofi et al., 2012).
The SSIIIa mutation seems to demonstrate the above-mentioned opinion again. The SSIIIa mutation in the japonica background (ssIIIa/Waxyb) causes an increase of GBSSI and inhibits amylopectin synthesis, resulting in a 1.3-fold increase in amylose (Fujita et al., 2007). When this mutation is created in the indica background (ss3a/Waxya), a higher increase in GBSSI and amylose in contrast to that of japonica is detected as expected, but the GBSSI content is not significantly different from the GBSSI content in indica itself (SS3a/Waxya; Crofts et al., 2012; Zhou et al., 2016). This is possibly due to the fact that the reduced amylopectin in ss3a/Waxya provides more space for amylose synthesis.
The Gradual Reduction of Three SBEs Is Responsible for Granule Morphology
Starch consists of approximately 75% to 85% amylopectin and 15% to 25% amylose (Gallant et al., 1997). It has been proposed that the structure and arrangement of amylopectin molecules are crucial for the shape and morphology based on the blocklet model of starch granule architecture. For example, wheat (Triticum aestivum), Triticale (X Triticosecale Whittmack), and barley contain large, disk-shaped A-granules and small, spherical B-granules. Ao and Jane (2007) suggested that more long chains but fewer short chains of amylopectin in A-granules are more parallel aligned in the disk shape, while more short chains but fewer long chains in B-granules are available in the cone shape. It seems that amylose has no effect on starch morphology. For example, waxy, japonica, and indica rice exhibit compound starch granules, although their amylose contents are different from each other. However, this does not mean that amylose content has no effect on the phenotype of starch granules when amylose occupies the major proportion instead of amylopectin. It has been found that the elongated granules in high-amylose maize, ae, originate from two adjacent simple starch granules by amylose interaction, forming antiparallel double helices between them (Jiang et al., 2010). The high accumulation of amylose in crystalline lamellae disorders the packing of lamellar structure and destroys the granule layered organization (Blazek and Gilbert, 2011). The very high amylose in wheat and barley starches alters starch morphology from disk-shaped to sickle-shaped granules with a significant loss of birefringence (Regina et al., 2006, 2010; Carciofi et al., 2012; Slade et al., 2012).
In TRS, the ratio of amylose and amylopectin content and the fine structure of amylopectin undergo great changes. Therefore, the morphology of heterogeneous granules must be the result of these combined factors. TRS polygonal granules could be maintained completely in a compound morphology due to the similarity of contents and molecular structures of amylose and amylopectin to those of the control (Fig. 5; Tables I and II), although three SBEs exhibited 28%, 51%, and 51% levels relative to that of TQ (Fig. 6B). These amounts of three SBEs that existed in the TRS polygonal starches were considered transition points: when the values were greater than these, the starch morphology could be maintained in a state similar to that of wild type, but when the values were less, amylopectin content and molecular structure could change substantially; accordingly, amylose accumulated in crystalline lamellae, leading to the morphological heterogeneity becoming more discrepant from that of the wild type. For example, in TRS hollow starch, the SBEs were seriously inhibited (Fig. 6), leading to the amylopectin content decreasing from 76.3% to 22.6%, amylopectin branch-chain length increasing from DP 22.8 to DP 37.6, and the ratio of short to long branch chains of amylopectin decreasing from 3.1 to 0.4 compared with TQ polygonal starch. Accordingly, the decreased amylopectin increased the true amylose content from about 17% to 75% (Tables I and II). The above molecular structure changes of amylopectin and the accumulation of amylose destroyed the granule structure with no birefringence and lamellae (Man et al., 2014) and changed the morphology from compound starch with polygonal subgranules to hollow starch without inner subgranules. Furthermore, we analyzed the relationship between the amount of SBEI, SBEIIa, and SBEIIb in starch granules and the content and molecular structure of amylose and amylopectin (Table III). The amount of SBEs in granules, especially SBEIIa and SBEIIb, was correlated significantly and positively with amylopectin content and its branching degree, extra long chain and short branch chain, and was correlated negatively with amylopectin branch chain length and amylose content.
Correlation coefficients between molecular composition and SBE protein amount in TQ and TRS total and heterogeneous starches
AP, Amylopectin; SBC, short branch chain; LBC, long branch chain; ABCL, average branch chain length; ELC, extra long chain; AC, amylose content; TAC, true amylose content (AC ‒ ELC). *, Significant at P < 0.05; **, significant at P < 0.01.
| Protein | AP Content | AP-SBC | AP-LBC | AP-SBC/LBC | AP-ABCL | AP-ELC | AC | TAC |
|---|---|---|---|---|---|---|---|---|
| SBEI | 0.741 | 0.856* | ‒0.181 | 0.959** | ‒0.865* | 0.965** | ‒0.741 | ‒0.775 |
| SBEIIa | 0.918** | 0.956** | 0.178 | 0.955** | ‒0.951** | 0.883* | ‒0.918** | ‒0.930** |
| SBEIIb | 0.867* | 0.952** | ‒0.023 | 0.997** | ‒0.937** | 0.973** | ‒0.867* | ‒0.893* |
Taken together, this study indicated that the gradual reduction of SBEs, from TRS polygonal to hollow granules, accordingly decreased amylopectin synthesis and changed its molecular structure, leading to the change of lamellar structure and greater accumulation of amylose in lamellae. The different changes in content and molecular structure of amylose and amylopectin in starch granules resulted in four heterogeneous granules.
Why Do Regional Distributions of Three SBEs Exist in a Single Seed in TRS?
An interesting question raised by this research was why regional distributions of three SBEs existed in a single seed. At first thought, the glutelin GT1 (GluA-2) promoter utilized in TRS transgenic plants might be responsible for the regional distribution of the three SBEs, as the activity of this promoter is stronger in the outer portion but much weaker in the inner part of the endosperm (Qu et al., 2008). This resulted in the three SBE isoforms being more severely inhibited in the outer portion of the endosperm but less inhibited in the inner region. In addition, the mRNA of the GluA-2 gene started to accumulate during the early stages of endosperm development, peaking at approximately 10 DAF (Crofts et al., 2005; Kawakatsu et al., 2008), indicating that the GT1 promoter functions during the early stages of endosperm development but subsequently shows an increasing trend. In the TRS endosperm development process, the inhibition effect of the three SBEs was gradually enhanced (Fig. 4A). It seemed that the inhibition effect in TRS was consistent with the function of the GT1 promoter. However, the spatial heterogeneity that existed in the rice ae mutant partly ruled out this possibility (Supplemental Fig. S5). Based on whole sections of mature ae seeds, we found that three types of starch granules were detected from inside to outside of the endosperm in a single seed, ranging from the innermost compound starch granule consisting of several polygonal granules (Supplemental Fig. S5G), to the small granules composed of only two or three subgranules (Supplemental Fig. S5, A‒C), to aggregate granules similar to compound granules but encircled by a thick pink band (Supplemental Fig. S5, D‒F). A significant regional distribution of heterogeneous starch granules also is reported in the maize ae mutant (Liu et al., 2013). This indicated that different dosage requirements of SBEIIb for granule formation in different regions in a single rice seed indeed exist and also might exist for SBEI and SBEIIa.
Granule-Bound Amylopectin Biosynthetic Enzymes Are an Important Indicator of Enzyme Acting on Amylopectin Molecular Structure
Increasing amounts of evidence have demonstrated that different compositions of amylopectin biosynthetic enzymes exhibit significant effects on the molecular structure and morphological architecture of starch granules. These enzyme proteins are prone to forming varieties of complexes in the soluble amyloplast fraction instead of operating individually. This phenomenon is especially true for the SSs and SBEs, which then purportedly attach to the surface of the starch granule to play a role in amylopectin synthesis (Grimaud et al., 2008; Hennen-Bierwagen et al., 2008; Liu et al., 2009). When the complex fails to become the granule-bound component or the composition of the complex changes, the molecular structure and starch morphology change concurrently. An allelic variant of the sugray-2 (su2) mutation, expressing a catalytically inactive form of SSIIa in maize, enables the trimeric assembly of SSI, SSIIa, and SBEIIb in the stroma of amyloplasts as in the wild type but causes the inability of the complex to become a granule-bound component. Altered molecular structure and granule morphology are observed in su2 starch granules, providing a clue to the role of granule-bound amylopectin biosynthetic enzymes in the structural organization of starch granules (Liu et al., 2012a). Two maize ae mutations lead to the absence of SBEIIb in ae− (ae1.1) and a catalytically inactive form of SBEIIb in ae1.2. The different mutation patterns cause different granule-bound protein compositions, even though the primary cause of the mutation, the loss of SBEIIb activity, is the same (Liu et al., 2009, 2012b). A novel protein complex formed in the stroma that includes SBEI, SBEIIa, Pho1, SSI, and SSIIa effectively becomes localized to starch granules in ae− (Liu et al., 2009). In ae1.2, the internal granule-bound components consist of SSI, SSIIa, SBEI, SBEIIa, and null SBEIIb. The starch of ae1.2 has much lower apparent amylose and fewer intermediate-length glucan chains (DP 16-20) than does that of ae− and has altered granule morphology that is distinctly different from that of both the ae− mutant and the wild type (Liu et al., 2012b). Only seven amylopectin biosynthetic enzymes, SSI, SSIIa, SSIIIa, SBEI, SBEIIa, SBEIIb, and Pho1, are capable of binding to the starch granule in the wild type and various mutants, although there are more than seven enzyme proteins responsible for amylopectin formation (Grimaud et al., 2008).
The above-mentioned studies show that the granule-bound amylopectin biosynthetic enzymes can be used as an important indicator of enzyme action on the formation of amylopectin molecular structure (Grimaud et al., 2008; Liu et al., 2009, 2012a, 2012b). In this study, we investigated the allocations of granule-bound amylopectin biosynthetic enzymes among four TRS heterogeneous granules to disclose their amylopectin difference (Fig. 6). From polygonal to aggregate, elongated, and hollow granules, the amount of SBEI, SBEIIa, and SBE IIb decreased gradually, in agreement with the branching degree of amylopectin decreasing and branch-chain length increasing gradually (Nishi et al., 2001; Butardo et al., 2011; Tables I and II). The different amounts of SBEI, SBEIIa, and SBEIIb distributed in the four heterogeneous starch granules caused different binding amounts of SSI. It has been reported that SSI plays a critical role in generating chains of DP 8-12 from chains of DP 6-7 that emerge from the branch points of amylopectin, carried out by SBE (Fujita et al., 2006). This finding greatly helped to elucidate the gradually decreasing ratio of DP 6-12 in the four TRS heterogeneous starch granules (Fig. 5, G and H; Table II). However, for SSIIa, no difference was detected, although it has been suggested that SSIIa preferentially elongates DP 6-11 to DP 13-28 (Nakamura et al., 2005). This may be because SSIIa traffics other enzymes into the granule, leading this enzyme to be unbiasedly bound to the granule (Liu et al., 2012a). However, we failed to detect SSIIIa in the granule-bound fraction in both TQ and TRS (data not shown). For Pho1, it has been reported that it produces short-chained MOS, and the resulting malto-oligosaccharides (MOS) is able to prime amylose synthesis (Kitamura et al., 1982; Satoh et al., 2008). Pho1 exhibited a granule-bound fraction in TRS (Fig. 6), whereas it was absent in the control. We reasonably inferred that the granule-bound Pho1 in TRS might facilitate MOS synthesis, making it more convenient and efficient for the granule-bound GBSSI to synthesize amylose. However, the Pho1 amounts in aggregate, elongated, and hollow starches were not significantly different from each other. This still might be due to the expanded physical space, not the Pho1, responsible for the different amylose accumulation in four TRS heterogeneous starch granules.
CONCLUSION
This study revealed that TRS heterogeneous starch granules contained gradually enriched amylose and decreased amylopectin. This result was due mainly to the gradually decreasing SBEI, SBEIIa, and SBEIIb, which might release more space for amylose synthesis by reducing amylopectin synthesis and/or the branching degree. Along with the altered amounts of three SBEs acting on the formation of four heterogeneous granules, other proteins also effected changes, including SSI and Pho1. In addition, there was not always a linear relationship between SBE dosage and granule morphology. Only when three SBEs decreased to a transition level did the granule morphology change substantially, and the more decreases that occurred, the more alterations there were. There are two possible reasons for the spatial distribution of the three SBEs in rice endosperm: (1) the endosperm-specific promoter GT1 used in TRS transgenic plants plays a weak role in the inner region but a strong role in the outer region of the rice endosperm; and (2) different dosage requirements of SBEI, SBEIIa, and SBEIIb for starch development exist in different regions of the rice endosperm.
MATERIALS AND METHODS
Plant Materials
The indica rice (Oryza sativa) TQ and its transgenic resistant starch rice line (TRS) were used in this study. TRS was generated by the antisense RNA inhibition of both SBEI and SBEIIb in the background of TQ (Zhu et al., 2012). The ae mutant rice was obtained from the japonica rice Zhonghua 11. They were cultivated in a closed transgenic experiment field at Yangzhou University. Kernels were harvested at different DAF, and developing endosperms were carefully dissected from kernels and stored at ‒70°C. All the results shown in this article were from two or three biological replicates in the same year, and most experiments were repeated in two years, 2015 and 2016.
Kernel Sections for Light Microscopy
The developing kernels were permeated and embedded in LR White resin after being fixed and dehydrated and then sectioned transversely at the midregion of the kernel using an ultrathin microtome (EM UC7) following the method of Zhao et al. (2016). The semithin sections were stained with safranine and I2/KI and observed subsequently using a light microscope.
Amylose, Amylopectin, and Soluble Sugar Contents in Developing Kernels
The contents of amylose and amylopectin in developing kernels were determined using the Megazyme Amylose/Amylopectin Assay Kit. The analysis was performed according to the manufacturer’s instructions. The soluble sugar was extracted from developing kernels with 80% (v/v) ethanol and determined using the colorimetric method of anthrone-H2SO4.
Starch Isolation and the Purification of TRS Heterogeneous Starch Granules
The isolation of TQ and TRS total starch and the purification of TRS heterogeneous starch granules from developing kernels at 25 DAF were performed as described in detail by Man et al. (2014).
Starch Components and Molecular Structure
Amylopectin was isolated and purified from starch granules using n-butanol as described by Li et al. (2008). Starch and amylopectin were debranched using isoamylase, and their M r distributions were analyzed using a PL-GPC 220 chromatograph with three columns (PL110-6100, PL110-6300, and PL110-6526) and a differential refractive index detector following the methods of Man et al. (2014). The chain length distribution of amylopectin was determined using FACE following the methods of Lin et al. (2016).
RNA Isolation and Real-Time Reverse Transcription-PCR
Endosperm RNA was extracted using the RNAprep pure Plant Kit (Tiangen). One microgram of total RNA was reverse transcribed. The primers and detailed procedures used in the analysis were derived from the methods of Ohdan et al. (2005).
Native PAGE/Activity Staining
Endosperm samples from eight kernels harvested at 10 DAF were homogenized on ice in corresponding extraction buffer consisting of 50 mm HEPES NaOH (pH 7.4), 2 mm MgCl2, and 12.5% (v/v) glycerol. The homogenate was centrifuged to obtain the supernatant for further enzyme activity assays. The enzyme assays and activity staining were performed as described previously (Nishi et al., 2001). The experiments were conducted in two successive years, and two biological replicates were performed in each year.
Determination of GBSSI Activity
The GBSSI activity in developing endosperm was determined following the method of Zhang et al. (2010). For the GBSSI activity in isolated starch, starch was prepared essentially according to Hunt et al. (2010), and the GBSSI activity was determined as described by Fujita et al. (2001). The GBSSI activity was evaluated by the amount of liberated ADP per min per mg of fresh endosperm or starch.
Preparation of Protein Extracts
The soluble and granule-bound protein extractions from developing endosperms were performed using a modified version of the methods described by Butardo et al. (2011). The soluble fraction was obtained by suspending endosperms from 10 kernels at 4, 7, 10, 15, and 25 DAF in 500 μL of buffer (pH 7.4, 50 mm Tris-HCl, 0.25 m Suc, 2 mm EDTA, 2 mm DTT, and 1 mm phenylmethylsulfonyl fluoride). After centrifugation, the supernatant was collected. The resulting pellet was washed with extraction buffer six times to completely remove the residual soluble protein and then dispersed in the gelatinized buffer, which consisted of 50 mm Tris-HCl and 10% SDS. This gelatinized mixture was heated under constant stirring in a boiling water bath in order to release the granule-bound protein. The two fractions containing the soluble fraction and the granule-bound fraction were precipitated in acetone overnight, and each precipitated protein fraction was resuspended in gelatin buffer. The experiments were conducted in two successive years, and two biological replicates were performed in each year.
Western Blot
Proteins were transferred to polyvinylidene difluoride membranes after SDS-PAGE. The blots proceeded directly to the blocking step and then were exposed to antibodies. Bound antibodies were probed by goat anti-rabbit IgGs conjugated to horseradish peroxidase. Detection was carried out using enhanced chemiluminescence detection reagents, and imaging was performed by a chemiluminescence analyzer. Antibodies against GBSSI, SBEI, SBEIIb, SSI, and Pho1 were described previously (Liu et al., 2014). Anti-SBEIIa, anti-SSIIa, and anti-SSIIIa were produced against the synthetic peptides CVTEGVIKDADEPTV, LLSGRDDDTPASRN, and CTKDRDGISKKSGGD, respectively.
Immunofluorescence Analysis
Kernels at 10 DAF were fixed in 4% paraformaldehyde solution and 0.1 m phosphate buffer saline (PBS; pH 7.4) containing 4% paraformaldehyde for at least 4 h. After washing and dehydration, the kernels were embedded into paraffin. Slides with samples attached were wiped clean of any residual paraffin. After immersing the slide in wash buffer I (0.1 m PBS, pH 7.4, and 1% Triton X-100) for 1 h at room temperature, the slide was transferred to the blocking buffer (0.1 m PBS, pH 7.4, 1‰ Tween 20, 1 mm EDTA, and 5% BSA) at 37°C for 1 h. One hundred microliters of blocking buffer and the appropriate diluted concentration of antibodies were added to each slide, after which the slide was covered with Parafilm and then incubated overnight at 4°C. The slide was washed with washing buffer II (0.1 m PBS, pH 7.4, and 1‰ Triton X-100) three times for 15 min each and was immersed in blocking buffer again as described previously. Afterward, 100 μL of blocking buffer containing fluorescent secondary antibodies was added to each slide, after which the slide was incubated in a humidified and dark atmosphere at 37°C for 60 min. The slide was washed again with washing buffer II in the dark. Finally, nuclei were counterstained with 4,6-diamidinophenylindole, and the signals were observed using a fluorescence microscope. Two biological replicates were conducted.
Statistical Analysis
For statistical analysis, one-way ANOVA with Tukey’s test, Pearson’s bivariate correlations, and Student’s t test were evaluated using the SPSS 16.0 Statistical Software Program.
Supplemental Data
The following supplemental materials are available.
Supplemental Figure S1. Changes of amylose, amylopectin, and starch contents in developing kernels in 2015.
Supplemental Figure S2. Pleiotrophic effects of SBEI and SBEIIb down-regulation on other starch biosynthesis-related enzymes in developing endosperm in 2015.
Supplemental Figure S3. Dynamic expression and deposition of amylopectin synthesis-related enzymes in soluble fraction and granule-associated fraction of developing kernels in 2015.
Supplemental Figure S4. Soluble sugar content in developing kernels of TQ and TRS in 2016.
Supplemental Figure S5. Regional distribution of three heterogeneous starch granules in mature seeds of the rice ae mutant from the japonica rice Zhonghua 11.
ACKNOWLEDGMENTS
We thank Xiuling Cai (Institute of Plant Physiology and Ecology, Chinese Academy of Sciences) and Xiangbai Dong (Institute of Botany, Chinese Academy of Sciences) for providing the antibodies of starch biosynthesis-related enzymes.
LITERATURE CITED
Author notes
This work was supported by grants from the National Natural Science Foundation of China (31270221), the Natural Science Foundation of Jiangsu Province (BK20160457), the China Postdoctoral Science Foundation (2016590509), the Qing Lan Project of Jiangsu Province, and the Priority Academic Program Development of Jiangsu Higher Education Institutions.
Address correspondence to [email protected] (C.W.) and [email protected] (Q.L.).
The author responsible for distribution of materials integral to the findings presented in this article in accordance with the policy described in the Instructions for Authors (www.plantphysiol.org) is: Cunxu Wei ([email protected]).
C.W. and Q.L. conceived this project and designed all research; J.W., P.H., L.L., and Z.C. performed the experiments under the supervision of C.W. and Q.L; C.W. and J.W. analyzed the data and wrote the article.
Articles can be viewed without a subscription.
