


Abstract
The acquisition and assimilation of inorganic carbon (Ci) represents the largest flux of inorganic matter in photosynthetic organisms; hence, this process is tightly regulated. We examined the Ci-dependent transcriptional and metabolic regulation in wild-type Synechocystis sp. PCC 6803 compared with a mutant defective in the main transcriptional repressor for Ci acquisition genes, the NAD(P)H dehydrogenase transcriptional regulator NdhR. The analysis revealed that many protein-coding transcripts that are normally repressed in the presence of high CO2 (HC) concentrations were strongly expressed in ∆ndhR, whereas other messenger RNAs were strongly down-regulated in mutant cells, suggesting a potential activating role for NdhR. A conserved NdhR-binding motif was identified in the promoters of derepressed genes. Interestingly, the expression of some NdhR-regulated genes remained further inducible under low-CO2 conditions, indicating the involvement of additional NdhR-independent Ci-regulatory mechanisms. Intriguingly, we also observed that the abundance of 52 antisense RNAs and 34 potential noncoding RNAs was affected by Ci supply, although most of these molecules were not regulated through NdhR. Thus, antisense and noncoding RNAs could contribute to NdhR-independent carbon regulation. In contrast to the transcriptome, the metabolome in ∆ndhR cells was similar to that of wild-type cells under HC conditions. This observation and the delayed metabolic responses to the low-CO2 shift in ∆ndhR, specifically the lack of transient increases in the photorespiratory pathway intermediates 2-phosphoglycolate, glycolate, and glycine, suggest that the deregulation of gene expression in the ƊndhR mutant successfully preacclimates cyanobacterial cells to lowered Ci supply under HC conditions.
The acquisition and fixation of inorganic carbon (Ci) during photosynthesis generates an estimated net fixation of 210 gigatons of carbon per year (Stuart, 2011), representing the largest nutrient flux in living cells. Ci availability is often considered a limiting factor for photosynthetic performance. For example, in marine environments, the typical Ci level is constantly low at approximately 2 mm (Price et al., 2008). The central enzyme for photosynthetic carbon fixation is Rubisco, which catalyzes the carboxylation of ribulose-1,5-bisphosphate (RubP), generating two molecules of 3-phosphoglycerate. As the evolutionary ancestors of all eukaryotic chloroplasts (Ochoa de Alda et al., 2014), cyanobacteria constitute the prokaryotic model for Ci acquisition. These organisms also represent a globally important CO2 sink and are significant primary producers.
The cyanobacterial Rubisco is adapted to the elevated CO2 concentrations prevalent in the ancient atmosphere more than 350 million years ago (Berner, 1990). This apparent defect results in a rather low affinity for CO2 compared with Rubisco in algae or land plants (Price et al., 2008). To ensure efficient carbon fixation in the present-day CO2-poor environment, cyanobacteria developed a carbon-concentrating mechanism (CCM). The CCM includes efficient carbon uptake systems and the enrichment of CO2 around Rubisco caged within the carboxysome. Furthermore, the CCM apparently minimizes another limitation of Rubisco (i.e. the use of oxygen instead of CO2 as a substrate in the oxygenase reaction; Hackenberg et al., 2011). The resulting by-product, 2-phosphoglycolate (2PG), is toxic to photoautotrophic cells, because 2PG inhibits Calvin-Benson cycle enzymes (Kelly and Latzko, 1977; Husic et al., 1987; Norman and Colman, 1991). To metabolize 2PG, all oxygenic phototrophs evolved the photorespiratory 2PG metabolism (Bauwe et al., 2010). Multimodal 2PG metabolism, including the canonical photorespiratory cycle active in land plants, is essential for growth under ambient air conditions among cyanobacteria, indicating that the CCM is insufficient to completely suppress the oxygenase function of Rubisco (Eisenhut et al., 2008b).
In cyanobacteria, Ci uptake is tightly regulated at the transcriptional level. CCM-related genes encoding many components of Ci transporters are maximally expressed under Ci-limiting conditions (i.e. in ambient air [low CO2 {LC}]) but are repressed at elevated CO2 levels (high CO2 [HC]; Wang et al., 2004). Three transcriptional regulators of Ci utilization have been identified in the model cyanobacterium Synechocystis sp. PCC 6803 (hereafter, Synechocystis 6803): (1) the cyanobacterial homolog of the transition state regulator from Bacillus subtilis called cyAbrB2 (sll0822), (2) the regulator of the ATP-dependent bicarbonate transport system called CmpR (sll0030), and (3) NdhR (also called CcmR, CO2-concentrating mechanism regulator; sll1594). cyAbrB2 regulates the transcription of genes associated with both carbon and nitrogen metabolism (Ishii and Hihara, 2008; Lieman-Hurwitz et al., 2009; Kaniya et al., 2013). The regulator CmpR activates the expression of the cmpABCD operon encoding the high-affinity bicarbonate transporter called BCT1, which is induced under LC conditions (Omata et al., 2001). Generally, NdhR, also called CcmR, is regarded as the most important regulator of Ci utilization. NdhR primarily acts as a repressor of the genes encoding components of Ci transporters, such as NDH-13 and the sodium-dependent bicarbonate transporter called SbtA, under HC conditions (Figge et al., 2001; Wang et al., 2004; Woodger et al., 2007). Both NdhR and CmpR belong to a large family of LysR-type transcriptional regulators (LTTRs; Schell, 1993) that change DNA-binding properties upon binding to small effector molecules. Recently, the metabolic signals for CmpR and NdhR were identified. The promoter binding of the activator CmpR is stimulated through 2PG and RubP (Nishimura et al., 2008). For the repressor NdhR, the metabolites 2-oxoglutarate (2OG) and NADP+ have been confirmed as corepressor molecules (Daley et al., 2012), thereby increasing the binding of this repressor to two regions upstream of ndhR (sll1594) and ndhF3 (sll1732; Figge et al., 2001).
Existing transcriptomic data sets for the response of cyanobacteria to LC shifts are restricted to protein-coding genes (Wang et al., 2004; Eisenhut et al., 2007; Schwarz et al., 2011). Although widely accepted as important regulatory elements, small RNAs (sRNAs) were not included in the previous studies. Recent transcriptome analyses revealed a high number of non-protein-coding RNAs (ncRNAs) in Synechocystis 6803 (Georg et al., 2009; Mitschke et al., 2011; Kopf et al., 2014a). Several ncRNAs have been identified as important posttranscriptional regulators of photosynthetic gene expression. For example, a Ci-regulated antisense RNA (asRNA), As1_flv4, prevents the premature expression of the flavodiiron protein 2-4, flv4 -2 (sll0217-19) operon after a sudden downshift in Ci supply (Eisenhut et al., 2012). In addition to cis-encoded asRNAs, trans-encoded sRNAs also play an important role, such as PHOTOSYNTHESIS REGULATORY RNA1 (PsrR1). Indeed, PsrR1 is up-regulated after high-light treatment or CO2 depletion and controls the expression of several genes encoding photosynthetic proteins (Georg et al., 2014). The results of a recent study showed that the sRNA CARBON STRESS-INDUCED RNA1 (CsiR1) was highly expressed under most of the tested conditions but repressed upon long-term cultivation in HC (Kopf et al., 2014a).
In addition to transcriptomics, metabolomics has been applied to characterize changes in the pool sizes of cyanobacterial cells under different Ci levels (Schwarz et al., 2013). Isotope tracing studies demonstrated the reorganization of carbon fluxes in Synechocystis 6803 cells after shifts from HC to LC (Huege et al., 2011; Young et al., 2011). A metabolic signature characteristic for cells under Ci-limiting conditions has emerged from steady-state metabolic profiles, in which LC-grown cells of Synechocystis 6803 show transiently increased levels of photorespiratory intermediates, the long-term accumulation of glycolytic metabolites, and a decrease in nitrogen assimilation, resulting in reduced levels of amino acids, such as Glu, Gln, and Asp (Eisenhut et al., 2008a; Hackenberg et al., 2012; Schwarz et al., 2014).
Here, we present a comprehensive analysis of transcriptomic and metabolic changes upon a shift in Ci supply in wild-type Synechocystis 6803 and ∆ndhR mutant cells defective in the main Ci regulator, NdhR. We analyzed the structure of NdhR target promoters and describe the corresponding DNA-binding motif comprising an imperfect inverted repeat. The transcriptome data revealed the responses of several ncRNAs to changing Ci availability and specifically verified the Ci-dependent expression of CsiR1, which might belong to an additional NdhR-independent circuit of Ci regulation. Although a typical LC-related transcriptional pattern was observed in ∆ndhR under HC conditions, LC-related metabolic changes were not detected. However, this preacclimated status likely led to a less severe metabolic change in the response to shifts from HC to LC. Moreover, this preacclimation is not achieved at the expense of a reduced growth rate in the ∆ndhR mutant under HC conditions (Wang et al., 2004; this study). However, growth deficiency of the mutant was observed under LC. Therefore, these data suggest the existence of additional layers of control between transcriptional and metabolic activities in response to changing Ci availability.
RESULTS
Advanced Transcriptomics Revealed New Ci-Regulated Transcripts
Using a custom-made microarray comprising recently identified new open reading frames (norfs) and ncRNAs of Synechocystis 6803 (Mitschke et al., 2011), we analyzed the global transcriptomic response to changes in Ci availability (Supplemental Tables S1 and S2). A genome-wide graphical overview of probe localization and signal intensities is shown in Supplemental Data Set S1. An overview of the overlap with the data obtained using previously described array designs (Wang et al., 2004; Eisenhut et al., 2007) is shown in Tables I and II and Supplemental Figure S1. Thus, the results obtained here concerning protein-coding genes are consistent with and extend previous observations. One example is the gene norf1 (3-fold up-regulated; Supplemental Table S1), encoding a 48-amino acid protein widely conserved in cyanobacteria (Mitschke et al., 2011), which was not included in previous microarray studies.
Comparison of features (mRNAs or ncRNAs) for Synechocystis 6803 that are covered by microarrays used in this study and in previously published studies
The array design used in this study is based on Mitschke et al. (2011). The design used in previous studies was extracted from Wang et al. (2004) and Eisenhut et al. (2007). –, Not included; UTR, untranslated region.
The array design used in this study is based on Mitschke et al. (2011). The design used in previous studies was extracted from Wang et al. (2004) and Eisenhut et al. (2007). –, Not included; UTR, untranslated region.
Comparison of previously reported expression changes in Synechocystis 6803 upon a sudden downshift in Ci supply with the data of this study
A transcript was regarded as induced or repressed if the log2 fold change was greater than 1 (P < 0.05). Literature values were extracted from supplemental tables of Wang et al. (2004; 3 + 12 h after Ci downshift) and Eisenhut et al. (2007; 24 h after Ci downshift). For the evaluation, only ncRNAs were considered, which are clearly annotated according to Mitschke et al. (2011). n.i., Not investigated; –, Not included.
A transcript was regarded as induced or repressed if the log2 fold change was greater than 1 (P < 0.05). Literature values were extracted from supplemental tables of Wang et al. (2004; 3 + 12 h after Ci downshift) and Eisenhut et al. (2007; 24 h after Ci downshift). For the evaluation, only ncRNAs were considered, which are clearly annotated according to Mitschke et al. (2011). n.i., Not investigated; –, Not included.
Moreover, we identified many Ci-regulated asRNAs. In addition to As1_flv4, whose expression is decreased upon LC shift (Eisenhut et al., 2012), significant Ci-related expression changes were detected for 51 additional asRNAs (Table III; Supplemental Table S3). Among these asRNAs, a second flv4 gene asRNA (As2_flv4) was identified as a potential backup for the As1_flv4-dependent delay in Flv4 protein synthesis (Eisenhut et al., 2012). As2_flv4 showed a pattern similar to As1_flv4, but the expression changes were rather weak (−0.65 after 24 h of LC; Supplemental Table S1). Two additional asRNAs (sll1732-as1/-as2), previously implicated in the posttranscriptional regulation of genes for the NDH13 complex (sll1732–sll1735; Daley et al., 2012), were not Ci regulated in our data set (Supplemental Table S1). Moreover, we identified nine asRNAs with a more than 2-fold increase after 24 h under LC and a corresponding decrease in the levels of the cognate mRNAs. Two decreased asRNAs and an increase in complementary mRNAs were observed (Table III). This inverse relationship might indicate a regulatory effect of these asRNAs on the cognate mRNAs. This relationship was observed for three different ribosomal proteins and the translation elongation factor G2 (fusB; sll1098). Moreover, genes encoding several enzymes, such as transketolase, which links the pentose phosphate pathway to glycolysis, uroporphyrinogen decarboxylase, and adenylosuccinate synthetase, as well as the acyl carrier protein, which is involved in fatty acid biosynthesis, could be regulated through cognate asRNAs. We conclude that several of the Ci-regulated asRNAs might contribute to the regulation of selected metabolic routes under LC.
Changes in the abundance of asRNAs in wild-type cells of Synechocystis 6803 in response to a sudden shift in Ci supply
Values are given as log2 fold changes and were regarded as significant (asterisks) if the log2 value was −1 or less or 1 or more and the P value was 0.05 or less. Inverse regulated and equal regulated asRNA-mRNA pairs are described. The data are sorted by the fold change value of the asRNA at 24 h of LC. NA, Not available.
| asRNA | mRNA | Annotation | |||||
|---|---|---|---|---|---|---|---|
| asRNA | 3 h of LC | 24 h of LC | Gene | 3 h of LC | 24 h of LC | Gene Symbol | Protein Names |
| Inverse regulated asRNA-mRNA pairs | |||||||
| sll1804-as1 | 1.65* | 2.23* | sll1804 | −2.64* | −3.00* | rpsC (rps3) | 30S ribosomal protein S3 |
| slr0423-as1 | 2.14* | 1.86* | slr0423 | −1.19* | −1.24* | rlpA | RlpA-like protein |
| sll1098-as1 | 2.29* | 1.70* | sll1098 | −1.63* | −1.38* | fusB (fus) | Elongation factor G2 |
| sll1800-as2 | 1.48* | 1.56* | sll1800 | −2.24* | −2.75* | rplD (rpl4) | 50S ribosomal protein L4 |
| slr0536-as1 | 0.85 | 1.52* | slr0536 | −1.32* | −1.25* | hemE | Uroporphyrinogen decarboxylase |
| sll1070-as2 | 2.02* | 1.28* | sll1070 | −1.48* | −1.22* | tktA | Transketolase |
| sll1823-as1 | 1.84* | 1.10* | sll1823 | −2.58* | −2.46* | purA | Adenylosuccinate synthetase |
| ssl1426-as1 | 0.67 | 1.04* | ssl1426 | −1.55* | −1.95* | rpmI (rpl35) | 50S ribosomal protein L35 |
| ssl2084-as1 | 0.83 | 1.04* | ssl2084 | −1.00* | −1.30* | acpP | Acyl carrier protein |
| slr1146-as3 | −1.00* | −1.52* | slr1146 | 0.89 | 1.43* | NA | Hypothetical protein |
| As1_flv4 (sll0217-as2-0-x) | −3.03* | −2.51* | sll0217 | 5.58* | 4.95* | flv4 | Flavodiiron protein Flv4 |
| Equal regulated asRNA-mRNA pairs | |||||||
| slr1397-as1 | 0.22 | 1.16* | slr1397 | 0.19 | 1.11* | Unknown protein | |
In addition to asRNAs, trans-encoded sRNAs are involved in posttranscriptional regulation. Recently, the sRNA CsiR1 was expressed under most of the tested conditions (analyzed with cells grown at LC) but repressed under HC (Kopf et al., 2014a). Consistently, in the microarray data set obtained herein, CsiR1 was among the most highly induced transcripts (log2 fold change of 5.7) in cells shifted from HC to LC (Fig. 1A and Table IV). The expression kinetics was further investigated through northern blotting. CsiR1 was detected at 4 h after the shift to LC, with expression levels peaking within 12 to 24 h (Fig. 1B) and remaining at a constant high level, even under long-term LC acclimation. However, upon transfer to HC, CsiR1 was not detected after 24 h (Fig. 1B), suggesting that CsiR1 is repressed at elevated CO2 levels. To determine whether the observed effects reflect transcriptional or posttranscriptional control, we fused the luciferase reporter genes luxAB to the sequence upstream of csiR1 ranging from −299 to +1 (+1 designates the transcriptional start site [TSS]; data extracted from Mitschke et al., 2011), and the results showed Ci-dependent luciferase expression (Fig. 1C). When the reporter strains were initially grown under LC conditions, bioluminescence was detectable, suggesting PCsiR1 activity. However, the promoter activity decreased upon HC shift. The luminescence was decreased 50% after 4.5 h and reached background levels after 24 h under HC. Thus, the dynamics of luciferase expression were consistent with the observed time course of CsiR1 accumulation. We concluded that the CsiR1 promoter PCsiR1 is under Ci-dependent transcriptional control. When the sequence downstream of csiR1 (covering 323 bp upstream of the start codon of slr1214) was tested in the reporter gene assays, no bioluminescence was observed, suggesting that the CsiR1 promoter also drives the expression of the downstream gene slr1214, for which a strong induction in LC-grown cells has been reported previously (Wang et al., 2004), likely reflecting imperfect termination at the CsiR1 3′ end.
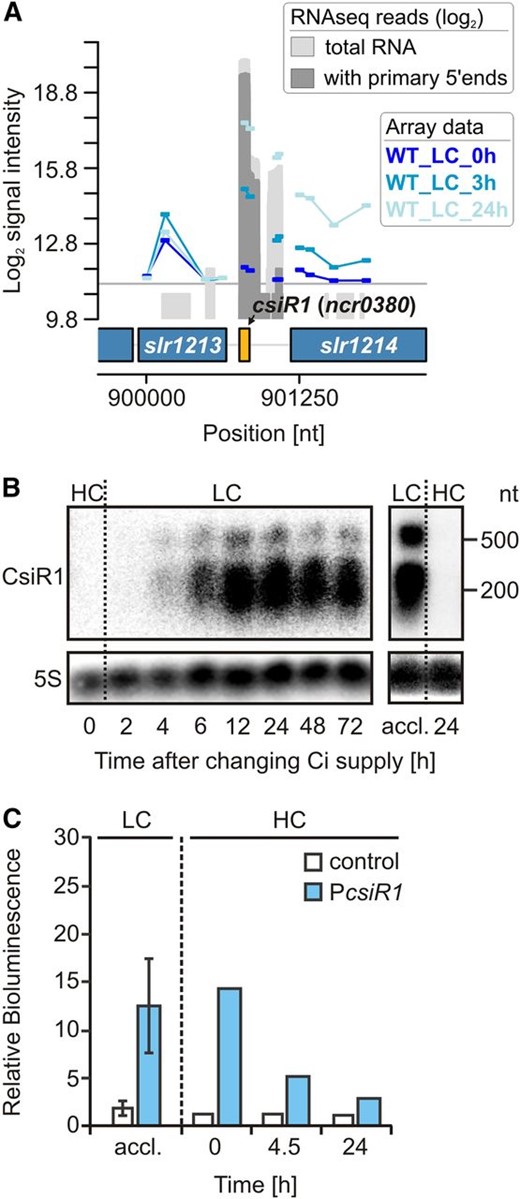
The Ci-regulated ncRNA CsiR1. A, Genomic locus of the ncRNA CsiR1 with mapped array probes. The signal intensities are given as log2 values. The gray graphs represent RNA sequencing data given as log2 read numbers, which were extracted from Mitschke et al. (2011). These data indicate that strong induction of CsiR1 probably also drives the expression of the downstream gene slr1214 (response regulator 15, light and stress integrating response regulator, lsiR), whose strong induction upon a downshift in Ci supply has been reported earlier (Wang et al., 2004). B, Ci-dependent expression kinetics of CsiR1 analyzed by northern blotting. Cells were precultivated in the presence of HC (5% CO2), and then CO2 supply was reduced (LC; 0.040%). Long-term LC-acclimated cells (accl.; 1 week) were again shifted to HC. C, Verification of the CsiR1 Ci-dependent promoter activity using luxAB reporter gene fusions whose expression was measured as bioluminescence in vivo. For the promoter analysis, the upstream sequence from −299 to +1 with respect to the csiR1 TSS (+1) was used. Data for LC are means ± sd obtained with triplicates (independent transformants) in three independent experiments. The shift to HC was performed twice. nt, Nucleotides; WT, wild type.
Changes in the abundance of potentially trans-encoded ncRNAs in the wild type and the mutant ∆ndhR of Synechocystis 6803 in response to a sudden shift in Ci supply
Values are given as log2 fold changes and were regarded as significant (asterisks) if the log2 value was −1 or less or 1 or more and the P value was 0.05 or less. For each strain, the expression values at HC were used as reference. Fold changes between the wild type and ∆ndhR under HC were calculated by subtracting the corresponding wild-type value. The columns are sorted by the fold change values for the wild type at 24 h of LC. It should be noted that only ncRNAs with an annotation based on Mitschke et al. (2011) were considered here. However, due to the fixed-distance algorithm that was used to classify ncRNAs, there might be some overlap with UTR annotations (e.g. ncl0690 is found upstream of ndhR and includes its 5′ UTR).
| Systematic Name | Annotation | Wild Type | ∆ndhR | ∆ndhR-Wild Type at HC | ||
|---|---|---|---|---|---|---|
| 3 h of LC | 24 h of LC | 3 h of LC | 24 h of LC | |||
| NC-425 | CsiR1, SyR14, ncr0380 | 3.03* | 5.69* | 0.59 | 5.64* | 0.07 |
| NC-101 | ncr1200 | 1.94* | 3.85* | 0.80 | 4.22* | −0.16 |
| NC-392 | ncr0840 | 2.60* | 2.71* | 1.09 | 2.82* | 0.12 |
| NC-423 | ncr0700 | 1.75* | 2.66* | 1.38* | 2.68* | 0.30 |
| NC-55 | ncr0240 | 1.96* | 2.65* | 1.45* | 3.01* | −0.02 |
| NC-137 | ncr1350 | 0.80 | 2.05* | 0.47 | 1.66* | −0.33 |
| NC-247 | ncl0570 | 0.28 | 1.94* | 0.13 | 2.02* | −0.13 |
| NC-115 | ncr1500 | 0.23 | 1.80* | 0.23 | 1.82* | −0.04 |
| NC-97 | ncl1110 | −0.17 | 1.68* | −0.21 | 2.00* | −0.08 |
| NC-248 | ncr1240 | 0.63 | 1.67* | 0.27 | 1.87* | −0.02 |
| NC-443 | SyR52, ncl1790 | 0.49 | 1.49* | 0.50 | 1.85* | −0.01 |
| NC-319 | ncl0690 | 1.56* | 1.34* | 0.15 | 1.00 | 3.29* |
| NC-388 | ncr1650 | 1.04* | 1.25* | 0.54 | 1.70* | −0.01 |
| NC-17 | ncl0170 | 0.14 | 1.24* | 0.36 | 1.19* | −0.72 |
| NC-261 | ncr0080 | 0.78 | 1.19* | 0.40 | 1.45* | −0.14 |
| NC-372 | ncl1060 | −0.15 | 1.19* | −0.05 | 1.73* | 0.03 |
| NC-239 | ncr1280 | 1.79* | 1.16* | 1.48* | 0.30 | 0.28 |
| NC-430 | ncr0210 | 0.74 | 1.14* | −0.36 | −0.71 | 1.58* |
| NC-272 | ncr0530 | 0.35 | 1.13* | 0.19 | 1.02* | −0.07 |
| NC-168 | ncl1350 | 0.00 | 1.12* | 0.33 | 0.61 | −0.26 |
| NC-237 | ncl1700 | 0.16 | 1.10* | 0.08 | 1.36* | −0.06 |
| NC-262 | ncr1220 | −0.09 | 1.07* | −0.18 | 1.19* | 0.02 |
| NC-404 | ncl1010 | 0.13 | 1.07* | 0.31 | 0.72 | 0.01 |
| NC-135 | ncl0440 | 0.75 | 1.02* | 0.23 | 0.80 | 0.05 |
| NC-639 | ncl0215 | −0.71 | −1.31* | −0.44 | −1.44* | −0.02 |
| NC-22 | ncr1020 | −1.26* | −1.39* | −1.10* | −1.34* | −0.02 |
| NC-250 | ncr1390 | −1.56* | −1.51* | −0.88 | −1.47* | −0.34 |
| NC-230 | ncl0540 | −2.02* | −1.52* | −0.75 | −1.96* | −0.54 |
| NC-412 | ncl0110 | −1.42* | −1.55* | −1.19* | −1.55* | −0.04 |
| NC-171 | NsiR4, SyR12, ncl0540 | −2.22* | −1.58* | −0.81 | −1.97* | −0.58 |
| NC-318 | ncl1500 | −1.83* | −1.66* | −0.53 | −2.20* | −0.19 |
| NC-334 | ncl1330 | −1.80* | −1.84* | −0.08 | −1.97* | −0.41 |
| NC-146 | ncl0380 | −1.85* | −1.90* | −1.17* | −1.86* | −0.12 |
| NC-240 | ncr1660 | −2.61* | −3.18* | −1.92* | −3.36* | −0.10 |
In addition to CsiR1, many other sRNAs were also up- or down-regulated upon Ci downshift, including Non-coding RNA 0700, Ncr0700, and Nitrogen stress-induced RNA4, NsiR4 (Table IV), for which strong expression changes in response to light or nitrogen depletion have been described (Kopf et al., 2014a). Similar to the well-characterized sRNA PsrR1, a posttranscriptional regulator of photosynthesis genes (Georg et al., 2014), the Ci-regulated sRNAs might also be implicated in regulatory processes. However, the potential targets of these sRNAs remain unknown. Next, we examined how the expression of these sRNAs is associated with the Ci regulatory network.
Mutation of ndhR Has Only Minor Effects on the Ci-Regulated ncRNAs
Using an optimized microarray platform, we also analyzed the transcriptomic response in the ƊndhR mutant. The entire expression data set of sRNAs, asRNAs, and mRNAs for protein-encoding genes is displayed in Supplemental Table S2. The expression of only some ncRNAs changed in the ∆ndhR mutant compared with the wild type, whereas the majority of these RNAs remained Ci regulated. For example, the sRNA CsiR1 was not present under HC and accumulated in LC-shifted ∆ndhR cells, suggesting that the expression of CsiR1 is independent of NdhR. However, the induction of CsiR1 was slower after the LC shift compared with the wild type (i.e. the CsiR1 transcript level was less highly induced at 3 h after LC shift in ∆ndhR but reached similar levels to the wild type after 24 h of LC; Table IV). This delayed induction was also observed for many other LC-induced, but not NdhR-regulated, genes in the ƊndhR cell background, reflecting the preacclimated state of this mutant (discussed below in more detail). However, the putative sRNA Ncr0210 was NdhR regulated, showing a more than 2-fold increase in ƊndhR under HC (Fig. 2; Table IV). Ncr0210 is transcribed from a region downstream of the protein-coding gene slr1592, which is also NdhR regulated (see below). Moreover, the microarray analysis revealed that the expression of asRNA sll1730-as1 increased more than 3-fold in ∆ndhR compared with the wild type under HC conditions. This asRNA is complementary to regions of sll1730, which encodes a protein of unknown function and is not Ci regulated. However, the detailed analysis revealed that this asRNA also overlaps with the TSS of the adjacent gene sll1732 (ndhF3), which is elevated in ∆ndhR under HC (Fig. 2).
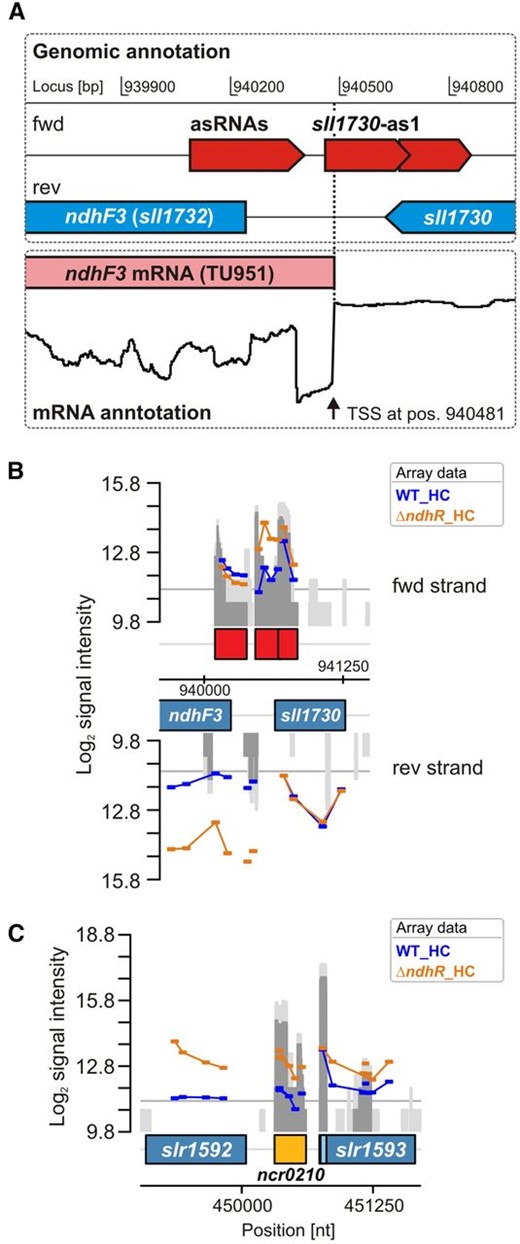
Identification of NdhR-regulated asRNAs and potentially trans-encoded ncRNAs. A, Transcriptional organization of the ndhF3 gene, for which an increased transcript accumulation was observed in ∆ndhR. The localization of asRNAs was extracted from Mitschke et al. (2011). Differential RNA sequencing (Kopf et al., 2014a) revealed the TSS of the ndhF3 gene. Interestingly, one asRNA (sll1730-as1), which was originally mapped to sll1730, because it overlaps its coding region, also overlaps with 21 nucleotides of the 5′ end of the ndhF3 mRNA (TU951). B, Array signals for probes covering the same genomic region. Transcription of this asRNA also appeared higher in ∆ndhR. C, Array signals for a putatively NdhR-regulated ncRNA, Ncr0210, which is localized downstream of slr1592 and also appeared to be NdhR regulated (compare with Table V, class III genes). nt, Nucleotides; WT, wild type.
The ndhR Mutation Affects mRNAs Belonging to Different Groups
The data set generated in this study contained many genes that are up-regulated under HC conditions in ∆ndhR relative to wild-type cells (Table V; Supplemental Fig. S2), in which these genes are typically induced under LC according to Wang et al. (2004). These results suggested that NdhR is an HC-dependent repressor. In contrast to previous studies, we also analyzed cells shifted for 3 and 24 h under LC conditions to characterize long-term Ci-dependent transcriptional regulation. Interestingly, we noted additional LC-induced changes in the mRNA levels of many genes, which were deregulated in ∆ndhR under HC and therefore not expected to be further affected through changes in the Ci supply. According to the Ci and/or NdhR regulation pattern of transcript accumulation, we defined five categories of genes differently affected through the ndhR disruption in cells under HC or LC conditions (Fig. 3).
Genes whose expression was affected by ndhR mutation in Synechocystis 6803
Values are given as log2 fold changes and were regarded as significant (asterisks) if the log2 value was −1 or less or 1 or more and the P value was 0.05 or less. Fold changes between the wild type and ∆ndhR were calculated for each time point by subtracting the corresponding wild-type value. Categories were defined based on the regulatory pattern observed after Ci downshift (for explanations, see text). For comparison reasons, the log2 fold changes of ∆ndhR observed by Wang et al. (2004; only HC conditions were considered there [n.c. = no change]) were compared with the changes observed in this study. The transcriptional organization (operon structure and presence of TSSs) was extracted from Kopf et al. (2014a). NA, Not available.
| Identifier | Gene Name | Protein Name | Wang et al. (2004) at HC | ∆ndhR-Wild Type | Category Type | Operon | First Gene of Cluster | Motif Upstream | ||
|---|---|---|---|---|---|---|---|---|---|---|
| HC | 3 h of LC | 24 h of LC | ||||||||
| slr2006 | NA | Hypothetical protein | 5.84 | 4.30* | 3.19* | 3.32* | I | a | + | + |
| slr2007 | ndhD5 | NADH dehydrogenase subunit 4 | 4.42 | 3.29* | 2.34* | 2.58* | I | a | − | − |
| slr2008 | NA | Hypothetical protein | 3.20 | 2.71* | 1.57* | 1.76* | I | b | + | − |
| slr2009 | ndhD6 | NADH dehydrogenase subunit 4 | 2.42 | 2.21* | 1.21* | 1.32* | I | b | − | − |
| slr2010 | NA | Hypothetical protein | 3.16 | 2.34* | 1.27* | 1.36* | I | b | − | − |
| slr2011 | NA | Hypothetical protein | 2.19 | 2.21* | 1.10* | 1.29* | I | b | − | − |
| slr2012 | NA | Hypothetical protein | 1.80 | 2.22* | 1.11* | 1.38* | I | b | − | − |
| slr2013 | NA | Hypothetical protein | 1.69 | 1.74* | 0.69 | 0.86 | I | b | − | − |
| ssr3409 | NA | Hypothetical protein | 1.61 | 2.41* | 1.31* | 1.53* | I | b | − | − |
| ssr3410 | NA | Hypothetical protein | 3.15 | 2.50* | 1.47* | 1.59* | I | b | − | − |
| sll1732 | ndhF3 | NADH dehydrogenase subunit 5 (involved in low CO2-inducible, high-affinity CO2 uptake) | 4.22 | 2.78* | −0.92 | 0.90 | II | c | + | + |
| sll1733 | ndhD3 | NADH dehydrogenase subunit 4 (involved in low CO2-inducible, high-affinity CO2 uptake) | 4.25 | 2.63* | −0.86 | 0.94 | II | c | − | − |
| sll1734 | cupA | Protein involved in low CO2-inducible, high-affinity CO2 uptake | 3.88 | 2.28* | −0.87 | 0.91 | II | c | − | − |
| sll1735 | NA | Hypothetical protein | 2.47 | 1.77* | −0.75 | 1.01* | II | c | − | − |
| slr1512 | sbtA | Sodium-dependent bicarbonate transporter | 3.31 | 1.76* | −0.95 | 1.55* | II | d | + | + |
| slr1513 | NA | Periplasmic protein, function unknown | 1.43 | 1.15 | −0.77 | 1.55* | II | d | − | − |
| sll0529 | NA | Hypothetical protein | 1.66 | 1.01* | 0.94 | 0.57 | III | No | + | + |
| sll0834 | bicA | Low-affinity bicarbonate transporter | n.c. | 2.85* | 2.55* | 1.04* | III | No | + | + |
| slr1592 | NA | Probable pseudouridine synthase | 2.10 | 1.98* | 1.62* | 1.23* | III | No | + | + |
| slr0907 | NA | Unknown protein | n.c. | −1.24* | −1.73* | −1.04* | IV | e | + | − |
| sll1862 | NA | Unknown protein | n.c. | −0.89 | −0.78 | −1.02* | IV | No | + | In coding sequence |
| slr1259 | NA | Hypothetical protein | n.c. | −0.20 | 1.39* | 1.87* | V | f | + | − |
| slr1261 | NA | Hypothetical protein | n.c. | −0.18 | 0.96 | 1.29* | V | f | − | − |
| slr1260 | NA | Hypothetical protein | n.c. | −0.13 | 0.81 | 1.22* | V | f | − | − |
| slr1302 | cupB | Protein involved in constitutive low-affinity CO2 uptake | n.c. | 0.07 | 0.93 | 1.13* | V | No | + | In coding sequence |
| slr1535 | NA | Hypothetical protein | 1.20 | 0.15 | 1.47* | 0.99 | V | No | + | + |
| ssl3769 | NA | Unknown protein | n.c. | −0.02 | 0.40 | 1.52* | V | No | + | + |
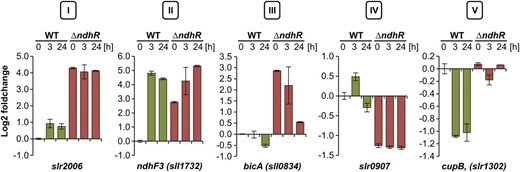
Classification of Ci-regulated protein-coding genes in Synechocystis 6803. Different categories of expression patterns were observed in ∆ndhR upon sudden downshift in Ci availability: category I, entirely deregulated; category II, derepressed but further induced upon Ci downshift; category III, derepressed in ƊndhR but not inducible by Ci depletion in wild type (WT); category IV, repressed compared with the wild type; and category V, not repressed by Ci depletion as in the wild type. Values are given as log2 fold changes compared with the wild type grown at HC (0 h).
The genes in category I were fully expressed in the ƊndhR background under HC, and no further increase in transcript abundance was observed after the LC shift. For example, category I contains the putative operon slr2006-slr2013, encoding the subunits of a multicomponent Na+/H+ antiporter complex. The transcript abundances of category I genes were higher in mutant than in wild-type cells at all three time points under HC and at 3 and 24 h under LC. The genes in category II, such as sll1732 (ndhF3), also showed increased transcript abundance in ƊndhR under HC, but these genes were further stimulated after the LC shift and might be regulated through an additional factor. Category III comprises the genes that were not LC induced in wild-type cells but whose expression was strongly enhanced in ƊndhR under HC compared with wild-type cells. In addition to sll0529 (annotated as a hypothetical protein with similarities to a phosphoketolase) and slr1592 (putative pseudouridine synthase), for which an up-regulation in ƊndhR was also reported (Wang et al., 2004), sll0834, which encodes the Na+-bicarbonate symporter BicA, is a new member of the category III genes. Interestingly, the transcript levels of all three genes were decreased in ƊndhR cells after long-term LC, further suggesting the additional regulation of some NdhR-regulated genes. The category IV genes showed strong down-regulation in ƊndhR cells under HC, indicating that NdhR might also function as a transcriptional activator. An example in this category is the gene slr0907, which encodes a giant protein containing a GT1 family glycosyltransferase and a methyltransferase domain. In addition to the role of NdhR in LC-stimulated gene expression, we also observed that NdhR might be implicated in the down-regulation of some genes, defined as category V, under LC conditions. For example, slr1302 (CO2 uptake protein B, cupB) is normally expressed at lower levels under LC conditions but showed no decrease in LC-treated ƊndhR cells. The category V genes might be inversely NdhR regulated (i.e. the expression of these genes is suppressed through NdhR binding under LC). A full list of significant expression changes and gene classifications is provided in Table V.
In addition to the changed expression of the genes in categories I to V, we observed that many of the remaining LC-induced genes, which did not show changes in the mutant ƊndhR (e.g. flv4 or cmpA), showed a delayed response after LC shift (i.e. the mRNA levels were typically lower after 3 h under LC in ∆ndhR compared with the wild type, but equal levels were observed after 24 h; Supplemental Table S4). This slower response was also observed for several LC-induced ncRNAs, and this effect is consistent with the derepression of many genes encoding CCM components in the ƊndhR mutant strain under HC, leading to the preacclimation of mutant cells to LC conditions.
Definition of the NdhR-Binding Motif
NdhR belongs to the LTTR family that commonly bind to palindromic DNA sequences forming an imperfect dyadic region (Schell, 1993; Maddocks and Oyston, 2008). Moreover, LTTR proteins are frequently autoregulatory (i.e. these proteins bind and regulate their own promoters). Correspondingly, we observed a 3-fold increase of the ndhR mRNA levels after the shift from HC to LC in wild-type cells (Supplemental Table S1), likely reflecting the release of NdhR from the promoter, consistent with Figge et al. (2001). The consensus binding motif of all LTTRs was defined as T-N11-A (Goethals et al., 1992), which is also part of the previously reported putative NdhR motif (TCAATG-N10-ATCAA; Figge et al., 2001). However, this motif is not present in the upstream regions of the deregulated genes in ∆ndhR. Hence, we speculated that NdhR might bind to a different DNA sequence. Making use of the currently available comprehensive genomic information, we conducted a comparative analysis of ndhR promoters among cyanobacteria, assuming the autoregulation of this promoter, as in Synechocystis 6803. A 300-bp sequence upstream of the ndhR start codon was extracted from strains closely related to Synechocystis 6803, such as Synechococcus sp. PCC 7002, Cyanothece sp. ATCC 51142, Pleurocapsa sp. PCC 7327, and Microcystis aeruginosa PCC 9717, to identify conserved promoter motifs. In addition to ndhR, NdhR binding was verified for the promoter of the bicarbonate transporter gene bicA in Synechococcus sp. PCC 7002 (Woodger et al., 2007). Interestingly, in Synechococcus sp. PCC 7002, bicA is clustered with genes similar to slr2006-2013, which are also NdhR regulated in Synechocystis 6803. Hence, sequences upstream of bicA were also extracted from cyanobacterial genomes, showing a similar bicA organization to that in Synechococcus sp. PCC 7002. The extracted sequences were analyzed using the MEME search tool (Bailey et al., 2009), and the results revealed the common motif ATNGN7TCTAT. This sequence was also identified upstream of many genes, including sbtA, ndhF3, and slr2006, showing changed expression in Synechocystis 6803 ∆ndhR mutant cells (Fig. 4A). The same motif was also observed upstream of bicA, although this gene was not LC induced in Synechocystis 6803 to the same extent as in Synechococcus sp. PCC 7002. However, according to the data obtained in this study, bicA is apparently NdhR regulated in Synechocystis 6803, as the mRNA level of this gene was increased in ∆ndhR (Table V). The ATNGN7TCTAT motif is located downstream of the -10 element and the TSS in NdhR-regulated promoters of Synechocystis 6803. These sites were used to refine the consensus sequence, namely ATAG-N8-CTAT (Fig. 4B). Interestingly, the NdhR-binding motif is also observed upstream of bicA in Synechococcus sp. PCC 7002. The role of NdhR binding for bicA expression perfectly corresponds to the data obtained from previous studies involving promoter test experiments using a reporter gene approach, showing the derepression of truncated bicA promoters that miss the NdhR-binding motif identified herein (Fig. 4C; data extracted from Woodger et al., 2007). Moreover, this consensus motif is present twice upstream of the ndhR gene in Synechocystis 6803. Previous studies have shown that only promoter fragments harboring these motifs displayed in vitro NdhR binding, whereas promoter versions without the motif did not bind NdhR (Fig. 4D; data extracted from Figge et al., 2001).
![Definition of the NdhR-binding motif using comparative genomics and existing literature data. A, Promoters of NdhR-regulated genes. Initially, a conserved motif was found by comparison of the upstream sequences of the ndhR genes from Synechocystis 6803, Synechococcus sp. PCC 7002, Cyanothece sp. ATCC 51142, Pleurocapsa sp. PCC 7327, and M. aeruginosa sp. PCC 9717 (see text). This was also found upstream of other NdhR-regulated genes in Synechocystis 6803 and homologs from Synechocystis sp. PCC 6714 or Synechococcus sp. PCC 7002 (shown here). The motif (marked by red boxes) is located close to the basal promoter and TSS. Information about the TSS and -10 elements (green letters) was extracted from Mitschke et al. (2011), Kopf et al. (2014a; 6803), and Kopf et al. (2015; 6714). D082_12750 refers to the slr2006 ortholog in the genome of Synechocystis sp. PCC 6714 (Kopf et al., 2014b). B, Alignment of the motifs found upstream of NdhR-regulated genes in Synechocystis 6803 and Synechocystis sp. PCC 6714 as well as Synechococcus sp. PCC 7002, and definition of a consensus motif as ATAG-N8-CTAT. The sequence comparisons were made manually after detection of the described motif using the MEME search tool. The logos in A and B were generated using the Web server http://weblogo.berkeley.edu. C, In vivo luminescence measurements using strains of Synechococcus sp. PCC 7002 carrying two different parts of the bicA promoter fused with luciferase genes (data were extracted from Woodger et al., 2007). The gray box marks the position of the identified NdhR motif relative to the analyzed fragments. The full-length promoter of bicA repressed luciferase expression at HC but induced it at LC (see cl.12). The truncated promoter used to generate strain cl.10 missed the identified NdhR binding site. The relative luminescence (relative luminescence units [RLU]) of cl.10 at HC was already as high as that observed for cl.12 at LC. It was not further up-regulated, as observed for all other reporter strains (Woodger et al., 2007). D, Summary of electrophoretic mobility shift assay (EMSA) data using the upstream sequence of the ndhR gene of Synechocystis 6803 (data were extracted from Figge et al., 2001). Two fragments used for EMSA (−65 to +14 and +14 to +94) showed NdhR binding, indicating that at least two NdhR-binding sites exist. The motif identified here is present at positions −24 to −9 and +38 to +53, which are only located within the two fragments bound to NdhR in the EMSA experiments (Figge et al., 2001).](https://oup.silverchair-cdn.com/oup/backfile/Content_public/Journal/plphys/169/3/10.1104_pp.114.254045/4/m_plphys_v169_3_1540_f4.jpeg?Expires=1750663500&Signature=cXoprMhtfO-DXmiyOvNH3VYuHiTup3IgpZEXLKKK05WTM6fiOrHTWFzHuq5exlQhIFR8ujbOUjVyZqZ74AwlEgCumQZAMCIRbIXsE5je7b-vzbwSlr0UlsD6ish0-l3bBkgKlxKakhFfTSqIpHfN2H2MR7b8zykbL03TwyK~dMGRTKNDChSObXeBp3jQZlyRiMZy5xu97ItP7DCkwgaQcGwOjNVuCdjpJNnrulc82qc7uefHKBReDTKVKeKPq5KUNhUbYzP4qR9y9Y7gxJyMKJ9-2CC5mM05za8EgkimgempfbVDFsAL6kaGiRV7Cj6cqOO5FgvTtyIgyWhL4I-0Ew__&Key-Pair-Id=APKAIE5G5CRDK6RD3PGA)
Definition of the NdhR-binding motif using comparative genomics and existing literature data. A, Promoters of NdhR-regulated genes. Initially, a conserved motif was found by comparison of the upstream sequences of the ndhR genes from Synechocystis 6803, Synechococcus sp. PCC 7002, Cyanothece sp. ATCC 51142, Pleurocapsa sp. PCC 7327, and M. aeruginosa sp. PCC 9717 (see text). This was also found upstream of other NdhR-regulated genes in Synechocystis 6803 and homologs from Synechocystis sp. PCC 6714 or Synechococcus sp. PCC 7002 (shown here). The motif (marked by red boxes) is located close to the basal promoter and TSS. Information about the TSS and -10 elements (green letters) was extracted from Mitschke et al. (2011), Kopf et al. (2014a; 6803), and Kopf et al. (2015; 6714). D082_12750 refers to the slr2006 ortholog in the genome of Synechocystis sp. PCC 6714 (Kopf et al., 2014b). B, Alignment of the motifs found upstream of NdhR-regulated genes in Synechocystis 6803 and Synechocystis sp. PCC 6714 as well as Synechococcus sp. PCC 7002, and definition of a consensus motif as ATAG-N8-CTAT. The sequence comparisons were made manually after detection of the described motif using the MEME search tool. The logos in A and B were generated using the Web server http://weblogo.berkeley.edu. C, In vivo luminescence measurements using strains of Synechococcus sp. PCC 7002 carrying two different parts of the bicA promoter fused with luciferase genes (data were extracted from Woodger et al., 2007). The gray box marks the position of the identified NdhR motif relative to the analyzed fragments. The full-length promoter of bicA repressed luciferase expression at HC but induced it at LC (see cl.12). The truncated promoter used to generate strain cl.10 missed the identified NdhR binding site. The relative luminescence (relative luminescence units [RLU]) of cl.10 at HC was already as high as that observed for cl.12 at LC. It was not further up-regulated, as observed for all other reporter strains (Woodger et al., 2007). D, Summary of electrophoretic mobility shift assay (EMSA) data using the upstream sequence of the ndhR gene of Synechocystis 6803 (data were extracted from Figge et al., 2001). Two fragments used for EMSA (−65 to +14 and +14 to +94) showed NdhR binding, indicating that at least two NdhR-binding sites exist. The motif identified here is present at positions −24 to −9 and +38 to +53, which are only located within the two fragments bound to NdhR in the EMSA experiments (Figge et al., 2001).
The Metabolic Response of the ƊndhR Mutant to the LC Shift
The transcriptome data revealed that many genes specifically induced in the wild type through a shift from HC to LC were also expressed at increased levels in the ƊndhR mutant under HC. These observations are consistent with a function of NdhR as a major transcriptional regulator that adjusts the physiological status of Synechocystis 6803 to the changing Ci supply. Specifically, we speculated that the ƊndhR mutant might be constitutively preacclimated to a low Ci supply, because these cells lack the regulation of ndhR target genes. To examine this hypothesis at the metabolic level, we compared the phenotype of the mutant with that of the wild type under varying Ci supplies using a metabolite profiling platform enriched for the intermediates of central carbon metabolism (Eisenhut et al., 2008a; Schwarz et al., 2011, 2014). The resulting profiles comprised more than 600 mass features for nontargeted metabolome analysis, facilitating the examination of 45 identified metabolites and 18 repeatedly observed, but yet unidentified, analytes (Supplemental Table S5).
We expected that cells preacclimated to low Ci supply should not show the metabolic effects of LC under HC conditions. Consistent with this expectation, ƊndhR mutant and wild-type cells did not show marked metabolic differences under HC conditions, as indicated by the nontargeted independent component analysis (ICA; Fig. 5A) and the supporting significance analysis (Supplemental Table S5). Particularly, we observed no changes in metabolites, such as the photorespiratory metabolites 2PG or glycolate, characteristic of the LC-shift response of wild-type cells under HC conditions (Fig. 6). These compounds were accumulated under HC conditions in the ccmM mutant of Synechocystis 6803 (Hackenberg et al., 2012). Among the few differences between the ƊndhR mutant and wild-type cells under HC conditions was a significant decrease in Glc-6-P, indicating a decrease in soluble sugar metabolism (Fig. 6).
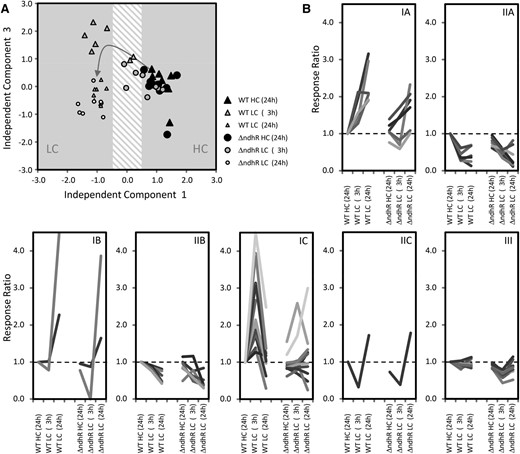
Global analysis of the metabolic responses to a shift from HC to LC conditions in the Synechocystis 6803 wild type (WT) compared with the ƊndhR mutant. A, Nontargeted ICA of all observed mass features from gas chromatography-electron ionization-time of flight-mass spectrometry-based metabolite profiles. The transition of the wild-type metabolome (triangles) from HC to LC (described by IC1) via transient changes at 3 h of LC (described by IC3) is indicated by the arrow. The metabolome of the ƊndhR mutant (circles) responds with a delay and does not form the wild-type pattern of transient changes 3 h after the shift to LC. The ICA was based on the first five components of a principal component analysis that covered 46.4% of the total variance of the data set. The data set consists of three independently repeated biological experiments with two to three replicate samples from each culture and condition. B, Classification of the annotated metabolites from our metabolome data set according to their response type in the Synechocystis 6803 wild type. Categories IA to IC comprise metabolites with early and maintained (IA), late (IB), or only transient (IC) increases. Categories IIA to IIC represent the respective inverse behavior. Category III contains nonresponding metabolites in the wild type that are significantly changed in the ƊndhR mutant in at least one of the conditions (P < 0.05). Categories are based on hierarchical cluster analysis (HCA) using Euclidian distance and complete linkage.
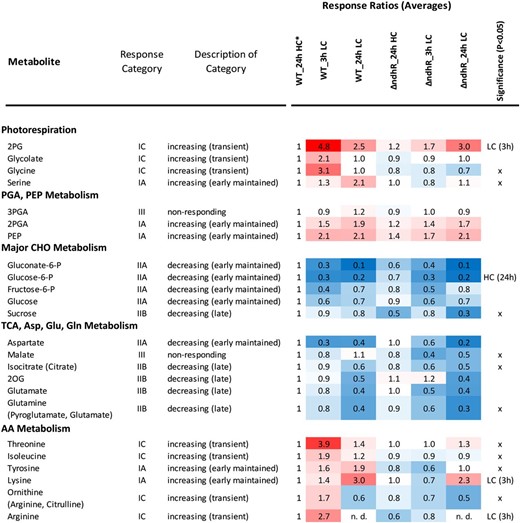
Overview of Ci-responsive metabolites in the Synechocystis 6803 wild type (WT) compared with the ƊndhR mutant. The heat map shows response ratios relative to the wild type at 24 h of HC (asterisk). Metabolites are sorted according to general metabolic context and classified by response category in the wild type (compare with Fig. 5). The significant general difference between the wild type and mutant was assessed by two-way ANOVA (x). Condition-specific differences were tested by heteroscedastic Student’s t test in LC (3 h) and HC (24 h). For the underlying statistical assessments and the full set of profiled metabolites, see Supplemental Table S5.
However, consistent with the assumed preacclimation under HC conditions in response to low Ci supply, the LC-shifted ƊndhR cells exhibited clear metabolic differences. Nontargeted ICA revealed a delay in metabolic responses to an LC shift in the mutant (Fig. 5A). Specifically, the transient metabolic state of wild-type cells at 3 h was not apparent in LC-shifted mutant cells after either 3 or 24 h. For a more detailed analysis, we classified the metabolites into seven response categories according to changes in the Ci shift-associated relative pool sizes in wild-type cells. Categories IA to IC comprise metabolites with early and maintained, late, or transient increases, respectively, whereas categories IIA to IIC represent the respective inverse behavior, and category III comprises nonresponding metabolites (Fig. 5B; Supplemental Table S5). The early and maintained increases and the transient increases in the metabolites of categories IA and IC were absent in the mutant, delayed, or diminished (Fig. 5B). In contrast, categories IIA to IIC, containing metabolites with generally decreased pool sizes, were largely similar in mutant and wild-type cells. Category IC, with transiently increased metabolites in the wild type but with delayed or unchanged responses in the mutant, contained the photorespiration intermediates 2PG, glycolate, and Gly. Thus, the metabolic behavior of wild-type cells in response to a sudden shift to low Ci supply is referred to as the photorespiratory burst (Fig. 6). The photorespiratory burst did not extend into the Ser, 3-phosphoglycerate, and 2-phosphoglycerate pools. Long-term, LC-induced Ser accumulation, however, was absent in the mutant. The photorespiratory burst was accompanied by the transient accumulation of specific amino acids, namely Thr, Ile, and the joined Arg, Orn, and citrulline pools (Fig. 6). Similar to Ser, Lys and Tyr were early and maintained in wild-type cells but were delayed or absent in the mutant.
Although the ƊndhR mutant and wild-type cells adopted matching metabolic phenotypes at 24 h after the shift to low Ci supply (Figs. 5 and 6), the mutant unexpectedly showed a clear growth deficiency under LC conditions, whereas growth was not significantly affected under HC (Supplemental Fig. S3). The associated significant metabolic differences between the ƊndhR mutant and wild-type cells after long-term LC acclimation were decreased levels of malate, Suc, and glycerol-3-phosphate accompanied by increased levels of glycerol and Ser (Fig. 6; Supplemental Table S5). Thus, here, we conducted an integrated analysis of the metabolic responses and expression of genes encoding the enzymes of photorespiration and central metabolism, revealing that gene expression and the respective metabolic changes in response to low Ci supply were largely unchanged in the ƊndhR mutant (for a graphical overview, see Supplemental Data Set S2).
DISCUSSION
Carbon-Regulated Genes and sRNAs
The switch from HC to LC conditions initiates cellular reprogramming involving the enhanced expression of CCM components, particularly genes for high-affinity Ci transporters. This coordinated up-regulation of specialized transporters, such as BCT1, SbtA, or NDH13, has previously been demonstrated for many cyanobacterial strains (Omata et al., 1999; Shibata et al., 2001; Woodger et al., 2007). However, transcriptomics using microarrays for Synechocystis 6803 (Wang et al., 2004; Eisenhut et al., 2007) revealed that many more genes become activated in LC-shifted cells, indicating that higher CCM activity is not sufficient to fully compensate for the lower external Ci availability. Among these genes, the operon encoding the flavodiiron proteins Flv2 and Flv4 is up-regulated. These proteins play an important role in the protection of PSII under photooxidative stress (Zhang et al., 2012). In addition, we observed increased mRNA levels of the slr0373-0376 gene cluster, which is transcribed at elevated levels under many stress conditions, including iron starvation (Singh and Sherman, 2002), and encodes proteins of unknown function and the Slr0006 protein, which has homologs in higher plants and might act as a regulatory protein by binding RNA (Carmel et al., 2013). Among the down-regulated genes (Supplemental Table S1), the genes encoding ribosomal proteins and components of nitrogen assimilation, such as glnA (slr1756), nrtABCD (sll1450-53), or amt1 (ammonium transporter1; sll0108), were predominantly identified. The reduced expression is correlated with much lower growth and the relatively increased nitrogen availability of LC-shifted Synechocystis 6803 cells. Remarkably, there were few changes in the expression of enzymes participating in the primary carbon metabolism of Synechocystis 6803, whereas these genes were often LC regulated in Synechococcus elongatus PCC 7942 (Schwarz et al., 2011).
While our expression data on protein-coding genes are consistent with the findings of previous studies, here, we provide, to our knowledge, the first analysis of the impact of varying Ci levels on ncRNAs. Several LC-stimulated asRNAs (Table II) were detected. The asRNAs frequently act as negative regulators of cognate mRNAs, as the binding of the asRNAs leads to codegradation or interferes with translation (Georg and Hess, 2011). Consistent with a codegradation mechanism, we identified 11 mRNA-asRNA pairs with inverse regulation (Table III). Many of these pairs affected the genes for translational machinery, consistent with the down-regulation of translational activity and slower growth under LC. However, some metabolic enzymes were also identified as targets. Thus, in addition to classical protein regulators, such as NdhR, asRNA-mediated effects contribute to cellular acclimation in response to LC. Such a mechanism is e.g. responsible for a delay in the LC-stimulated increase in the mRNA levels for the flavodiiron protein Flv4 (Eisenhut et al., 2012). However, asRNAs have also been implicated in transcriptional regulation through NdhR, because asRNAs overlapping the coding region of the NdhR-regulated gene ndhF3 (sll1732) have been detected previously (Mitschke et al., 2011). The potential role for asRNAs as regulatory factors has been proposed previously (Daley et al., 2012), but the asRNAs examined herein were clearly not Ci regulated. An additional asRNA (sll1730-as1), originally mapped to the adjacent gene sll1730, was also shown to overlap with the 5′ end of the ndhF3 mRNA (Fig. 2). The expression level of this asRNA was not Ci regulated in wild-type cells but, similar to ndhF3, was clearly increased in ∆ndhR under HC. Hence, this asRNA might be involved in the posttranscriptional regulation of ndhF3 though a 21-nucleotide overlap with the mRNA 5′ end. Examples of positively acting asRNAs covering only a part of the 5′ UTR have been reported for Synechocystis 6803 (Sakurai et al., 2012).
Moreover, we also observed several LC-regulated ncRNAs. Among them, CsiR1 was specifically induced after LC shift and was suppressed after transfer to HC (Fig. 1). Interestingly, CsiR1 is transcribed from a region upstream of slr1214. This gene lacks its own promoter, and expression is driven by read through from CsiR1. The gene slr1214 encodes an LC-induced two-component response regulator and has been proposed as a candidate for the regulation of the early response to Ci limitation (Wang et al., 2004). However, this assumption is rather unlikely. Recently, it was shown that the Slr1214 response regulator is involved in phototaxis (Narikawa et al., 2011) and UV-A signaling (Song et al., 2011). In addition to CsiR1, many other sRNAs were also up-regulated upon Ci downshift (e.g. Ncr0700, which is induced through low-light intensities or darkness; Kopf et al., 2014a). In contrast, NsiR4, which is induced under nitrogen limitation (Kopf et al., 2014a), was down-regulated under LC. Similar results were also observed for other nitrogen-regulated genes, likely reflecting changes in the carbon-nitrogen ratio.
It is tempting to speculate that the Ci-regulated changes in the mRNA levels are at least partially mediated via asRNAs or sRNAs. Thus, these ncRNAs introduce an additional level of regulation in LC-shifted cells. With the exception of As1_flv4, which is regulated through cyAbrB (Eisenhut et al., 2012), the transcriptional regulation of sRNAs remains ambiguous. Therefore, we investigated if some of these molecules might also be part of the NdhR regulon, which includes many genes associated with CCM.
Identification of True NdhR Targets through Microarray and Promoter Analyses
To determine whether the regulation via ncRNAs depends on or involves classical regulation through transcription factors, we analyzed the LC response of the mutant ƊndhR, which is defective in the main repressor for LC-regulated genes. Similar to the data of Wang et al. (2004), we observed the up-regulation of 19 protein-coding genes under HC conditions in ƊndhR cells, and the expression of these genes was only induced in wild-type cells after LC shift (Table V). However, only one sRNA (Ncr0210), showing changes in the expression levels under different Ci regimes, was deregulated in ƊndhR cells under HC (Table IV). These data reveal that NdhR primarily acts as a repressor of many LC-induced genes encoding Ci transporters, whereas Ci regulation via ncRNAs is primarily NdhR independent, representing a new and additional mechanism.
Daley et al. (2012) showed that the NdhR repressor is released from the cognate promoters in the absence of 2OG, which was detected at lower levels in wild-type cells at 24 h after the LC shift. A similar decrease in 2OG was measured in a recent comparative analysis of the PII mutant and wild-type cells (Schwarz et al., 2014). However, the kinetics of changes in the relative levels of 2OG and mRNAs of NdhR-regulated genes are different. For example, sbtA gene expression peaked at 3 h after the LC shift (Wang et al., 2004), whereas the 2OG level was almost similar to that of HC cells (Fig. 6). It is likely that we missed rapid 2OG changes potentially occurring immediately after the LC shift or changes in the second corepressor molecule, NADP+ (Daley et al., 2012), which are much faster and responsible for the quick release of NdhR from cognate promoters.
Theoretically, the deregulation of a gene in a microarray data set could reflect direct or indirect effects (i.e. the promoter binding of NdhR or the influence of another regulatory mechanism affected by the absence of NdhR). To distinguish between these possibilities, we reconsidered the promoter-binding motif of NdhR. Global transcriptomics using differential RNA sequencing with Synechocystis 6803 revealed a comprehensive map of TSSs (Mitschke et al., 2011; Kopf et al., 2014a). These data were used to elucidate whether neighboring NdhR-regulated genes were part of an operon. Indeed, many NdhR-regulated genes are transcribed as part of an operon, reducing the number of true NdhR-targeted promoters (Table V). We selected the upstream regions of NdhR-regulated genes, such as ndhR, sbtA, ndhF3, slr2006, and bicA, from Synechocystis 6803 and from related cyanobacteria that have similar gene organization. The promoter analysis revealed a conserved NdhR-binding motif: ATAG-N8-CTAT (Fig. 4). Correspondingly, this motif was only detected upstream of the first genes of NdhR-regulated operons. Fortunately, the subfragments of promoters from NdhR-regulated genes involved in NdhR binding (Figge et al., 2001) or mediating the Ci-dependent regulation of reporter genes (Woodger et al., 2007) have been identified previously. These data, generated via experimental promoter analyses, are consistent with the NdhR-binding motif predicted here, as only promoter fragments containing the predicted motif showed NdhR-binding or NdhR-mediated regulation, whereas all fragments lacking this motif were deregulated (Figge et al., 2001; Woodger et al., 2007). However, the correct function of this regulation depends on the motif position relative to the promoter or even additional sequence elements. For example, although the promoter of bicA (sll0834) contained the described motif, this gene was obviously not Ci regulated in wild-type Synechocystis 6803. In contrast, bicA expression was strongly elevated in ∆ndhR under HC (Fig. 3 and Table V). However, bicA is LC induced and NdhR regulated in Synechococcus sp. PCC 7002 (Woodger et al., 2007). It is tempting to speculate that the missing LC inducibility of bicA in wild-type Synechocystis 6803 might reflect a posttranscriptional mechanism, such as sRNA-mediated degradation. The existence of an additional sequence element for correct NdhR function is further supported by evidence that the NdhR-binding sequence also occurs upstream of genes that are not affected through the ndhR disruption. These genes include fbpI (slr2094), which encodes Fru-1,6-sedoheptulose-1,7-bisphosphatase, and hik9 (slr0210), which encodes a sensor His kinase.
Moreover, the data set revealed additional unexpected findings. For example, the gene cluster slr2006-slr2013, whose expression is obviously completely deregulated in ∆ndhR, was assumed to undergo polycistronic transcription, because all genes were expressed at equal levels and controlled through NdhR (category I, completely deregulated). However, a strong TSS was identified upstream of the third gene (slr2008), and two independent transcriptional units were defined (Kopf et al., 2014a; Table V). Thus, slr2006/slr2007 and slr2008-slr2013 are obviously transcribed as two separate mRNAs, consistent with independent regulation. However, slr2008 and the downstream genes were also completely derepressed in ƊndhR, despite the fact that the NdhR motif is not present upstream of that cluster. Notably, slr2006 is the only gene in which the motif overlapped the -10 element and the TSS. Thus, the absence of NdhR might cause an artificial situation involving the free access of RNA polymerase to an obviously strong promoter. Thus, the up-regulation of the downstream transcript (slr2008-slr2013) might reflect simple read through from the upstream cluster.
Moreover, we present clear evidence that NdhR might have additional functions or work in cooperation with other regulators, as the expression pattern of the genes altered in the ƊndhR mutant could be classified into five different categories (Fig. 3). Thereby, only category I genes showed complete deregulation in ƊndhR, likely reflecting the relative position of the binding motif, which is also unique among all categories (see above). Other genes, such as ndhF3 and sbtA, were only partially derepressed in ƊndhR under HC and showed further increases in the mRNA levels in LC-shifted cells. This finding suggests the involvement of an additional regulator of category II genes. One potential candidate is the protein Sll0822, belonging to the cyAbrB family of transcriptional regulators, which regulates the asRNA As1_flv4 (Eisenhut et al., 2012) and is central to the regulation of carbon and nitrogen metabolism (Ishii and Hihara, 2008; Yamauchi et al., 2011). Indeed, the cyAbrB2 protein acts as a regulator of the expression of ndhF3 and sbtA (Lieman-Hurwitz et al., 2009), which may explain the induction of these genes under LC in the ndhR mutant (Supplemental Table S2). Consistently, these transcripts show a comparable final abundance in long-term LC-adapted wild-type cells and ƊndhR mutants. Of particular interest are genes belonging to categories IV and V, as the deregulation of these genes suggests a role for NdhR as an activator under HC conditions (category IV) or a repressor under LC conditions (category V). The potential repressor activity of NdhR under LC is supported by evidence that cultures of ƊndhR showed growth defects under LC, but not HC, conditions (Supplemental Fig. S3). This growth phenotype suggests a more important role for NdhR under LC conditions, consistent with the metabolic changes discussed below.
The Mutant ƊndhR Is Preacclimated toward LC under HC Conditions
Consistent with the proposed function of NdhR as a major regulator of Ci supply, the main HCO3 −- and CO2-uptake systems are derepressed, at least partially, in the mutant (Table V), indicating a preacclimated state in the ƊndhR strain. Despite the high expression of the Ci transporter in ƊndhR under HC, the Ci affinity of mutant cells was not increased compared with wild-type Synechocystis 6803 under HC (data not shown). However, an elevated Ci affinity has been reported for the ndhR mutant of Synechococcus sp. PCC 7002 under HC conditions (Woodger et al., 2007). Consistent with Wang et al. (2004), we observed that the lack of NdhR-mediated regulation did not lead to the reduced growth of ƊndhR mutants under HC conditions. Largely unchanged metabolome data under HC conditions further indicated that NdhR function is not essentially required under HC conditions. We only observed a slight reduction in the pool sizes of some carbohydrates, which previously showed LC-induced changes in wild-type cells. However, the majority of metabolites and transcripts for the corresponding enzymes were identified at unchanged levels in mutant cells under HC (Supplemental Data Set S2). However, the metabolome data of the short-term response to a sudden LC shift clearly indicated that the successful preacclimation of the ƊndhR mutant also occurred in Synechocystis 6803, consistent with globally delayed metabolic responses to the LC shift (Fig. 5A) and the lack or delay of the photorespiratory burst in the mutant (Fig. 6). The photorespiratory burst is characterized by the rapid and transient accumulation of early toxic intermediates, specifically 2PG, glycolate, and Gly, of the photorespiration cycle in wild-type plants. This transient increase in the pool sizes might reflect the sudden activation of the Rubisco oxygenation reaction before the CCM is fully activated in wild-type cells.
Although the ∆ndhR mutant is successfully preacclimated to Ci-limiting conditions under HC, a growth defect was also observed under long-term LC conditions (Supplemental Fig. S3; Wang et al., 2004). This finding suggests an important function for NdhR under extended LC, rather than a role in the avoidance of short-term damage (e.g. through rapidly increased photorespiration). In addition to the repressor NdhR, CmpR is a transcriptional activator under LC conditions. Similar to NdhR, CmpR belongs to the large LTTR family (Schell, 1993). The cmpABCD operon encoding BCT1 represents the only known target for this protein. The binding of CmpR to the regulatory region is enhanced by the presence of 2PG and RubP (Nishimura et al., 2008). The metabolic photorespiratory burst observed in this study supports the postulated involvement of 2PG in Ci sensing and the regulation of the CCM (Kaplan and Reinhold, 1999; Eisenhut et al., 2008a; Schwarz et al., 2011; Haimovich-Dayan et al., 2014). Specifically, the transient increase of 2PG might induce the expression of the high-affinity HCO3 − transport system encoded by the cmpABCD operon as one of the early acclimation responses to low Ci supply (Omata et al., 1999), while other regulatory processes might act slower. It would be interesting to determine whether CmpR has targets other than the cmp operon in Synechocystis 6803. Assuming more widespread binding of CmpR, this protein might participate in the LC-mediated regulation of the genes in groups II to V in cooperation with NdhR and/or cyAbrB. In contrast to CmpR, NdhR might play a more important role for the long-term fine-tuning of Ci acquisition systems, as these data indicate that 2OG, the metabolite that activates the repressor NdhR (Daley et al., 2012), belongs to the late-decreasing metabolites (i.e. 2OG was significantly reduced at 24 h after LC shift in wild-type and mutant cells).
Taken together, these data indicate that NdhR and additional metabolites, RNA, and protein factors form a regulation network to ensure complex acclimation to LC conditions. In this network, NdhR not only plays a role as a repressor under HC conditions but also has an important regulatory function under LC conditions. Under these substrate-limiting conditions, it is necessary to achieve the finely tuned expression of the CO2 and HCO3 − uptake systems for the optimum balance between acute Ci limitation and the metabolic costs of enhanced Ci acquisition. The growth deficit of ∆ndhR under LC might at least partially explain this function of NdhR and NdhR-dependent processes. Obviously, unchecked gene expression is not beneficial; therefore, an imbalance between invested energy and carbon gain is observed in ∆ndhR mutants under LC conditions, whereas under the optimal growth conditions of HC, this deregulation is better tolerated in the cell.
MATERIALS AND METHODS
Strains and Growth Conditions
The Glc-tolerant strain Synechocystis sp. PCC 6803 was used as the wild type (obtained from N. Murata, National Institute for Basic Biology). Cultures were grown as described before (Schwarz et al., 2011). Briefly, the cells were cultivated under standard conditions in BG11 medium (Rippka et al., 1979) buffered with 20 mm TES-KOH to pH 8 that was sparked with air enriched with 5% (v/v) CO2 at 29°C and continuous illumination at 120 µmol photons m−2 s−1. The mutant Ɗsll1594::Km (hereafter ƊndhR), in which the gene sll1594 is disrupted by the insertion of an aminoglycoside phosphotransferase II (aphII) gene, was obtained from Teruo Ogawa (Biocenter of the University of Nagoya) and grown in kanamycin-supplemented medium (final concentration, 50 µg mL−1). For CO2 shift experiments, cells were precultivated with air enriched with 5% (v/v) CO2 (defined as HC). Then, cells were harvested by centrifugation (5 min at 3,000g and 20°C). The pellet was washed and resuspended in fresh BG11 medium of pH 7 at an optical density at 750 nm (OD750) of 0.8. After 1 h of cultivation under HC, CO2 limitation was set by shifting the exponentially growing cultures to bubbling with ambient air containing 0.040% (v/v) CO2 (defined as LC). For long-term acclimation to HC or LC, cells were cultivated under the defined conditions for 72 h. The suspensions were diluted daily to OD750 = 0.8 by the corresponding medium.
RNA Extraction and Northern Blots
Synechocystis 6803 cells were collected by rapid filtration on hydrophilic polyethersulfone filters (Pall Supor 800 filter; 0.8 µm). Filters with precipitated cells were dissolved in 1 mL of PGTX (Pinto et al., 2009), which has the following composition: 39.6% (w/v) phenol, 7% (v/v) glycerol, 7 mm 8-hydroxyquinoline, 20 mm EDTA, 97.5 mm sodium acetate, 0.8 m guanidine thiocyanate, and 0.48 m guanidine hydrochloride. RNA was extracted as described (Hein et al., 2013). For northern hybridization, RNA was separated on denaturing agarose gels and transferred to Hybond-N+ nylon membranes (Amersham Scientific) by capillary blotting with 20× SSC buffer. The membranes were hybridized with [α-32P]UTP-incorporated single-stranded RNA probes generated by in vitro transcription as described (Steglich et al., 2008). Signals were detected on a Personal Molecular Imager system (Pharos FX; Bio-Rad) and analyzed with Quantity One software (Bio-Rad).
Microarray Hybridization and Evaluation
For the microarray analysis, RNA was extracted from 5 mL of exponentially growing cultures (OD750 of approximately 0.8) harvested by centrifugation (6,000 rpm at 4°C for 10 min). Prior to labeling, 10 µg of total RNA was treated with Turbo DNase (Invitrogen) according to the manufacturer’s protocol and precipitated with ethanol/sodium acetate. Labeling and hybridization were performed as described earlier (Georg et al., 2009) using 3 µg of RNA for direct labeling and 1.65 µg of the labeled RNA for hybridization. The microarray hybridization was performed with two biological replicates for each sampling point (except for the 24-h LC sample of ∆ndhR, for which triplicates were analyzed). Additionally, the array chip used contained technical replicates for each single probe. Moreover, almost all features are covered by several independent probes. Hence, mean values for all probes of a given feature were used for the final calculation of fold changes. Data processing and statistical evaluation were performed using the R software as described previously (Georg et al., 2009).
The full data set is accessible from the Gene Expression Omnibus database with the accession number GSE63352. In Supplemental Tables S1 and S2, features are separated into mRNAs, asRNAs, ncRNAs, 5′ UTRs, and transcripts derived from internal (within coding sequence) TSSs. However, it should be noted that for every category, overlaps are possible (i.e. the annotation as well as the microarray detection of ncRNAs are often ambiguous because they can overlap with UTRs). Thus, all features labeled in Table IV with the systematic prefix NC are referred to as potentially trans-encoded ncRNAs. For the evaluation presented here, only ncRNAs with an annotation based on Mitschke et al. (2011) were considered.
Generation of Reporter Strains and Luciferase Assays
Luciferase expression was measured as bioluminescence emitted by Synechocystis spp. strains carrying transcriptional fusions of the luxAB reporter cassette with the upstream sequence of csiR1. The putative promoter was amplified from genomic DNA using the oligonucleotides PSyR14_AgeI_fw (5′-tgtacaccggtAGGAAATGGGATGTTCCCCCTATC-3′) and PSyR14_FseI_rev (5′-tagaaggccggccCAGTCCCATCCTAGGAAAAATTCC-3′ [the lowercase letters indicate added, noncomplementary sequences containing sites for the restriction enzymes AgeI and FseI {underlined} that were used for cloning]). The corresponding product was fused to luxAB and integrated into the genome of a decanal-producing host strain as described previously (Klähn et al., 2014). Bioluminescence was measured in vivo as total light counts per second from 200 µL of cell suspension using the VICTOR3 multiplate reader (PerkinElmer). Samples were taken from aerated (LC) liquid cultures as well as after CO2 enrichment (5%; HC). The data were normalized to OD750.
Metabolome Analysis
Sampling of cells grown under HC or LC conditions was performed by fast filtration in the light and immediate shock freezing in liquid nitrogen (Schwarz et al., 2011). All experiments were repeated three times using independent cell cultures, of which at least two technical replicate samples per culture and condition were taken and analyzed simultaneously. A metabolite fraction enriched for primary metabolites was profiled, and relative pool size changes were determined as described previously (Schwarz et al., 2014), using the established gas chromatography-electron ionization-time of flight-mass spectrometry profiling platform (Eisenhut et al., 2008a). Profiles were analyzed both in a nontargeted approach using all detectable mass features and in a multitargeted approach using the profile data of annotated metabolites only. The determined amounts of mass features and annotated metabolites were normalized to an internal standard, [d-13C6]sorbitol (CAS 121067-66-1; Sigma-Aldrich), which was added to the extraction solvent and normalized to the amount of cell material using the OD750 of each sample (Huege et al., 2011). Metabolites were annotated manually by match to the retention index and mass spectral reference data of the Golm Metabolome Database (Hummel et al., 2010). Criteria for positive annotation were the presence of at least three specific mass fragments per compound and a retention index deviation of less than 1% (Strehmel et al., 2008). The relative pool size changes of metabolites are expressed by response ratios (i.e. x-fold factors of normalized amounts), comparing all mutant and LC-shifted cells with a single reference condition, namely, the wild type after 24 h at HC.
Metabolite response categories were generated by trend analysis of the wild-type response to the shift from HC to LC. The categories were based on HCA using a Euclidian distance metric and complete linkage. The Ci responsiveness and the deviation of the mutant response compared with wild-type Ci responsiveness (i.e. the ƊndhR responsiveness) of each metabolite were evaluated by two-way ANOVA, Mack-Skillings test, and heteroscedastic Student’s t test. An ICA of all observed mass features and replicates was performed after log10 transformation and based on the first five components of a preceding principal component analysis using the MetaGeneAlyse Web-based tool (http://metagenealyse.mpimp-golm.mpg.de/). All statistical analyses and HCA were performed using log10-transformed response ratios and averaged technical replicates. For the heteroscedastic Student’s t test, Microsoft Excel 2010 was used. HCA and other statistical tests were performed using the multiexperiment viewer software MeV, version 4.9 (Saeed et al., 2003).
Supplemental Data
The following supplemental materials are available.
Supplemental Figure S1. Overlap and additional features of the array design used here (Mitschke et al., 2011) with arrays from Wang et al. (2004) and Eisenhut et al. (2007).
Supplemental Figure S2. Overlap and differences in expression levels for protein encoding genes to Wang et al. (2004) under HC conditions.
Supplemental Figure S3. Genotypic and phenotypic characterization of the Synechocystis 6803 mutant ∆ndhR.
Supplemental Table S1. Complete data set of the transcriptome analysis of wild-type cells of Synechocystis sp. PCC 6803.
Supplemental Table S2. Complete data set of the transcriptome analysis of cells of the Synechocystis sp. PCC 6803 mutant ∆ndhR.
Supplemental Table S3. Antisense-mRNA pairs for which an expression change was observed for the asRNA but not for the corresponding mRNA.
Supplemental Table S4. LC-induced features that are independent from NdhR but whose expression induction appeared delayed.
Supplemental Table S5. Complete data set of the metabolome analysis.
Supplemental Data Set S1. Graphical overview of array signal intensities mapped along the Synechocystis chromosome.
Supplemental Data Set S2. Comprehensive view of metabolic and transcriptional changes in the wild type and a ∆ndhR mutant of Synechocystis 6803 in response to a shift in Ci supply.
ACKNOWLEDGMENTS
We thank Dr. Teruo Ogawa for providing the ƊndhR mutant.
Glossary
- Ci
inorganic carbon
- RubP
ribulose-1,5-bisphosphate
- CCM
carbon-concentrating mechanism
- 2PG
2-phosphoglycolate
- LC
low CO2
- HC
high CO2
- LTTR
LysR-type transcriptional regulator
- 2OG
2-oxoglutarate
- sRNA
small RNA
- ncRNA
non-protein-coding RNA
- asRNA
antisense RNA
- ICA
independent component analysis
- UTR
untranslated region
- OD750
optical density at 750 nm
- HCA
hierarchical cluster analysis
- EMSA
electrophoretic mobility shift assay
LITERATURE CITED
Author notes
This work was supported by the Deutsche Forschungsgemeinschaft (grant no. HA2002/8–3 and Research Unit FOR 1186, PROMICS to J.K. and M.H.) and by the Federal Ministry for Education and Research (CYANOSYS grant no. 0316183 to J.K., W.R.H., and M.H.).
Address correspondence to [email protected].
The author responsible for distribution of materials integral to the findings presented in this article in accordance with the policy described in the Instructions for Authors (www.plantphysiol.org) is: Martin Hagemann ([email protected]).
D.S. and M.H. conceived the original research plans; J.K., W.R.H., and M.H. supervised the experiments; D.S. performed the growth experiments and the sampling; S.K. and J.K.F.M. performed the transcriptomics and promoter analyses; I.O. performed the metabolome analyses; M.H., S.K., W.R.H., and J.K. designed the experiments; S.K. and I.O. performed the integrated data analysis; M.H., S.K., W.R.H., and J.K. conceived the project and wrote the article with contributions of all the authors; M.H. coordinated and complemented the writing.
