


Abstract
To investigate the dynamics of photosynthetic pigment-protein complexes in vascular plants at high resolution in an aqueous environment, membrane-protruding oxygen-evolving complexes (OECs) associated with photosystem II (PSII) on spinach (Spinacia oleracea) grana membranes were examined using contact mode atomic force microscopy. This study represents, to our knowledge, the first use of atomic force microscopy to distinguish the putative large extrinsic loop of Photosystem II CP47 reaction center protein (CP47) from the putative oxygen-evolving enhancer proteins 1, 2, and 3 (PsbO, PsbP, and PsbQ) and large extrinsic loop of Photosystem II CP43 reaction center protein (CP43) in the PSII-OEC extrinsic domains of grana membranes under conditions resulting in the disordered arrangement of PSII-OEC particles. Moreover, we observed uncharacterized membrane particles that, based on their physical characteristics and electrophoretic analysis of the polypeptides associated with the grana samples, are hypothesized to be a domain of photosystem I that protrudes from the stromal face of single thylakoid bilayers. Our results are interpreted in the context of the results of others that were obtained using cryo-electron microscopy (and single particle analysis), negative staining and freeze-fracture electron microscopy, as well as previous atomic force microscopy studies.
Oxygenic photosynthesis supports most life on Earth through the absorption of solar energy, which powers the extraction of electrons from water and the subsequent use of those electrons to convert CO2 into organic compounds (Nelson and Ben-Shem, 2004; Merchant and Sawaya, 2005; Nelson, 2011). The light-dependent reactions of photosynthesis occur within photosynthetic or thylakoid membranes and are catalyzed by two reaction centers, PSI and PSII. Both photosystems have associated light-harvesting complexes (LHCI and LHCII) that act as antenna to efficiently capture light energy. The oxygen-evolving complex (OEC) is an integral component of PSII, catalyzing the extraction of electrons from water. The two photosystems are connected through an intersystem electron transport chain that includes the hydrophobic electron carrier plastoquinone, the membrane-bound cytochrome b 6 f complex (cyt b 6 f), and the mobile electron carrier plastocyanin. The electrochemical gradient generated during light-driven electron flow is used in the synthesis of ATP by the ATP synthase complex. Components of the photosynthetic apparatus vary among photosynthetic organisms and under different environmental conditions, especially for proteins associated with light-harvesting complexes (Liu and Scheuring, 2013). However, investigations of the mechanisms associated with the dynamic acclimation of photosynthetic electron transport and light harvesting to environmental cues require real-time observations that are difficult to achieve because of limitations in our ability to view such changes (e.g. difficulties in tagging proteins with fluorophores and resolving fluorescent images; Zaks et al., 2013).
In vascular plants, thylakoid membranes form a network of interconnected tubular structures enclosing a lumenal space. This membrane system can be divided into two morphologically distinct regions: the grana, which are formed by stacks of appressed membranes; and the stroma lamellae, which are unappressed membranes that form connections between grana stacks. These distinct thylakoid regions are enriched for specific photosynthetic complexes. The major complexes in grana are PSII and LHCII, which can interact and form a variety of PSII-LHCII supercomplexes (Dekker and Boekema, 2005; Kouřil et al., 2012), as well as cyt b 6 f (Johnson et al., 2014). Grana stacks are also the site of water oxidation and oxygen evolution; the Mn4CaO5 cluster is the PSII cofactor that catalyzes this process (Umena et al., 2011). This cluster resides between the transmembrane subunits of the PSII core (formed by PSII proteins D1 and D2 and their associated pigment cofactors, with PSII reaction center proteins CP43 and CP47, α- and β-subunits of cytochrome b559, and PSII reaction center protein I [PsbI]) and the lumenal, peripheral membrane proteins of the OEC. The OEC is composed of extrinsic membrane polypeptides of 33 kD, 23 kD, and 17 kD, designated oxygen-evolving enhancer protein 1, 2, and 3 (PsbO, PsbP, and PsbQ) that protrude into the thylakoid lumen in vascular and nonvascular plants as well as in green algae. Cyanobacteria also have PsbO, with PsbV and PsbU serving as functional analogs of plant PsbP and PsbQ, respectively (Dekker and Boekema, 2005). Based on removal/reconstitution experiments, these subunits have been shown to be critical for PSII stability and oxygen evolution activity (Kuwabara and Murata, 1983; Ljungberg et al., 1983; Ghanotakis et al., 1984). They may also impact the association of Ca2+ and Cl− with PSII, the polypeptide conformation around the manganese cluster, and the formation of channels within PSII that allow access of water to the catalytic site and the exit of protons from the complex as water is oxidized (Bricker et al., 2012).
The x-ray crystal structures of purified PsbP (Kohoutová et al., 2009) and PsbQ (Balsera et al., 2005) from spinach (Spinacia oleracea) have been determined. For cyanobacteria, PSII crystals have been used to establish high-resolution structures for PsbO, PsbV, and PsbU (Umena et al., 2011), with more recent analyses at room temperature (Kern et al., 2013). To study the bound state of these peripheral proteins in spinach, electron density maps were established based on cryo-electron microscopy (cryo-EM) and single particle analysis of purified PSII-LHCII supercomplexes, with structural verification based on the removal of extrinsic polypeptides of the complexes from the membranes (Nield et al., 2002). In these structures, determined at less than 2 nm (or 20 Å) resolution, the PsbP and PsbQ subunits of OEC were assigned to a single membrane protrusion, with a second membrane protrusion assigned to PsbO (Boekema et al., 2000a); these topological structures are the most prominent protruding features of the reaction center-containing membrane protein complexes. Since two PSII reaction centers associate to form a dimeric PSII-LHCII supercomplex (Bumba and Vácha, 2003), the six OEC subunits (two PsbO, two PsbP, and two PsbQ) are visualized as four protrusions associated with each supercomplex. However, after the cyanobacterial PSII core structure was solved (including the positions of the extrinsic subunits) and aligned to the cryo-EM of PSII-LHCII supercomplexes (Nield and Barber, 2006), the structure was reevaluated. The PSII lumenal small protruding mass was assigned to the large extrinsic loop of CP47 (encoded by psbB), while the larger protrusion was assigned to PsbO, PsbP, PsbQ, and the large extrinsic loop associated with CP43 (encoded by psbC).
Attempts have been made to visualize PSII complexes and proteins in their native membrane environment using transmission electron microscopy (TEM) in conjunction with freeze fracture (Johnson et al., 2011) and negative staining of grana membranes from both spinach (Boekema et al., 2000b) and Arabidopsis (Arabidopsis thaliana; Betterle et al., 2009; Wientjes et al., 2013). These techniques provide little information regarding the extent of the protrusion of the polypeptide subunits out of the plane of the membranes. Even though cryo-electron tomography of isolated chloroplasts and plunge-frozen thylakoid membranes (Daum et al., 2010) and grana stacks (Kouřil et al., 2011) can preserve sample hydration using a vitrification process during freezing, it is difficult to determine the height of the extrinsic thylakoid protein protrusions from the membrane surface. Furthermore, at the resolution obtained with these techniques, the small and large protrusions of each PSII monomer may appear merged into a single structure. This would result in the visualization of only two distinguishable topological entities for each PSII-OEC dimer.
The generation of images by atomic force microscopy (AFM), which involves raster scanning by a sharp tip that is in contact with the sample, complements other structural determination methods. The vertical position of the tip is controlled in order to maintain a constant imaging force (balancing interaction forces between the tip and the scanned structure). Control is implemented by a feedback loop that continuously monitors the force with a highly sensitive force sensor that activates a high-precision actuator. Logging the vertical position of the piezoelectric actuator that controls the vertical position of the tip can provide particle height relative to the membrane at high vertical resolution; this is done concurrently with logging the lateral position of each pixel to generate the image (Bippes and Muller, 2011). Probing samples with AFM in air has been employed to image spinach grana membranes (Kirchhoff et al., 2008) to elucidate the arrangement of Arabidopsis PSII-LHCII supercomplexes associated with nonphotochemical quenching (Onoa et al., 2014) and to determine the areal density of Arabidopsis PSII-OEC during the PSII repair cycle (Puthiyaveetil et al., 2014).
Most AFM studies of grana have been performed with membrane surfaces exposed to air. This raises issues concerning the extent to which membrane properties are altered during measurements in a nonaqueous environment (Zaks et al., 2013), where it may be impossible to maintain appropriate hydration and ionic conditions. However, AFM has also been used in aqueous medium to establish high-resolution topography images of membrane proteins (Bippes and Muller, 2011) and specifically to characterize the PSII-OEC, which was previously observed as an ordered array within spinach grana membranes (Sznee et al., 2011). In recent studies, a map of the lumenal surface of grana membranes was generated in aqueous medium that distinguishes cyt b 6 f dimers from PSII-OEC (Johnson et al., 2014). However, the potential of AFM imaging in a liquid environment has not been realized for the high-resolution analysis of features associated with thylakoid membranes and the PSII-OEC dimer. We used contact mode atomic force microscopy (CM-AFM) to (1) image PSII-OEC topology in liquid medium at high resolution, (2) identify other features/particles associated with grana membranes, and (3) optimize the use of AFM for monitoring the dynamics of thylakoid membrane complexes as the conditions of the environment are modulated (e.g. light, specific ions, and temperature).
RESULTS
Characterization of PSII-OEC on Grana Lumenal Surfaces
High-resolution topography images of spinach grana membranes using CM-AFM (e.g. 150 × 150-nm scan size; Fig. 1A) reveal particles that are centrosymmetric: the center of the structure has an inversion center that is also the center of symmetry. At lower resolution (Figs. 2 and 3), the particles appear to have 2-fold rotational symmetry. A topography image of these particles and a corresponding deflection image are presented in Figure 1, A and B. In Figure 1C, the topography image is enhanced in the Z dimension (height) to highlight the protrusion of particles from the planar membrane surface and the inversion symmetry feature of the structure. The elevation of the two features of the monomeric subparticle was determined as a height profile along the red and blue lines between two monomers (red) or within a single monomer (blue) of the dimeric structure, as shown in Figure 1D; quantifications of these height profiles are given in Figure 1, E and F. The average peak height of one feature of the monomer (3.8 ± 0.2 nm; n = 16) is approximately 0.9 nm taller than that of the other feature (2.9 ± 0.3 nm; n = 28), while the maximum height within the particle is 3.9 ± 0.3 nm (n = 34; for details, see “Discussion”). Therefore, on average, we observe a structure that represents a dimer, with each monomer having two distinct protrusion peaks where one peak protrudes further out of the membrane plane than the other. In addition, the distance between the apices across associated monomers is 6.9 ± 1.2 nm (n = 32) and that along an individual monomer is 7.4 ± 1.2 nm (n = 32). In previous studies, Nield et al. (2002) used cryo-EM and single particle analysis to visualize isolated PSII-LHCII supercomplex particles, showing that one feature of the complex (within a monomer) protrudes from the membranes by 0.9 nm more than a second feature. The dimeric configuration of the particles, the topography of the protrusion from the membrane plane, and the distance between the apices of the two prominent features within and between monomers of a dimer indicate that the particles displayed in Figure 1 represent PSII dimers, with the taller and shorter peaks of the particle assigned to protein masses composed of the PsbO/PsbP/PsbQ/CP43 large extrinsic loop and the large extrinsic loop of CP47, respectively. Our analysis is also in accord with a previous study that used jumping mode AFM to examine distances of protrusions within PSII particles (Sznee et al., 2011). In sum, we were able to observe PSII-OEC particles in aqueous immersed grana membrane preparations with enough resolution to distinguish the two major features of a monomer and assign them to specific polypeptides based on the dimeric structure of the PSII-OEC complex, the extent to which polypeptides comprising these features protrude from the plane of the membrane, and previous PSII-OEC structural information.
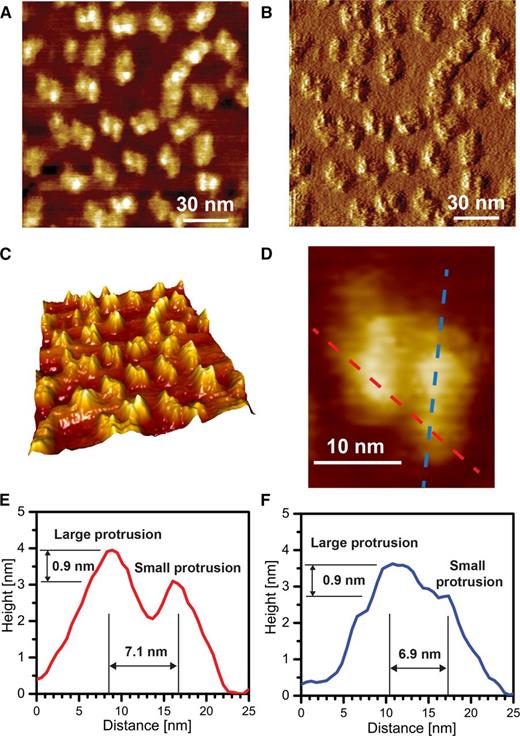
High-resolution CM-AFM images of PSII-OEC dimers in liquid medium. A, Topography image at high resolution. The brightness of the white areas of the image corresponds to the height, allowing for qualitative distinction of the small and large protruding subparticles within PSII-OEC. B, Deflection image of A. C, Three-dimensional (3-D) enhanced image of A. D, Digital enlargement of a PSII-OEC particle. E, Height profile of the PSII-OEC particle in D across two monomers. F, Height profile of the PSII-OEC particle in D along a single monomer. Note that the transects in D are chosen such that they pass the maximum height of the visible protrusions and that the zero level is defined as the minimum height associated with the individual profiles.
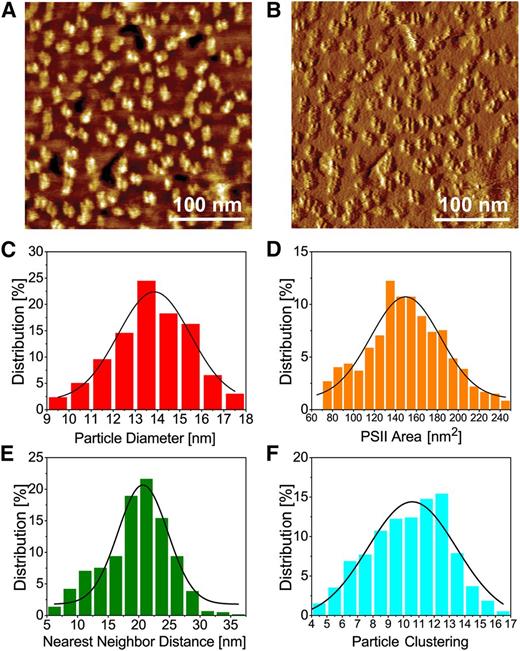
Physical dimensions of PSII-OEC from moderately high-resolution AFM images. A, Topography image. B, Deflection image of A. C to F, Graphs showing the percentage distributions of PSII-OEC particle diameter (C), area (D), nearest neighbor (center-to-center) distance (E), and particle clustering (number of particles within a 50-nm radius of a given particle; F). For statistics, see Supplemental Table S1.
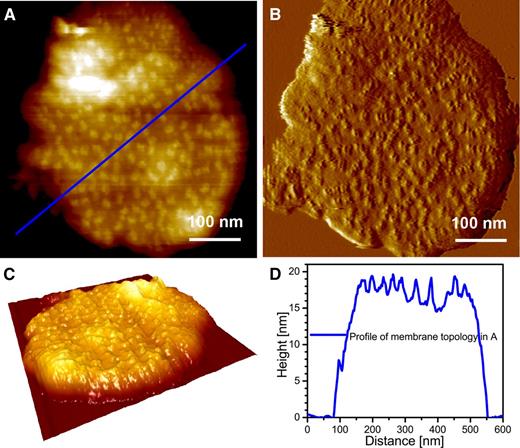
Typical grana membrane. A, Topography image at intermediate resolution. B, Deflection image of A. C, 3-D enhanced image of A. D, Height profile of the membrane topology in A. Note that the height is measured with respect to the mica surface.
We proceeded to use CM-AFM measurements in an aqueous medium to determine the PSII-OEC physical dimensions and their collective organization within grana membranes. We obtained images at moderately high resolution (scan size, 300 × 300 nm; topography image in Fig. 2A and the corresponding deflection image in Fig. 2B) from five different membrane samples and identified particle features using the water-shed algorithm (SPIP software; Image Metrology) with a manual correction. The particle had a diameter of 13.9 ± 1.6 nm and an area of 149 ± 33 nm2, with diameter and area distributions presented in Figure 2, C and D, respectively. These results are in accord with the average diameter and area generated from single-particle reconstructions of PSII-LHCII supercomplexes (Nield et al., 2002), considering that AFM resolution (lateral resolution, 1–2 nm) is limited by the convolution of the tip radius (for details, see “Discussion”). The nearest neighbor distances among particles were determined to be 20.7 ± 4 nm (distribution shown in Fig. 2E), while the particle clustering of PSII-OEC, defined as the number of particles within a 50-nm radius of a given particle (Johnson et al., 2011), was 10.6 ± 2.9 particles (distribution shown in Fig. 2F). The values that we obtained from grana isolated from low-light-maintained spinach leaves (see “Materials and Methods”) for nearest neighbor distances and particle clustering are in agreement with the values obtained using freeze-fracture electron microscopy to analyze chloroplast membranes from dark-adapted spinach (Johnson et al., 2011; Supplemental Table S2). Moreover, the average number of particles covering an area of 300 × 300 nm, determined from five distinct membrane fields, was 120 ± 9. This PSII-OEC particle density may be used to calculate protein percentage areal density as follows. (1) We assumed that each PSII-OEC complex in the images represents a C2S2M PSII-LHCII supercomplex, consisting of two PSII cores, two strongly bound major LHCII trimers, and a moderately bound major LHCII trimer. This supercomplex, the most commonly observed complex in spinach membranes (Boekema et al., 2000b), occupies an area of 540 nm2 (Sznee et al., 2011; for details, see “Discussion”). (2) If the scanned membrane presented in the figure, with an area of 90,000 nm2, was fully packed with PSII-LHCII supercomplexes devoid of lipids (100% protein packing), it would contain 167 PSII-OEC particles. (3) Therefore, 120 ± 9 PSII-OEC particles may correspond to a protein areal packing density of approximately 72 ± 5%. This parameter may also be calculated using the value for the area occupied by other possible supercomplexes (Supplemental Table S3).
Other Features Associated with Grana Membranes
In general, well over 50% of the mica surface is not occupied after it is used for adsorption of grana membranes. In scanned AFM images at low resolution (covering a large area that includes the bare mica surface and several adsorbed membrane fragments), the mica surface was the most frequently detected feature. In this case, the mica height can be used as a zero reference height level (an example of pixel height distribution is shown in Supplemental Fig. S1). In those images, the majority of the grana fragments had a single height level, as shown in the topography image in Figure 3A, with the corresponding deflection image in Figure 3B; these membrane fragments are composed almost entirely of double membranes. In Figure 3C, the topography image is enhanced in the Z dimension (height) to highlight the single height level of the membrane relative to the planar mica surface. A representative height profile, which is generated along a transect represented by the blue line in Figure 3A, is presented in Figure 3D.
Although infrequent, we also observed two height levels among the membrane fragments adsorbed to the mica surface, with some membrane surfaces containing PSII-OEC particles and others containing particles likely to be on stroma-exposed surfaces of the thylakoid membranes. Examples of these membrane regions can be viewed in Figure 4A (height image) and Figure 4B (deflection image). The 3-D enhanced topography of the membrane fragments shown in Figure 4C illustrates the various membrane heights. A digital enlargement of two membrane regions that differ in their heights, delimited by dashed-line boxes in Figure 4A, is presented in Figure 4, D and E. Regions with different membrane heights are marked by the red and blue lines, with the heights along these lines quantified; the membrane height of one membrane region (red line) is approximately half of that of the other region (blue line), as shown by the height profiles presented in Figure 4F. Furthermore, these regions exhibit differences in the heights and sizes of the particles that they contain. The region of the membrane presented in Figure 4E is rich in particles that represent PSII-OEC, with the blue line traversing six particles, each having a diameter of 10 to 15 nm and a height of 3.5 to 4.2 nm. In contrast, the red line in Figure 4D traverses six particles that each have a diameter of 8 to 12 nm and appear to protrude 2.5 to 3.5 nm from the membrane surface. These particles are considered novel and have not been observed previously by AFM of spinach grana membranes maintained in an aqueous medium. They could represent the protein mass of the PsaC/D/E subunits of PSI that protrude from the stromal side of stroma lamella, because the height of the PSI protrusion from the membrane surface was shown previously to be approximately 3.5 nm (Fotiadis et al., 1998; for details, see Supplemental Fig. S2). Furthermore, based on the analysis of membrane polypeptides resolved by SDS-PAGE coupled with the immunodetection of specific subunits of the photosynthetic complexes (Supplemental Fig. S3), there is a low level of PSI in the grana membrane fractions used for AFM analysis. It is difficult to determine an accurate height and particle dimension from Figure 4, A and B. The limitations include inadequate resolution of the physically acquired image and the high density of particles on small regions of the membranes (limited sample size) that can become partially wrinkled as they are adsorbed to the mica surface.
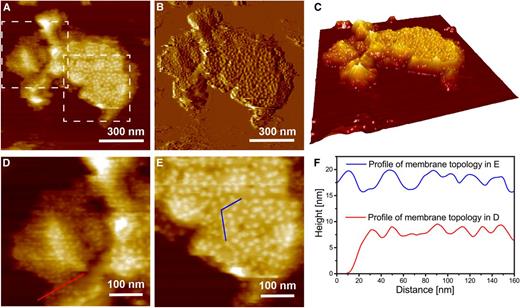
Identification of novel particles associated with single membranes. A, Topography image at intermediate resolution. B, Deflection image of A. C, 3-D enhanced image of A. D and E, Digital enlargements of regions in A, highlighted by dashed-line boxes and enriched in either the novel particles (left box) or PSII-OEC particles (right box). F, Comparison of the height profiles of membrane topology associated with the novel particles in D and the PSII-OEC particles in E. Note that the transects in D and E are chosen so that they pass the maximum height of the visible protrusions and that the height is measured with respect to the mica surface.
On other occasions, we identified two single membrane regions with different topologies. Topography and corresponding deflection images, shown in Figure 5, A and B, reveal segments of the membranes with two different heights. The 3-D enhanced topography image of the membrane fragments, shown in Figure 5C, highlights single membrane regions that either contain the novel particles (red arrow) or that appear flat (no apparent protruding particles; gray arrow). Most of this membrane fragment represents the extensively characterized double membranes containing PSII-OEC particles. Both of the single membrane regions are delimited by dashed-line boxes in Figure 5A, which were then digitally enlarged and presented in Figure 5, D and E. Representative height profiles shown in Figure 5F reveal two membrane regions of markedly different features; one region (double membrane region, in blue; Fig. 5A) is approximately twice the height of the other two (single membrane regions, in red and gray; Fig. 5, D and E), similar to Figure 5F. In addition, the membrane topology along the red profile is more corrugated than that along the gray profile, which appears flat, although there is waviness/wrinkling associated with this region of the membrane that covers lengths of 100 to 150 nm.
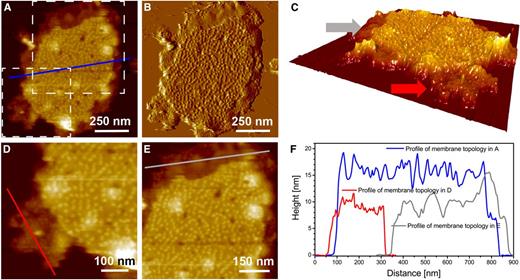
Characterization of single membrane region-associated novel particles along with the flat region of a single membrane. A, Topography image at intermediate resolution. B, Deflection image of A. C, 3-D enhanced image of A. D and E, Digital enlargements of the regions of single membranes in A that are highlighted by dashed-line boxes. One region is enriched in novel particles (bottom box), and the other has very flat membrane surfaces (top box). F, Comparison of the height profiles of membrane topology in A, with membrane topology associated with novel particles in D and with the flat region of the single membrane in E. Note that the height is measured with respect to the mica surface.
Interestingly, the CM-AFM topography image of the membrane sample presented in Figure 6A, with its corresponding deflection image in Figure 6B, reveals two distinct membrane fragments containing PSII-OEC particles on their surfaces, with the overall heights of these membrane fragments being slightly different. Height profiles along the blue and red lines of Figure 6A suggest that these membranes are similar to those presented along the blue (double membrane) and red (single membrane) profiles of Figures 4F and 5F. In Figure 6, A and C, the red line is shown to cross the lowest height level, which represents two membrane fragments with an apparent separation between them (where the height drops to zero; the mica surface). The third membrane height (designated profile 2 in green) is slightly shorter than the height of the membranes of profile 3 (blue) but has a surface topology that suggests the presence of the PSII-OEC particles, similar to that of profile 3. The differences in the membrane heights among the three profiles and specific particle populations of the various membrane fragments prompted us to examine the maximum height of particles at each membrane height level (levels corresponding to profiles 1, 2, and 3 in Fig. 6A) relative to the level of the reference mica (the rationale for this height determination is given in Supplemental Fig. S1B). Figure 6, D to F, quantifies maximum membrane heights associated with the different membrane regions. The maximum height of membrane level 1, which contains the novel particles (potentially PSI; see “Discussion”), is 9.7 ± 1.4 nm (Fig. 6D), while the maximum heights of the PSII-OEC-containing membranes depicted as levels 2 and 3 are 16.5 ± 0.7 nm (Fig. 6E) and 18.9 ± 1 nm (Fig. 6F), respectively.
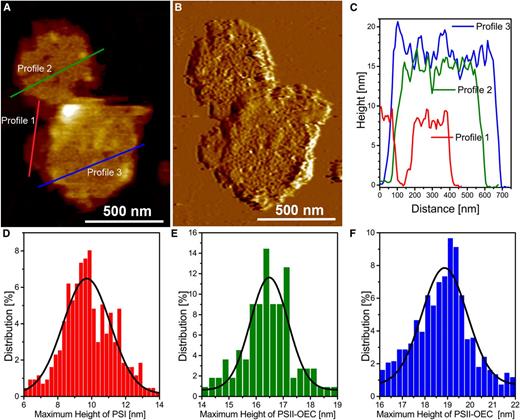
Height levels associated with grana membranes. A, Topography image at intermediate resolution of two membrane fragments from grana membrane preparations with three different height levels. B, Deflection image of A. C, Three membrane height profiles (profiles 1, 2, and 3) from the topography image of A. Note that the height is measured with respect to the mica surface. D to F, Graphs showing percentage distributions of particle maximum vertical heights from membranes with height levels 1 (D), 2 (E), and 3 (F), with respect to the reference mica height. For statistics, see Supplemental Table S1.
DISCUSSION
The sensitivity of AFM measurements has allowed us to distinguish protein masses associated with the PsbO/PsbP/PsbQ/CP43 large extrinsic loop and the large extrinsic loop of CP47 of the PSII-OEC complex in aqueous medium. This approach complements x-ray crystallography and TEM studies (Liu and Scheuring, 2013). AFM technology provides a high signal-to-noise ratio, which reduces the number of particle images needed to reconstruct the topology of the molecules examined. Features of the PSII-OEC complex generated by CM-AFM and illustrated in Figure 1D yield a protein conformation similar to the reconstruction generated using cryo-transmission electron microscopy (cryo-TEM) and single particle analysis (Nield et al., 2002), as shown in Supplemental Figure S4A. Our reported distances between peaks of the small and large protrusions across two PSII-OEC monomers (within the dimeric structure) of 6.9 ± 1.2 nm and along an individual monomer of 7.4 ± 1.2 nm are somewhat larger than the corresponding values obtained by cryo-TEM measurements, which are 6 to 6.3 nm and 6.5 to 6.7 nm, respectively (shown in Supplemental Fig. S4A). These slight distance differences could be the consequence of small structural fluctuations associated with room temperature measurements. However, both techniques show the same trend with similar distances: the distance between peaks along a single PSII-OEC monomer is greater than the distance between peaks across associated monomers.
Despite the high signal-to-noise features of AFM, this technique suffers from certain limitations. The AFM tip convolution can affect the determination of the average PSII-OEC diameter and area, resulting in a discrepancy between AFM observations and cryo-TEM reconstructions. The PSII-OEC area is 83 nm2 (Supplemental Fig. S4A) as determined by cryo-TEM reconstructions (Nield et al., 2002). If we approximate the PSII-OEC shape as a circle, using this area gives an average diameter of 10.3 nm. This value is approximately 3.6 nm smaller than the 13.9 nm average diameter determined by AFM (Fig. 2C), a difference that may reflect convolution error. According to the geometrical model for circumferential structure as described by Canet-Ferrer et al. (2014), the AFM tip contact point is defined as the point at which a part of the pyramidal tip (either the round end or the flat region) first touches the object during the raster scanning. Considering the configuration of our tip and the protein geometry (nominal tip radius = 2 nm, nominal tip-to-face angle = 15°, and PSII-OEC average height = 3.9 nm), the contact point should occur above the tip’s round end, making the first contact on the side of the tip. The potential error in diameter measurements resulting from convolution error is calculated to be 5 nm. Our deduced 3.6-nm convolution error (derived by comparing our measurement with the cryo-TEM value), which is less than the calculated convolution error, suggests that the tip we used could have a radius of less than 2 nm. The tip radius can significantly impact the feature-resolving capabilities of the AFM system (Supplemental Fig. S5), especially when imaging very small objects at high resolution. AFM tip radius variation represents a common uncertainty associated with manufacturing processes. Even though the nominal tip radius that we used was 2 nm, the maximum tip radius could be up to 12 nm, as specified by the manufacturer. However, the tip radius can also be less than 2 nm, and given our deduced convolution error, we calculated the tip radius to be approximately 1 nm, taking the nominal tip-to-face angle and the PSII-OEC average height as constants.
Based on our analyses, PSII-OEC exhibits a centrosymmetric configuration. The percentage of particles that clearly exhibit this feature is always greater than 16.67% (random chance), and when disordered and low-density PSII-OEC particles are imaged at high resolution (scan field ≤ 150 nm), between 30% and 50% are clearly visualized as centrosymmetric. Our analyses also identified three peak heights associated with the lumen-exposed PSII-OEC: (1) 3.8 ± 0.2 nm assigned to the PsbO/PsbP/PsbQ/CP43 large extrinsic loop; (2) 3 ± 0.2 nm assigned to the large extrinsic loop of CP47; and (3) an overall (average) peak height of the entire PSII-OEC particle of 3.9 ± 0.3 nm. These heights were determined from high-resolution images taken from membrane samples chosen to be flat (no apparent wrinkling of the sample upon application to the mica surface). To acquire the most accurate height measurements, the local minimum for each particle/subparticle was quantified based on local minima measurements at the perimeter of that entity. This approach individualizes the reference basal plane for each entity being evaluated and ensures that the maximum-height pixel within the boundary minima is selected prior to subtracting the basal plane height.
The difference that we observe in peak heights of the small and large PSII-OEC protrusions is in agreement with previous cryo-TEM results from Nield et al. (2002). However, the composition of these protrusions in grana membranes from plants and algae is not completely resolved. The precise locations of PsbP and PsbQ are still uncertain (Ido et al., 2014; Mummadisetti et al., 2014) because only cyanobacterial PSII-OEC crystal structures have been solved (Zouni et al., 2001; Kamiya and Shen, 2003; Ferreira et al., 2004; Loll et al., 2005; Umena et al., 2011; Kern et al., 2013, 2014; Kupitz et al., 2014, Suga et al., 2015) and they do not have the PsbP and PsbQ proteins. PsbO is conserved among cyanobacteria, algae, and plants, and its position within PSII-OEC is more certain (Nield and Barber, 2006). Systematic removal/reconstitution of PsbO, PsbP, and PsbQ from plant grana membranes in situ, coupled with high-resolution CM-AFM characterizations of PSII-OEC complexes, may provide experimental support for topological assignments of the various OEC subunits, although this approach is sure to be challenging.
The PSII-OEC peak height that we determined is slightly less than that of Sznee et al. (2011; 4.5–5 nm), comparable to that of Johnson et al. (2014; 4 ± 0.1 nm), and slightly higher than that of Stoichev et al. (2015; 2.97 ± 0.34 nm). The similarity of our height measurements with those of Johnson et al. (2014), which are slightly more than those of Stoichev et al. (2015), suggests that the tip force that we applied was unlikely to create compression. The height variations observed among the studies might exist in vivo, as suggested by Kouřil et al. (2011). However, it is also possible that differences in isolation protocols, sample conditions prior to imaging, and imaging modes result in differences in observed PSII-OEC heights, which might also reflect the different PSII-OEC patterns within the membrane matrix. In previous work, PSII-OEC topology of spinach grana membranes isolated following n-dodecyl-α,d-maltoside (α-DM) solubilization was evaluated using jumping mode (Sznee et al., 2011) and peak-force tapping mode (Johnson et al., 2014). Sznee et al. (2011) isolated membrane samples at 4°C and incubated the samples at that temperature overnight. The PSII-OEC particles in these preparations exhibited a semicrystalline arrangement. Moderately high-resolution CM-AFM images of pea (Pisum sativum) grana membranes isolated using the Berthold-Babcock-Yocum procedure (Triton X-100 detergent; Berthold et al., 1981; Stoichev et al., 2015), with samples incubated at room temperature for 0.5 to 1 h prior to imaging, exhibited a disordered PSII-OEC particle arrangement, as was observed in our work. A disordered PSII-OEC arrangement was also observed in grana isolated from α-DM-solubilized membranes (Johnson et al., 2014).
Differences in the observed heights and PSII-OEC features in this work compared with that of Sznee et al. (2011) may also reflect differences in the phase/structure of densely packed PSII-OEC complexes. Schneider and Geissler (2013) provided a nanoscale computation model and a phase diagram that suggests the coexistence of two phases/configurations of the grana membrane PSII-LHCII complexes (fluid/disordered phase and crystalline phase). With the assumption that the ratio of LHCII to PSII-OEC is similar within grana membranes isolated in the various studies, the factor that can highly impact the configuration of the complex in the membranes would be the protein percentage areal density (closely equivalent to the packing fraction in Schneider and Geissler, 2013). We used the C2S2M complex to determine the areal density. The 540-nm2 value, as estimated by Sznee et al. (2011), represents an average of the area determined for purified complexes (Caffarri et al., 2009) and those complexes present in highly ordered grana membranes (Boekema et al., 2000b). The protein percentage areal density was estimated to be approximately 95% by Sznee et al. (2011) for the semicrystalline regions of PSII-OEC, while for the disordered PSII-OEC arrangement in our grana preparations, it was estimated to be approximately 72% ± 5%. This might be partially explained by the finding that the density of PSII-OEC in the semicrystalline regions observed by Sznee et al. (2011) is higher (1,500–1,800 particles µm−2) than that observed in our work (1,200–1,400 particles µm−2). It is possible that these different membrane-particle configurations (crystalline versus disordered fluid phase) and packing densities impact not only the planar dimensions of PSII-OEC but also the vertical dimension, which would be reflected as a change in particle height (e.g. potentially greater protrusion at higher packing densities). In the centrosymmetric PSII-OEC complexes that we observe, each monomer has a small protruding mass that has been assigned to the CP47 large extrinsic loop. CP47 consists primarily of six transmembrane helices. These helices may experience more lateral compression when the membranes are in the crystalline phase, which would increase the protrusion height. The larger subparticle of PSII-OEC, consisting of the PsbO/PsbQ/PsbP/CP43 external loop, may not be impacted as much by phase differences, since the external loop of the integral membrane CP43 does not constitute the majority mass of the subparticle (mostly composed of extrinsic OEC polypeptides). This could be one reason why Sznee et al. (2011) were unable to distinguish two distinct height features in the PSII-OEC monomers. Variations in particle heights among the different samples are also supported by the identification of a protruding mass positioned to the side of PSII-OEC in the membrane samples of Sznee et al. (2011). The dependence of height on phase density has been observed in soft biological material such as lipid bilayers. Recently, it was found that the height (5.3 ± 0.4 nm) and stiffness of lipids in a high-density gel phase can be greater than the height (4.1 ± 0.2 nm) and stiffness in a low-density fluid phase (Picas et al., 2012). Therefore, the density of the lipid bilayer may also impact membrane dimensions, including height, as well as the disposition of proteins in the membranes.
Grana membranes are often not organized into semicrystalline arrays, although this configuration has been most frequently used to determine the features and types of PSII-LHCII supercomplexes in the grana (Kouřil et al., 2012). In most of the TEM work that has used negative staining of plant grana membranes, with both wild-type and LHCII mutant plants, only approximately 10% (or less) of the grana membrane area imaged showed an ordered arrangement (Yakushevska et al., 2001, 2003; Ruban et al., 2003; Kovács et al., 2006; de Bianchi et al., 2008; Betterle et al., 2009; Damkjaer et al., 2009; Kereïche et al., 2010). In these previous studies, the grana membranes were isolated after treatment with the mild detergent α-DM (membranes were not incubated at 4°C overnight before imaging) and were found to almost exclusively contain PSII and LHCII (no cyt b 6 f complex). The grana membranes can also be isolated following digitonin solubilization or sonication. In such cases, the proteins present in the membranes include those of PSII, LHCII, and cyt b 6 f (Johnson et al., 2014), a membrane composition closer to that of the situation in vivo. Recently, grana membranes were isolated from plants grown under various light conditions following digitonin treatment and were then negatively stained and imaged using TEM; in this case, less than 10% of the membrane area was in a crystalline arrangement (Kouřil et al., 2013). In addition, numerous freeze-etch and freeze-fracture electron microscopy studies of chloroplast membranes from wild-type plants indicate that, although PSII complexes have a tendency to form ordered domains, noncrystalline domains appear to dominate (Staehelin et al., 1976). Therefore, grana isolation following α-DM or digitonin solubilization yields a mixture of ordered and disordered phases, which likely reflects the in vivo situation; both phases coexist, although the disordered phase is more prevalent.
AFM imaging of grana membranes enabled us to determine the areal particle density, map positions of individual particles (Fig. 2, A and B), and compare these values with those obtained by TEM of negatively stained grana membranes (Betterle et al., 2009) or freeze-fracture chloroplast membranes (Johnson et al., 2011). As mentioned above, the PSII-OEC particle density is readily determined, although it is not the overall protein density per se. We have determined protein areal packing density in the grana membranes (0.72 ± 0.05) using AFM measurements and knowledge of the PSII-LHCII supercomplex structure (C2S2M for spinach; Boekema et al., 2000b). However, in low-light-acclimated plants, there might be free or loosely bound major LHCII trimers in the membranes as well. Considering this possibility, the estimated protein areal packing density agrees with the 0.7 to 0.8 value estimated in a previous study (Kirchhoff, 2014); this value makes photosynthetic membranes one of the most densely packed (with proteins) biological membranes in nature. Nearest neighbor distances and clustering of PSII-OEC particles (Fig. 2, E and F) can also provide information about the quenching state of PSII. Differences in these parameters are observed for thylakoid membranes from chloroplasts isolated from dark-adapted leaves devoid of zeaxanthin and antheraxanthin (nonquenching) and preilluminated leaves with elevated zeaxanthin (quenching) by imaging freeze-fractured material (Johnson et al., 2011). The spinach leaves that we were using were maintained in very low light (less than 5 µmol photons m−2 s−1, at 4°C overnight), and the determined parameters appear to be equivalent to dark-adapted leaves (Supplemental Table S1). Although still uncertain, it may also ultimately be possible to use the features and distribution of PSII-OEC particles to determine the extent of energy-dependent feedback deexcitation quenching (Ruban, 2015) and of quenching generated by a state transition (Minagawa, 2013) in real time. This could be approached through the use of a recently developed high-speed AFM (Ando et al., 2014) to monitor the positions and features of PSII-OEC particles on photosynthetic membranes deposited on fabricated nanostructures (Gonçalves et al., 2006).
We sometimes observed particles in grana preparations with different characteristics from those of PSII-OEC (Figs. 4 and 5). These particles, associated with single lipid bilayers, do not exist as dimers, protrude less from the bilayer, and occupy less membrane area than PSII-OEC (Figs. 4F and 5F). We hypothesize that these particles represent PSI protrusions (subunits PsaC/PsaD/PsaE) from the stromal side of stroma lamella. This interpretation is suggested by a number of observations. First, based on immunological analyses, we observed a low level of PSI/LHCI in the fraction enriched in PSII/LHCII that was used for AFM analysis (Supplemental Fig. S3). Second, the lateral spacing (center-to-center distance) between these particles is approximately 15 nm (Fig. 4F), which accommodates the membrane area required for PSI occupancy (Supplemental Fig. S2A). This spacing is also close to the 15.4-nm distance observed between PSI particles that were reinserted into a lipid bilayer (Supplemental Fig. S2B; Fotiadis et al., 1998). However, inadequate resolution of the physically acquired images and the high density of these particles in wrinkled membrane areas made it difficult to obtain accurate information on particle diameter and height. To determine particle lateral dimensions with greater precision, we used the tapping mode on flat single membrane fragments (membranes with a minimum of wrinkling) to generate phase images (Supplemental Fig. S6, A and B). The single membrane fragment used in this analysis (Supplemental Fig. S6C) is enriched in putative PSI particles. It was imaged using moderately high resolution, which yielded a diameter of 10.8 ± 1.1 nm and an area of 94 ± 21 nm2 (Supplemental Fig. S6, E and F). Phase images from the tapping mode report local material elasticity (Melcher et al., 2009) and, therefore, more clearly distinguish protruding proteins, membranes, and mica surface. Close to the approximated heights in Figure 4F, a particle height of approximately 3 to 3.6 nm (Supplemental Fig. S6, G–I) was also estimated from the topography image, with a physical scan size of approximately 160 nm generated by tapping mode. This height agrees with the PsaC/D/E stromal protrusion height of 3.5 ± 0.2 nm (Fotiadis et al., 1998). Finally, we never observe PSII-OEC in single membranes present in the grana preparations by negative staining and TEM (Dekker and Boekema, 2005). Even though TEM does not provide information on the surface topography, it does reveal the features of all protein complexes (e.g. dimeric feature of PSII) and their densities in the membranes.
Based on the observation of tiered membrane heights and features of the particles associated with each tier, we constructed a simplified height model. First, we assigned the PSII-OEC particle height to the lumenal protrusion of grana (double) membranes and PSI protrusion particle height to the stromal protrusion of stromal lamella (single) membranes. These heights are 3.9 and 3.5 nm, respectively, relative to the membrane surface. The membrane height is taken as 4 nm, as determined previously (Simidjiev et al., 2000; Kirchhoff et al., 2011). The stromal gap between lower and upper appressed membranes can vary and has been found in the range of 3.2 to 4 nm (Kirchhoff et al., 2011). Second, as shown in Figure 7A (3-D enhanced topography image of Fig. 6A), the three different membrane height levels were modeled from the shortest (1) to the tallest (3), as shown in Figure 7B. In level 1, the single stroma lamella membrane enriched in PSI and LHCI is adsorbed on the mica, with PSI protruding from the stromal (upper) surface. In levels 2 and 3, both harboring surface-exposed PSII-OEC, a second lipid bilayer is stacked upon the bilayer that contacts the mica, with the two membranes making contact on their stromal surfaces. Both single and double membranes adsorb to the mica surface by a combination of electrostatic and van der Waals interactions (Müller et al., 1997). For double membranes, the membrane layers maintain contact by electrostatic interaction (Daum et al., 2010; Schneider and Geissler, 2013; Wan et al., 2014), with the negative charges of the LHCII trimers of both the upper and lower appressed membranes screened by associated cations (e.g. Mg2+; Standfuss et al., 2005; Wan et al., 2014).

According to this model, in level 1, the predicted height (7.5 nm) is lower than the measured maximum height of the particles relative to mica (9.7 ± 1.4 nm; Fig. 6D). However, the single membrane regions harboring the particles shown here are still wrinkled, which can cause nanometer scale inaccuracies (Figs. 4D and 5D) in the measurement. This predicted height is also lower than the height of the less-corrugated region of the single membrane (Fig. 5, E and F). The region is expected to represent the inverted configuration of level 1 (PSI protrusion contacting the mica surface), which is connected to the upper appressed membrane. This region is also distorted, as apparent from the 100- to 150-nm waves associated with the height profile (Fig. 5F). These observations suggest that it is difficult to establish undistorted associations between the single membranes present in grana preparations and the mica surface, which compromises the accuracy of determining the physical features of particles within those membranes. For double (grana) membranes, the maximum particle heights (with respect to the mica surface) of the upper appressed membranes observed in this study (18.9 ± 1 nm; Fig. 6F, level 3) can generally be predicted based on the model of Dekker and Boekema (2005). We also sometimes (on the order of 10% of the total membrane area) observe a maximum membrane-particle height with respect to the mica surface of 16.5 ± 0.7 nm (Fig. 6E; profile 2 in Fig. 6, A and C, and height level 2 in Fig. 7A), which is lower than the height predicted by the model by 1.5 to 2.5 nm. The surface features of the membranes at this height level suggest the presence of PSII-OEC particles, indicating exposure of the lumenal thylakoid surface. Even though the difference between height levels 2 and 3 appears significant (Student’s t test for unequal sd; P < 0.01), to attain the former would require a contraction of the stromal gap to approximately 0.7 nm, which is smaller than any stromal gap observed in thin sections of chloroplast membranes (Dekker and Boekema, 2005). A potentially contracted stromal gap might cause reduced diffusion rates of both small water-soluble molecules and proteins and potentially impact various processes critical for maintaining membrane function, including the repair of damaged PSII reaction centers as a consequence of photoinhibition (Yokthongwattana and Melis, 2006). In contrast, a stromal gap of 3.2 to 4 nm would be expected from the more commonly observed height level 3. This gap width agrees with results from high-resolution TEM of vitreous spinach membranes (Daum et al., 2010) and sections through Arabidopsis thylakoids (Kirchhoff et al., 2011). Variations in the stromal gap could depend on the light conditions (Kirchhoff et al., 2011), although the physical mechanism by which it is modulated remains unknown. The shrinkage of the stromal gap may originate from α-DM treatment, which in some instances can cause changes in membrane permeability and an increase in the Mg2+ (present in isolation buffer) concentration in the stromal compartment (separates the appressed membrane layers). In addition, observed pores in the membranes, which appear more prominent in level 2 membranes (although not quantified), could contribute to ion leakage and stromal gap compression. It is also possible that variations in the gap involve local membrane-protein phase states. The frequency at which the larger stromal gap is deduced (based on level 3 height) suggests that significant shrinkage of the gap may not be common in vivo. However, the presence of the level 2 fragments is worth mentioning, because enhanced attraction between two appressed membrane layers may impede the movement of the complexes within the lipid bilayer. Therefore, the membrane height level of PSII-OEC should be measured so that the dynamics of the complexes associated with these different membrane arrangements can be evaluated.
CONCLUSION
We have demonstrated the potential to perform AFM imaging of vascular plant photosynthetic membranes immersed in an aqueous medium; this technique has allowed us to distinguish small and large protruding proteins within PSII-OEC, stromal protruding domains of PSI on single membranes, and interactions between appressed thylakoid membranes. These analyses can provide information concerning the collective organization of complexes on plant photosynthetic membranes. This approach represents a step toward exploring membrane dynamics and evaluating potential conformational changes associated with integral membrane protein complexes in real time as environmental conditions fluctuate. External stimuli include light levels, temperature, and the presence of artificial electron donors/acceptors. Monitoring the dynamics of plant photosynthetic complexes in response to such external stimuli will provide molecular details about transformations associated with processes such as energy-dependent quenching of absorbed excitation energy, state transitions, and large-scale modulation of photosynthetic architecture.
MATERIALS AND METHODS
Membrane Isolation
The procedure for isolating grana membranes was modified from those reported previously (Robinson and Yocum, 1980; van Roon et al., 2000; Morosinotto et al., 2010) and was performed at 4°C in the dark. Market spinach (Spinacia oleracea) was stored at 4°C in a translucent white plastic bag in low white light overnight prior to use. Petioles were removed, and 40 g of depetiolated leaves were homogenized in a medium (100 mL) containing 20 mm Tricine (pH 8), 400 mm NaCl, 2 mm MgCl2, and 0.2% (w/v) bovine serum albumin. The homogenate was filtered through four layers of cheesecloth and centrifuged at 300g for 1 min to remove debris. Chloroplasts in the supernatant were pelleted by centrifugation at 4,000g for 10 min and washed by resuspension in a medium containing 20 mm Tricine (pH 8), 150 mm NaCl, 5 mm MgCl2, and 0.2% (w/v) bovine serum albumin. The resuspended chloroplasts were pelleted again at 4,000g for 10 min, the pellet was suspended in 20 mm HEPES buffer (pH 7.5), 150 mm NaCl, and 5 mm MgCl2 in the presence of 0.5 mm phenylmethanesulfonyl fluoride, 1 mm benzamidine, and 4 mm α-aminocaproic acid (these protease inhibitors were maintained in the preparation until chromatography by FPLC; see below), the suspension was repelleted again at 4,000g for 10 min, and the chloroplasts were then osmotically lysed by resuspending them in 20 mm HEPES (pH 7.5), 15 mm NaCl, and 5 mm MgCl2 (the lower salt concentration). The chlorophyll concentration of the lysate was measured by the method of Porra et al. (1989), and chlorophyll levels were adjusted to 1 mg mL−1 by pelleting the membranes (4,000g for 10 min) and resuspending them in the appropriate volume of the same low-salt buffer. Thylakoid membranes were partially solubilized by slow rocking on a shaker (1 rpm) in 0.63% (w/v) α-DM, 20 mm HEPES (pH 7.5), 15 mm NaCl, and 5 mm MgCl2 for 20 min at 4°C. Material not solubilized was pelleted by centrifugation (3,500g for 5 min), while partially solubilized thylakoids were filtered through a 0.45-µm filter and fractionated using a GE Healthcare AKTA FPLC system with a Superdex 200 HR 10/300 column (GE Healthcare). Fractionation was in an eluent composed of 20 mm HEPES (pH 7.5), 15 mm NaCl, 5 mm MgCl2, and 0.03% (w/v) α-DM, with a rate of elution of approximately 0.25 mL min−1. The absorbance of the eluate was monitored at 405 nm, and the absorbance peaks after approximately 0.3 column volume (void volume of the column) were collected. The fraction in the middle of the first absorbance peak was used for AFM analysis. Proteins in each fraction were also resolved by SDS-PAGE, and specific proteins were immunologically detected (Heinnickel et al., 2013) to establish the identities of the major thylakoid complexes in the different fractions (Supplemental Fig. S3).
CM-AFM
Grana membranes were imaged by AFM within 1 h of their isolation. A total of 10 µL of the membrane sample was loaded in the liquid cell assembly onto freshly cleaved mica substrate in 200 µL of adsorption buffer (10 mm HEPES [pH 7.5], 150 mm KCl, and 25 mm MgCl2) and then incubated at 4°C in the dark for 30 min to ensure membrane absorption (a fully equipped liquid cell assembly is shown in Supplemental Fig. S5A). After washing the mica surface with imaging buffer (10 mm HEPES [pH 7.5], 260 mm KCl, and 5 mm MgCl2), AFM imaging was performed by contact mode using an Agilent 5500 microscope (Agilent Technologies) that was seated inside a custom-made vibration isolation chamber (Supplemental Fig. S5B) that has a small scanner (11 × 11 µm2) fitted to an infrared laser source. This AFM device is equipped with PicoView as its image-acquisition software. The sample was imaged using a silicon tip (MSNL; Bruker) with a nominal radius of approximately 2 nm mounted on a silicon nitride cantilever with a spring constant of 0.03 n m−1. Measurement and analysis of AFM images were performed with SPIP software (Image Metrology). Prior to analyses, individual raw data images were improved by background subtraction and noise removal (uniformly over the entire image) according to the SPIP software manual (Image Metrology).
Supplemental Data
The following supplemental materials are available.
Supplemental Figure S1. Reference height level from mica surface.
Supplemental Figure S2. Reference structure and dimensions for stromal protruding domain of PSI.
Supplemental Figure S3. Photosynthetic complexes present in FPLC fractions.
Supplemental Figure S4. Reference structure and dimensions for PSII-OEC.
Supplemental Figure S5. Schematics of AFM apparatus.
Supplemental Figure S6. Characterization of particles from single membranes in grana preparations using tapping mode.
Supplemental Table S1. Summary of physical dimensions determined from the AFM images.
Supplemental Table S2. Comparison of the PSII distribution between freeze-fracture electron microscopy and AFM analysis.
Supplemental Table S3. Calculated protein packing areal densities.
ACKNOWLEDGMENTS
We thank Shai Saroussi for help with FPLC column preparation and detergent solubilization of membranes and Jon Nield and Helmut Kirchhoff for updated information on PSII-OEC subunit assignments.
Glossary
- OEC
oxygen-evolving complex
- cyt b 6 f
cytochrome b 6 f complex
- cryo-EM
cryo-electron microscopy
- TEM
transmission electron microscopy
- AFM
atomic force microscopy
- CM-AFM
contact mode atomic force microscopy
- 3-D
three-dimensional
- cryo-TEM
cryo-transmission electron microscopy
- α-DM
n-dodecyl-α,d-maltoside
LITERATURE CITED
Author notes
This work was supported by the U.S. Department of Energy, Office of Science, Basic Energy Sciences (grant no. DE–SC0001060 to F.B.P. and A.R.G.), the National Science Foundation (grant no. MCB–0951094 to A.R.G.), and the Development and Promotion for Science and Technology Talents Project, Royal Thai Government (to W.P.).
These authors contributed equally to the article.
Present address: Applied Materials, Inc., 3050 Bowers Avenue, Santa Clara, CA 95054.
Address correspondence to [email protected].
The author responsible for distribution of materials integral to the findings presented in this article in accordance with the policy described in the Instructions for Authors (www.plantphysiol.org) is: Arthur R. Grossman ([email protected]).
W.P. and Z.H. designed, set up the equipment, and performed the experiments to optimize grana membrane isolations and imaging; Z.H. collected the data and W.P. processed and analyzed the data; T.M.W. and M.L.H. performed biochemical characterizations of the membranes; K.S., R.N.F., and J.P.D. provided important discussions that helped to shape the final article; A.R.G. and F.B.P. directed the work; W.P. and A.R.G. performed most of the writing.
Articles can be viewed without a subscription.
